d1 0950 big data in healthcare hongkong2016
TRANSCRIPT

Using Big Data to Improve Clinical Care
David W. Bates, MD, MSc Chief, Division of General Internal Medicine, Brigham and Women’s
Hospital, Boston, MA
Overview
• Backdrop
• What are big data and why are they important?
• Big data and clinical care
– Care improvement—key domains
• What one institution is doing
• Conclusions
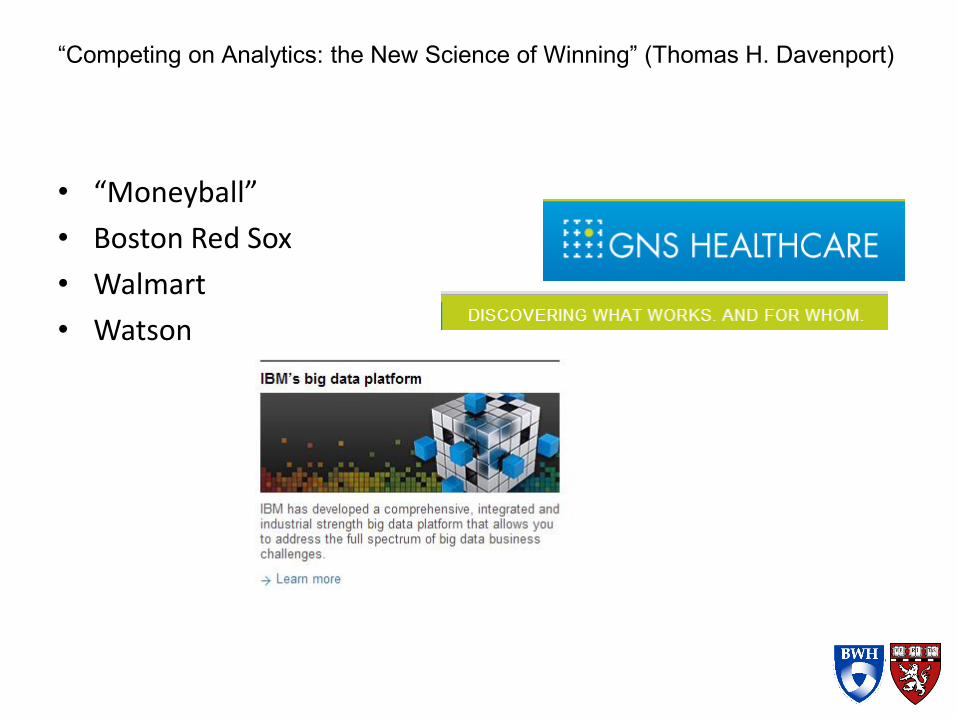
“Competing on Analytics: the New Science of Winning” (Thomas H. Davenport)
• “Moneyball”
• Boston Red Sox
• Walmart
• Watson

Hospitals attesting to Meaningful Use, through June 2013
0%
10%
20%
30%
40%
50%
60%
70%
80%A
pr-
11
May
-11
Jun
-11
Jul-
11
Au
g-1
1
Sep
-11
Oct
-11
No
v-1
1
Dec
-11
Jan
-12
Feb
-12
Mar
-12
Ap
r-1
2
May
-12
Jun
-12
Jul-
12
Au
g-1
2
Sep
-12
Oct
-12
No
v-1
2
Dec
-12
Jan
-13
Feb
-13
Mar
-13
Ap
r-1
3
May
-13
Jun
-13
Perc
ent
of
ho
spit
als
4 Note: Large = 400+ staffed beds; Medium = 100-399 staffed beds; Small = <100 staffed beds. Rural = non-metropolitan; Urban = metropolitan. See Data Sources and Definitions slides for more details.
Medium
CAH
Small Rural Large
Small Urban

Big Data = Really Big…
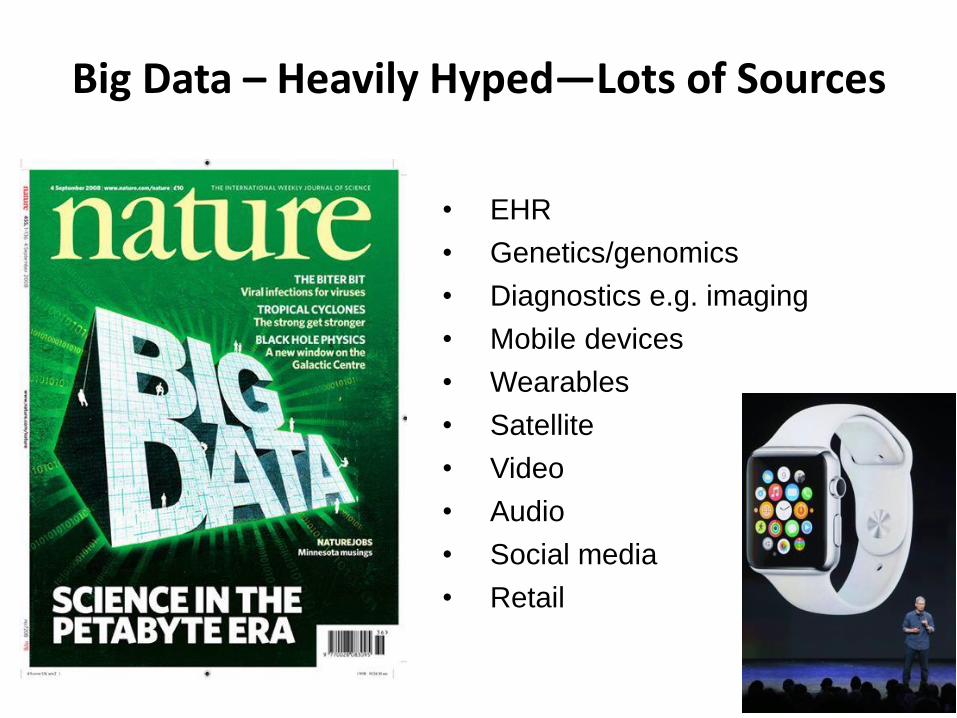
Big Data – Heavily Hyped—Lots of Sources
• EHR
• Genetics/genomics
• Diagnostics e.g. imaging
• Mobile devices
• Wearables
• Satellite
• Video
• Audio
• Social media
• Retail
Implications
• Lots of electronic clinical data now available – Inside hospital
– Outside hospital
• Natural language processing techniques have come of age
• Many other data sources to link to – Genetic, genomic
– Social
– Mobile
Some “Big Data” Concepts
• Data warehouse – Data marts
• Data lakes
• Data cleanliness
• Data mining – Machine learning
• Simpler vs. more complex algorithms
• Validation

Six Use Cases:
• High-cost patients
• Readmissions
• Triage
• Decompensation
• Adverse events
• Treatment optimization
Big Data in Clinical Care

High-Cost Patients
• About 5% of patients account for 50% of spending – First step in managing population is identifying this
group
• Need to include data about mental health, socioeconomic status, marital and living status
• Identification of specific actionable needs and gaps – Can make managing these patients much more cost-
effective
iCMP Claims-Based Approach • Uses LACE to risk stratify
• Claims data from past 12 months
• Clinical conditions from a list of ~30 are categorized as high, moderate or low acuity
• Combinations of conditions from each category determine level of clinical complexity
• Hospitalizations, ER visits and other types of utilization trigger inclusion

Population
• About 3000 patients currently
• Majority female (61%)
• Elderly (mean age 71, range 21-102 years)
• 32% with a mental health diagnosis
• An average of 17 medications per patient
• PMPM ~$2000
• 2-4 times higher than average
• Hospital admissions account for > 50% of costs

iCMP IT Infrastructure • Patient registry
– Notification of admissions, ER visits
• EHR tools
– iCMP icon to encourage communication
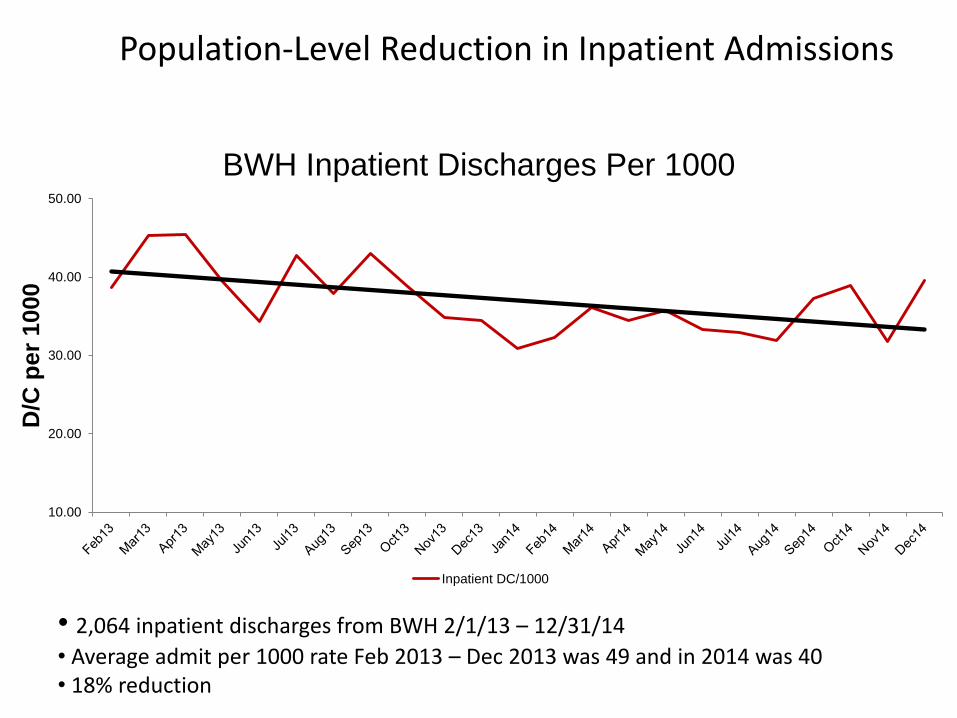
Population-Level Reduction in Inpatient Admissions
• 2,064 inpatient discharges from BWH 2/1/13 – 12/31/14
• Average admit per 1000 rate Feb 2013 – Dec 2013 was 49 and in 2014 was 40 • 18% reduction
10.00
20.00
30.00
40.00
50.00
D/C
per
1000
BWH Inpatient Discharges Per 1000
Inpatient DC/1000

Readmissions • CMS has strongly incentivized reducing their
frequency
• Should use an algorithm to predict frequency
• Key differentiators:
– Tailoring intervention to individual patient
– Ensuring that patients get intended intervention
– Monitoring specific patients after discharge
– Ensuring low rate flagged for intervention to patients experiencing a readmission

Triage
• Estimating risk of complications—at admission, evaluation, transfer
– Need detailed guideline that clarifies how the algorithm will inform care
• Examples
– Evaluating newborns for early onset sepsis
– Emergency department composite scores to predict decompensation
Decompensation
• Monitoring patients especially outside ICUs
• Can track many parameters with “wearables” or even devices that sit between mattress and bed
• In one trial a device that measured pulse, respiratory rate and movement reduced number of subsequent ICU days by 47% (Brown, Am J Med 2014)
• Use of multiple parameters simultaneously, especially in ICUs

EarlySense: Continuous Patient Supervision on General Care Floors
LCD monitor Nurse’s phone Central Nurse’s Station Bed side monitor
Full floor overview at a glance
Real time alerts to nurses &
supervisors + reports on team
performance
Nurse / physician communication
support
Facilitation of critical thinking
by nurse

19
Continuous Monitoring in an Inpatient Medical-Surgical Unit: A Controlled Clinical Trial
Demographics and Clinical Baseline Information for The Study Unit
Control Unit Intervention (Study) Unit
Baseline (Pre)
Control (Post)
P Value Baseline (Pre)
Intervention (Post)
P Value
Patients, n 1535 2361 1433 2314
Age, mean (SD) 49.8 (19.6) 49.6
(20.3) 0.76 49.5 (19.6) 49.3 (19.9) 0.73
Males % 46.2 45.0 0.57 44.5 48.9 0.04
Acuity Level*, mean (SD)
2.9 (0.4) 2.9 (0.4) 0.36 2.8 (0.4) 2.8 (0.4) 0.70
Charlson score, mean (SD)
1.8 (2.4) 1.9 (2.4) 0.62 1.8 (2.3) 1.8 (2.4) 0.61
Harvey Brown, MD,a Jamie Terrence, RN,a Patricia Vasquez, RN, BSN,a David W. Bates, MD, MSc,b,c
Eyal Zimlichman, MD, MSc b,c. The American Journal of Medicine. March 2014, Volume 127, Number 3 a. California Hospital Medical Center, a member of Dignity Health, Los Angeles; b. The Center for Patient Safety Research and Practice, Division of General Internal Medicine, Brigham and Women’s Hospital, Boston, Mass; c. Harvard Medical School, Boston, Mass.
* Acuity level based on internal acuity scale of 1 to 4 (4 being the highest acuity) Total # of patients: 7643
20
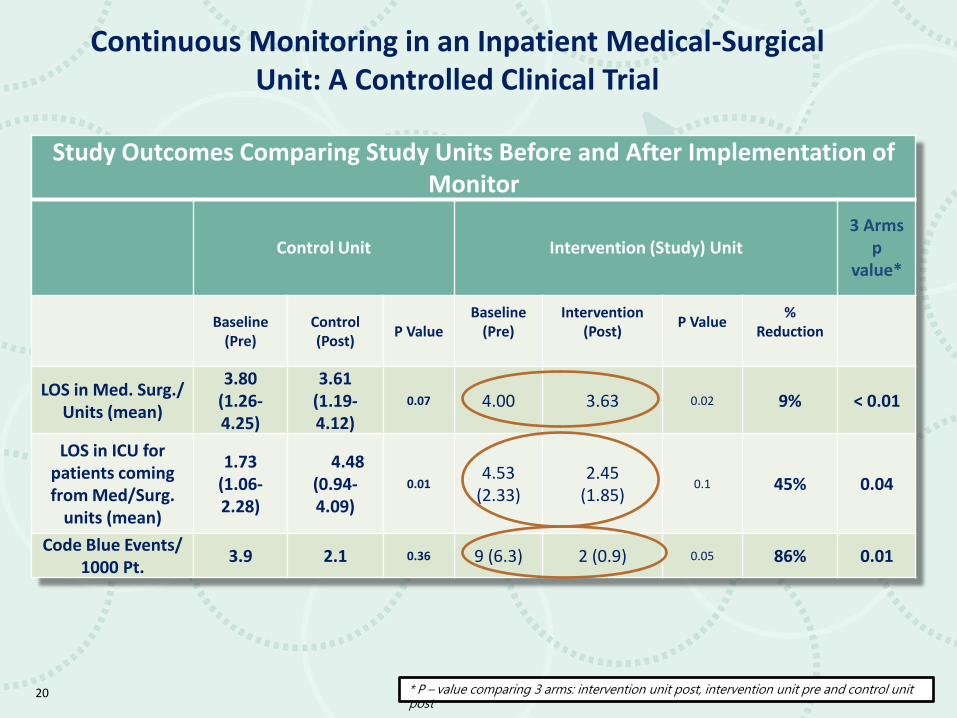
Continuous Monitoring in an Inpatient Medical-Surgical Unit: A Controlled Clinical Trial
Study Outcomes Comparing Study Units Before and After Implementation of Monitor
Control Unit Intervention (Study) Unit 3 Arms
p value*
Baseline (Pre)
Control (Post)
P Value Baseline
(Pre)
Intervention (Post)
P Value
% Reduction
LOS in Med. Surg./ Units (mean)
3.80 (1.26-4.25)
3.61 (1.19-4.12)
0.07 4.00 3.63 0.02 9% < 0.01
LOS in ICU for patients coming from Med/Surg.
units (mean)
1.73 (1.06-2.28)
4.48 (0.94-4.09)
0.01 4.53
(2.33) 2.45
(1.85) 0.1 45% 0.04
Code Blue Events/ 1000 Pt.
3.9 2.1 0.36 9 (6.3) 2 (0.9) 0.05 86% 0.01
* P – value comparing 3 arms: intervention unit post, intervention unit pre and control unit post

Alert Frequency and Positive Predictive Value
• EarlySense had 2.2 alerts per 100 recording hours
– 50% resulted in nurse action
• Pulse oximetry, telemetry, cardiovascular monitors have 161-730 alerts per 100 hours
– Much lower proportions result in action

Economic Analysis of Smart Monitor
• Modeled only ICU length of stay and pressure ulcers
5-year ROI Annual
Benefit Breakeven
Base Case $9.1 million $2.1 million 0.5 years
Conservative $3.3 million $0.66 million 0.75 years
Slight, Critical Care Medicine 2014

Adverse Events
• Renal failure
– Changes in renal function often apparent before decompensation
• Infection
– Combinations of vital signs and related parameters can help identify—e.g. heart rate variability in very low birthweight infants (Moorman, J Pediatr 2011)
• Adverse drug events
– Which patients may experience, using genetic/genomic and clinical information

Diseases Affecting Multiple Organ Systems
• Chronic conditions are extremely costly
• Predicting trajectory could enable caregivers to target complex and expensive therapies to patients who would benefit most, e.g. with autoimmune conditions
• Registries (such as PCORnet) may also be leveraged because they hold longitudinal data
One Specific App—Ginger.io
• Uses big data techniques to improve mental health
• Collects data from smartphone about use of texting, phone, location to predict how you are feeling
– Development of depression closely correlated with patterns of use
– Enables providers to intervene

Evolution of Analytics at BWH • Current State
– BWH has a strong culture of leveraging data for decision-making • Balanced Scorecard • BWPO/PCHI data • Other adhoc data and analysis throughout BWHC
– Two-dimensional reporting • Canned reports on what happened
– Some interactive analysis capabilities
• Future State – Predictive Modeling
• Leverage internal and external environment data to predict the future • Appropriate staffing levels given future state • Predict margin rates based on market shifts
– Complex Statistical Analysis • Identify practice patterns and variations
26
Continue to improve ability to
obtain and analyze data more efficiently
Start to leverage advanced
techniques to reduce cost and
improve outcomes
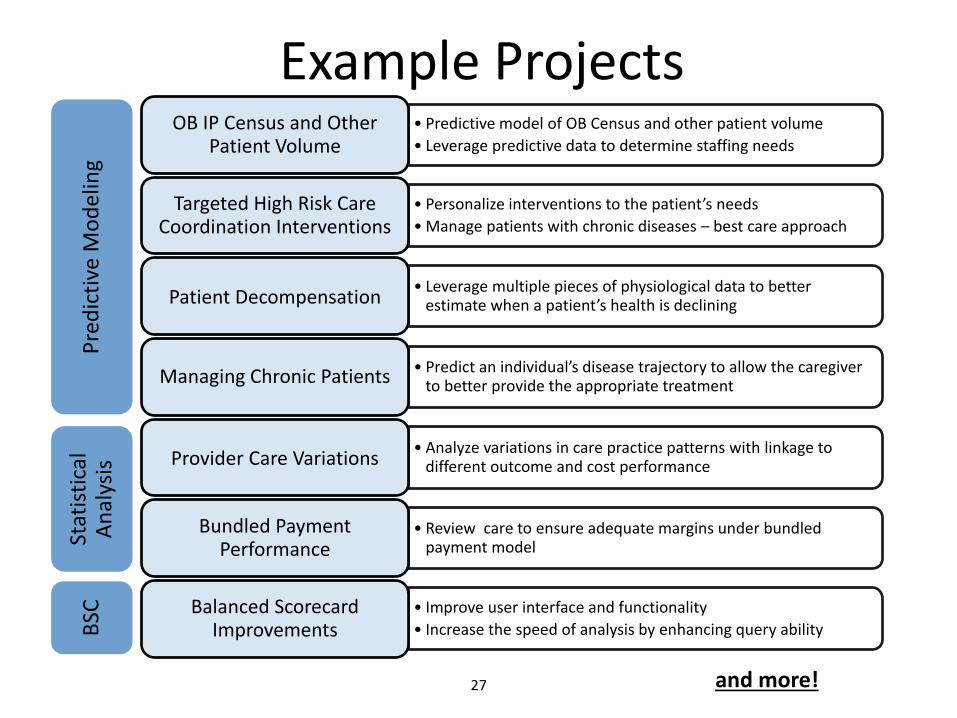
Example Projects
27
• Predictive model of OB Census and other patient volume
• Leverage predictive data to determine staffing needs
OB IP Census and Other Patient Volume
• Personalize interventions to the patient’s needs
• Manage patients with chronic diseases – best care approach
Targeted High Risk Care Coordination Interventions
• Leverage multiple pieces of physiological data to better estimate when a patient’s health is declining Patient Decompensation
• Predict an individual’s disease trajectory to allow the caregiver to better provide the appropriate treatment Managing Chronic Patients
• Analyze variations in care practice patterns with linkage to different outcome and cost performance Provider Care Variations
• Review care to ensure adequate margins under bundled payment model
Bundled Payment Performance
• Improve user interface and functionality
• Increase the speed of analysis by enhancing query ability
Balanced Scorecard Improvements
and more!
Pre
dic
tive
Mo
del
ing
Stat
isti
cal
An
alys
is
BSC
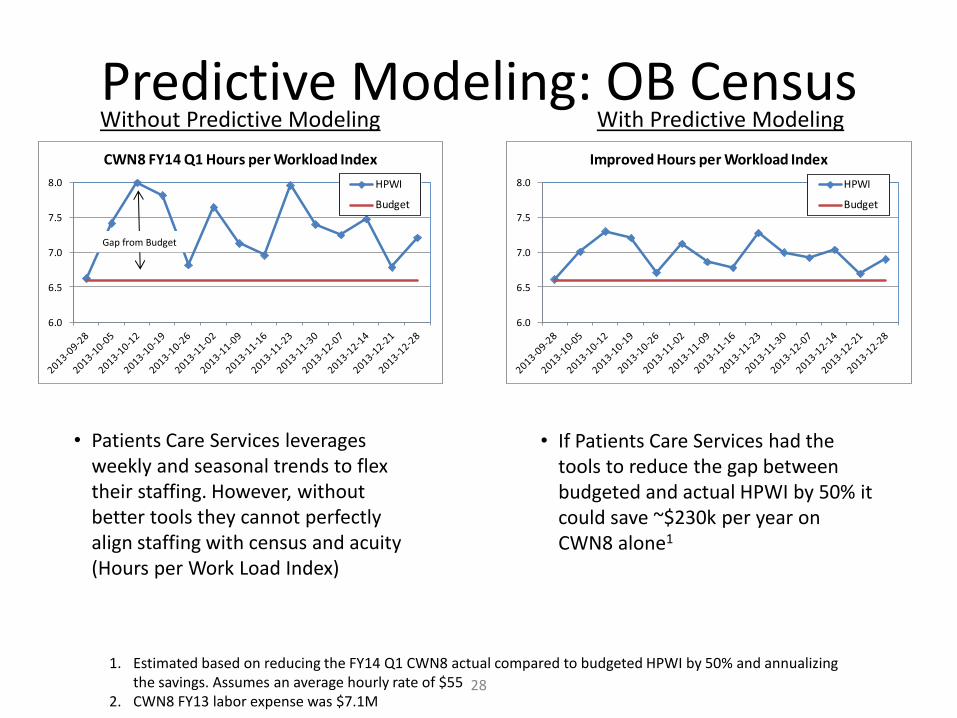
Predictive Modeling: OB Census
28
• Patients Care Services leverages weekly and seasonal trends to flex their staffing. However, without better tools they cannot perfectly align staffing with census and acuity (Hours per Work Load Index)
1. Estimated based on reducing the FY14 Q1 CWN8 actual compared to budgeted HPWI by 50% and annualizing the savings. Assumes an average hourly rate of $55
2. CWN8 FY13 labor expense was $7.1M
• If Patients Care Services had the tools to reduce the gap between budgeted and actual HPWI by 50% it could save ~$230k per year on CWN8 alone1
Without Predictive Modeling With Predictive Modeling
6.0
6.5
7.0
7.5
8.0
CWN8 FY14 Q1 Hours per Workload Index
HPWI
Budget
Gap from Budget
6.0
6.5
7.0
7.5
8.0
Improved Hours per Workload Index
HPWI
Budget
Key Infrastructure
• Analytics tools
• Registries
• Monitoring devices
• Data warehouse (with marts)
The Role of Data and Analytics in Clinical Care Redesign
• Will be foundational in every care redesign effort – If we can do well, will be able to do much
more
• Already have a good picture of care in hospital with Balanced Scorecard – But little data about outside hospital
– Planning to make substantial investment in this area

Conclusions
• Clinical data are now nearly ubiquitously available – Levels of adoption of about 80% in hospitals and
clinical setting
• Most organizations haven’t yet figured out how best to leverage these data – Every organization will need to invest
• “Big data” approaches will result in many insights both in research and clinical care
• These are some of the examples likely to bear fruit early on
• Novel sources are most likely to provide marginal improvement—social, mobile
31

Predictions/Implications
• This could be as transformative as the Internet
• Will have many privacy implications
– True privacy may no longer be possible
– Need to get appropriate safeguards in place
• “Killer app”—Google Maps
• Future will involve linking multiple of these—social, mobile, big data, cloud