d100 - technical report 2: results from the 4 ceos tir frm ... · ceos tir frm field radiometer...
TRANSCRIPT

NPL - Commercial
Fiducial Reference Measurements for validation of Surface Temperature from Satellites (FRM4STS) ESA Contract No. 4000113848_15I-LG
D100 - Technical Report 2: Results from the 4th CEOS TIR FRM Field Radiometer Laboratory Inter-comparison Exercise Part 2 of 4: Laboratory comparison of radiation thermometers
JUNE 2017
Approval/Acceptance
ESA Craig Donlon Technical Officer
NPL Andrew Brown Project Manager
Signature Signature

NPL REPORT ENV 14
2016 comparison of IR brightness temperature measurements in support of satellite validation. Part 2: Laboratory comparison of radiation thermometers. I. Barker-Snook, E. Theocharous and N. P. Fox
June 2017


NPL Report ENV 14
2016 comparison of IR brightness temperature measurements in support of satellite validation. Part 2: Laboratory comparison of radiation
thermometers.
I. Barker Snook, E. Theocharous and N. P. Fox
Environmental Division
Abstract
Under the auspices of CEOS a comparison of terrestrial based infrared (IR) radiometric instrumentation
used to support calibration and validation of satellite borne sensors with emphasis on sea/water/land
surface temperature was completed at NPL during June and July 2016. The objectives of the 2016
comparison were to establish the “degree of equivalence” between terrestrially based IR Cal/Val
measurements made in support of satellite observations of the Earth’s surface temperature and to
establish their traceability to SI units through the participation of National Metrology Institutes (NMIs).
During the 2016 comparison, NPL acted as the pilot laboratory and provided traceability to SI units
during laboratory comparisons. Stage 1 consisted of Lab comparisons, and took place at NPL during the
week starting on 20th June 2016. This Stage involved laboratory measurements of participants’
blackbodies calibrated using the NPL reference transfer radiometer (AMBER) and the PTB infrared
radiometer, while participants’ radiometers were calibrated using the NPL ammonia heat-pipe reference
blackbody. Stage 2 took place at Wraysbury reservoir during the week starting on 27th June 2016 and
involved field measurements of the temperature of the surface of the water. Stage 2 also included the
testing of the same radiometers alongside each other, completing direct daytime and night-time
measurements of the surface temperature of the water. Stage 3 took place in the gardens of NPL during
the week staring on 4th July 2016 and involved field measurements of the temperature of the surface of
a number of solid targets. Stage 3 included the testing of the same radiometers alongside each other,
completing direct daytime and night-time measurements of the surface temperature of targets, including
short grass, clover, soil, sand, gravel and tarmac/asphalt. This report provides the results of Stage 1,
together with uncertainties as provided by the participants, for the comparison of the participants’
radiometers. During the 2016 comparison, all participants were encouraged to develop uncertainty
budgets for all measurements they reported. All measurements reported by the participants, along with
their associated uncertainties, were analysed by the pilot laboratory and are presented in this report.

NPL Report ENV 14

NPL Report ENV 14
NPL Management Ltd, 2017
ISSN: 2059-6030
National Physical Laboratory Hampton Road, Teddington, Middlesex, TW11 0LW
Extracts from this report may be reproduced provided the source is acknowledged and the extract is not taken out of context.
Approved on behalf of NPLML by Teresa Goodman, Earth Observation, Climate and
Optical Group


NPL Report ENV 14
Contents
1 INTRODUCTION ............................................................................................................. 1
2 ORGANISATION OF THE COMPARISON ................................................................ 1
2.1THE AMMONIA HEAT-PIPE BLACKBODY ...................................................... 2
2.2MEASUREMENT PROCEDURE ........................................................................... 3
3 PARTICIPANTS’ RADIOMETERS AND MEASUREMENTS ................................. 4
3.1 MEASUREMENTS MADE BY VALENCIA UNIVERSITY .............................. 4
3.1.1 Description of the Radiometer and Route of Traceability .................................................. 4 3.1.2 Uncertainty Contributions Associated with UoV’s measurements at NPL ........................ 6 3.1.3 Comparison of UoV radiometers to the NPL reference blackbody .................................... 8
3.2 MEASUREMENTS MADE BY BALL AEROSPACE ....................................... 23
3.2.1 Description of radiometer and route of traceability .......................................................... 23 3.2.2 Uncertainty contributions associated with Ball Aerospace’s radiometer ......................... 24 3.2.3 Comparison of BESST radiometer to NPL reference blackbody ..................................... 25
3.3 MEASUREMENTS MADE BY KIT .................................................................... 27
3.3.1 Description of radiometer and route of traceability ............................................................... 27 3.3.2 Uncertainty Contributions associated KIT’s measurements at NPL ...................................... 28 3.3.3 Comparison of KIT Heitronics KT15.85 IIP to the NPL reference blackbody ................ 29
3.4 MEASUREMENTS MADE BY ONERA ............................................................. 33
3.4.1 Description of radiometer and route of tracibility ............................................................ 33 3.4.2 Uncertainty contributions associated with ONERA’s measurements at NPL .................. 33 3.4.3 Comparison of radiometer to the NPL reference blackbody ............................................ 35
3.5 MEASUREMENTS MADE BY CSIRO ............................................................... 52
3.5.1 Description of Radiometer and route of traceability Make and type of Radiometer: ...... 52 3.5.2 Uncertainty contributions associated with CSIRO’s measurements at NPL .................... 53 3.5.3 Comparison of CSIRO ISAR 5D to the NPL reference blackbody .................................. 53
3.6 MEASUREMENTS MADE BY STFC RAL ........................................................ 57
3.6.1 Description of the radiometer and route of tracibility ...................................................... 57 3.6.2 Uncertainty contributions associated with STFC RAL’s measurements at NPL ............. 59 3.6.3 Comparison of RAL’s SISTeR to the NPL reference blackbody ..................................... 59
3.7 MEASUREMENTS MADE BY SOUTHAMPTON UNIVERSITY.................. 64
3.7.1 Description of radiometer and route of traceability .......................................................... 64 3.7.2 Uncertainty contributions associated with UoS’ measurements at NPL .......................... 64 3.7.3 Comparison of UoS’ ISAR to NPL reference blackbody ................................................. 65
3.8 MEASUREMENTS MADE BY DMI ................................................................... 69
3.8.1 Description of radiometers and route of traceability ........................................................ 69 3.8.2 Uncertainty contributions associated with DMI’s measurements at NPL ........................ 70 3.8.3 Comparison of DMI’s radiometers to the NPL reference blackbody. .............................. 71 3.8.4 Additional comments from DMI regarding the radiometer lab comparison .................... 77
3.9 MEASUREMENTS MADE BY OUC, QINGDAO ............................................. 77
3.9.1 Description of radiometers and route of traceability ........................................................ 77 3.9.2 Uncertainty contributions associated with OUC’s measurements at NPL ....................... 79 3.9.3 Comparison of OUC’s radiometers to the NPL reference blackbody .............................. 80

NPL Report ENV 14
8
3.10 MEASUREMENTS MADE BY GOTA .............................................................. 89
3.10.1 Description of radiometer and route of traceability .......................................................... 89 3.10.2 Uncertainty contributions associated with GOTA’s measurements at NPL ..................... 91 3.10.3 Comparison of CE312-2 to NPL reference blackbody ..................................................... 92
3.11 MEASUREMENTS MADE BY RSMAS, UNIVERSITY OF MIAMI ........... 99
3.11.1 Description of radiometer and route of traceability .......................................................... 99 3.11.2 Uncertainty contributions associated with RSMAS’ measurements at NPL .................. 100 3.11.3 Comparison of the RSMAS radiometer to NPL reference blackbody ............................ 102
4 SUMMARY OF THE RESULTS ................... ERROR! BOOKMARK NOT DEFINED. 5 DISCUSSION ................................................... ERROR! BOOKMARK NOT DEFINED.
5.1 FIELD-OF-VIEW (FOV) ISSUES ...................................................................... 115
5.2 WATER CONDENSATION AND ICING OF CAVITY .................................. 116
5.3 CALIBRATION RANGE OF RADIOMETERS ............................................... 116
5.4 LESSONS LEARNT ............................................................................................. 116
6 REFERENCES .............................................................................................................. 117

NPL Report ENV 14
1
1 INTRODUCTION
The measurement of the Earth’s surface temperature and, more fundamentally, its temporal and
spatial variation, is a critical operational product for meteorology and an essential parameter
for climate monitoring. Satellites have been monitoring global surface temperature for some
time. However, it is essential for long-term records that such measurements are fully anchored
to SI units.
Field-deployed infrared radiometers1 currently provide the most accurate surface-based
measurements which are used for calibration and validation of Earth observation radiometers.
These radiometers are in principle calibrated traceably to SI units, generally through a
blackbody radiator. However, they are of varying design and are operated by different teams
in different parts of the globe. It is essential for the integrity of their use, that any differences
in their measurements are understood, so that any potential biases are removed and are not
transferred to satellite sensors.
A comparison (under the auspices of CEOS) of terrestrial based infrared (IR) radiometric
instrumentation used to support calibration and validation of satellite borne sensors with
emphasis on sea/water surface temperature was completed in Miami in 2001 (Barton et al.,
2004) (Rice et al., 2004) and at NPL and Miami in 2009 (Theocharous and Fox, 2010)
(Theocharous et al., 2010). However, seven years had passed, and as many of the satellite
sensors originally supported were nearing the end of their life, a similar comparison was
repeated in 2016. The objectives of the 2016 comparison were to establish the “degree of
equivalence” between terrestrially based IR Cal/Val measurements made in support of satellite
observations of the Earth’s surface temperature and to establish their traceability to SI units
through the participation of NMIs.
2 ORGANISATION OF THE COMPARISON
During the 2016 comparison, NPL acted as the pilot laboratory and, with the aid of PTB,
provided traceability to SI units during the laboratory comparisons at NPL. NPL was supported
with specialist application advice from University of Southampton, RAL and KIT. The 2016
comparison consisted of three stages. Stage 1 took place at NPL in June 2016 and involved
laboratory measurements of participants’ blackbodies calibrated using the NPL reference
transfer radiometer (AMBER) (Theocharous et al., 1998) and the PTB infrared radiometer,
while the performance of the participants’ radiometers was compared using the NPL ammonia
heat-pipe reference blackbody. The performance of 8 blackbodies and 19 radiometers operating
on 24 measurement channels was compared during Stage 1. Stage 2 took place on the platform
which is located in the middle of Wraysbury reservoir in June/July 2016. The performance of
9 radiometers operating on 14 measurement channels was compared during Stage 2. Stage 2
included the testing of the participating radiometers alongside each other, completing direct
daytime and night-time measurements of the skin temperature of the reservoir water. Stage 3
took place in the gardens of NPL during the week starting on 4th July 2016 and involved field
measurements of the temperature of the surface of a number of solid targets. Stage 3 included
the testing of the same radiometers alongside each other, completing direct daytime and night-
time measurements of the surface temperature of targets, including short grass, clover, soil,
1 This report describes the comparison of instruments which are referred to by participants as “radiometers”. However,
radiometers generally measure and report radiometric parameters in radiometric units (W, Wm-2, etc.). The instruments dealt
with here measure temperature (in units of degrees C units or K) so they are thermometers or “radiation thermometers”.
However, in view of the common usage of the terminology for this application, this report will continue to use the term
“radiometer”.

NPL Report ENV 14
2
sand, gravel and tarmac/asphalt.
This report provides the results, together with uncertainties as provided by the participants, of
the radiometer measurements of seven fixed temperatures as performed in one of NPL’s
temperature-controlled laboratories during the week beginning 20th June 2016. The laboratory
comparison of the participants’ blackbodies, as measured by the NPL AMBER radiometer and
the PTB infrared radiometer, as well as the WST comparison at Wraysbury reservoir and the
LST comparison that took place on the NPL gardens are being presented in other reports
(Theocharous et al. 2017, Theocharous et al. 2017a, Barker Snook et al. 2017).
During the 2016 comparison, all participants were encouraged to develop uncertainty budgets
for all measurements they reported. In order to achieve optimum comparability, lists containing
the principal influence parameters for the measurements were provided to all participants. All
measurements reported by the participants, along with their associated uncertainties, were
analysed by the pilot laboratory and are presented in this report.
2.1 THE AMMONIA HEAT-PIPE BLACKBODY
The NPL ammonia heat-pipe reference blackbody (Chu and Machin, 1999) uses a heat-pipe to
control the blackbody cavity temperature. This resulted in negligible temperature gradients
along the length of the cavity. The length of the ammonia heat-pipe blackbody cavity was
300 mm, and it had a 75 mm internal diameter with a 120o cone angle at the end wall. The
blackbody cavity was coated with a high-emissivity Nextel black paint. The emissivity of the
blackbody cavity was calculated using the series integral method (Berry, 1981). The effective
emissivity of the cavity was estimated to be 0.9993 assuming an emissivity of 0.96 for the
Nextel black coating (Betts, et al., 1985).
The temperature of the blackbody cavity was obtained from an ITS-90 calibrated platinum
resistance thermometer (PRT) which was inserted into a well of 150 mm depth in the rear of
the blackbody cavity. The front of the reference source contained a circular support which
allowed aperture plates with different diameters to be positioned in front of the blackbody
cavity.
The ammonia heat-pipe blackbody could be operated with a 70 mm diameter aperture in the
front of the blackbody. However, during the 2016 comparison, a 50 mm diameter aperture was
used in front of the blackbody cavity to improve its emissivity characteristics. Furthermore,
there was a length of foam insulation located between the front aperture and the front of the
heat pipe. The foam insulation had an aperture of approximately the same diameter as the
ammonia heat-pipe aperture (75 mm diameter). The depth of the foam insulation was
approximately 40 mm. There was also a 35 mm spacing between the aperture and the foam
which meant that there was a total distance of approximately 75 mm from the front of the
aperture to the actual blackbody cavity. This, in turn, meant that if radiometers with a large field
of view were measuring the reference blackbody, then there was a possibility that they could
be seeing the foam rather than the inside of the blackbody cavity, even when they are placed
right up against the front of the blackbody casing. While participants were free to position and
align their blackbodies in front of the reference blackbody, most of the participants placed their
radiometers right up against the reference blackbody, in order to ensure that blackbody cavity
overfilled the entire FoV of their radiometers.

NPL Report ENV 14
3
The temperature of the blackbody cavity was controlled by a cylindrical heat exchanger which
fitted closely around the blackbody cavity. Heat transfer fluid was circulated through a
continuous 6 mm wide helical groove which was machined in the surface of the internal
cylinder. Full information on the ammonia heat-pipe blackbody can be found elsewhere (Chu
and Machin, 1999).
At sub-ambient temperatures i.e. at temperatures below the Dew point, the blackbody cavity
was purged with dry nitrogen, in order to prevent water from condensing on the internal surfaces
of the cavity which could damage the internal black coating and change the effective emissivity
of the cavity. The dry nitrogen gas was fed into the blackbody cavity from the rear. Its
temperature was iso-thermalised within the feed tube which was embedded within the wall of
the heat pipe. The gas was introduced into the front of the blackbody cavity via a gas distribution
ring consisting of 12 holes of 1.5 mm diameter. In order to reduce the effect of convection
currents from the surroundings, the aperture of the blackbody cavity was open whilst
measurements were being made but was blocked at all other times with an insulation plug.
2.2 MEASUREMENT PROCEDURE
The reference blackbody was set at a certain temperature and enough time was allowed for its
cavity temperature to stabilise to the new setting. Once the operating temperature had been
selected, the system required 30 minutes to reach temperatures greater than 0 oC but required
3 hours to reach temperatures on the region of −30 oC. Once the set-point had been reached, the
blackbody required another 0.5 to 1 hour to stabilize at the new temperature.
Each participant was allowed a maximum period of 30 minutes to position his radiometer in
front of the reference blackbody, align it to the aperture of the blackbody and take
measurements at that particular temperature setting. The order with which radiometers
completed the measurements at the beginning of the comparison depended on the readiness of
the radiometers of the different participants to do measurements at that particular time. Towards
the end of the comparison, participants were allocated 30 minute periods, according to tables
which were circulated to all participants. Participants with more than one radiometer were asked
to arrange for the 30 minute measurement period to be shared between all their measuring
radiometers.
The temperature of the reference blackbody was continuously logged using UTC and the
participants were asked to use the same time reference. This allowed the comparison of the
measurements of each participant with the corresponding measurements of the reference
blackbody.
Participants were asked to provide their measurements in spreadsheets. The top of each
spreadsheet indicated the date on which the measurements shown in the spreadsheet were
performed. Each spreadsheet consisted of a minimum of three columns. The first column
indicated time of the measurement, in a UTC format. The second column gave the brightness
temperature of the reference blackbody, as measured by the participant, at the time indicated in
the first column. The third column provided the combined (total) uncertainty of the
measurement of the brightness temperature measured by the participant corresponding to the
measurement indicated in the second column.
Participants were also encouraged to develop and provide full uncertainty budgets for their
measurements. In order to help participants to do this, tables were provided listing the
NPL Report ENV 14
4
parameters which were likely to contribute to the uncertainty of the measurement. Some
participants provided completed tables, providing extensive information on each uncertainty
contribution. Other participants provided considerably less information on their uncertainty
budgets.
3 PARTICIPANTS’ RADIOMETERS AND MEASUREMENTS
Section 3 gives brief descriptions of the radiometers participating in the 2016 laboratory
radiometer comparison at NPL and presents the results of the measurements which were
completed by the radiometers during these comparisons, along with the corresponding
combined uncertainty values which were provided by the participants. Section 3 also provides
the uncertainty budgets of the measurements using the participating radiometers, as provided
by the participants. In some cases the level of detail provided by participants in the uncertainty
budgets of their measurements is fairly limited and not ideal. However, whatever was provided
by the participants is included in this report, along with a summary of the results for each
participant for each stage of the comparison.
3.1 MEASUREMENTS MADE BY VALENCIA UNIVERSITY
Dept. of Earth Physics and Thermodynamics, University of Valencia.
50, Dr. Moliner. ES-46100, Burjassot (Valencia), Spain
Contact Names: César Coll and Raquel Niclòs
Email: [email protected] , [email protected]
3.1.1 Description of the Radiometer and Route of Traceability
Make and type of the Radiometer. CIMEL Electronique CE312-2, six spectral bands (two
units)
Outline Technical description of the instrument. Type of detector used by the radiometer:
thermopile, operating at ambient temperature. Six spectral bands: B1 8.0-13.3 μm, B2 10.9-
11.7 μm, B3 10.2-11.0 μm, B4 9.0-9.3 μm, B5 8.5-8.9 μm, and B6 8.3-8.6 μm. Broad band:
Germanium window and zinc sulphide filters. Narrow bands: interference filters. Field of
view: 10º. The instrument has a built-in radiance reference made of a concealable gold-coated
mirror which enables comparison between the target radiance and the reference radiation from
inside the detector cavity. The temperature of the detector is measured with a calibrated PRT,
thus allowing compensation for the cavity radiation. The relevant outputs of the radiometer are
the detector temperature and the difference in digital counts between the signals from the target
and the detector cavity.
References for further information on the radiometers:
1. Sicard, M., Spyak, P. R., Brogniez, G., Legrand, M., Abuhassan, N. K., Pietras, C., and Buis,
J. P. (1999). Thermal infrared field radiometer for vicarious cross-calibration: characterization
and comparisons with other field instruments. Optical Engineering, 38 (2), 345-356.
2. M. Legrand, C. Pietras, G. Brogniez, M. Haeffelin, N. K. Abuhassan and M. Sicard (2000).
A high-accuracy multiwavelength radiometer for in situ measurements in the thermal infrared.
Part I: characterization of the instrument, J. Atmos. Ocean Techn., 17, 1203-1214.

NPL Report ENV 14
5
Establishment or traceability route for primary calibration including date of last
realisation and breakdown of uncertainty. The following error analysis is based on
laboratory measurements with the Landcal blackbody P80P (blackbody combined uncertainty
was 0.34 K; Appendixes B and E) on May 13-18, 2016, and estimates from the above
references. Blackbody measurements were taken at six fixed temperatures (0-50 ºC) in two
different runs with instrument realigning. The values reported below are typical values for all
blackbody temperatures considered for each band of each radiometer (units 1 and 2). The mean
values considering all bands of each radiometer are also given.
Type A
- Repeatability: Typical value of the standard deviation of 15 measurements at fixed blackbody
temperature without re-alignment of radiometer.
Unit 1 B1 B2 B3 B4 B5 B6 mean
K 0.01 0.04 0.04 0.06 0.06 0.08 0.05
%
(at 300 K)
0.002 0.012 0.012 0.019 0.019 0.025 0.015
Unit 2 B1 B2 B3 B4 B5 B6 mean
K 0.01 0.03 0.03 0.04 0.05 0.05 0.03
%
(at 300 K)
0.002 0.009 0.009 0.015 0.017 0.018 0.012
- Reproducibility: Typical value of difference between two runs of radiometer measurements
at the same black body temperature including re-alignment.
Unit 1 B1 B2 B3 B4 B5 B6 mean
K 0.08 0.10 0.08 0.06 0.09 0.05 0.08
%
(at 300 K)
0.027 0.033 0.025 0.021 0.029 0.018 0.026
Unit 2 B1 B2 B3 B4 B5 B6 mean
K 0.06 0.06 0.06 0.05 0.05 0.04 0.06
%
(at 300 K)
0.021 0.021 0.019 0.017 0.017 0.015 0.018
Total Type A uncertainty (RSS):
Unit 1 B1 B2 B3 B4 B5 B6 mean
K 0.08 0.11 0.08 0.09 0.10 0.09 0.09
%
(at 300 K)
0.028 0.035 0.028 0.029 0.035 0.031 0.031
Unit 2 B1 B2 B3 B4 B5 B6 mean
K 0.06 0.07 0.06 0.07 0.07 0.07 0.07
%
(at 300 K)
0.022 0.023 0.021 0.023 0.024 0.023 0.022
Type B
- Primary calibration: 0.34 K (estimation of the total uncertainty of the Landcal blackbody
P80P).

NPL Report ENV 14
6
- Linearity of radiometer: 0.06 K (Typical value for all bands in the temperature range 0-
40 ºC according to reference 2).
- Drift since last calibration: It has been corrected using the calibration measurements
performed with the Landcal blackbody P80P mentioned above. A linear correcting equation has
been derived for each band and radiometer, with the radiometer measured temperature and the
detector temperature as inputs. The uncertainty for this correction is the RSS of the typical
estimation uncertainty of the linear regression (0.05 K for unit 1 and 0.04 K for unit 2) and the
uncertainties resulting from the propagation of input temperature errors (standard deviations for
15 measurement at a fixed temperature) in the linear correcting equation. The resulting
uncertainty in the correction of calibration drift is 0.07 K for unit 1 and 0.05 K for unit 2.
- Ambient temperature fluctuations: The effect of ambient temperature fluctuations is
compensated in the CE312 radiometers by measuring the detector cavity temperature by means
of a calibrated PRT. The uncertainty in this process is the uncertainty of the internal PRT, which
is 0.04 K according to reference 2.
- Atmospheric absorption/emission: Negligible due to very short path length and radiometers
working in the atmospheric window.
Total Type B uncertainty (RSS): 0.35 K for both units 1 and 2.
Type A + Type B uncertainty (RSS): 0.37 K for unit 1 and 0.36 K for unit 2.
Operational methodology during measurement campaign. The Landcal Blackbody Source
P80P was set at six fixed temperatures (0-50 ºC) in two different runs. Enough time was allowed
for the blackbody to reach equilibrium at each temperature. Radiometers were aligned with the
blackbody cavity, and placed at a distance so that the field of view was smaller than the cavity
diameter. Standard processing (see references above) was applied to the radiometer readouts to
calculate the equivalent brightness temperature. Due to the radiometer responsivity drift with
time, a correction is applied depending on the difference between the measured brightness
temperature (Tm) and the detector temperature (Td):
Tc = Tm + a(Tm - Td) + b
where Tc is the corrected brightness temperature, and a and b are band-dependent coefficients
derived from linear regression from the calibration measurements at the six temperatures in the
two runs.
Blackbody usage (deployment), previous use of instrument and planned applications. Field measurements of land surface temperature and emissivity for validation of thermal
infrared products from satellite sensors.
3.1.2 Uncertainty Contributions Associated with UoV’s measurements at NPL
The tables below show the uncertainty breakdown for the measurement of the laboratory
radiometer comparison at NPL. The RMS total refers to the square root of the sum of the
squares of all the individual uncertainty terms.

NPL Report ENV 14
7
CE312-2 Unit 1
Uncertainty
Contribution Type A Type B
Uncertainty in
Value / %
Uncertainty in
Value /
(appropriate units)
Uncertainty in
Brightness
temperature/K
Repeatability of
measurement 0.015 0.05
Reproducibility of
measurement 0.026 0.08
Primary calibration 0.34
Linearity of radiometer 0.06
Drift since calibration 0.07
Ambient temperature
fluctuations 0.04
Atmospheric
absorption/emission
RMS total 0.09 K/0.031 % 0.37
CE312-2 Unit 2
Uncertainty
Contribution Type A Type B
Uncertainty in
Value / %
Uncertainty in
Value /
(appropriate units)
Uncertainty in
Brightness
temperature/K
Repeatability of
measurement 0.012 0.03
Reproducibility of
measurement 0.018 0.06
Primary calibration 0.34
Linearity of radiometer 0.06
Drift since calibration 0.05
Ambient temperature
fluctuations 0.04
Atmospheric
absorption/emission
RMS total 0.07 K/0.022 % 0.36

NPL Report ENV 14
8
3.1.3 Comparison of UoV radiometers to the NPL reference blackbody
3.1.3.1 Comparison of CE312-2 Unit 1 to the NPL reference blackbody
The photo below shows the UoV radiometer viewing the NPL reference blackbody.
The UoV radiometer viewing the NPL reference blackbody
Figures 3.1.1 to 3.1.7 show the output of the six channels of the CIMEL CE312-2 unit 1
radiometer when it was viewing the NPL reference blackbody maintained at different
temperatures. The same figures also show the brightness temperature of the NPL reference
blackbody as a function of time. The uncertainty bars in the figures represent the uncertainty
values provided by Valencia University which correspond to the measurements shown in the
Figures, as well as the uncertainty of the NPL reference blackbody. Tables 3.1.1 to 3.1.7 which
are shown below each Figure, list the difference between the average temperature displayed by
each radiometer channel during the monitoring period and the corresponding average brightness
temperature of the NPL reference blackbody.

NPL Report ENV 14
9
Figure 3.1.1: Plot of the measurements of the different channels of the CIMEL CE312-2
Unit 1 radiometer when it was viewing the NPL reference blackbody while it was maintained
at about -30 °C.
Table 3.1.1: The deviation of the different radiometer channels δT of the CIMEL CE312-2
Unit 1 radiometer from the average blackbody temperature, over the measurement interval for
a nominal blackbody temperature of -30 °C.
Channel (μm) δT (mK) 10.54 171
11.30 293
10.57 819
9.14 1398
8.68 583
8.42 1798

NPL Report ENV 14
10
Figure 3.1.2: Plot of the measurements of the different channels of the CIMEL CE312-2
Unit 1 radiometer when it was viewing the NPL reference blackbody while it was maintained
at about -15 °C.
Table 3.1.2: The deviation of the different radiometer channels δT of the CIMEL CE312-2
Unit 1 radiometer from the average blackbody temperature, over the measurement interval for
a nominal blackbody temperature of -15 °C.
Channel (μm) δT (mK) 10.54 65
11.30 68
10.57 293
9.14 469
8.68 209
8.42 611

NPL Report ENV 14
11
Figure 3.1.3: Plot of the measurements of the different channels of the CIMEL CE312-2
Unit 1 radiometer when it was viewing the NPL reference blackbody while it was maintained
at about at 0 °C.
Table 3.1.3: The deviation of the different radiometer channels δT of the CIMEL CE312-2
Unit 1 radiometer from the average blackbody temperature, over the measurement interval for
a nominal blackbody temperature of about 0 °C.
Channel (μm) δT (mK) 10.54 80
11.30 0
10.57 110
9.14 220
8.68 140
8.42 280

NPL Report ENV 14
12
Figure 3.1.4: Plot of the measurements of the different channels of the CIMEL CE312-2
Unit 1 radiometer when it was viewing the NPL reference blackbody while it was maintained
at about 10 °C.
Table 3.1.4: The deviation of the different radiometer channels δT of the CIMEL CE312-2
Unit 1 radiometer from the average blackbody temperature, over the measurement interval for
a nominal blackbody temperature of about 10 °C.
Channel (μm) δT (mK) 10.54 29
11.30 -31
10.57 9
9.14 29
8.68 49
8.42 59

NPL Report ENV 14
13
Figure 3.1.5: Plot of the measurements of the different channels of the CIMEL CE312-2
Unit 1 radiometer when it was viewing the NPL reference blackbody while it was maintained
at about 20 °C.
Table 3.1.5: The deviation of the different radiometer channels δT of the CIMEL CE312-2
Unit 1 radiometer from the average blackbody temperature, over the measurement interval for
a nominal blackbody temperature of about 20 °C.
Channel (μm) δT (mK) 10.54 -9
11.30 -39
10.57 -59
9.14 -59
8.68 -9
8.42 -79

NPL Report ENV 14
14
Figure 3.1.6: Plot of the measurements of the different channels of the CIMEL CE312-2
Unit 1 radiometer when it was viewing the NPL reference blackbody while it was maintained
at about 30 °C.
Table 3.1.6: The deviation of the different radiometer channels δT of the CIMEL CE312-2
Unit 1 radiometer from the average blackbody temperature, over the measurement interval for
a nominal blackbody temperature of about 30 °C.
Channel (μm) δT (mK) 10.54 -51
11.30 -81
10.57 -101
9.14 -161
8.68 -81
8.42 -211

NPL Report ENV 14
15
Figure 3.1.7: Plot of the measurements of the different channels of the CIMEL CE312-2
Unit 1 radiometer when it was viewing the NPL reference blackbody while it was maintained
at about 45 °C.
Table 3.1.7: The deviation of the different radiometer channels δT of the CIMEL CE312-2
Unit 1 radiometer from the average blackbody temperature, over the measurement interval for
a nominal blackbody temperature of about 45 °C.
Channel (μm) δT (mK) 10.54 -133
11.30 -81
10.57 -120
9.14 -203
8.68 -193
8.42 -293
3.1.3.2 Comparison of CE312-2 Unit 2 to the NPL reference blackbody
Figures 3.1.8 to 3.1.14 show the output of the six channels of the CIMEL CE312-2 radiometer
unit 2 when it was viewing the NPL blackbody maintained at different temperatures. The same
Figures also show the brightness temperature of the NPL blackbody as a function of time. The
uncertainty bars in the figures represent the uncertainty values provided by Valencia University
which correspond to the measurements shown in the Figures, as well as the uncertainty of the
NPL reference blackbody. Tables 3.1.8 to 3.1.14 shown below each Figure list the difference
between the average temperature displayed by each radiometer channel during the monitoring
period and the corresponding average brightness temperature of the NPL reference blackbody.
317.4
317.6
317.8
318.0
318.2
318.4
318.6
11:09:36 11:12:29 11:15:22 11:18:14 11:21:07 11:24:00 11:26:53
Tem
per
atu
re (
K)
Time (UTC)
University of Valencia CE312-2 Unit 1, 318K, 170 mK low
NPL blackbody 10.54 11.30 10.57 9.14 8.68 8.42

NPL Report ENV 14
16
Figure 3.1.8: Plot of the measurements of the different channels of the CIMEL CE312-2
Unit 2 radiometer when it was viewing the NPL reference blackbody while it was maintained
at about -30 °C.
Table 3.1.8: The deviation of the different radiometer channels δT of the CIMEL CE312-2
Unit 2 radiometer from the average blackbody temperature, over the measurement interval for
a nominal blackbody temperature of -30 °C.
Channel (μm) δT (mK) 10.54 441
11.30 552
10.57 1004
9.14 1782
8.68 935
8.42 2126

NPL Report ENV 14
17
Figure 3.1.9: Plot of the measurements of the different channels of the CIMEL CE312-2
Unit 2 radiometer when it was viewing the NPL reference blackbody while it was maintained
at about -15 °C.
Table 3.1.9: The deviation of the different radiometer channels δT of the CIMEL CE312-2
Unit 2 radiometer from the average blackbody temperature, over the measurement interval for
a nominal blackbody temperature of about -15 °C.
Channel (μm) δT (mK) 10.54 94
11.30 111
10.57 326
9.14 581
8.68 299
8.42 726

NPL Report ENV 14
18
Figure 3.1.10: Plot of the measurements of the different channels of the CIMEL CE312-2
Unit 2 radiometer when it was viewing the NPL reference blackbody while it was maintained
at about 0 °C.
Table 3.1.10: The deviation of the different radiometer channels δT of the CIMEL CE312-2
Unit 2 radiometer from the average blackbody temperature, over the measurement interval for
a nominal blackbody temperature of about 0 °C.
Channel (μm) δT (mK) 10.54 79
11.30 39
10.57 139
9.14 259
8.68 189
8.42 349

NPL Report ENV 14
19
Figure 3.1.11: Plot of the measurements of the different channels of the CIMEL CE312-2
Unit 2 radiometer when it was viewing the NPL reference blackbody while it was maintained
at about 10 °C.
Table 3.1.11: The deviation of the different radiometer channels δT of the CIMEL CE312-2
Unit 2 radiometer from the average blackbody temperature, over the measurement interval for
a nominal blackbody temperature of about 10 °C.
Channel (μm) δT (mK) 10.54 36
11.30 6
10.57 26
9.14 46
8.68 76
8.42 86

NPL Report ENV 14
20
Figure 3.1.12: Plot of the measurements of the different channels of the CIMEL CE312-2
Unit 2 radiometer when it was viewing the NPL reference blackbody while it was maintained
at about 20 °C.
Table 3.1.12: The deviation of the different radiometer channels δT of the CIMEL CE312-2
Unit 2 radiometer from the average blackbody temperature, over the measurement interval for
a nominal blackbody temperature of about 20 °C.
Channel (μm) δT (mK) 10.54 0
11.30 -20
10.57 -30
9.14 -50
8.68 10
8.42 -60

NPL Report ENV 14
21
Figure 3.1.13: Plot of the measurements of the different channels of the CIMEL CE312-2
Unit 2 radiometer when it was viewing the NPL reference blackbody while it was maintained
at about 30 °C.
Table 3.1.13: The deviation of the different radiometer channels δT of the CIMEL CE312-2
Unit 2 radiometer from the average blackbody temperature, over the measurement interval for
a nominal blackbody temperature of about 30 °C.
Channel (μm) δT (mK) 10.54 -49
11.30 -59
10.57 -79
9.14 -119
8.68 -89
8.42 -119

NPL Report ENV 14
22
Figure 3.1.14: Plot of the measurements of the different channels of the CIMEL CE312-2
Unit 2 radiometer when it was viewing the NPL reference blackbody while it was maintained
at about 45 °C.
Table 3.1.14: The deviation of the different radiometer channels δT of the CIMEL CE312-2
Unit 2 radiometer from the average blackbody temperature, over the measurement interval for
a nominal blackbody temperature of about 45 °C.
Channel (μm) δT (mK) 10.54 -147
11.30 -97
10.57 -125
9.14 -165
8.68 -219
8.42 -217

NPL Report ENV 14
23
3.2 MEASUREMENTS MADE BY BALL AEROSPACE
Institute/organisation: Ball Aerospace
10 Longs Peak Drive Broomfield, CO 80021 United States
Contact Name: David Osterman
Email: [email protected]
3.2.1 Description of radiometer and route of traceability
Make and type of Radiometer
The Ball Experimental Sea Surface Radiometer (BESST) is an imaging radiometer for the 8 µm
to 12 µm wavelength range, designed and built by Ball Aerospace & Technologies Corporation.
Outline Technical description of instrument
BESST is an imaging radiometer operated from an aircraft in the nadir pointing orientation.
The instrument scans the sea surface in an 18 degree cross track field of view with a 200 pixel
wide region of a 2-D format uncooled microbolometer focal plane array. Two sources
integrated into the instrument provide calibration to blackbodies, one at the instrument ambient
temperature and one at a temperature approximately 12 °C above ambient. BESST measures
radiance in three spectral bands simultaneously: 8 to 13 µm, 10.2 to 10.9 µm and 11.3 to
12.1 µm. Further details can be found in: “Absolute Thermal Radiometry from a UAS”, W. S.
Good et al, AIAA Infotech@Aerospace, Conference, St. Louis, MO, USA, 2011.
Establishment or traceability route for primary calibration including date of last
realisation and breakdown of uncertainty:
BESST was calibrated against a NIST traceable water bath blackbody operated by the
University of Miami. Further details of traceability are presented in: W. Emery et al., A
Microbolometer Airborne Calibrated Radiometer: The Ball Airborne Calibrated Sea Surface
Radiometer, IEEE Transactions On Geosci and Remote Sensing, Vol. 52, No. 12, Dec 2014.
Operational methodology during measurement campaign:
During flight campaigns the focal plane array frame rate is slightly less than 3 frames per sec.
A typical measurement cycle comprises 7 seconds of calibration alternating with 53 seconds of
radiometric imaging.
Radiometer usage (deployment), previous use of instrument and planned applications.
Recent BESST flight campaigns have radiometrically imaged an oil spill in the Gulf of Mexico
and ice flows off the northern coast of Alaska, the latter for the NOAA “Operation Icebridge”.

NPL Report ENV 14
24
3.2.2 Uncertainty contributions associated with Ball Aerospace’s radiometer
Uncertainty Contribution
Type A Uncertainty
in Value / %
Type B Uncertainty
in Value / (appropriate
units)
Uncertainty in Brightness
temperature
K
Comment (D. Osterman,
090916)
Repeatability of
measurement URepeat 0.095
Lab calibration
08/10/16
Repeatability of
measurement URepro 0.19
Lab calibrations
07/27/16 and 08/10/16
Primary calibration
temperature Uprim
0.086 (10 ºC)
0.064 (20 ºC)
0.086 (30 ºC)
0.160 (45 ºC)
Electro-Optical
Industries
CES 200-04-MG;
combines temperature
accuracy, stability,
uniformity
Primary calibration
emissivity
+/-0.004
(emissivity)
0.44 (10 ºC) 0.46
(20 ºC) 0.50 (30
ºC) 0.54 (45 ºC)
Electro-Optical
Industries
CES 200-04-MG
Linearity of
radiometer ULin
0.29 (10 ºC) 0.14
(20 ºC) 0.15 (30
ºC) 0.03 (45 ºC)
Deviation from best fit
line to 08/10/16 lab
measurements,
12 ºC to 45 ºC
Drift since calibration 0 0 Accounted for in
reproducibility
Ambient temperature
fluctuations
1.67 (ºC room
temp pk-pk) 0.08
Assume max ambient temperature pk-pk
fluctuation
3 F = 1.67 ºC
Atmospheric
absorption/emission 0 0
Negligible absorption in
38 mm path length
RMS Total
0.59 (10 ºC)
0.54 (20 ºC) 0.58 (30 ºC) 0.63 (45 ºC)

NPL Report ENV 14
25
3.2.3 Comparison of BESST radiometer to NPL reference blackbody
Figures 3.2.1 to 3.2.4 show the measurements completed by the Ball Aerospace radiometer
BESST when it was viewing the NPL blackbody maintained at different temperatures. Due to
the calibration range of the instrument, only blackbody temperatures in the range 10 °C to 45 °C
were measured. The uncertainty bars shown in orange in the figures represent the uncertainties
provided by Ball Aerospace associated with the measurements shown in the Figures. Also
shown in blue in these Figures are the values of the brightness temperature of the NPL reference
blackbody along with their combined uncertainty values.
Figure 3.2.1: The Ball Aerospace radiometer BESST viewing the NPL blackbody maintained
at about 10 °C. The deviation of the BESST radiometer from the average blackbody
temperature over the measurement interval was 1118 mK.

NPL Report ENV 14
26
Figure 3.2.2: The Ball Aerospace radiometer BESST viewing the NPL blackbody maintained
at about 20 °C. The deviation of the BESST radiometer from the average blackbody
temperature over the measurement interval was 1423 mK.
Figure 3.2.3: The Ball Aerospace radiometer BESST viewing the NPL blackbody maintained
at about 30 °C. The deviation of the BESST radiometer from the average blackbody
temperature over the measurement interval was 308 mK.

NPL Report ENV 14
27
Figure 3.2.4: The Ball Aerospace radiometer BESST viewing the NPL blackbody maintained
at about 45 °C. The deviation of the BESST radiometer from the average blackbody
temperature over the measurement interval was 1092 mK.
3.3 MEASUREMENTS MADE BY KIT
IMK-ASF, Karlsruhe Institute of Technology (KIT)
Hermann-von-Helmholtz-Platz 1, 76344 Eggenstein-Leopoldshafen, Germany
Contact Name: Dr. Frank-M. Goettsche
e-mail: [email protected]
3.3.1 Description of radiometer and route of traceability
Make and type of Radiometer: Heitronics KT15.85 IIP with L6 lens
Outline Technical description of instrument: The KT15.85 IIP is a single channel radiometer
based on a pyroelectric infrared detector. This type of sensor links radiance measurements via
beam-chopping to internal reference temperature measurements and thermal drift can
practically be eliminated. The KT15.85 IIP covers the spectral range from 9.6 μm to 11.5 μm,
has an uncertainty of about 0.3K over the temperature range relevant to land surfaces and offers
excellent long-term stability. The response time of the surface observing radiometer (serial
#11650) was set to 10 sec and its temperature range to -25 °C to +100 °C. The type L6 lens
used has a full-view angle of 8.3° and is well-suited for directional measurements.
www.heitronics.com
Establishment or traceability route for primary calibration including date of last
realisation and breakdown of uncertainty:
Primary calibrations to within specifications were performed on the 03.07.2015 (serial #11650)
and 05.05.2015 (serial #11615) by Heitronics GmbH, Wiesbaden, Germany. Breakdowns of
uncertainties are not available.

NPL Report ENV 14
28
Operational methodology during measurement campaign:
KIT’s standard operational methodology for the KT15.85 IIP radiometer is to take
measurements every 10 sec with a Campbell Scientific CR1000 data logger, average these over
1 minute and store the result together with standard deviation. Unfortunately, at the first day of
the LICE at NPL the data logger was electrically destroyed: it could only be replaced for the
water part (2nd week) and land part (3rd week) of the LICE. The measurements performed in the
laboratory (1st week) had to be read directly from the KT15.85 IIP’s display, which limited
temperature resolution to 0.1 K. The second radiometer (serial #11615, temperature range -
100°C to +100°C) was used for blackbody temperatures below -25 °C. Each blackbody
temperature was measured 10 times at 10-15 sec intervals and uncertainties were estimated
based on manufacturer’s specifications. The radiometers were mounted on a tripod, placed
directly in front of the blackbody aperture and aligned manually.
Radiometer usage (deployment), previous use of instrument and planned applications.
The KT15.85 IIP’s were used for inter-calibrations at KIT’s validation stations Dahra, Senegal
and Evora, Portugal. They will be deployed for several years in support of KITs long-term
satellite LST validation activities.
3.3.2 Uncertainty Contributions associated KIT’s measurements at NPL
Uncertainty Contribution Type A
Uncertainty in
Value / %
Type B
Uncertainty in
Value /
(appropriate
units)
Uncertainty in
Brightness temperature
K
Repeatability of
measurement
Reproducibility of
measurement
Primary calibration
Linearity of radiometer
Drift since calibration
Temperature resolution
Ambient temperature
fluctuations
Atmospheric
absorption/emission
0.12
0.12
0.250 K
0.070 K
0.176 K
0.050 K
0.035 K
0.035 K
0.024
0.024
0.250
0.070
0.176
0.050
0.035
0.035
RMS total
0.173 0.323
The reported uncertainty is based on a standard uncertainty (coverage factor k=1), providing a
confidence level of approximately 68%.

NPL Report ENV 14
29
Comments:
Uncertainty estimates assume 20 K temperature difference between blackbody and sensor
housing. Relative uncertainties are given ‘at reading’ at 20 °C. Estimates are given for a
representative emissivity of 0.970 and assume 20 K temperature difference between target and
sensor housing. Relative uncertainties are ‘at reading’ at 25°C.
The reported uncertainty is based on a standard uncertainty (coverage factor k=1), providing a
confidence level of approximately 68%.
3.3.3 Comparison of KIT Heitronics KT15.85 IIP to the NPL reference blackbody
Figures 3.3.1 to 3.3.7 show the measurements completed by the KIT radiometer Heitronics
KT15.85 IIP when it was viewing the NPL reference blackbody maintained at different
temperatures. The uncertainty bars (shown in orange) in the figures represent the uncertainties
provided by KIT associated with the measurements shown in the Figures. Also shown (in blue)
in these Figures are the values of the brightness temperature of the blackbody along with its
combined uncertainty.
Figure 3.3.1: The KT15.85 IIP KIT radiometer viewing the NPL blackbody maintained at
about -30 °C. The deviation of the KIT radiometer δT from the average blackbody
temperature over the measurement interval was 1114 mK.

NPL Report ENV 14
30
Figure 3.3.2: The KT15.85 IIP KIT radiometer viewing the NPL blackbody maintained at
about -15 °C. The deviation of the KIT radiometer δT from the average blackbody
temperature over the measurement interval was 131 mK.
Figure 3.3.3: The KT15.85 IIP KIT radiometer viewing the NPL blackbody maintained at
about 0 °C. The deviation of the KIT radiometer δT from the average blackbody temperature
over the measurement interval was 111 mK.
NPL Report ENV 14
31
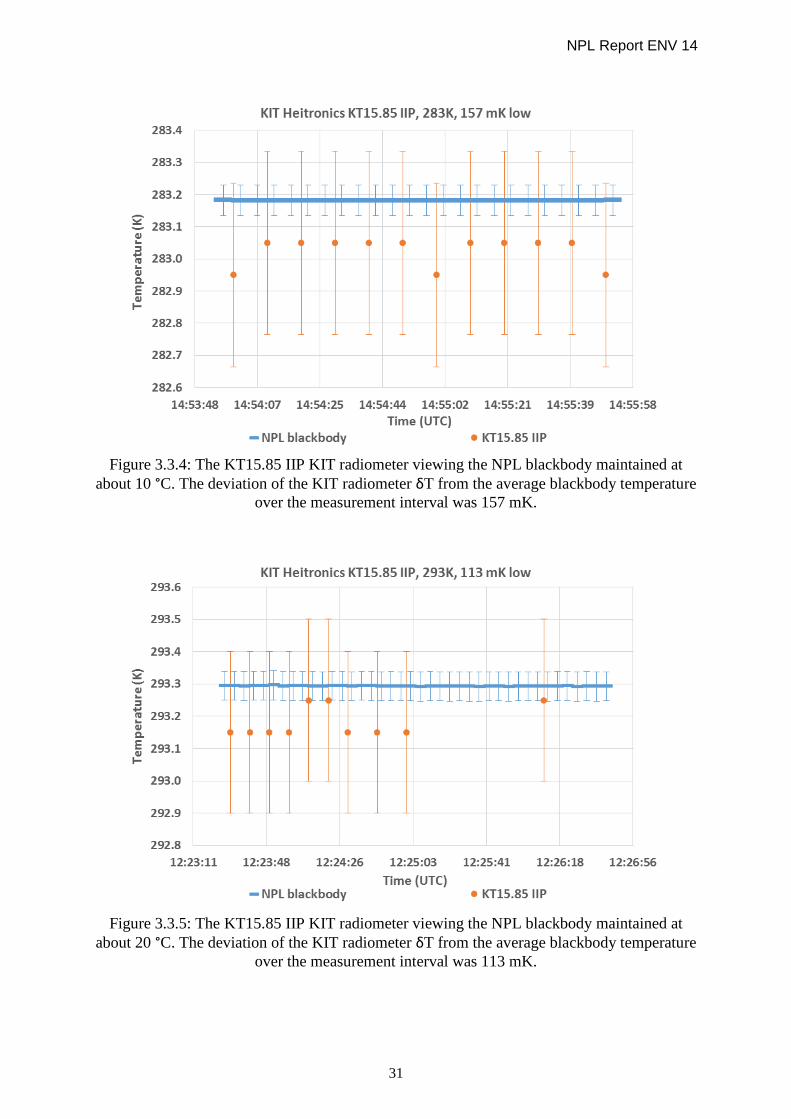
Figure 3.3.4: The KT15.85 IIP KIT radiometer viewing the NPL blackbody maintained at
about 10 °C. The deviation of the KIT radiometer δT from the average blackbody temperature
over the measurement interval was 157 mK.
Figure 3.3.5: The KT15.85 IIP KIT radiometer viewing the NPL blackbody maintained at
about 20 °C. The deviation of the KIT radiometer δT from the average blackbody temperature
over the measurement interval was 113 mK.

NPL Report ENV 14
32
Figure 3.3.6: The KT15.85 IIP KIT radiometer viewing the NPL blackbody maintained at
about 30 °C. The deviation of the KIT radiometer δT from the average blackbody temperature
over the measurement interval was 128 mK.
Figure 3.3.7: The KT15.85 IIP KIT radiometer viewing the NPL blackbody maintained at
about 45 °C. The deviation of the KIT radiometer δT from the average blackbody temperature
over the measurement interval was 129 mK.

NPL Report ENV 14
33
3.4 MEASUREMENTS MADE BY ONERA
Institute/organisation: ONERA
2, avenue Edouard Belin – 31055 Toulouse Cedex4 - France.
Contact Name: Laurent Poutier
Email: [email protected]
3.4.1 Description of radiometer and route of tracibility
3.4.1.1 Radiometer ONERA-A:
Type: Heitronics KT19.85 II
Field of View: 95mm target diameter at a 2m range.
Spectral band: 9.6 - 11.5μm
Temperature resolution: ±0.06 °C
Uncertainty in measurement: ±0.5 °C+0.7% of the difference between target and housing
temperature
3.4.1.2 Radiometer ONERA-B:
Type: Mikron Spectroradiometer BOMEM MR354SC
Detector Type: MCT Photoconductive
Spectral response: 3 to 13μm @ 4 cm-1
FOV: 20° full angle
Scan rate: 34 scan/s
Objective: None
Outline Technical description of the ONERA-B instrument: The spectroradiometer is a
Michelson FTIR instrument with two Stirling-cooled detectors in order to cover the 3-13μm
spectral domain.
3.4.2 Uncertainty contributions associated with ONERA’s measurements at NPL
3.4.2.1 Radiometric calibration and uncertainty contribution ONERA-A
The calibration of the radiometer was also checked using the Mikron M345 blackbody, at two
specific set temperatures.
The primary calibration error is the one given by the manufacturer (±0.5 °C plus 0.7% of the
difference between target and housing temperature). The Root Mean Square (RMS) difference
between the Mikron set temperature and the radiometer output calculated over the 14 datasets
acquired in the temperature range of 12 to 55 °C leads to a typical difference below 0.1 K for
the radiometer. Therefore, if we consider that this setup can be modelled as a blackbody
surrounded by reflective coatings, so that the error in the Mikron source is limited to its
temperature accuracy (equal to 0.1 K), then the primary calibration error could be decreased
down to √2×0.1≅0.15 K. This ideal modelling is probably optimistic and the final primary

NPL Report ENV 14
34
calibration error is consequently higher. Meanwhile it could be less than the manufacturer’s
estimation.
Finally, the uncertainty contributions following the NPL presentation is summed up in
Table 3.4.1.
Table 3.4.1: Uncertainty contribution for the Heitronics KT19 radiometers.
3.4.2.2 Radiometric calibration and uncertainty contribution ONERA-B
The instrument output is a raw interferogram expressed in Volts as a function of the optical
path difference. The spectroradiometer is very sensitive to its internal temperature, especially
the beamsplitter temperature, which is maintained around 20 °C above ambient temperature.
The calibration is done with the ONERA Mikron M345 4-inch by 4-inch blackbody. The
radiance spectrum is processed using the two reference acquisitions corresponding to the two
Mikron set temperatures and the interferogram of the NPL source. The uncertainty is estimated
by combining the following uncertainty sources.
Sources of uncertainty considered for the error budget.
Blackbody temperature short term stability ±0.04 K (dependent on the reference
measurement)
Blackbody temperature accuracy ±0.1 K (bias common to the 2 reference
measurements)
Blackbody emissivity accuracy ±0.01
Skin Bomem temperature uncertainty ±4 K
The overall uncertainty is shown in the Table 3.4.2 below, for the different reference blackbody
temperatures. Logically, when extrapolating regarding the calibration values, the uncertainty
grows. The retrieved brightness temperature tends to exhibit a noticeable spectral signature
when the measured temperature is outside the calibration interval. This extrapolation behaviour
is probably due to the non-linearity of the detector and/or issues with the calibration source
model.

NPL Report ENV 14
35
Table 3.4.2: Calibration temperatures and estimated uncertainty for the brightness
temperatures derived from the BOMEM spectroradiometer.
Set temperature of the
experiment
Calibration first
temperature (°C)
Calibration second
temperature (°C)
RMS uncertainty for
the brightness
temperature (K)
-15 12 45 0.4
0 15 40 0.3
10 15 40 0.24
20 15 40 0.2
30 20 40 0.19
45 30 55 0.2
3.4.3 Comparison of radiometer to the NPL reference blackbody
3.4.3.1 Comparison of ONERA-A Unit 1 to the NPL reference blackbody
Figures 3.4.1 to 3.4.7 show the measurements completed by the ONERA-A Heitronics KT19.85
II radiometer Unit 1 when it was viewing the NPL reference blackbody maintained at different
temperatures. The uncertainty bars (shown in orange) in the figures represent the uncertainty
values provided by ONERA which correspond to the measurements shown in the Figures. Also
shown in blue in these Figures are the values of the brightness temperature of the NPL reference
blackbody along with their combined uncertainty values.
Figure 3.4.1: The KT19.85 II ONERA-A radiometer Unit 1 viewing the NPL blackbody
maintained at about -30 °C. The deviation of the ONERA radiometer δT from the average
blackbody temperature over the measurement interval was 702 mK
NPL Report ENV 14
36
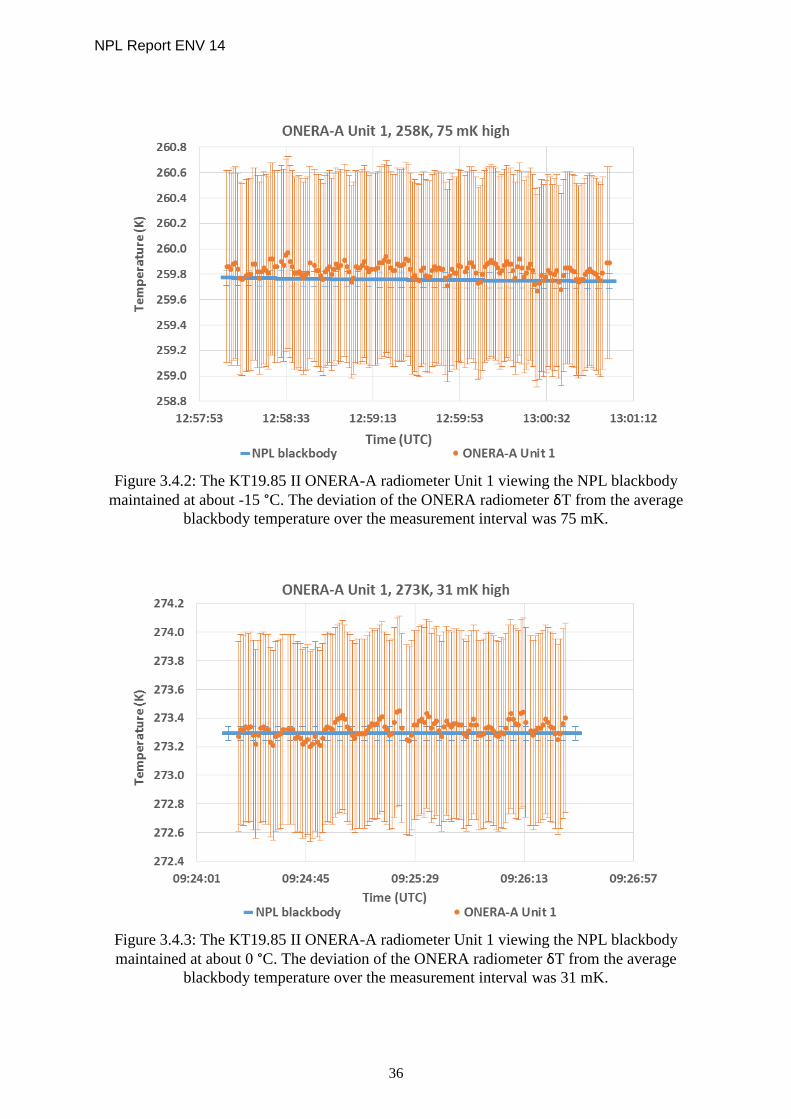
Figure 3.4.2: The KT19.85 II ONERA-A radiometer Unit 1 viewing the NPL blackbody
maintained at about -15 °C. The deviation of the ONERA radiometer δT from the average
blackbody temperature over the measurement interval was 75 mK.
Figure 3.4.3: The KT19.85 II ONERA-A radiometer Unit 1 viewing the NPL blackbody
maintained at about 0 °C. The deviation of the ONERA radiometer δT from the average
blackbody temperature over the measurement interval was 31 mK.

NPL Report ENV 14
37
Figure 3.4.4: The KT19.85 II ONERA-A radiometer Unit 1 viewing the NPL blackbody
maintained at about 10 °C. The deviation of the ONERA radiometer δT from the average
blackbody temperature over the measurement interval was 34 mK.
Figure 3.4.5: The KT19.85 II ONERA-A radiometer Unit 1 viewing the NPL blackbody
maintained at about 20 °C. The deviation of the ONERA radiometer δT from the average
blackbody temperature over the measurement interval was 71 mK.

NPL Report ENV 14
38
Figure 3.4.6: The KT19.85 II ONERA-A radiometer Unit 1 viewing the NPL blackbody
maintained at about 30 °C. The deviation of the ONERA radiometer δT from the average
blackbody temperature over the measurement interval was 64 mK.
Figure 3.4.7: The KT19.85 II ONERA-A radiometer Unit 1 viewing the NPL blackbody
maintained at about 45 °C. The deviation of the ONERA radiometer δT from the average
blackbody temperature over the measurement interval was 94 mK

NPL Report ENV 14
39
3.4.3.2 Comparison of ONERA-A Unit 2 to the NPL reference blackbody
Figures 3.4.8 to 3.4.14 show the measurements completed by the ONERA-A radiometer unit 2
when it was viewing the NPL blackbody maintained at different temperatures. The uncertainty
bars (shown in orange) in the Figures represent the uncertainty values provided by ONERA
which correspond to the measurements shown in the Figures. Also shown in blue in these
Figures are the values of the brightness temperature of the NPL reference blackbody along with
their combined uncertainty values.
Figure 3.4.8: The KT19.85 II ONERA-A radiometer Unit 2 viewing the NPL blackbody
maintained at about -30 °C. The deviation of the ONERA radiometer δT from the average
blackbody temperature over the measurement interval was 602 mK.
NPL Report ENV 14
40
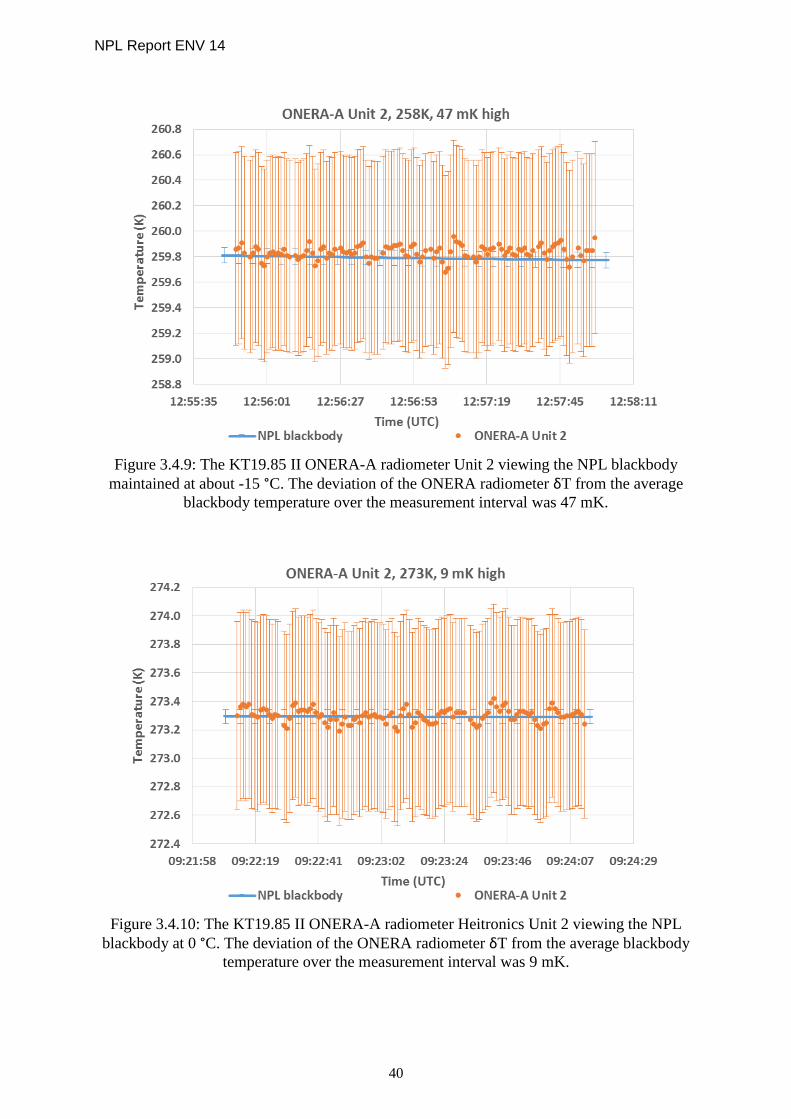
Figure 3.4.9: The KT19.85 II ONERA-A radiometer Unit 2 viewing the NPL blackbody
maintained at about -15 °C. The deviation of the ONERA radiometer δT from the average
blackbody temperature over the measurement interval was 47 mK.
Figure 3.4.10: The KT19.85 II ONERA-A radiometer Heitronics Unit 2 viewing the NPL
blackbody at 0 °C. The deviation of the ONERA radiometer δT from the average blackbody
temperature over the measurement interval was 9 mK.

NPL Report ENV 14
41
Figure 3.4.11: The KT19.85 II ONERA-A radiometer Unit 2 viewing the NPL blackbody
maintained at about 10 °C. The deviation of the ONERA radiometer δT from the average
blackbody temperature over the measurement interval was 9 mK.
Figure 3.4.12: The KT19.85 II ONERA-A radiometer Unit 2 viewing the NPL blackbody
maintained at about 20 °C. The deviation of the ONERA radiometer δT from the average
blackbody temperature over the measurement interval was 79 mK.

NPL Report ENV 14
42
Figure 3.4.13: The KT19.85 II ONERA-A radiometer Unit 2 viewing the NPL blackbody
maintained at about 30 °C. The deviation of the ONERA radiometer δT from the average
blackbody temperature over the measurement interval was 14 mK.
Figure 3.4.14: The KT19.85 II ONERA-A radiometer Unit 2 viewing the NPL blackbody
maintained at about 45 °C. The deviation of the ONERA radiometer δT from the average
blackbody temperature over the measurement interval was 104 mK.

NPL Report ENV 14
43
3.4.3.3 Comparison of ONERA-A Unit 3 to the NPL reference blackbody
Figures 3.4.15 to 3.4.21 show the measurements completed by the ONERA-A radiometer unit
3 when it was viewing the NPL blackbody maintained at different temperatures. The uncertainty
bars shown in orange in the figures represent the uncertainty values provided by ONERA which
correspond to the measurements shown in the Figures. Also shown in blue in these Figures are
the values of the brightness temperature of the NPL reference blackbody along with their
combined uncertainty values.
Figure 3.4.15: The KT19.85 II ONERA-A radiometer Unit 3 viewing the NPL blackbody
maintained at about -30 °C. The deviation of the ONERA radiometer δT from the average
blackbody temperature over the measurement interval was 109 mK.

NPL Report ENV 14
44
Figure 3.4.16: The KT19.85 II ONERA-A radiometer Unit 3 viewing the NPL blackbody
maintained at about -15 C. The deviation of the ONERA radiometer δT from the average
blackbody temperature over the measurement interval was 252 mK.
Figure 3.4.17: The KT19.85 II ONERA-A radiometer Unit 3 viewing the NPL blackbody
maintained at about 0 °C. The deviation of the ONERA radiometer δT from the average
blackbody temperature over the measurement interval was 210 mK.

NPL Report ENV 14
45
Figure 3.4.18: The KT19.85 II ONERA-A radiometer Unit 3 viewing the NPL blackbody
maintained at about 10 °C. The deviation of the ONERA radiometer δT from the average
blackbody temperature over the measurement interval was 124 mK.
Figure 3.4.19: The KT19.85 II ONERA-A radiometer Unit 3 viewing the NPL blackbody
maintained at about 20 °C. The deviation of the ONERA radiometer δT from the average
blackbody temperature over the measurement interval was 68 mK

NPL Report ENV 14
46
Figure 3.4.20: The KT19.85 II ONERA-A radiometer Unit 3 viewing the NPL blackbody
maintained at about 30 °C. The deviation of the ONERA radiometer δT from the average
blackbody temperature over the measurement interval was 9 mK.
Figure 3.4.21: The KT19.85 II ONERA-A radiometer Unit 3 viewing the NPL blackbody
maintained at about 45 °C. The deviation of the ONERA radiometer δT from the average
blackbody temperature over the measurement interval was 26 mK.

NPL Report ENV 14
47
3.4.3.4 Comparison of ONERA-B to the NPL reference blackbody
Figures 3.4.22 to 3.4.29 show the measurements completed by the ONERA-B Mikron
spectroradiometer BOMEM MR354 when it was viewing the NPL blackbody maintained at
different temperatures. The uncertainty bars shown in orange in the figures represent the
uncertainty values provided by ONERA which correspond to the measurements shown in the
Figures. Also shown in blue in these Figures are the values of the brightness temperature of the
NPL reference blackbody along with their combined uncertainty values.
Figure 3.4.22: The ONERA-B Mikron spectroradiometer BOMEM MR354 viewing the NPL
blackbody maintained at about -30 °C. The deviation of the ONERA spectroradiometer δT
from the average blackbody temperature over the measurement interval was 1612 mK.

NPL Report ENV 14
48
Figure 3.4.23: The ONERA-B Mikron spectroradiometer BOMEM MR354 viewing the NPL
blackbody for the first measurement at -15 °C. The deviation of the ONERA
spectroradiometer from the average blackbody temperature over the measurement interval
was 1285 mK.
Figure 3.4.24: The ONERA-B Mikron spectroradiometer BOMEM MR354 viewing the NPL
blackbody for the second measurement maintained at about -15 °C. The deviation of the
ONERA spectroradiometer from the average blackbody temperature over the measurement
interval was 1458 mK.

NPL Report ENV 14
49
Figure 3.4.25: The ONERA-B Mikron spectroradiometer BOMEM MR354 viewing the NPL
blackbody maintained at about 0 °C. The deviation of the ONERA spectroradiometer from the
average blackbody temperature over the measurement interval was 534 mK.
Figure 3.4.26: The ONERA-B Mikron spectroradiometer BOMEM MR354 viewing the NPL
blackbody maintained at about 10 °C. The deviation of the ONERA spectroradiometer from
the average blackbody temperature over the measurement interval was 375 mK.

NPL Report ENV 14
50
Figure 3.4.27: The ONERA-B Mikron spectroradiometer BOMEM MR354 viewing the NPL
blackbody maintained at about 20 °C. The deviation of the ONERA spectroradiometer from
the average blackbody temperature over the measurement interval was 233 mK.
Figure 3.4.28: The ONERA-B Mikron spectroradiometer BOMEM MR354 viewing the NPL
blackbody maintained at about 30 °C. The deviation of the ONERA spectroradiometer from
the average blackbody temperature over the measurement interval was 221 mK.
NPL Report ENV 14
51
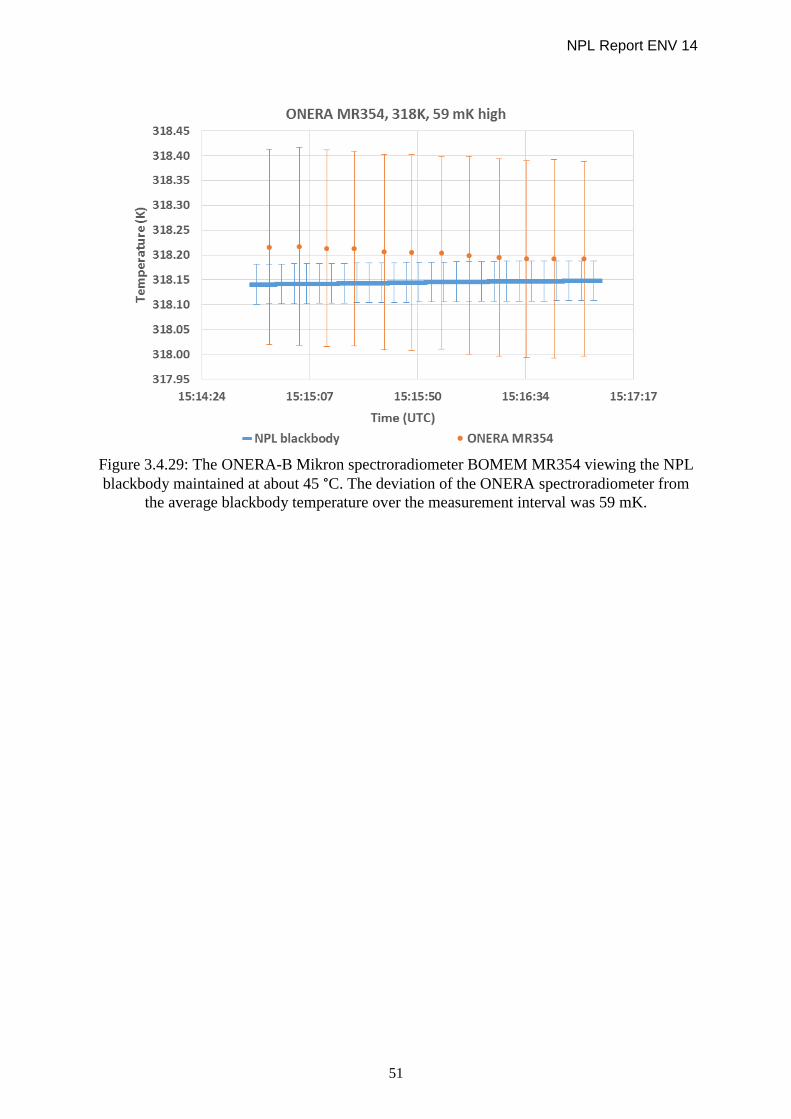
Figure 3.4.29: The ONERA-B Mikron spectroradiometer BOMEM MR354 viewing the NPL
blackbody maintained at about 45 °C. The deviation of the ONERA spectroradiometer from
the average blackbody temperature over the measurement interval was 59 mK.

NPL Report ENV 14
52
3.5 MEASUREMENTS MADE BY CSIRO
Institute/organisation: CSIRO
Ocean Modelling Research Team, Research and Development Branch,
Bureau of Meteorology GPO Box 1289 Melbourne VIC 3001,
Level 11, 700 Collins Street, Docklands VIC 3008
Contact Name: Nicole Morgan
Email: [email protected]
3.5.1 Description of Radiometer and route of traceability
Make and type of Radiometer:
ISAR 5D
Outline Technical description of instrument:
Full information on this radiometer can be found in: Wimmer, W., and I. Robinson, 2016: The
ISAR instrument uncertainty model. J. Atmos. Oceanic Technol. doi:10.1175/JTECH-D-16-
0096.1, in press.
Establishment or traceability route for primary calibration including date of last
realisation and breakdown of uncertainty:
Pre workshop calibration completed 22/05/2016.
Post workshop calibration completed 05/07/2016.
Operational methodology during measurement campaign:
Alignment was achieved using an alignment piece specifically designed for the dome nuts on
the end to slot into. This is the same way the instrument is aligned during calibration and
deployment.
The ISAR runs continuously and is post processed using calibration scripts which incorporate
the uncertainty model, instrument data and pre and post calibrations to calculate the uncertainty.
Radiometer usage (deployment), previous use of instrument and planned applications. This ISAR is installed on RV Investigator, Australia’s blue water science vessel. It is part of
the underway data collected on every voyage.

NPL Report ENV 14
53
3.5.2 Uncertainty contributions associated with CSIRO’s measurements at NPL
Table 3.5.1 shows the uncertainty budget associated with measurements made by the CSIRO
radiometer.
Table 3.5.1: The uncertainty budget associated with measurements made by the CSIRO
radiometer
Sources of uncertainties arising within the ISAR SST retrieval processor. A more detailed breakdown
is available in the reference paper “The ISAR instrument uncertainty model”.
3.5.3 Comparison of CSIRO ISAR 5D to the NPL reference blackbody
Figures 3.5.1 to 3.5.7 show the measurements completed by the CSIRO radiometer ISAR 5D
when it was viewing the NPL blackbody maintained at different temperatures. The uncertainty
bars shown in orange in the figures represent the uncertainty values provided by CSIRO which
correspond to the measurements shown in the Figures. Also shown in blue in these Figures are
the values of the brightness temperature of the NPL reference blackbody along with their
combined uncertainty values.

NPL Report ENV 14
54
Figure 3.5.1: The ISAR 5D CSIRO radiometer viewing the NPL blackbody maintained at
about -30 °C. The deviation of the CSIRO radiometer from the average blackbody
temperature over the measurement interval was 435 mK.
Figure 3.5.2: The ISAR 5D CSIRO radiometer viewing the NPL blackbody maintained at
about -15 °C. The deviation of the CSIRO radiometer from the average blackbody
temperature over the measurement interval was 50 mK.

NPL Report ENV 14
55
Figure 3.5.3: The ISAR 5D CSIRO radiometer viewing the NPL blackbody maintained at
about 0 °C. The deviation of the CSIRO radiometer δT from the average blackbody
temperature over the measurement interval was 151 mK
Figure 3.5.4: The ISAR 5D CSIRO radiometer viewing the NPL blackbody maintained at
about 10 °C. The deviation of the CSIRO radiometer δT from the average blackbody
temperature over the measurement interval was 77 mK.

NPL Report ENV 14
56
Figure 3.5.5: The ISAR 5D CSIRO radiometer viewing the NPL blackbody maintained at
about 20 °C. The deviation of the CSIRO radiometer δT from the average blackbody
temperature over the measurement interval was 137 mK.
Figure 3.5.6: The ISAR 5D CSIRO radiometer viewing the NPL blackbody maintained at
about 30 °C. The deviation of the CSIRO radiometer δT from the average blackbody
temperature over the measurement interval was 100 mK.

NPL Report ENV 14
57
Figure 3.5.7: The ISAR 5D CSIRO radiometer viewing the NPL blackbody maintained at
about 45 °C. The deviation of the CSIRO radiometer δT from the average blackbody
temperature over the measurement interval was 36 mK.
3.6 MEASUREMENTS MADE BY STFC RAL
Science and Technology Facilities Council Rutherford Appleton Laboratory
Chilton, Didcot, Oxon
OX11 0QX, United Kingdom
Contact Name: Tim Nightingale
Email: [email protected]
3.6.1 Description of the radiometer and route of tracibility
Make and type of Radiometer:
Scanning Infrared Sea Surface Temperature Radiometer (SISTeR) manufactured by RAL
Space.
Outline Technical description of instrument:
SISTeR is a chopped, self-calibrating filter radiometer manufactured by RAL Space. It has a
single-element DLaTGS pyroelectric detector, a filter wheel containing up to six band-defining
filters and two internal reference blackbodies, one operating at ambient temperature and the
other heated to ~17 K above ambient. During operation the radiometer selects with a scan
mirror successive views to each of the blackbodies and to the external scene in a repeated
sequence. For Sea Surface Temperature (SST) measurements, the external measurements
include views to the sea surface, and to the sky at the complementary angle. The instrument

NPL Report ENV 14
58
field of view is approximately 13°. During the 2016 radiometer laboratory comparison, a filter
centred at 10.8 μm was used.
Reference:
Further information on the SISteR radiometer can be found in
http://www.stfc.ac.uk/research/environment/sister/
Establishment or traceability route for primary calibration including date of last
realisation and breakdown of uncertainty.
The primary traceability route is through two rhodium iron thermometers, one embedded in
each of the instrument’s internal blackbodies. These thermometers are re-calibrated periodically
against a secondary SPRT in a dedicated thermal block maintained by Oxford University. The
SPRT calibration is traceable to NPL. The estimated re-calibration accuracy is approximately
4 mK. The last calibration of the internal blackbody thermometers used in the FRM4STS
measurements took place in 2007/2008 and new calibration is scheduled.
There is circumstantial evidence that the hot blackbody thermometer calibration may have
shifted since its last re-calibration, by about 50 mK. This will be confirmed by the next
thermometer re-calibration.
The SISTeR calibration is validated against a CASOTS Mk 1 external blackbody, which has a
copper cavity with Mankiewicz Nextel Velvet Coating 811-21 thermally controlled by a water
bath. The temperature of the water bath is measured with a Fluke 5640 series thermistor probe,
with a system accuracy of 4 mK, traceable to NIST.
A new calibrated thermistor probe and bridge was purchased in July 2016. When the two probes
were inter-compared in the blackbody water bath, their measurements agreed comfortably to
within their estimated uncertainties.
Operational methodology during measurement campaign:
SISTeR was aligned vertically to the NPL blackbody using stacks of paper on an adjustable
table, and remained at the same height throughout. For each measurement it was positioned as
close as possible to the blackbody. It was then aligned horizontally looking along the top of the
instrument at the centre of the entrance aperture. Levelness was verified with a spirit level on
the top of the instrument.
The SISCAL routine was used, which measures counts from the lab blackbody and each of the
two internal blackbodies in turn.
Radiometer usage (deployment), previous use of instrument and planned applications:
The SISTeR radiometer was developed to collect SST validation data for the ATSR series of
satellite radiometers. Latterly it supports the SLSTR and other satellite radiometers. The
SISTeR instrument is currently deployed on the Queen Mary 2 cruise liner which is operated
by Cunard Line. Deployments have been funded, at different times, by ESA, DECC and NERC.
Typical routes are between Hamburg, Southampton and New York with side-trips from these
ports, for example, to the Caribbean or to the Channel Islands. For four months of each year,
from January to May, there is a round-the-world trip beginning and ending at Southampton.
NPL Report ENV 14
59
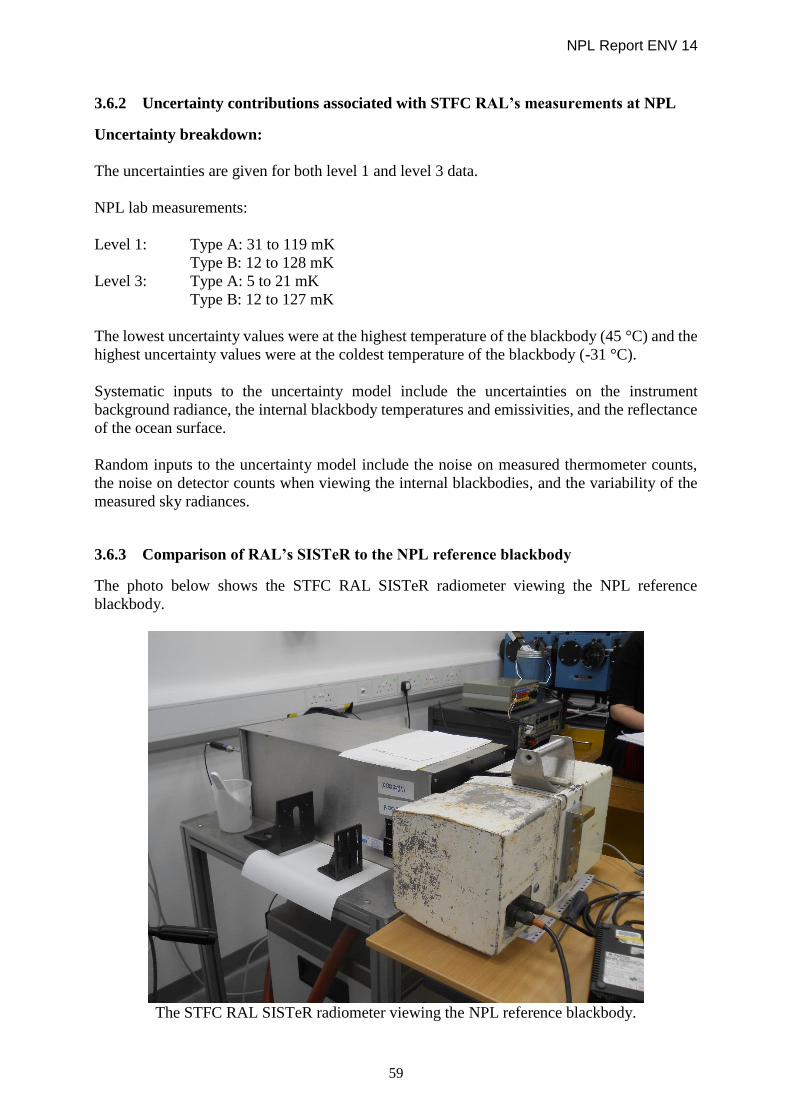
3.6.2 Uncertainty contributions associated with STFC RAL’s measurements at NPL
Uncertainty breakdown:
The uncertainties are given for both level 1 and level 3 data.
NPL lab measurements:
Level 1: Type A: 31 to 119 mK
Type B: 12 to 128 mK
Level 3: Type A: 5 to 21 mK
Type B: 12 to 127 mK
The lowest uncertainty values were at the highest temperature of the blackbody (45 °C) and the
highest uncertainty values were at the coldest temperature of the blackbody (-31 °C).
Systematic inputs to the uncertainty model include the uncertainties on the instrument
background radiance, the internal blackbody temperatures and emissivities, and the reflectance
of the ocean surface.
Random inputs to the uncertainty model include the noise on measured thermometer counts,
the noise on detector counts when viewing the internal blackbodies, and the variability of the
measured sky radiances.
3.6.3 Comparison of RAL’s SISTeR to the NPL reference blackbody
The photo below shows the STFC RAL SISTeR radiometer viewing the NPL reference
blackbody.
The STFC RAL SISTeR radiometer viewing the NPL reference blackbody.

NPL Report ENV 14
60
Figures 3.6.1 to 3.6.7 show the measurements completed by the STFC RAL SISTeR radiometer
when it was viewing the NPL blackbody maintained at different temperatures. The uncertainty
bars shown in orange in the figures represent the uncertainty values provided by STFC RAL
which correspond to the measurements shown in the Figures. Also shown in blue in these
Figures are the values of the brightness temperature of the NPL reference blackbody along with
their combined uncertainty values.
Figure 3.6.1: The SISTeR STFC RAL radiometer viewing the NPL blackbody maintained at
about -30 °C. The deviation of the SISTeR radiometer from the average blackbody
temperature over the measurement interval was 908 mK.

NPL Report ENV 14
61
Figure 3.6.2: The SISTeR STFC RAL radiometer viewing the NPL blackbody maintained at
about -15 °C. The deviation of the SISTeR radiometer from the average blackbody
temperature over the measurement interval was 229 mK.
Figure 3.6.3: The SISTeR STFC RAL radiometer viewing the NPL blackbody maintained at
about 0 °C. The deviation of the SISTeR radiometer from the average blackbody temperature
over the measurement interval was 90 mK.

NPL Report ENV 14
62
Figure 3.6.4: The SISTeR STFC RAL radiometer viewing the NPL blackbody maintained at
about 10 °C. The deviation of the SISTeR radiometer from the average blackbody temperature
over the measurement interval was 60 mK.
Figure 3.6.5: The SISTeR STFC RAL radiometer viewing the NPL blackbody maintained at
about 20 °C. The deviation of the SISTeR radiometer from the average blackbody temperature
over the measurement interval was 32 mK.

NPL Report ENV 14
63
Figure 3.6.6: The SISTeR STFC RAL radiometer viewing the NPL blackbody maintained at
about 30 °C. The deviation of the SISTeR radiometer from the average blackbody temperature
over the measurement interval was 10 mK.
Figure 3.6.7: The SISTeR STFC RAL radiometer viewing the NPL blackbody maintained at
about 45 °C. The deviation of the SISTeR radiometer δT from the average blackbody
temperature over the measurement interval was 52 mK
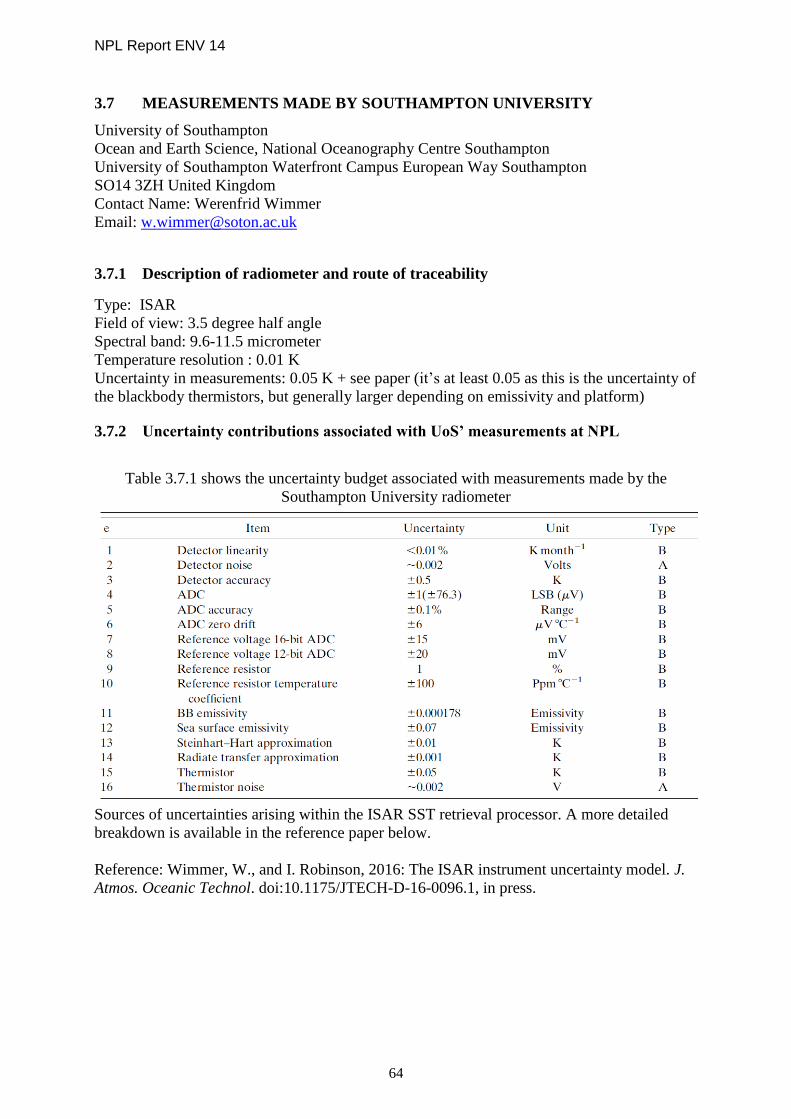
NPL Report ENV 14
64
3.7 MEASUREMENTS MADE BY SOUTHAMPTON UNIVERSITY
University of Southampton
Ocean and Earth Science, National Oceanography Centre Southampton
University of Southampton Waterfront Campus European Way Southampton
SO14 3ZH United Kingdom
Contact Name: Werenfrid Wimmer
Email: [email protected]
3.7.1 Description of radiometer and route of traceability
Type: ISAR
Field of view: 3.5 degree half angle
Spectral band: 9.6-11.5 micrometer
Temperature resolution : 0.01 K
Uncertainty in measurements: 0.05 K + see paper (it’s at least 0.05 as this is the uncertainty of
the blackbody thermistors, but generally larger depending on emissivity and platform)
3.7.2 Uncertainty contributions associated with UoS’ measurements at NPL
Table 3.7.1 shows the uncertainty budget associated with measurements made by the
Southampton University radiometer
Sources of uncertainties arising within the ISAR SST retrieval processor. A more detailed
breakdown is available in the reference paper below.
Reference: Wimmer, W., and I. Robinson, 2016: The ISAR instrument uncertainty model. J.
Atmos. Oceanic Technol. doi:10.1175/JTECH-D-16-0096.1, in press.

NPL Report ENV 14
65
3.7.3 Comparison of UoS ISAR to NPL reference blackbody
The photo below shows the UoS ISAR radiometer viewing the NPL reference blackbody.
The STFC RAL SISTeR radiometer viewing the NPL reference blackbody.
Figures 3.7.1 to 3.7.7 show the measurements completed by the University of Southampton
radiometer ISAR 5D when it was viewing the NPL blackbody maintained at different
temperatures. The uncertainty bars shown in orange in the Figures represent the uncertainty
values provided by UoS which correspond to the measurements shown in the Figures. Also
shown in blue in these Figures are the values of the brightness temperature of the NPL reference
blackbody along with their combined uncertainty values.

NPL Report ENV 14
66
Figure 3.7.1: The University of Southampton ISAR radiometer viewing the NPL blackbody
maintained at about -30 °C. The deviation of the ISAR radiometer from the average
blackbody temperature over the measurement interval was 1313 mK
Figure 3.7.2: The University of Southampton ISAR radiometer viewing the NPL blackbody
maintained at about -15 °C. The deviation of the ISAR radiometer from the average
blackbody temperature over the measurement interval was 433 mK.

NPL Report ENV 14
67
Figure 3.7.3: The University of Southampton ISAR radiometer viewing the NPL blackbody
maintained at about 0 °C. The deviation of the ISAR radiometer from the average blackbody
temperature over the measurement interval was 186 mK.
Figure 3.7.4: The University of Southampton ISAR radiometer viewing the NPL blackbody
maintained at about 10 °C. The deviation of the ISAR radiometer from the average blackbody
temperature over the measurement interval was 112 mK.

NPL Report ENV 14
68
Figure 3.7.5: The University of Southampton ISAR radiometer viewing the NPL blackbody
maintained at about 20 °C. The deviation of the ISAR radiometer from the average blackbody
temperature over the measurement interval was 77 mK.
Figure 3.7.6: The University of Southampton ISAR radiometer viewing the NPL blackbody
maintained at about 30 °C. The deviation of the ISAR radiometer from the average blackbody
temperature over the measurement interval was 1 mK.

NPL Report ENV 14
69
Figure 3.7.7: The University of Southampton ISAR radiometer viewing the NPL blackbody
maintained at about 45 °C. The deviation of the ISAR radiometer from the average blackbody
temperature over the measurement interval was 11 mK.
3.8 MEASUREMENTS MADE BY DMI
Danish Meteorological Institute
Centre for Ocean and Ice, Lyngbyvej 100, 2100 København Ø
Contact Name: Jacob Høyer
Email: [email protected]
3.8.1 Description of radiometers and route of traceability
3.8.1.1 Radiometer ISAR
Make and type of Radiometer: ISAR
The DMI TIR is an ISAR-5D, build by NOCS in 2012.
Outline Technical description of instrument: The radiometer is a self-calibrating radiometer,
see Donlon, C., Robinson, I. S., Wimmer, W., Fisher, G., Reynolds, M., Edwards, R., &
Nightingale, T. J. (2008). “An infrared sea surface temperature autonomous radiometer (ISAR)
for deployment aboard volunteer observing ships (VOS)”. Journal of Atmospheric and Oceanic
Technology, 25(1), 93-113.
Establishment or traceability route for primary calibration including date of last
realisation and breakdown of uncertainty: The ISARS have been calibrated using the
CASOTS blackbody, similar to the procedures used by Fred Wimmer, NOCS.

NPL Report ENV 14
70
Operational methodology during measurement campaign:
The operational procedure for the DMI ISAR is to perform a calibration with the CASOTS
blackbody, before and after any deployment over ice or water.
Radiometer usage (deployment), previous use of instrument and planned applications.
The DMI ISAR has been deployed at ships between Denmark and Greenland to observe SST.
In addition, the DMI ISAR has participated in several field campaigns in the Arctic, to perform
Ice surface temperature radiometer observations. The DMI ISAR has participated in the IST
FICE campaign in March-April 2016.
3.8.1.2 Radiometer IR120
Make and type of Radiometer: Cambell Scientific IR120
The DMI IR120 was purchased from Cambell Scientific
Outline Technical description of instrument:
The radiometer is a broadband radiometer measuring within 8-14 µm with a 20 degree aperture.
See: https://s.campbellsci.com/documents/eu/manuals/ir100_ir120.pdf
Establishment or traceability route for primary calibration including date of last
realisation and breakdown of uncertainty:
The IR120 has been calibrated using the CASOTS blackbody.
Operational methodology during measurement campaign:
The operational procedure for the IR120 is to perform a calibration with the CASOTS, before
and after any deployment over ice or water.
Radiometer usage (deployment), previous use of instrument and planned applications. The IR120 has been used for several ice campaigns in Greenland and a similar instrument has
been mounted on an automatic weather stations deployed From January-June 2015 and 2016
3.8.2 Uncertainty contributions associated with DMI’s measurements at NPL
3.8.2.1 Uncertainty contributions ISAR
Table 3.8.1 shows the uncertainty budget associated with measurements made by the DMI
ISAR radiometer.

NPL Report ENV 14
71
Table 3.8.1 shows the uncertainty budget associated with measurements made by the DMI radiometer.
Sources of uncertainties arising within the ISAR SST retrieval processor. A more detailed
breakdown is available in the reference paper below.
Reference: Wimmer, W., and I. Robinson, 2016: The ISAR instrument uncertainty model. J. Atmos.
Oceanic Technol. doi:10.1175/JTECH-D-16-0096.1, in press.
3.8.2.2 Camber Scientific IR120 radiometer
Aperture: 20 degrees.
Spectral band: 8-14 μm
Temperature resolution: ±0.01 °C
Uncertainty in measurement: ±0.2 °C
Typical Noise level at datalogger 0.05 °C RMS
3.8.3 Comparison of DMI’s radiometers to the NPL reference blackbody.
3.8.3.1 Comparison of ISAR to the NPL reference blackbody
Figures 3.8.1 to 3.8.6 show the measurements completed by the DMI radiometer ISAR when it
was viewing the NPL blackbody maintained at different temperatures. The uncertainty bars
shown in orange in the Figures represent the uncertainty values provided by DMI which
correspond to the measurements shown in the Figures. Also shown in blue in these Figures are
the values of the brightness temperature of the NPL reference blackbody along with their
combined uncertainty values.
Due to a limited schedule, a reliable temperature measurement was not made by DMI for the
nominal temperature of -30 °C.

NPL Report ENV 14
72
Figure 3.8.1: The DMI radiometer ISAR viewing the NPL blackbody maintained at -15 °C.
The deviation of the ISAR radiometer from the average blackbody temperature over the
measurement interval was 52 mK.
Figure 3.8.2: The DMI radiometer ISAR viewing the NPL blackbody maintained at 0 °C. The
deviation of the ISAR radiometer from the average blackbody temperature over the
measurement interval was 144 mK.

NPL Report ENV 14
73
Figure 3.8.3: The DMI radiometer ISAR viewing the NPL blackbody maintained at 10 °C.
The deviation of the ISAR radiometer from the average blackbody temperature over the
measurement interval was 34 mK.
Figure 3.8.4: The DMI radiometer ISAR viewing the NPL blackbody maintained at 2 0°C.
The deviation of the ISAR radiometer from the average blackbody temperature over the
measurement interval was 108 mK.

NPL Report ENV 14
74
Figure 3.8.5: The DMI radiometer ISAR viewing the NPL blackbody maintained at 30 °C.
The deviation of the ISAR radiometer from the average blackbody temperature over the
measurement interval was 57 mK.
Figure 3.8.6: The DMI radiometer ISAR viewing the NPL blackbody maintained at 45 °C.
The deviation of the ISAR radiometer from the average blackbody temperature over the
measurement interval was 37 mK.

NPL Report ENV 14
75
3.8.3.2 Comparison of IR120 radiometer to NPL reference blackbody
Figures 3.8.7, 3.8.8 and 3.8.9 show the measurements completed by the DMI radiometer IR120
when it was viewing the NPL blackbody maintained at different temperatures. The uncertainty
bars shown in orange in the figures represent the uncertainty values provided by DMI which
correspond to the measurements shown in the Figures. Also shown in blue in these Figures are
the values of the brightness temperature of the NPL reference blackbody along with their
combined uncertainty values.
Due to technical faults and a limited schedule, DMI were only able to make reliable temperature
measurements of nominal blackbody temperatures of 10 °C, 20 °C and 30 °C using the IR120
radiometer.
Figure 3.8.7: The DMI radiometer IR120 viewing the NPL blackbody maintained at 10 °C.
The deviation of the ISAR radiometer from the average blackbody temperature over the
measurement interval was 1195 mK.

NPL Report ENV 14
76
Figure 3.8.8: The DMI radiometer IR120 viewing the NPL blackbody maintained at 20 °C.
The deviation of the ISAR radiometer from the average blackbody temperature over the
measurement interval was 301 mK.
Figure 3.8.9: The DMI radiometer IR120 viewing the NPL blackbody maintained at 30 °C.
The deviation of the ISAR radiometer from the average blackbody temperature over the
measurement interval was 664 mK.

NPL Report ENV 14
77
3.8.4 Additional comments from DMI regarding the radiometer lab comparison
DMI provided the following comments regarding the performance of their ISAR radiometer:
“We have discovered issues with one of our reference thermistors on the blackbody. It appears
to have an offset at some time and have an enhanced variability at other times. This is a serious
issue, as this is used to reference the KT15 target observations. It looks like it needs a hardware
update. In any case, the DMI ISAR data should be used with care and a note to go with them.
In addition, note that the radiometer performance for extreme target temperatures, relative to
ambient may be degraded. Usually, the ambient temperature in e.g. ice experiments is similar
to IST when measuring cold ice surfaces. This makes the ambient and heated blackbodies much
more representable when correcting the measured brightness temperatures. We deliver total
uncertainties based on the processing software provided by Werenfrid Wimmer of the
University of Southampton”.
3.9 MEASUREMENTS MADE BY OUC, QINGDAO
Ocean University of China
238 Songling Road, Qingdao, 266100, China
Contact Name: Kailin Zhang
Email: [email protected]
3.9.1 Description of radiometers and route of traceability
3.9.1.1 The ISAR Radiometer
Make and type of Radiometer
Infrared Sea Surface Temperature Autonomous Radiometer (ISAR)
Outline Technical description of the radiometer:
Detector: Heitronics KT15.85 IIP 8115, Spectral bands: 9.6 µm to 11.5µm,
Calibration type: two internal blackbody (BB) cavities (Donlon et al. 2008)
Establishment or traceability route for primary calibration including date of last
realisation and breakdown of uncertainty:
ISAR has undergone primary calibration by the manufacturer. Re-calibrations are performed
before and after each measurement campaign using the blackbody manufactured by LR TECH
INC. The overall uncertainty of ISAR is about 0.1 K. (Donlon et al. 2008; Wimmer et al. 2016)
Operational methodology during measurement campaign:
ISAR measures both the sea surface radiance and the downwelling atmosphere radiance which
are calibrated by two reference blackbody cavities. During one measuring cycle, ISAR
measures the ambient blackbody 30 times, the heated blackbody 30 times, the sky 10 times and

NPL Report ENV 14
78
the sea 40 times. Using the self-calibration system in ISAR, SST is calculated for each
measuring cycle (Donlon at al. 2008).
Radiometer usage (deployment), previous use of instrument and planned applications.
The ISAR has been deployed on the research vessel Dong Fang Hong II of Ocean University
of China and continuously operating mainly in the China Seas since 2009.
References:
Donlon, C. J., I. S. Robinson, M. Reynolds, W. Wimmer, G. Fisher, R. Edwards, and T. J.
Nightingale, 2008: An Infrared Sea Surface Temperature Autonomous Radiometer (ISAR) for
Deployment aboard Volunteer Observing Ships (VOS), J. Atmos. Oceanic Technol., 25, 93-
113.
Wimmer, W., and I. Robinson, 2016: The ISAR instrument uncertainty model. J. Atmos.
Oceanic Technol. doi:10.1175/JTECH-D-16-0096.1, in press.
3.9.1.2 The OUCFIRST Radiometer
Make and type of Radiometer
Ocean University of China First Infrared Radiometer for measurements of Sea Surface
Temperature (OUCFIRST)
Outline Technical description of instrument:
Detector: Heitronics KT15.85 IIP 9928, Spectral bands: 9.6 µm to 11.5µm,
Calibration type: 2 internal blackbody (BB) cavities
Establishment or traceability route for primary calibration including date of last
realisation and breakdown of uncertainty:
OUCFIRST is calibrated before and after each measurement campaign using the blackbody
manufactured by LR TECH INC. The overall uncertainty of OUCFIRST is about 0.1 K.
Operational methodology during measurement campaign:
OUCFIRST has two measurement modes, one for lab calibration and the other one for outdoor
measurement. For lab calibration, OUCFIRST measures the ambient blackbody 30 times, the
heated blackbody 30 times and target blackbody 40 times. For outdoor mode, OUCFIRST
measures the ambient blackbody 30 times, the heated blackbody 30 times, the sky 10 times and
the sea 40 times. Using the self-calibration system in OUCFIRST, SST is calculated for each
measuring cycle.

NPL Report ENV 14
79
Radiometer usage (deployment), previous use of instrument and planned applications. OUCFIRST is now under testing and has been deployed on the research vessel Dong Fang
Hong II of Ocean University of China and operated for three campaigns in the China Seas in
2015 and 2016.
3.9.2 Uncertainty contributions associated with OUC’s measurements at NPL
3.9.2.1 Uncertainty contributions ISAR
Table 3.9.1 shows the uncertainty budget associated with measurements made by the ISAR
OUC radiometer.
Table 3.9.1: The uncertainty budget associated with measurements made by the OUC
radiometer
Sources of uncertainties arising within the ISAR SST retrieval processor. A more detailed
breakdown is available in the reference paper: Wimmer, W., and I. Robinson, 2016: The ISAR
instrument uncertainty model. J. Atmos. Oceanic Technol. doi:10.1175/JTECH-D-16-0096.1,
in press.

NPL Report ENV 14
80
3.9.2.2 Uncertainty contributions OUCFIRST
Uncertainty Contribution Type A
Uncertainty in
Value / %
Type B
Uncertainty in
Value /
(appropriate
units)
Uncertainty in
Brightness temperature
K
Repeatability of
measurement(1)
Reproducibility of
measurement(2)
Primary calibration(3)
0.023 K
/0.008%
0.009 K
/0.003%
0.12 K
0.023 K
0.009 K
0.12 K
RMS total
0.025 K
/0.008% 4 0.12 K 0.12 K
(1) Typical value of the standard deviation of 143 measurements at fixed black body temperature without
re-alignment of radiometer.
(2) Typical value of difference between two runs of radiometer measurements at the same black body
temperature including re-alignment.
(3) Typical value of difference between radiometer brightness temperature and ASSIST II Blackbody
temperature.
3.9.3 Comparison of OUC’s radiometers to the NPL reference blackbody
3.9.3.1 Comparison of ISAR to the NPL reference blackbody
Figures 3.9.1 to 3.9.7 show the measurements completed by the OUC ISAR radiometer when
it was viewing the NPL blackbody maintained at different temperatures. The uncertainty bars
shown in orange in the Figures represent the uncertainty values provided by OUC which
correspond to the measurements shown in the Figures. Also shown in blue in these Figures are
the values of the brightness temperature of the NPL reference blackbody along with their
combined uncertainty values.

NPL Report ENV 14
81
Figure 3.9.1: Measurements of the OUC ISAR radiometer when it was viewing the NPL
blackbody maintained at about -30 °C. The deviation of the ISAR radiometer from the
average blackbody temperature over the measurement interval was 2413 mK
Figure 3.9.2: Measurements of the OUC ISAR radiometer when it was viewing the NPL
blackbody maintained at about -15 °C. The deviation of the ISAR radiometer from the
average blackbody temperature over the measurement interval was 515 mK

NPL Report ENV 14
82
Figure 3.9.3: Measurements of the OUC ISAR radiometer when it was viewing the NPL
blackbody maintained at about 0 °C. The deviation of the ISAR radiometer from the average
blackbody temperature over the measurement interval was 229 mK.
Figure 3.9.4: Measurements of the OUC ISAR radiometer when it was viewing the NPL
blackbody maintained at about 10 °C. The deviation of the ISAR radiometer from the average
blackbody temperature over the measurement interval was 157 mK.

NPL Report ENV 14
83
Figure 3.9.5: Measurements of the OUC ISAR radiometer when it was viewing the NPL
blackbody maintained at about 20 °C. The deviation of the ISAR radiometer from the average
blackbody temperature over the measurement interval was 71 mK
Figure 3.9.6: Measurements of the OUC ISAR radiometer when it was viewing the NPL
blackbody maintained at about 30 °C. The deviation of the ISAR radiometer from the average
blackbody temperature over the measurement interval was 94 mK.

NPL Report ENV 14
84
Figure 3.9.7: Measurements of the OUC ISAR radiometer when it was viewing the NPL
blackbody maintained at about 45 °C. The deviation of the ISAR radiometer from the average
blackbody temperature over the measurement interval was 728 mK.
3.9.3.2 Comparison of OUCFIRST radiometer to the NPL reference blackbody.
The photo below shows the OUCFIRST radiometer viewing the NPL reference blackbody.

NPL Report ENV 14
85
The OUCFIRST radiometer viewing the NPL reference blackbody
Figures 3.9.8 to 3.9.14 show the measurements completed by the OUCFIRST radiometer when
it was viewing the NPL blackbody maintained at different temperatures. The uncertainty bars
shown in orange in the figures represent the uncertainty values provided by OUC which
correspond to the measurements shown in the Figures. Also shown in blue in these Figures are
the values of the brightness temperature of the NPL reference blackbody along with their
combined uncertainty values.
Figure 3.9.8: Measurements of the OUCFIRST radiometer when it was viewing the NPL
blackbody maintained at about -30 °C. The deviation of the OUC radiometer from the average
blackbody temperature over the measurement interval was 538 mK.

NPL Report ENV 14
86
Figure 3.9.9: Measurements of the OUCFIRST radiometer when it was viewing the NPL
blackbody maintained at about -15 °C. The deviation of the OUC radiometer from the average
blackbody temperature over the measurement interval was 102 mK.
Figure 3.9.10: Measurements of the OUCFIRST radiometer when it was viewing the NPL
blackbody maintained at about 0 °C. The deviation of the OUC radiometer from the average
blackbody temperature over the measurement interval was 125 mK.
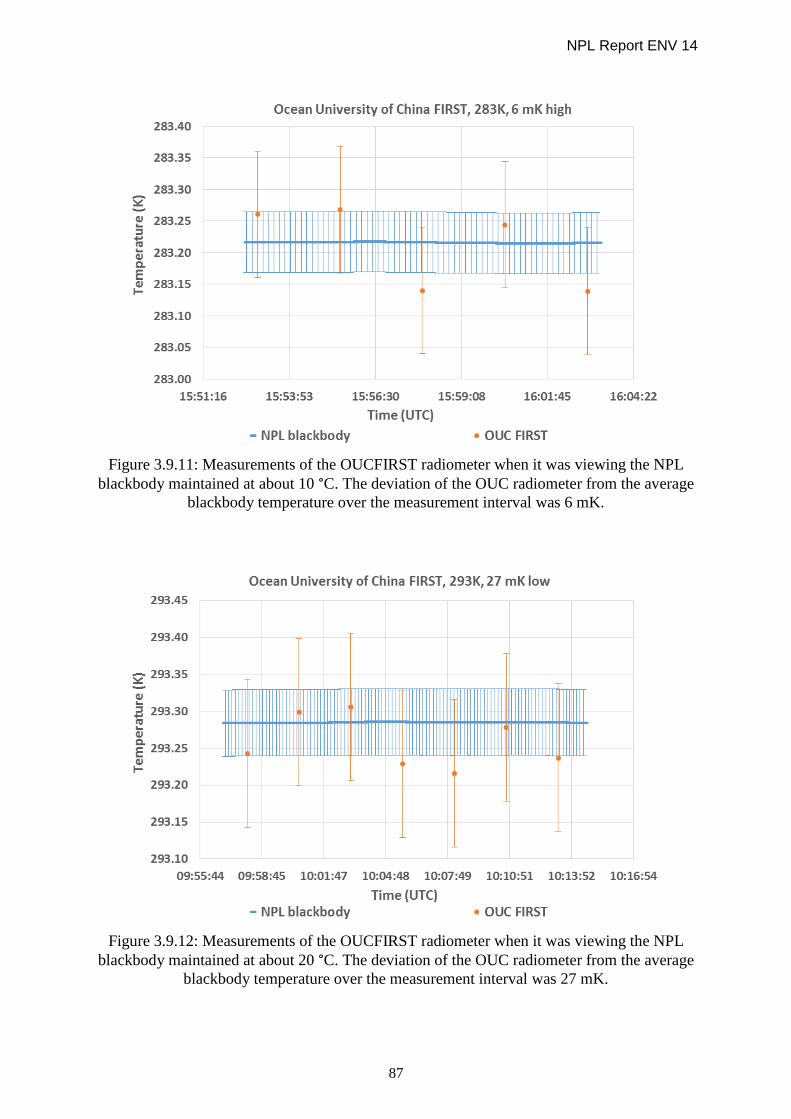
NPL Report ENV 14
87
Figure 3.9.11: Measurements of the OUCFIRST radiometer when it was viewing the NPL
blackbody maintained at about 10 °C. The deviation of the OUC radiometer from the average
blackbody temperature over the measurement interval was 6 mK.
Figure 3.9.12: Measurements of the OUCFIRST radiometer when it was viewing the NPL
blackbody maintained at about 20 °C. The deviation of the OUC radiometer from the average
blackbody temperature over the measurement interval was 27 mK.

NPL Report ENV 14
88
Figure 3.9.13: Measurements of the OUCFIRST radiometer when it was viewing the NPL
blackbody maintained at about 30 °C. The deviation of the OUC radiometer from the average
blackbody temperature over the measurement interval was 22 mK.
Figure 3.9.14: Measurements of the OUCFIRST radiometer when it was viewing the NPL
blackbody maintained at about 45 °C. The deviation of the OUC radiometer from the average
blackbody temperature over the measurement interval was 18 mK.

NPL Report ENV 14
89
3.10 MEASUREMENTS MADE BY GOTA
Grupo de Observacion de la Tierra y la Atmosfera (GOTA)
Departamento de Física Fundamental Experimental, Electrónica Sistemas Universidad de La Laguna Avda. Astrofísico Fco. Sanchez s/n 38200 La Laguna Tenerife,
Canarias, Spain.
Contact Name: Manuel Arbelo
Email: [email protected]
3.10.1 Description of radiometer and route of traceability
Make and type of Radiometer: CIMEL Electronique CE312-2
Outline Technical description of instrument:
Type of detector: thermopile. 6 spectral bands: B1 8-13 μm, B2 11.0-11.7 μm, B3 10.3-11.0
μm, B4 8.9-9.3 μm, B5 8.5-8.9 μm, and B6 8.1-8.5 μm. The spectral characterisation of the
instrument can be found in references 1, 2 and 3. Broad band: Germanium window and zinc
sulphide filters. Narrow bands: interference filters. Field of view: 10º. The radiometer has a
built-in radiance reference made of a concealable gold-coated mirror which enables comparison
between the target radiance and the reference radiation from inside the detector cavity. The
temperature of the detector is measured with a PRT, thus allowing compensation for the cavity
radiation.
References:
1. Sicard, M., Spyak, P. R., Brogniez, G., Legrand, M., Abuhassan, N. K., Pietras, C.,
and Buis, J. P. (1999). Thermal infrared field radiometer for vicarious cross-
calibration: characterization and comparisons with other field instruments. Optical
Engineering, 38 (2), 345-356.
2. M. Legrand, C. Pietras, G. Brogniez, M. Haeffelin, N. K. Abuhassan and M. Sicard
(2000). A high accuracy multiwavelength radiometer for in situ measurements in the
thermal infrared. Part I: characterization of the instrument, J. Atmos. Ocean Techn.,
17, 1203-1214.
3. http://www.cimel.fr/?instrument=radiometer-ir-climat-benchmark&lang=en
Establishment or traceability route for primary calibration including date of last
realisation and breakdown of uncertainty: The radiometer has not undergone a traceable
primary calibration. The following uncertainty analysis was based on estimates, experience and
laboratory measurements with our Landcal Blackbody Source P80P (May 23 to 26, 2016).
Type A
- Repeatability: typical value of the standard deviation of 10 measurements at fixed black body
temperature without re-alignment of radiometer.
B1 B2 B3 B4 B5 B6 Mean
K 0.04 0.10 0.09 0.09 0.11 0.10 0.09
% 0.01 0.03 0.04 0.03 0.04 0.04 0.03

NPL Report ENV 14
90
- Reproducibility: typical value of difference between two runs of radiometer measurements at
the same black body temperature including re-alignment.
B1 B2 B3 B4 B5 B6 Mean
K 0.05 0.02 0.03 0.03 0.04 0.03 0.03
% 0.01 0.01 0.01 0.01 0.01 0.01 0.01
Total Type A uncertainty (RSS):
B1 B2 B3 B4 B5 B6 Mean
K 0.06 0.10 0.09 0.09 0.12 0.10 0.09
% 0.01 0.03 0.04 0.03 0.04 0.04 0.03
Type B
- Linearity of radiometer: within temperature range of 278-303 K.
B1 B2 B3 B4 B5 B6 Mean
K 0.09 0.11 0.10 0.10 0.11 0.10 0.10
- Primary calibration: typical value of difference between radiometer brightness temperature
and Landcal Blackbody Source P80P temperature.
B1 B2 B3 B4 B5 B6 Mean
K 0.9 0.4 0.3 0.4 0.3 0.2 0.4
- Drift since calibration: 0.0 K (as expected since very recent calibration measurements).
- Ambient temperature fluctuations: 0.3 K
- Size-of-Source Effect: not considered
- Atmospheric absorption/emission: not considered
Total Type B uncertainty (RSS):
B1 B2 B3 B4 B5 B6 Mean
K 0.9 0.5 0.4 0.5 0.4 0.4 0.5
Type A + Type B uncertainty (RSS): 0.5 K

NPL Report ENV 14
91
Operational methodology during measurement campaign: Calibration measurements were
performed in the laboratory following, as close as possible, the procedures described in the
Draft Protocol. The Landcal Blackbody Source P80P was set at four temperatures (278 K,
283 K, 293 K and 303 K) in two different runs. Enough time was allowed for the black body to
reach equilibrium at each temperature. Radiometer was aligned with the black body cavity, and
placed at a distance so that the field of view was smaller than the cavity diameter. Standard
processing (see references above) was applied to the radiometer readouts to calculate the
equivalent brightness temperature. The six bands of the CE312-2 instrument were used.
Radiometer usage (deployment), previous use of instrument and planned applications. Field measurements (hand held and tripod mounted) of land and sea surface
temperature/emissivity. Validation of thermal infrared images from satellite sensors in Canary
Islands as well as laboratory measurements of soil and vegetation emissivity. Planned validation
of thermal infrared images from cameras on board UAVs in forest and crops in Macaronesian
region.
3.10.2 Uncertainty contributions associated with GOTA’s measurements at NPL
Uncertainty Contribution Type A
Uncertainty in
Value / %
Type B
Uncertainty
in Value /
(appropriate
units)
Uncertainty in
Brightness
temperature
K
Repeatability of
measurement
Reproducibility of
measurement
Primary calibration
Linearity of radiometer
Drift since calibration
Ambient temperature
fluctuations
Size-of-Source Effect
Atmospheric
absorption/emission
0.03%
0.01%
0.4 K
0.10 K
-
0.3 K
-
-
0.09 K
0.03 K
0.4 K
0.1 K
-
0.3 K
-
-
RMS total 0.03% / 0.09 K 0.5 K 0.5 K
Mean values for six bands (B1 - B6) are shown. Values for each band are in section 3.10.1.

NPL Report ENV 14
92
3.10.3 Comparison of CE312-2 to NPL reference blackbody
Figures 3.10.1 to 3.10.7 show the measurements completed by the GOTA radiometer CIMEL
Electronique CE312-2 when it was viewing the NPL blackbody maintained at different
temperatures. The uncertainty bars, shown in orange, in the figures represent the uncertainty
values provided by GOTA which correspond to the measurements shown in the Figures. Also
shown in blue in these Figures are the values of the brightness temperature of the NPL reference
blackbody along with their combined uncertainty values.
Figure 3.10.1: Measurements of the GOTA CIMEL CE312-2 radiometer viewing the NPL
blackbody maintained at about -30 °C.
Table 3.10.1 shown below, indicates the deviation δT of the different radiometer channels from
the average blackbody temperature, over the measurement interval for a nominal blackbody
temperature of -30 °C.
Table 3.10.1: The deviation of the different radiometer channels δT from the average
blackbody temperature, over the measurement interval for a nominal blackbody temperature
of -30 °C.
Channel (μm) δT (mK) 11.0-11.7 2632
10.3-11.0 2182
8.9-9.3 2645
8.5-8.9 2248
8.1-8.5 2670

NPL Report ENV 14
93
Figure 3.10.2: Measurements of the GOTA CIMEL CE312-2 radiometer viewing the NPL
blackbody maintained at about -15 °C.
Table 3.10.2, shown below, indicates the deviation of the different radiometer channels δT from
the average blackbody temperature, over the measurement interval for a nominal blackbody
temperature of -15 °C.
Table 3.10.2: The deviation of the different radiometer channels δT from the average
blackbody temperature, over the measurement interval for a nominal blackbody temperature
of -15 °C.
Channel (μm) δT (mK) 11.0-11.7 966
10.3-11.0 791
8.9-9.3 1055
8.5-8.9 996
8.1-8.5 998

NPL Report ENV 14
94
Figure 3.10.3: Measurements of the GOTA CIMEL CE312-2 radiometer viewing the NPL
blackbody maintained at about 0 °C.
Table 3.10.3, shown below, indicates the deviation of the different radiometer channels δT from
the average blackbody temperature, over the measurement interval for a nominal blackbody
temperature of 0 °C.
Table 3.10.3: The deviation of the different radiometer channels δT from the average
blackbody temperature, over the measurement interval for a nominal blackbody temperature
of 0 °C.
Channel (μm) δT (mK) 11.0-11.7 589
10.3-11.0 593
8.9-9.3 552
8.5-8.9 207
8.1-8.5 596

NPL Report ENV 14
95
Figure 3.10.4: Measurements of the GOTA CIMEL CE312-2 radiometer viewing the NPL
blackbody maintained at about 10°C.
Table 3.10.4, shown below, indicates the deviation of the different radiometer channels δT from
the average blackbody temperature, over the measurement interval for a nominal blackbody
temperature of 10 °C.
Table 3.10.4: The deviation of the different radiometer channels δT from the average
blackbody temperature, over the measurement interval for a nominal blackbody temperature
of 10 °C.
Channel (μm) δT (mK) 11.0-11.7 599
10.3-11.0 432
8.9-9.3 572
8.5-8.9 255
8.1-8.5 184

NPL Report ENV 14
96
Figure 3.10.5: Measurements of the GOTA CIMEL CE312-2 radiometer viewing the NPL
blackbody maintained at about 20°C.
Table 3.10.5, shown below, indicates the deviation of the different radiometer channels δT from
the average blackbody temperature, over the measurement interval for a nominal blackbody
temperature of 20 °C.
Table 3.10.5: The deviation of the different radiometer channels δT from the average
blackbody temperature, over the measurement interval for a nominal blackbody temperature
of 20 °C.
Channel (μm) δT (mK) 11.0-11.7 255
10.3-11.0 257
8.9-9.3 276
8.5-8.9 297
8.1-8.5 287
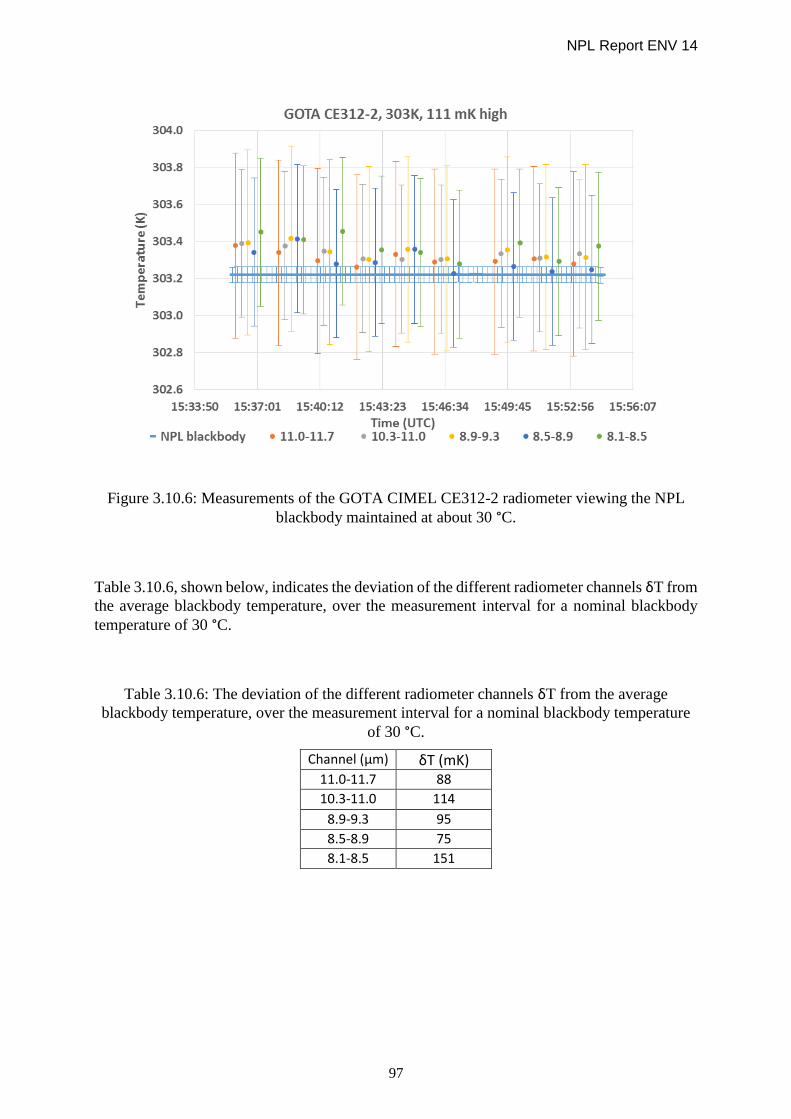
NPL Report ENV 14
97
Figure 3.10.6: Measurements of the GOTA CIMEL CE312-2 radiometer viewing the NPL
blackbody maintained at about 30 °C.
Table 3.10.6, shown below, indicates the deviation of the different radiometer channels δT from
the average blackbody temperature, over the measurement interval for a nominal blackbody
temperature of 30 °C.
Table 3.10.6: The deviation of the different radiometer channels δT from the average
blackbody temperature, over the measurement interval for a nominal blackbody temperature
of 30 °C.
Channel (μm) δT (mK) 11.0-11.7 88
10.3-11.0 114
8.9-9.3 95
8.5-8.9 75
8.1-8.5 151

NPL Report ENV 14
98
Figure 3.10.7: Measurements of the GOTA CIMEL CE312-2 radiometer viewing the NPL
blackbody maintained at about 45 °C.
Table 3.10.7, shown below, indicates the deviation of the different radiometer channels δT from
the average blackbody temperature, over the measurement interval for a nominal blackbody
temperature of 45 °C.
Table 3.10.7: The deviation of the different radiometer channels δT from the average
blackbody temperature, over the measurement interval for a nominal blackbody temperature
of 45 °C.
Channel (μm) δT (mK) 11.0-11.7 48
10.3-11.0 43
8.9-9.3 31
8.5-8.9 178
8.1-8.5 206

NPL Report ENV 14
99
3.11 MEASUREMENTS MADE BY RSMAS, UNIVERSITY OF MIAMI
Institute/organisation: Rosenstiel School of Marine and Atmospheric Science
University of Miami, 4600 Rickenbacker Causeway,
Miami, FL 33149, USA Contact Name: Prof. Peter Minnett
Email: [email protected]
3.11.1 Description of radiometer and route of traceability
Type: M-AERI Mk2/3 (ASIST)
Field of view: 22.5 mrad half angle
Spectral band: 525 – 3300 cm-1
Entrance aperture: 25 mm
Spectral resolution: 0.5 cm-1
Digitizer resolution: 16-bit
Radiance resolution: < 0.05 mW/ (m2 sr cm-1)
Temperature resolution: 0.005 K
The Marine-Atmospheric Emitted Radiance Interferometers (M-AERI) are a series of Fourier-
Transform Infrared Spectroradiometers. The first generation instruments were developed in the
mid-1990’s and these were replaced by Mk-2 instruments beginning in 2010. A Mk-3
instrument was delivered in 2013, and it was this instrument that was used in the FRM4STS
Workshop at the NPL in June 2016. All versions of the instrument use a Michelson-Morley
interferometer design with the path differences being generated by an oscillating yoke with a
corner-cube reflector on each arm. Wavenumber calibration is accomplished using a HeNe laser
that sends monochromatic light through the interferometer. Radiometric calibration achieved
by using two blackbody cavities at known temperatures, at each of which the field of view of
the interferometer is directed sequentially before and after scene measurements. The M-AERIs
use two detectors, one of InSb and the other of HgCdTe, to achieve the broad spectral range;
the detectors are chilled to ~77 K (~boiling point of liquid N2) by Stirling Cycle mechanical
coolers. The M-AERIs operate under computer control.
The M-AERI Mk2s are much smaller than the first generation instruments, and the Mk3 is
smaller again, this being achieved by smaller optics and more compact electronics and computer
modules.
The errors and uncertainties in the internal radiometric calibration procedure are frequently
checked, usually before and after each ship deployment, using a laboratory blackbody target
that is a thin copper cone paint matt black immersed in a water-bath which can be stabilized
and desired temperatures. Two precision thermistors with SI-traceable calibration are used to
monitor the water bath temperatures.
Uncertainties in the measurement are wavelength dependent and the Tables below are for two
selected wavenumbers that we use most frequently in our measurements.
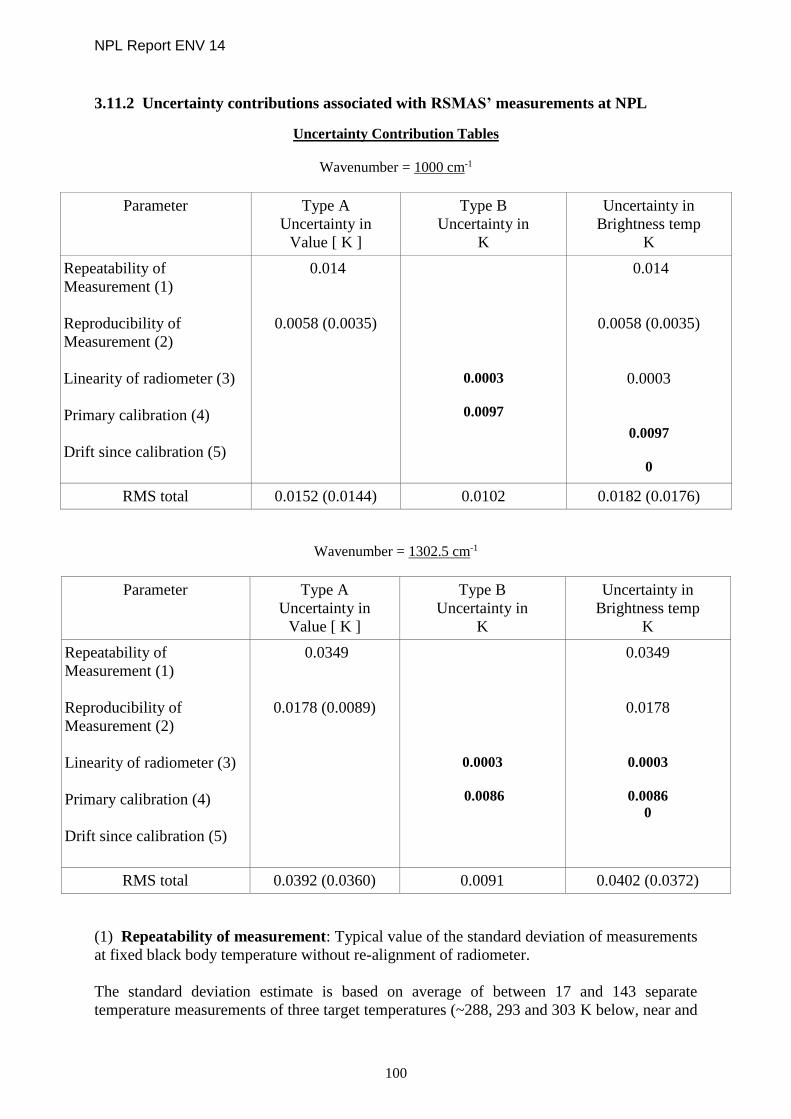
NPL Report ENV 14
100
3.11.2 Uncertainty contributions associated with RSMAS’ measurements at NPL
Uncertainty Contribution Tables
Wavenumber = 1000 cm-1
Parameter Type A
Uncertainty in
Value [ K ]
Type B
Uncertainty in
K
Uncertainty in
Brightness temp
K
Repeatability of
Measurement (1)
Reproducibility of
Measurement (2)
Linearity of radiometer (3)
Primary calibration (4)
Drift since calibration (5)
0.014
0.0058 (0.0035)
0.0003
0.0097
0.014
0.0058 (0.0035)
0.0003
0.0097
0
RMS total 0.0152 (0.0144) 0.0102 0.0182 (0.0176)
Wavenumber = 1302.5 cm-1
Parameter Type A
Uncertainty in
Value [ K ]
Type B
Uncertainty in
K
Uncertainty in
Brightness temp
K
Repeatability of Measurement (1)
Reproducibility of
Measurement (2)
Linearity of radiometer (3)
Primary calibration (4)
Drift since calibration (5)
0.0349
0.0178 (0.0089)
0.0003
0.0086
0.0349
0.0178
0.0003
0.0086
0
RMS total 0.0392 (0.0360) 0.0091 0.0402 (0.0372)
(1) Repeatability of measurement: Typical value of the standard deviation of measurements
at fixed black body temperature without re-alignment of radiometer.
The standard deviation estimate is based on average of between 17 and 143 separate
temperature measurements of three target temperatures (~288, 293 and 303 K below, near and

NPL Report ENV 14
101
above ambient temperature). Each measurement is an average of 46 spectra and the instrument
is internally calibrated before each measurement. One measurement cycle takes approximately
4 to 5 minutes.
(2) Reproducibility of measurement: Typical value of difference between two runs of
radiometer measurements at the same black body temperature including re-alignment.
We did not have the chance to set up the experiment to measure the reproducibility as described
above instead our reproducibility estimate is the typical value of difference between two
radiometer measurements at the same blackbody temperature obtained during two different
experiments both conducted in June 2016. The first experiment took place in RSMAS lab in
Miami before the instrument was shipped to London and the second one took place at NPL.
This estimate is likely too high as besides the alignment also the target temperature varied
slightly between the two experiments as did the ambient conditions. For comparison we
calculated for all runs in both experiments the differences between 1st and 2nd half of
measurement and an average of these is given in brackets (i.e. Reproducibility without the
change in alignment).
(3) Linearity of radiometer: uncertainty of a linear regression between the Miami Water-Bath
Blackbody temperatures and radiometer brightness temperatures.
(4) Primary calibration: Typical value of difference between radiometer brightness
temperatures and the Miami Water-Bath Blackbody temperatures. This depends of course on
the temperature of the target. The values we give are the average of the difference at three target
temperature ~288, 293 and 303 K.
(5) Drift estimate: We base our drift estimate on three consecutive calibration of the
instrument. The ambient conditions change from one measurement to another and if they are
not accounted for the ambient signal might obscure instrument drift. In the table below we show
the date of the measurement and the value of the difference between the target temperature and
the MAERI temperature corrected for the contribution of the ambient environment temperature
to the MAERI measurement. These values were obtained for the 1302.5 cm-1 wavenumber
near ambient target temperatures (to further minimize error due to the ambient temperature
contribution to the measurement). There is no systematic change in the Target – MAERIcorr
difference from one calibration to another.
Date of calibration Target – MAERIcorr
5th February 2016 (Miami) -0.0021
3rd June 2016 (Miami) -0.0025
23rs June 2016 (NPL) -0.0017

NPL Report ENV 14
102
3.11.3 Comparison of the RSMAS radiometer to NPL reference blackbody
The photo below shows the RSMAS radiometer viewing the NPL reference blackbody.
The RSMAS radiometer viewing the NPL reference blackbody.
Figures 3.11.1 to 3.11.7 show the measurements completed by the RSMAS radiometer when it
was viewing the NPL blackbody maintained at different temperatures. The uncertainty bars
shown in orange and grey in the figures represent the uncertainty values provided by RSMAS
which correspond to the measurements shown in the Figures. Also shown in blue in these
Figures are the values of the brightness temperature of the NPL reference blackbody along with
their combined uncertainty values.
Due to alignment issues and a limited schedule, no data was submitted by RSMAS for
measurements made at -30 °C or 20 °C blackbody temperatures.

NPL Report ENV 14
103
Figure 3.11.1: Measurements of the RSMAS radiometer viewing the NPL blackbody at about
-15 °C.
Table 3.11.1, shown below, indicates the deviation of the different RSMAS radiometer
channels δT from the average blackbody temperature, over the measurement interval for a
nominal blackbody temperature of -15 °C.
Table 3.11.1: The deviation of the two radiometer channels δT from the average blackbody
temperature, over the measurement interval for a nominal blackbody temperature of -15 °C.
Channel (cm-1) δT (mK) 1000 373
1302 390

NPL Report ENV 14
104
Figure 3.11.2: Measurements of the RSMAS radiometer viewing the NPL blackbody at about
0 °C.
Table 3.11.2, shown below, indicates the deviation δT of the different RSMAS radiometer
channels from the average blackbody temperature, over the measurement interval for a nominal
blackbody temperature of 0 °C.
Table 3.11.2: The deviation δT of the two radiometer channels from the average blackbody
temperature, over the measurement interval, for a nominal blackbody temperature of 0 °C.
Channel (cm-1) δT (mK) 1000 163
1302 153

NPL Report ENV 14
105
Figure 3.11.3: Measurements of the RSMAS radiometer viewing the NPL blackbody at about
10 °C.
Table 3.11.3, shown below, indicates the deviation δT of the different RSMAS radiometer
channels from the average blackbody temperature, over the measurement interval for a nominal
blackbody temperature of 10 °C.
Table 3.11.3: The deviation δT of the two radiometer channels from the average blackbody
temperature, over the measurement interval for a nominal blackbody temperature of 10 °C.
Channel (cm-1) δT (mK) 1000 74
1302 67

NPL Report ENV 14
106
Figure 3.11.4: Measurements of the RSMAS radiometer viewing the NPL blackbody at about
30°C.
Table 3.11.4, shown below, indicates the deviation δT of the different RSMAS radiometer
channels from the average blackbody temperature, over the measurement interval for a nominal
blackbody temperature of 30 °C.
Table 3.11.4: The deviation δT of the two radiometer channels from the average blackbody
temperature, over the measurement interval, for a nominal blackbody temperature of 30 °C.
Channel (cm-1) δT (mK) 1000 36
1302 31
303.14
303.16
303.18
303.20
303.22
303.24
303.26
303.28
303.30
16:48:00 19:12:00 21:36:00 00:00:00 02:24:00 04:48:00 07:12:00
Tem
per
atu
re (
K)
Time (UTC)
RSMAS, 303K, 33 mK low
NPL blackbody 1000 cm-1 1302 cm-1

NPL Report ENV 14
107
Figure 3.11.5: Measurements of the RSMAS radiometer viewing the NPL blackbody at about
45 °C.
Table 3.11.5, shown below, indicates the deviation δT of the different RSMAS radiometer
channels from the average blackbody temperature, over the measurement interval, for a nominal
blackbody temperature of 45 °C.
Table 3.11.5: The deviation δT of the two radiometer channels from the average blackbody
temperature, over the measurement interval, for a nominal blackbody temperature of 45 °C.
Channel (cm-1) δT (mK) 1000 93
1302 79
4 SUMMARY OF THE RESULTS
This section provides a summary of the results provided by the participants of the IR
comparison of brightness temperature of the reference (SI traceable) variable temperature
blackbody completed at NPL on the 20th June to the 24th June 2016. The following set of Tables
and Figures represent the measurements completed during this measurement campaign. It is
important to stress that the temperatures of the reference blackbody were nominal and not
necessarily perfectly stable. The uncertainty bars represent the standard uncertainty (k=1)
unless otherwise stated. Uncertainty bars are provided whenever these were available.
Table 4.1 shows the difference of the measurements completed by participants on the NPL
variable temperature blackbody from the blackbody temperature.

NPL Report ENV 14
108
Table 4.1: Summary of the difference of the measurements from the reference blackbody.
Set temperature (°C)
Diff. from NPL BB (mK)
Set temperature (°C)
Diff. from NPL BB (mK)
University of Valencia 45 -133 University of Valencia 45 -147
CE312-2 30 -51 CE312-2 30 -49
Unit 1 20 -9 Unit 2 20 0
10.54 µm 10 29 10.54 µm 10 36
0 80 0 79
-15 65 -15 94
-30 171 -30 441
University of Valencia 45 -81 University of Valencia 45 -97
CE312-2 30 -81 CE312-2 30 -59
Unit 1 20 -39 Unit 2 20 -20
11.30 µm 10 -31 11.30 µm 10 6
0 0 0 39
-15 68 -15 111
-30 293 -30 552
University of Valencia 45 -120 University of Valencia 45 -125
CE312-2 30 -101 CE312-2 30 -79
Unit 1 20 -59 Unit 2 20 -30
10.57 µm 10 9 10.57 µm 10 26
0 110 0 139
-15 293 -15 326
-30 819 -30 1004
University of Valencia 45 -203 University of Valencia 45 -165
CE312-2 30 -161 CE312-2 30 -119
Unit 1 20 -59 Unit 2 20 -50
9.14 µm 10 29 9.14 µm 10 46
0 220 0 259
-15 469 -15 581
-30 1398 -30 1782
University of Valencia 45 -193 University of Valencia 45 -219
CE312-2 30 -81 CE312-2 30 -89
Unit 1 20 -9 Unit 2 20 10
8.68 µm 10 49 8.68 µm 10 76
0 140 0 189
-15 209 -15 299
-30 583 -30 935
University of Valencia 45 -293 University of Valencia 45 -217
CE312-2 30 -211 CE312-2 30 -119
Unit 1 20 -79 Unit 2 20 -60
8.42 µm 10 59 8.42 µm 10 86
0 280 0 349
-15 611 -15 726
-30 1798 -30 2126
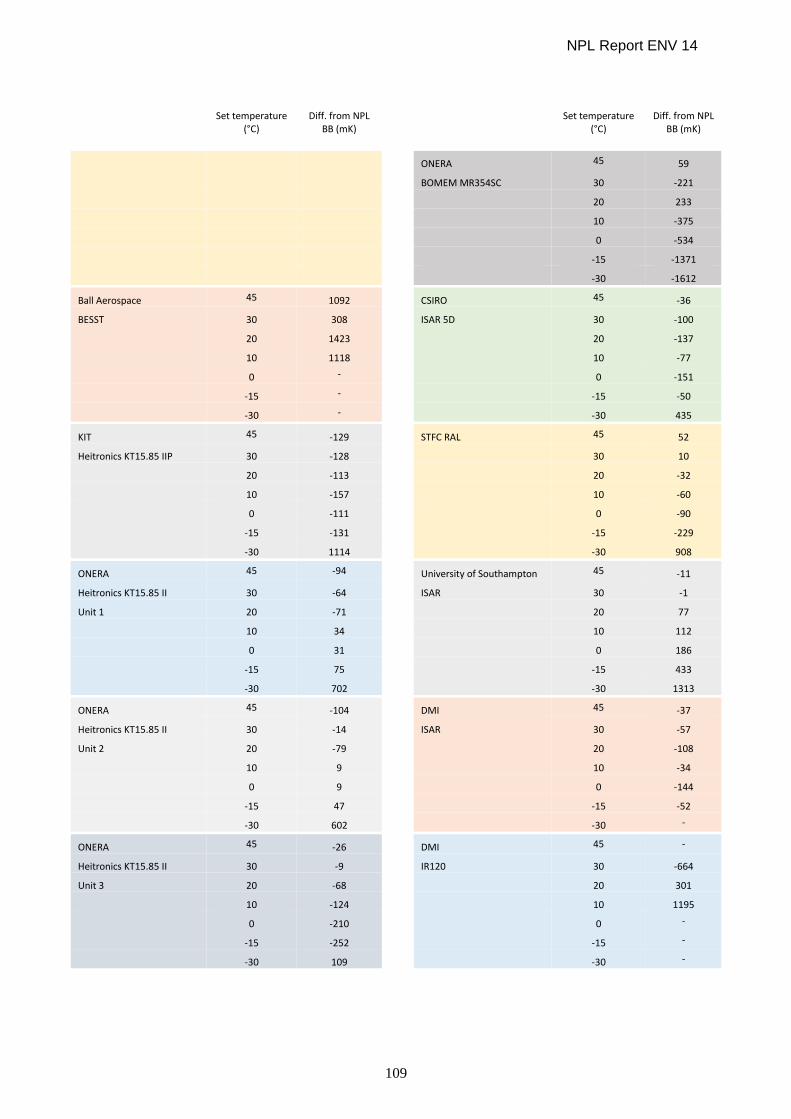
NPL Report ENV 14
109
Set temperature (°C)
Diff. from NPL BB (mK)
Set temperature (°C)
Diff. from NPL BB (mK)
ONERA 45 59
BOMEM MR354SC 30 -221
20 233
10 -375
0 -534
-15 -1371
-30 -1612
Ball Aerospace 45 1092 CSIRO 45 -36
BESST 30 308 ISAR 5D 30 -100
20 1423 20 -137
10 1118 10 -77
0 - 0 -151
-15 - -15 -50
-30 - -30 435
KIT 45 -129 STFC RAL 45 52
Heitronics KT15.85 IIP 30 -128 30 10
20 -113 20 -32
10 -157 10 -60
0 -111 0 -90
-15 -131 -15 -229
-30 1114 -30 908
ONERA 45 -94 University of Southampton 45 -11
Heitronics KT15.85 II 30 -64 ISAR 30 -1
Unit 1 20 -71 20 77
10 34 10 112
0 31 0 186
-15 75 -15 433
-30 702 -30 1313
ONERA 45 -104 DMI 45 -37
Heitronics KT15.85 II 30 -14 ISAR 30 -57
Unit 2 20 -79 20 -108
10 9 10 -34
0 9 0 -144
-15 47 -15 -52
-30 602 -30 -
ONERA 45 -26 DMI 45 -
Heitronics KT15.85 II 30 -9 IR120 30 -664
Unit 3 20 -68 20 301
10 -124 10 1195
0 -210 0 -
-15 -252 -15 -
-30 109 -30 -

NPL Report ENV 14
110
Set temperature (°C)
Diff. from NPL BB (mK)
Set temperature (°C)
Diff. from NPL BB (mK)
OUC 45 728 GOTA 45 48
ISAR 30 94 CE312-2 30 88
20 71 11.0-11.7 20 255
10 157 10 599
0 229 0 589
-15 515 -15 966
-30 2413 -30 2632
OUC 45 -18 GOTA 45 43
FIRST 30 -22 CE312-2 30 114
20 -27 10.3-11.0 20 257
10 6 10 432
0 -125 0 593
-15 -102 -15 791
-30 538 -30 2182
RSMAS 45 -93 GOTA 45 31
FTIR 30 -36 CE312-2 30 95
1000 nm 20 - 8.9-9.3 20 276
10 74 10 572
0 163 0 552
-15 373 -15 1055
- -30 - -30 2645
RSMAS 45 -79 GOTA 45 178
FTIR 30 -31 CE312-2 30 75
1302 nm 20 - 8.5-8.9 20 297
10 67 10 255
0 153 0 207
-15 390 -15 996
-30 - -30 2248
GOTA 45 206
CE312-2 30 151
8.1-8.5 20 287
10 184
0 596
-15 998
-30 2670
Figures 4.1 to 4.7 show the plots of the mean of the differences of the radiometer readings from
the corresponding temperature of the NPL reference blackbody, for all the blackbody
temperatures at which the radiometers were compared. The uncertainty bars shown in these
Figures represent the combined uncertainty (k = 1) of the measurements provided by the
participants.

NPL Report ENV 14
111
Figure 4.1: Plot of the mean of the differences of the radiometer readings from the
temperature of the NPL reference blackbody, maintained at a nominal temperature of -30 °C.
Figure 4.2: Plot of the mean of the differences of the radiometer readings from the
temperature of the NPL reference blackbody, maintained at a nominal temperature of -15 °C.

NPL Report ENV 14
112
Figure 4.3: Plot of the mean of the differences of the radiometer readings from the
temperature of the NPL reference blackbody, maintained at a nominal temperature of 0 °C.
Figure 4.4: Plot of the mean of the differences of the radiometer readings from the
temperature of the NPL reference blackbody, maintained at a nominal temperature of 10 °C.

NPL Report ENV 14
113
Figure 4.5: Plot of the mean of the differences of the radiometer readings from the
temperature of the NPL reference blackbody, maintained at a nominal temperature of 20 °C.
Figure 4.6: Plot of the mean of the differences of the radiometer readings from the
temperature of the NPL reference blackbody, maintained at a nominal temperature of 30 °C.

NPL Report ENV 14
114
Figure 4.7: Plot of the mean of the differences of the radiometer readings from the
temperature of the NPL reference blackbody, maintained at a nominal temperature of 45 °C.
5 DISCUSSION
Figures 4.1 to 4.7 show the differences of the radiometer readings from the corresponding
temperature of the NPL reference blackbody, for all the blackbody temperatures at which the
radiometers were compared. These Figures indicate that, for measurements corresponding to
the reference blackbody operating at temperatures above 0 oC, the difference of the radiometer
measurements from those of the ammonia heat-pipe blackbody cavity temperature is within the
uncertainty of the measurements, with some exceptions. However, these differences become
progressively larger as the reference blackbody temperature decreased to -15 oC and -30 oC.
This observation is not altogether surprising because measurements were made in a lab, with
the measuring radiometers operating at ambient temperatures. This meant that the internal
blackbodies within the participating radiometers on which the radiometers were basing their
calibrations were also operating at near ambient temperatures; hence for low temperatures of
the ammonia heat-pipe blackbody, the difference between the temperature of the test blackbody
and the internal reference blackbodies increased, resulting in the observed discrepancies. The
discrepancies are likely to arise due to the large extrapolation ranges (typically 50 oC) in
association with some invalid starting conditions of the original data. If, for example, the out-
of-band response of the radiometer was measured incorrectly, then discrepancies are likely to
arise. It is estimated that the output of a radiometer responding in the 10 µm to 11 µm region,
which is calibrated at 30 oC and extrapolated to -30 oC, will be 0.26% different from the output
obtained if the radiometer had an out-of-band response in the 5 µm to 6 µm region which was
just 1% of the response in the 10 µm to 11 µm band.
It is important to point out that if the radiometers were used to measure low temperature targets
such as the surface temperature of ice in the arctic, then the radiometers (as well as the internal
blackbodies) will also be at low temperatures so the extrapolation will not be over a significant

NPL Report ENV 14
115
temperature range. This means that the discrepancies between the radiometer measurement of
the ice and the true surface temperature of ice are likely to be small.
Moreover, as the temperature of the reference blackbody decreases, the signal detected by the
photodetectors within the radiometers also decreases, resulting in poorer signal-to-noise ratios
and thus more unreliable measurements.
It is important to note that NPL AMBER was used in the past to measure the temperature of the
same ammonia heat-pipe reference blackbody and the agreement between the NPL AMBER
measurements and the blackbody measurements was good. In fact the difference between the
NPL AMBER measurements and the reference blackbody measurements are included in the
Figures for blackbody temperatures of -30 oC, 0 oC, 10 oC, 20 oC and 30 oC. The agreement
between the AMBER and the reference blackbody measurements indicates that the
discrepancies observed in the measurements of some radiometers (which can be as large as 2 K
for blackbody temperatures around -30 oC) do not arise due to issues with the blackbody but
are likely to be associated with the participants’ measurements. Furthermore, NPL AMBER
was used to measure the temperature of the ammonia heat-pipe blackbody of PTB, the German
national standards lab and that comparison also showed good agreement between the
measurements provided by NPL AMBER and those provided by the PTB reference blackbody.
Full information on that comparison can be found in the paper by Gutschwager (Gutschwager
et al., 2013).
5.1 FIELD-OF-VIEW (FOV) ISSUES
Figure 5.1 shows a schematic of the ammonia heat-pipe blackbody. The blackbody cavity
aperture has a 75 mm diameter and is enclosed in a metal casing. The blackbody cavity is seen
through a 75 mm diameter aperture on the front of the casing, although this aperture can be
made smaller by adding apertures smaller than 75 mm in diameter on the blackbody casing.
Finally, the distance between the front of the blackbody cavity and the aperture on the casing
was also 75 mm, meaning that the Field of View (FoV) of a radiometer placed against the casing
would be overfilled by the blackbody cavity provided its half angle was less than 26.5° (53°
full angle). Although the 75 mm diameter of the blackbody and its position were defined and
open for review in the protocol before the measurements took place, this was a cause of issue
for radiometers with a large angle field of view which could not be positioned close to the
blackbody casing aperture. For these radiometers, the measurements taken would likely capture
the edges of the cavity, as well as capturing reflected or emitted radiation for the external edges
of the reference blackbody cavity, thus introducing biases to the measurements. To avoid this
problem, some participants made their measurements with their radiometers as close to the
blackbody front aperture as possible. Other than increasing potential of interactions between
the blackbody and the radiometer this was in general considered to be a satisfactory
compromise.

NPL Report ENV 14
116
Figure 5.1: Schematic of the ammonia heat-pipe blackbody.
5.2 WATER CONDENSATION AND ICING OF CAVITY
For the temperatures below 0°C, ice began to form near the aperture of the reference blackbody
cavity. While the ice only formed near the entrance to the cavity (the cavity was continuously
purged with dry nitrogen gas), the presence of the ice may have affected the effective emissivity
of the areas on which ice was deposited and thus alter the effective emissivity of the reference
blackbody for radiometers with very large FoVs. This may also have impacted some of the
results associated with the measurement of the temperature of blackbody cavity. However, the
same measurements were made using the NPL AMBER radiometer and no discrepancies were
observed for temperatures as low as -45 oC, indicating that no ice was formed inside the
reference blackbody cavity.
5.3 CALIBRATION RANGE OF RADIOMETERS
For the majority of instruments being compared, their intended use was for sea surface
temperature measurements. This would mean their calibration range is for temperatures above
0 °C. This, in turn, means that some measurements taken during this laboratory comparison
were outside the range of calibrated temperatures for these instruments. Any consideration of
irregularities with the values for measurements and their associated uncertainties made below
0 °C should take this into account.
5.4 LESSONS LEARNT
The aim of this section is to highlight issues and lessons learnt during the 2016 radiometer
laboratory comparison, so they can be avoided or their effects diminished in future
comparisons.

NPL Report ENV 14
117
i. The aperture of the reference blackbody should be large enough to enable the FoV
of the participating radiometers to be well overfilled by the reference blackbody
aperture.
ii. In cases where the radiometer cannot be placed close to the reference blackbody
aperture, the extra distance between the reference blackbody and the radiometer
should be included in the calculations to ensure that the reference blackbody
aperture still overfills the FoV of the radiometer.
iii. The temperature of the reference blackbody which is viewed by the radiometers
should be as spatially uniform as possible.
iv. The area of the reference blackbody observed by the different radiometers should
be large enough to average out possible spatial non-uniformities in the temperature
of the cavity of the blackbody.
v. Because different radiometers have different FoVs, it is recommended that in future
participating radiometers should be placed at different distances from the reference
blackbody so that the FoVs of the radiometers “cover” the same (identical) area of
the back wall of the reference blackbody. The aim of this is to ensure that the same
temperature non-uniformities of the blackbody cavity are seen (and averaged out)
by every participating radiometer.
vi. The emissivity of the reference blackbody should be provided to all participants in
order to enable them to calculate the corrections which will account for the
reflections from the blackbody cavity.
vii. During the 2016 radiometer comparison, a 30 minute period was allocated to each
participant to allow for the alignment of the radiometer to the reference blackbody
aperture and the making of the measurements at a particular blackbody temperature.
Some participants reported that 30 minutes was not enough. However, because of
the number of radiometers participating in the 2016 comparison and the number of
temperatures which had to be completed over the week-long comparison, the 30
minute period could not be extended. It is recommended that in future comparisons,
participants should be asked to state how long they would ideally like to align and
complete a measurement (at a particular blackbody temperature). If the total
duration of the comparison could not be extended, or the number of participating
radiometers could not be reduced, then the number of reference blackbody
temperatures at which measurements are done should be reduced to allow
participants the extra time periods they require to complete their measurements.
6 REFERENCES
Barker Snook, I., Theocharous, E. and Fox, N. P., 2017, “2016 comparison of IR brightness
temperature measurements in support of satellite validation. Part 3: Water surface temperature
comparison of radiation thermometers”, NPL Report ENV 15.
Barton, I. J., Minnett, P. J., Maillet K. A., Donlon, C. J., Hook, S. J., Jessup, A. T. and
Nightingale, T.J., 2004, ”The Miami 2001 infrared radiometer calibration and intercomparison:
Part II Shipboard results”, Journal of Atmospheric and Oceanic Technology, 21, 268-283.

NPL Report ENV 14
118
Berry, K., 1981, “Emissivity of a cylindrical black-body cavity with a re-entrant cone end face”,
J. Phys. E: Scientific Instruments, 4, 629–632.
Betts D B et al., 1985, “Infrared reflection properties of five types of black coating for
radiometric detectors”, J. Phys. E:Sci. Instrum., 18, 689–696.
Chu, B and Machin, G., 1999, “A low-temperature blackbody reference source to -40 oC”,
Measurement Science and Technology, 10, 1–6
Gutschwager, B, Theocharous, E., Monte, C., Adibekyan, A., Reiniger, M., Fox, N.P. and
Hollandt, J., ”Comparison of the radiation temperature scales of the PTB and the NPL in the
temperature range from -57 °C to 50 °C”, Measurement Science and Technology, 24, Article
No 095002, 2013
Rice, J. P., Butler, J. I., Johnson, B. C., Minnett, P. J., Maillet K. A., Nightingale, T. J, Hook,
S. J., Abtahi, A., Donlon, and. Barton, I. J., 2004, ”The Miami 2001 infrared radiometer
calibration and intercomparison. Part I: Laboratory characterisation of blackbody targets”,
Journal of Atmospheric and Oceanic Technology, 21, 258-267.
Theocharous, E., Fox, N. P., Sapritsky, V. I., Mekhontsev, S. N. and Morozova, S. P., 1998,
“Absolute measurements of black-body emitted radiance”, Metrologia, 35, 549-554.
Theocharous, E., Usadi, E. and Fox, N. P., 2010, “CEOS comparison of IR brightness
temperature measurements in support of satellite validation. Part I: Laboratory and ocean
surface temperature comparison of radiation thermometers”, NPL Report COM OP3.
Theocharous, E. and Fox, N. P., 2010, “CEOS comparison of IR brightness temperature
measurements in support of satellite validation. Part II: Laboratory comparison of the brightness
temperature of blackbodies”, NPL Report COM OP4.
Theocharous, E., Barker Snook, I. and Fox, N. P., 2017, “2016 comparison of IR brightness
temperature measurements in support of satellite validation. Part 1: Laboratory comparison of
the brightness temperature of blackbodies”, NPL Report ENV 12.
Theocharous, E., Barker Snook, I. and Fox, N. P., 2017a, “2016 comparison of IR brightness
temperature measurements in support of satellite validation. Part 4: Land surface temperature
comparison of radiation thermometers”, NPL Report ENV 13.
Acknowledgements
The authors wish to thank Miss Helen McEvoy and Mr Jamie McMillan for their assistance in
operating the ammonia heat-pipe blackbody and with the testing surrounding the radiometer
laboratory comparison. The authors also wish to thank Miss Perdi Williams for her assistance
during the laboratory measurement campaign. The University of Valencia participation in the
2016 FRM4STS comparison was funded by the Spanish Ministerio de Economía y
Competitividad and the European Regional Development Fund (FEDER) through the project
CGL2015-64268-R (MINECO/FEDER, UE) and by the Ministerio de Economía y
Competitividad through the project CGL2013-46862-C2-1-P (MINECO).