d2.3 geoelec web-service database on resource assessment
TRANSCRIPT

D2.3 GEOELEC web-service database on resource assessment
Content
Resource assessment philosophy + methodology
Data assessment- workshops
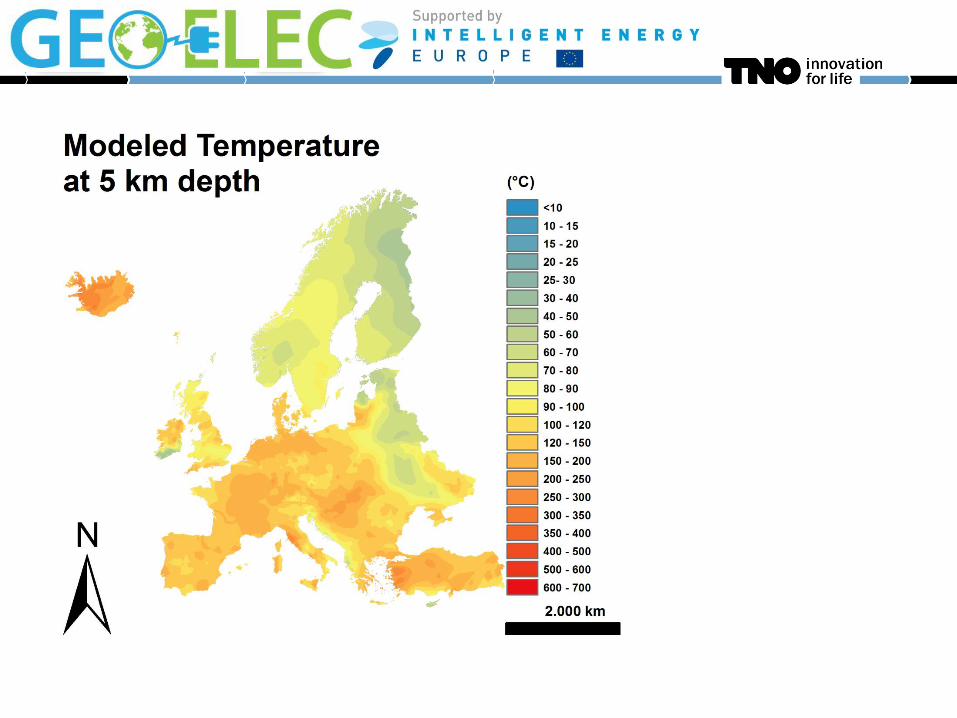
Temperature model and resource potential
Future of geothermal energy in EU

A Methodology for Resource assessment and application to core countries
Writing team:
Jan-Diederik van Wees, Thijs Boxem (TNO)
Phillipe Calcagno, Chrystel Dezayes (BRGM),
Christian Lacasse (Mannvitt),
Adele Manzella (CNR)
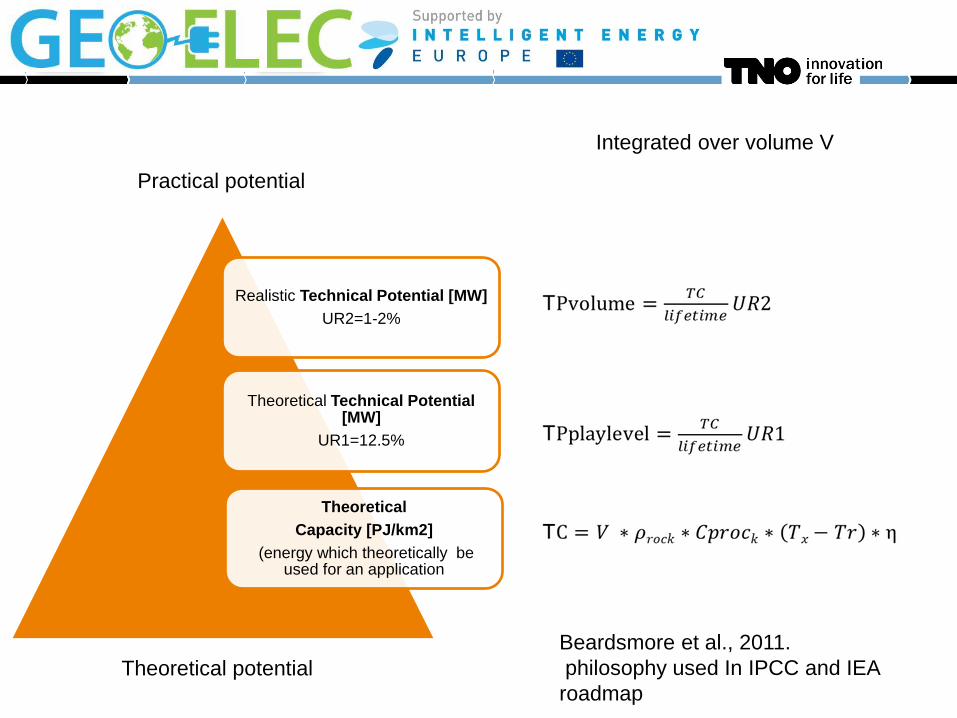
Realistic Technical Potential [MW]
UR2=1-2%
Theoretical Technical Potential [MW]
UR1=12.5%
Theoretical
Capacity [PJ/km2]
(energy which theoretically be used for an application
Theoretical potential
Practical potential
Integrated over volume V
Beardsmore et al., 2011.
philosophy used In IPCC and IEA
roadmap

Realistic Technical Potential [MW]
Theoretical Technical Potential [MW]
UR1=12.5%
Theoretical
Capacity [PJ/km2]
(energy which theoretically be used for an application
Theoretical potential
Practical potential Economic potential
Used here

Opex + Capex
Time (years) Ca
sh f
low
(M
€)
15
10
5
0
-5
-10
-15
1 10
Production
Revenues
UCF = Cash in - Cash out
Pay out time
DCF
DCF (DISCOUNT_RATE)
NPV
Cash flow
NPV-Net Present Value

Levelized Cost of Energy
Discounted energy produced [MWh, GJ]
Discounted cash out [ EUR ]
LCOE = discounted cash-out / discounted energy produced
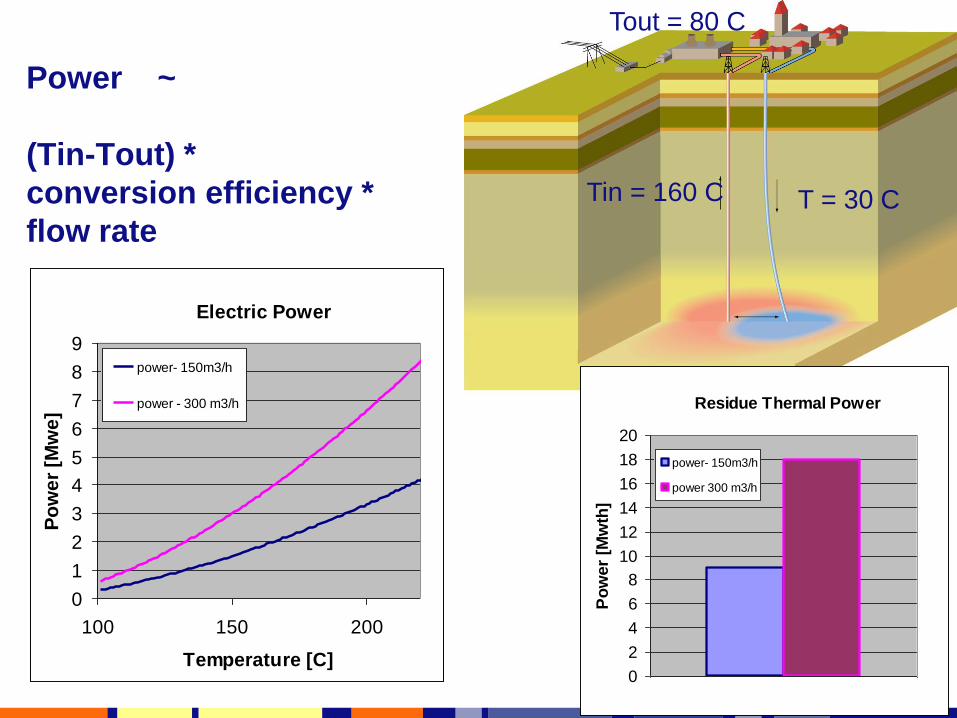
Power ~
(Tin-Tout) *
conversion efficiency *
flow rate
Tout = 80 C
Tin = 160 C T = 30 C
Electric Power
0
1
2
3
4
5
6
7
8
9
100 150 200
Temperature [C]
Po
we
r [M
we
]
power- 150m3/h
power - 300 m3/h Residue Thermal Power
0
2
4
6
8
10
12
14
16
18
20
Po
wer
[Mw
th]
power- 150m3/h
power 300 m3/h

www.eera-set.eu
Geothermal power: Conversion Efficiency
0
5
10
15
20
25
0 100 200 300 400
Co
nv
ers
ion
eff
icie
ncy [
%]
Production temperature [C]
MIT
this study
binary
flash MIT report , 2007: Future of geothermal energy
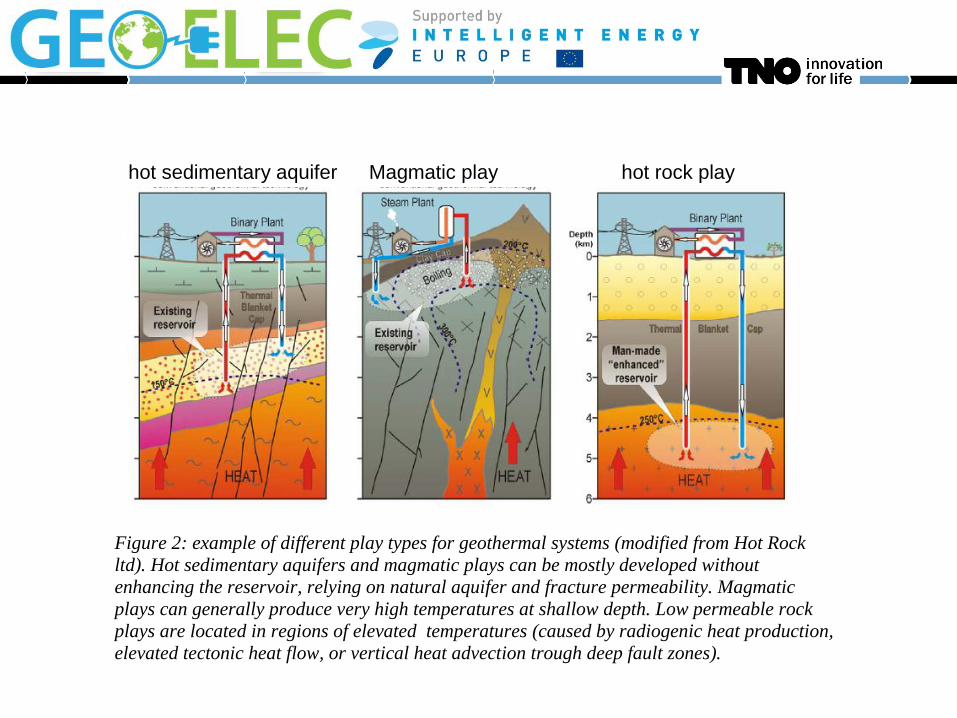
Figure 2: example of different play types for geothermal systems (modified from Hot Rock
ltd). Hot sedimentary aquifers and magmatic plays can be mostly developed without
enhancing the reservoir, relying on natural aquifer and fracture permeability. Magmatic
plays can generally produce very high temperatures at shallow depth. Low permeable rock
plays are located in regions of elevated temperatures (caused by radiogenic heat production,
elevated tectonic heat flow, or vertical heat advection trough deep fault zones).
hot rock playhot sedimentary aquifer Magmatic play

Levels in resource assessment
1. Global European
prospective resource
assessment for EGS
European wide assessment (cf. Beardsmore et al., 2010).
Determine technical potential for different depth ranges for
EGS, key input are base maps of temperature, and rock type
to identify theoretical potential. Filter maps with information
on natural reserve areas etc. Assume relatively low ultimate
recovery in agreement with whole depth column (cf. IPCC,
2011). distinguish relative attractiveness, low, mid, high
estimates according to drilling depth required to reach
temperature
2. Prospective undiscovered
resource assessment for
different play types
Identify delimited areas with a particular play type (e.g. Hot
Sedimentary Aquifer (HSA), magmatic convective). Include
data relevant to exploration of particular play types and
exploration outcomes (cf. AGEA-AGEC, 2010) for
exploration data relevant to resources assessment
3. Contingent (discovered)
resources and reserves
From industry and government reporting obtain information
on drilled prospects and producing reserves, play types,
development type

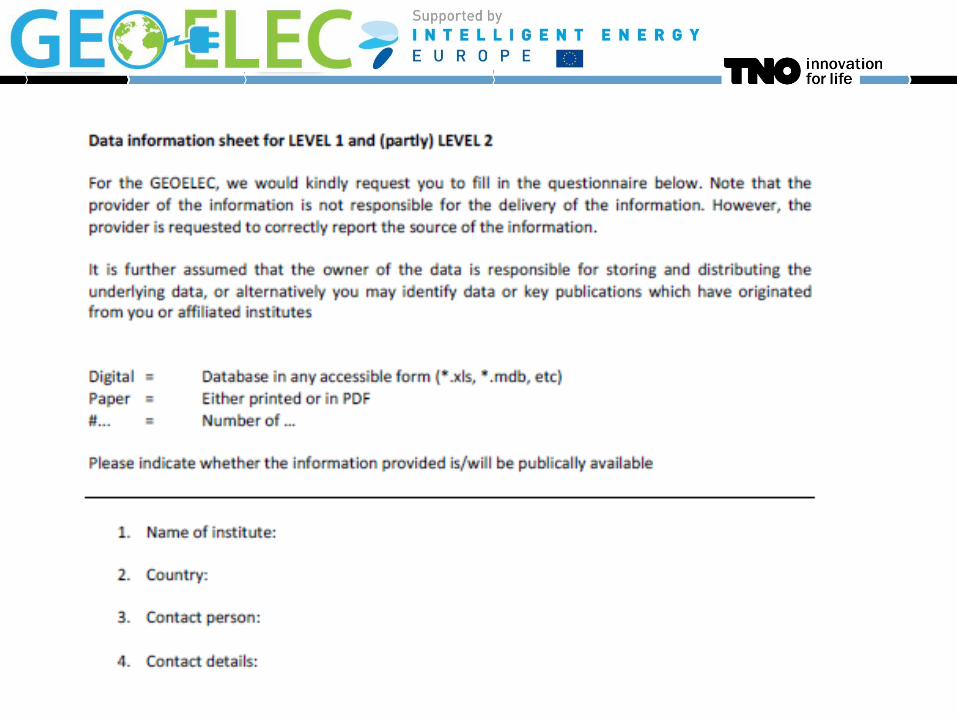
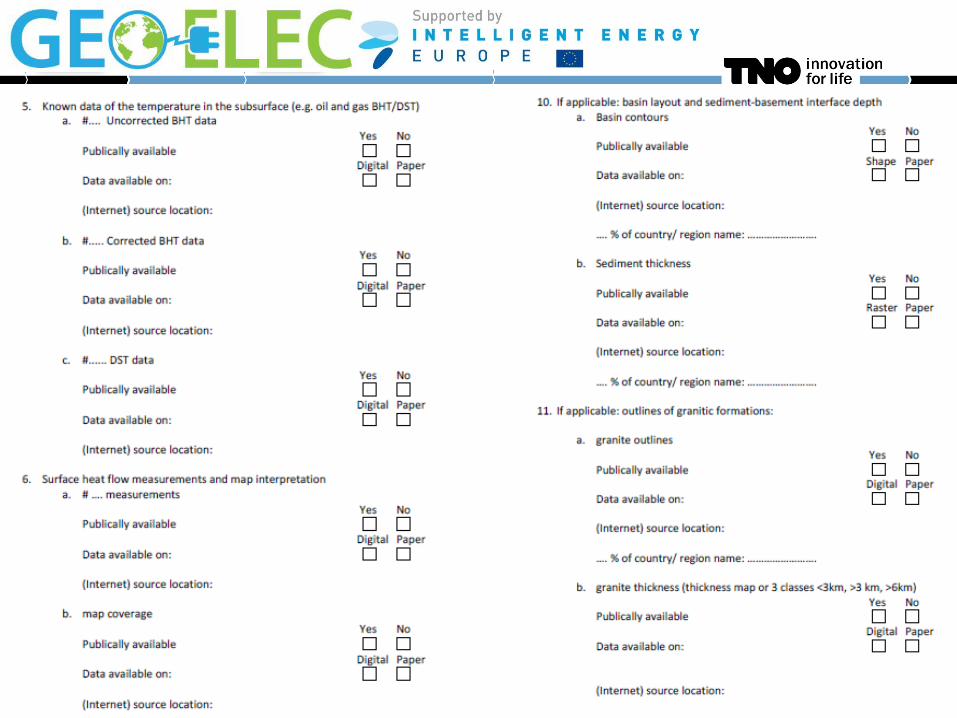
Do we have access to key information? Temperature compilations date from over 20 years ago,
only exists in a paper report

http://www.geoelec.eu/

Data acquisition sheets
• ~40 countries invited
to/participated on the
workshops
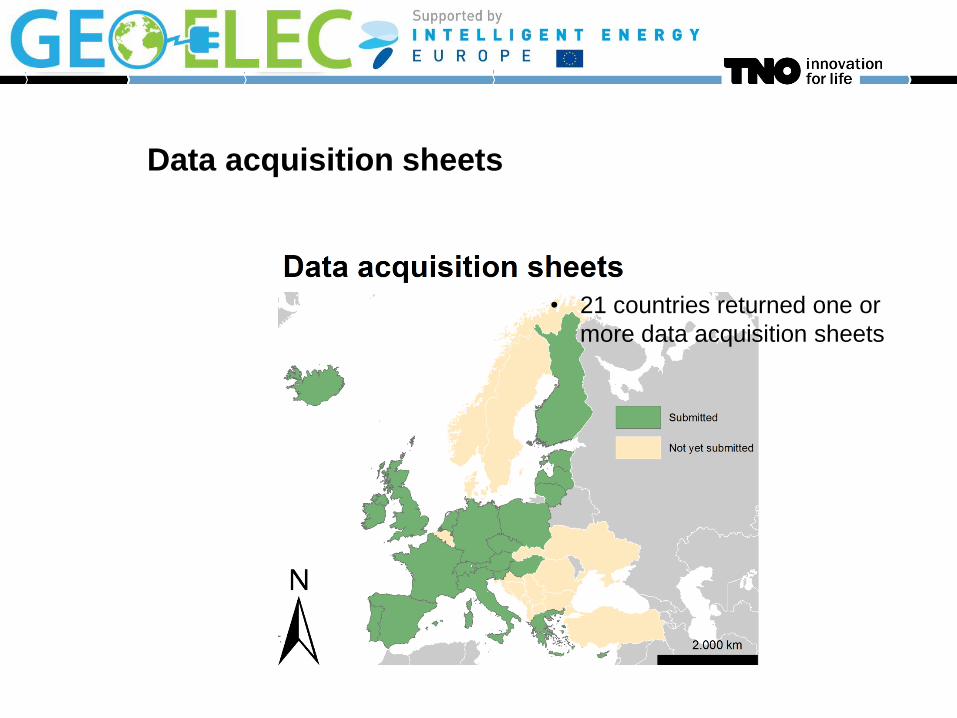
Data acquisition sheets
• 21 countries returned one or
more data acquisition sheets

Can stakeholders access key information? Legislation to access key information differs. In many
countries temperature measurements are not public
•14 countries have indicated that
temperature measurements are
publically available at no cost
•Access is hampered by lack of
digital data repositories in most
countries

Data acquisition sheets
• 17 countries have (partial) maps
of the temperature at depth
• Different data formats:
• Paper
• Webviewer
• Digital (shapefile/grid)

Data acquisition sheets
• Map coverage can vary for each
country and for each depth
interval

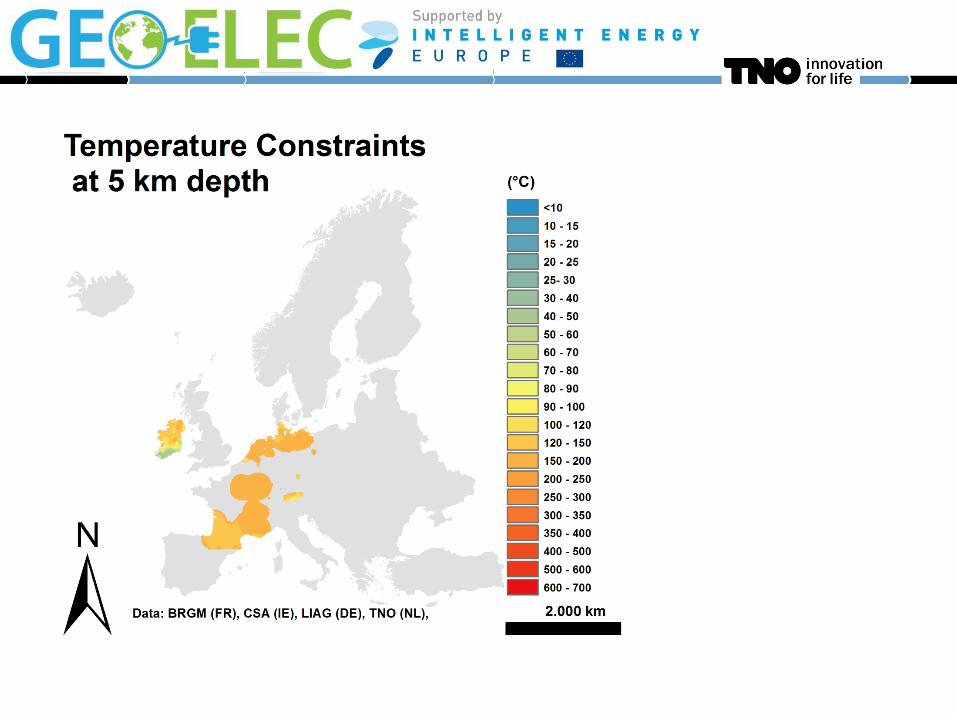
Data acquisition sheets
• 11 countries have maps for the
temperature at depths greater
than 3 km

Data acquisition sheets
• Only four countries provide 3D
temperature models

Findings
There are a lot of geothermal data available, however:
Fragmented
Different format
Different correction methods used for BHT
Different methodology construction of maps
Centralised and unified database recommended

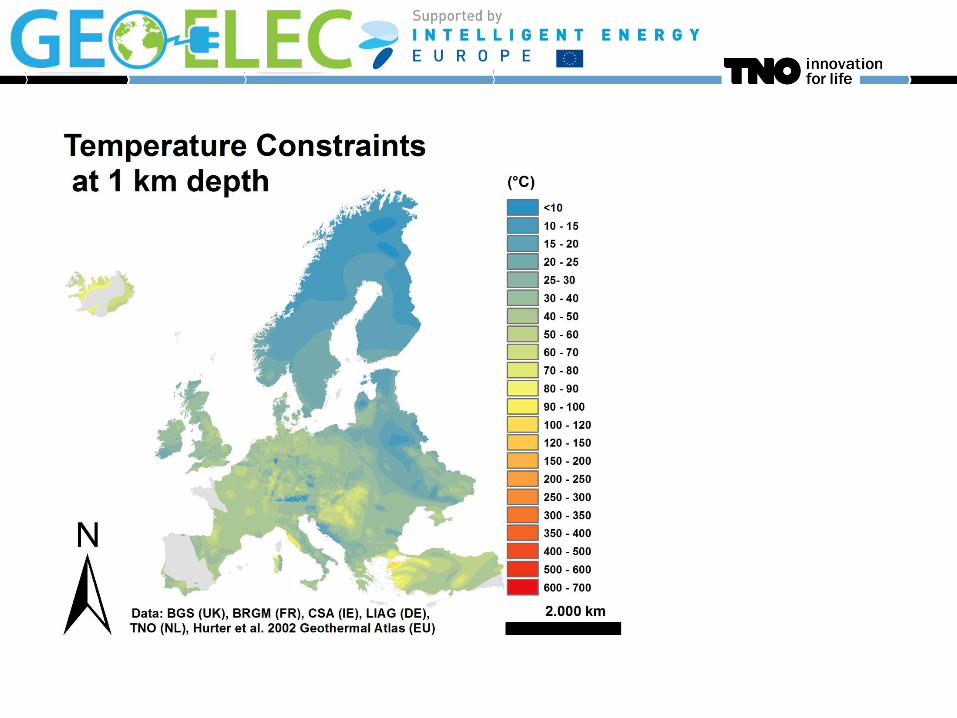
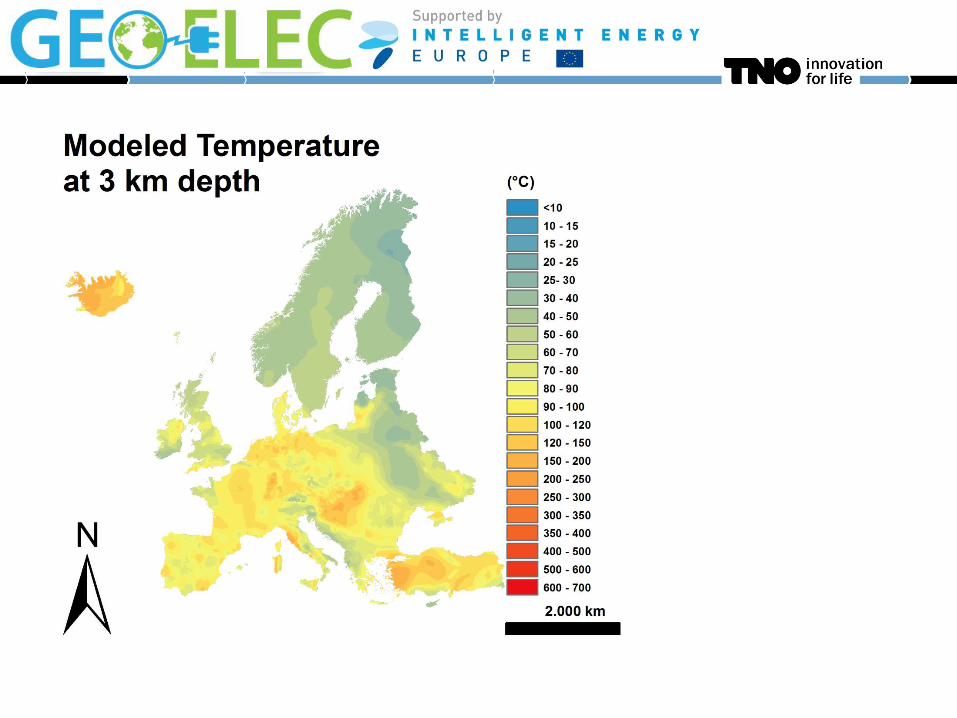
How to construct a temperature model?
Surface temperature
T at 1000 m
T at 2000 m
Natural heat flow
10km depth
Thermal properties:
K = Thermal conductivity [W /m K]
A = radiogenic heat production [ m W / m3]
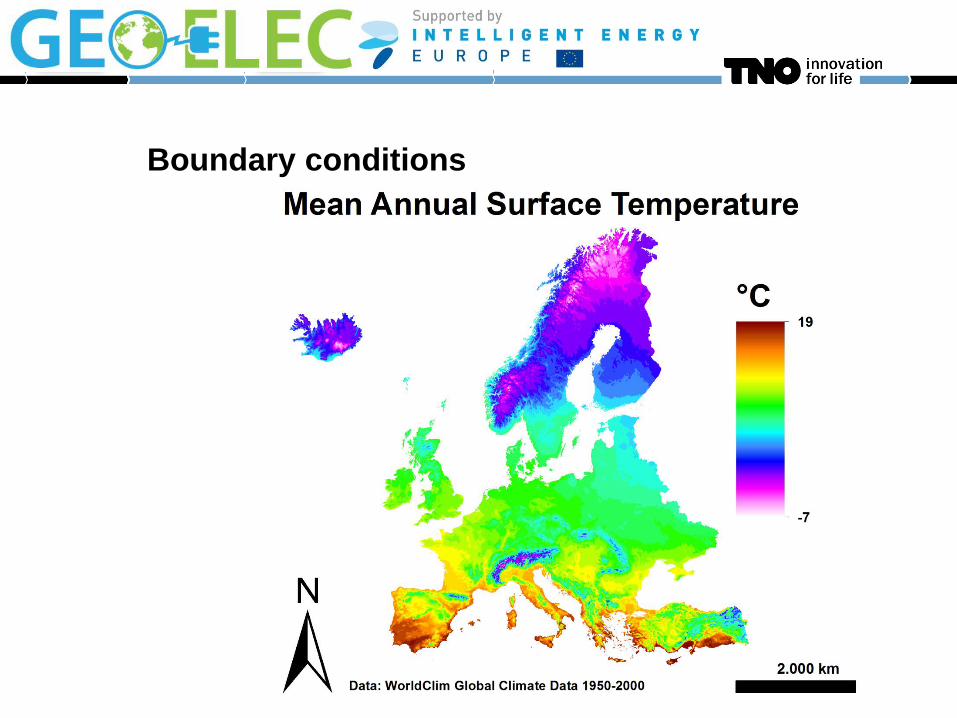
Boundary conditions


Boundary condition at Base -->
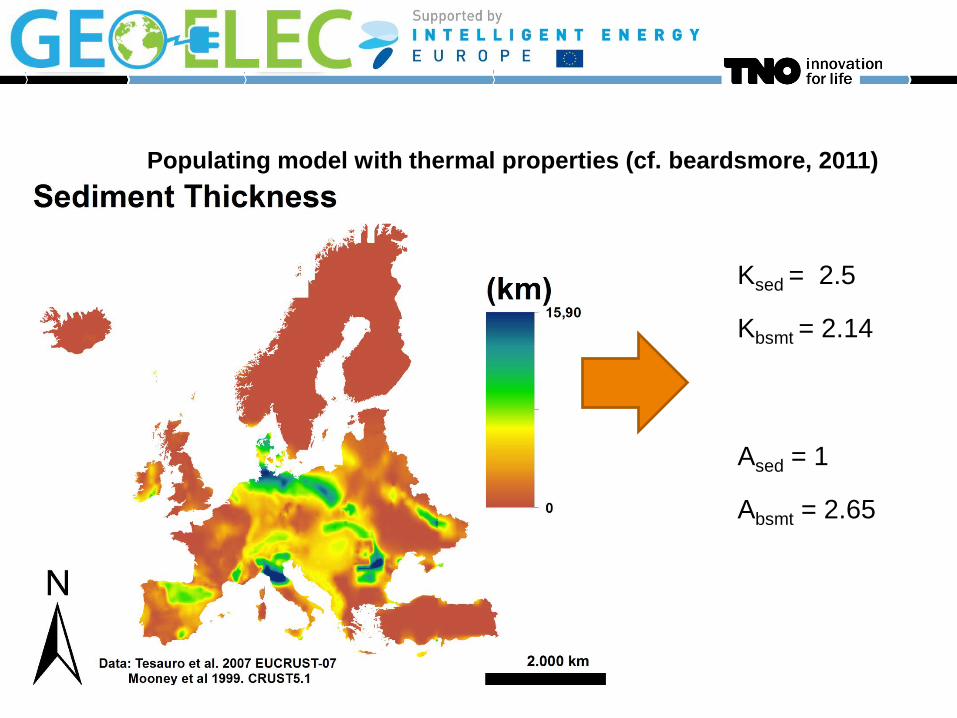
Populating model with thermal properties (cf. beardsmore, 2011)
Ksed = 2.5
Kbsmt = 2.14
Ased = 1
Absmt = 2.65

Populating model with thermal properties (cf. Cloetingh et al., 2012)
Ksed = 2
Kbsmt = 2.6
Ased = 40% HF
Absmt = 40% HF


Geothermal energy:
Temperature [°C]
Dep
th [
km
]
Conventional
power
conventional heat
Greenhouses NL
EGS
Natural flow
Conventional:
2% worldwide electricity 2050
5% RE NL 2020
Enhanced geothermal systems (EGS):
2% worldwide electricity 2050
supercritical

Well layout (5-7 km depth)
80C
240C
400 m

Calculation of LCOE of renewable heat and electricity
Geothermal Energy Operational choice power
INPUTVARIABLES used Value Unit
Flowrate 1 50 L/s
along hole depth of a single well 1 5000 m along hole depth (total length) of a single borehole in the subsurface
Surface temperature 1 11 C
production temperature (Tx) 1 166 C production temperature (reservoir temperature, corrected for temperature losses)
Economic lifetime 1 15 Years
subsurface
well cost scaling factor 1 1.2 - scaling factor for calculating well costs
well costs 1 11 mln euro/Well calculated costs for drillling the wells
Stimulation and other Cost 1 1 mln euro/Well additional well costs for stimulation (and other costs) of the reservoir
Pump investment 1 0.6 Mln euro/pump
Number of wells 1 2 - number of wells in the reservoir
subsurface capex 1 23.6 mln euro calculated subsurface capex for wells, stimulation and pumps
subsurface parasitic
COP 1 15 - coefficient of performance (MWth/MWe) to drive the pumps. Ratio of thermal and electric power.
electricity price for driving the pumps 1 110 euro /MWhe electricity price for the power consumed by the subsurface pumps
Variable O&M 1 7.333333333 euro/MWhth
power temperature range used
(co) heat relative starting temperature 0 0% % relative value (100%= Tx,0%=Tbase) for upper limit of temperature range for heat
outlet temperature power plant (Toutlet) 1 91 C upper limit of Temperature for (co)heat use
power surface facilities
thermal power for electricity 1 17.181 MWth
electric power 2.209 MWe
power Loadtime 1 8000 hours/year effective load hours in a year for electricity production
power Plant investment costs 1 2.000 mln Euro/MWe
power Distance to grid 1 5000 m distance for the connection to the power grid
power Grid investment 1 80 Euro/kWe grid connection cost per unit of power installed
power Grid Connection Variable 1 100 Euro/m grid connection cost per unit of distance
power plant capex 1 5.095 mln Euro calculated capex for power plant and grid connection
power Fixed O&M rate 1 1% % O&M costs as percentage of caclulated capex for (sub)surface facilities
power Fixed O&M 1 29 kEuro/MWe
power Variable O&M 1 57.0344086 Euro/MWhe
pump investements. Workover is assumed every 5 years at installment costs
costs for power conversion system
calculated O&M costs per unit of power installed
Comment
net power produced, taking into account the relative efficiency recorded by operating binary and flash plants
lifetime for cash flow calculations
total flow rate which is achieved from the subsurface (measured at surface conditions)
average yearly surface temperature
calculated variable O&M per unit of heat produced (1MWhth=3.6GJ)
net power produced, taking into account the relative efficiency recorded by operating binary and flash plants
calculated variable O&M costs (dependent on COP, and efficiency of conversion)

(co)heat surface facilities
direct heat reinjection temperature(Treinject) 0 40 C reinjection temperature (effective temperature range is Toutlet..Treinject)
direct heat production 0 0.000 MWth heat production
direct heat load hours 0 5500 hours/year effective load hours in a year for heat production
direct heat plant investment costs 0 150.000 kEuro/MWth
direct heat capex 0 0.00 mln Euro calculate capex for heat production surface facilities
direct heat Fixed O&M rate 0 3% % O&M costs as percentage of caclulated capex for (sub) surface facilities
direct heat Fixed O&M 0 59 kEuro/MWth
direct heat Variable O&M 0 7.333333333 Eur/MWHth
complementary sales
complementary electricity sales 1 0.00 Euro/MWh
complementary heat sales 1 0 euro/GJ complementary revennues from heat sales
fiscal stimulus
fiscal stimulus on lowering EBT 1 yes yes/no apply fiscal stimulus on lowering earnings before tax (EBT) of the project developer
percentage of CAPEX for fiscal stimulus 1 42% %
legal max in allowed tax deduction 1 63 mln Euro
NPV of benefit to project 1 2.8 mln Euro
Inflation 1 3% %
loan rate 1 6.0% %
Required return on equity 1 15% %
Equity share in investment 1 20% %
Debt share in investment 1 80% %
Tax 1 25.5% %
Term Loan 1 15 Year
Depreciation period 1 30 Year
POWER (power,co-heat) used Value Unit
levelized cost of energy (LCOE) 1 267.48 Euro/Mwhe
HEAT SHEET (heat) Value Unit
levelized cost of energy (LCOE) 0 0.00 Euro/GJ
1MWhth=3.6GJ
tax rate for company
number of years for the loan
number of years for depreciation (linear per unit of production)
inflation for costs and benefits in project cash flow
interest rate on debt
required return on equity
share of equity in the effective investment
share of debt(the loan) in effective investment
complementary revenues from electricity sales
percentage of CAPEX which can be deducted from EBT
legal maximum in tax benefit
effective benefit to project
heat surface installation costs per unit of heat production
calculated O&M costs per unit of heat production installed
calculated variable O&M costs (dependent on COP)

Sensitivity Analysis LCOE: upper rhine Graben
100 120 140 160 180 200 220
Temperature (175°C - 200°C - 225°C)
Coheat
No fracking
Flowrate (50l/s - 70l/s - 100l/s)
Loan rate (9% - 6 % - 3 %)
Welcost scaling (2 - 1.5 - 1.0)
COP (20 - 50 - 100)
Inflation (2% - 0% - -2%)
LCOE [EUR/MWh]
downside
upside

Assumptions:
• Doublet
• COP = 50
• Tmin = 100°C
• Flow rate = 70 l/s
• Welcost scaling = 1.5
• Zmax = 7km
• Stimulation costs =
20M euro

Assumptions:
• Doublet
• COP = 1000
• Tmin = 100°C
• Flow rate = 100 l/s
• Welcosts = €1.500/m
• Zmax = 10km
• Stimulation costs = 20M
euro
• Carnot efficiency = 70%


The resource assessment and exploration
Public access to relevant data is important
Access to data is not harmonized in EU
Public access to other datasets than discussed here is very
important to improve exploration and production (level 1 and level 2)
Oil and gas exploration and production data in general
Rock Properties (thermal, flow, chemical, …)
Stress
Fault and fractures
Natural seismicity
Structural and compositional models