d3: the crash course. d3: scratching the surface
TRANSCRIPT
D3: The Crash Course

D3: Scratching the Surface
D3: What you need for the Homework

D3: Only the Beginning
Please do not be afraid to ask questions!

Programming Terminology Directory -- Folder
Variable -- Identifier of an object, a value, or a function
Global Variable – Variable accessable from anywhere in your code
Local Variable – Variable only accessable from the current function
String – A sequence of characters (usually surrounded by “”s or ‘’s)• e.g. “This is a string.”
Int – An integer number (i.e. no decimal places)
Float – A number that can have decimal places
Array [ ] – A list of items• [1,2,3,4]• [{name:‘Alpha’},{name: ‘Bravo’},{name: ‘Charlie’}]
Object { } – A collection of key-value pairs, often representing a distinct entity• [{keyA:’value1’, keyB: 5, keyC: 9.3}]
Function / Method ( ) – A series of steps to perform a task• (often converting input to output)
Parameter – Input for a function
Workspace Setup
Website Directory Structure
Javascript 101-2
SVG Basics
D3.js Crash Course

The Applications I Recommend
Text Editor: Sublime Text 2
Browser: Chrome
Super-Basic Webserver: Python

Opening the project in Sublime Text
Accessing the Chrome inspector and console
Starting a SimpleHTTPServer

Opening a project in Sublime Text
http://www.sublimetext.com/
File Open on Mac
File Open Folder on PC
Select the coffee-vis folder
Click Open
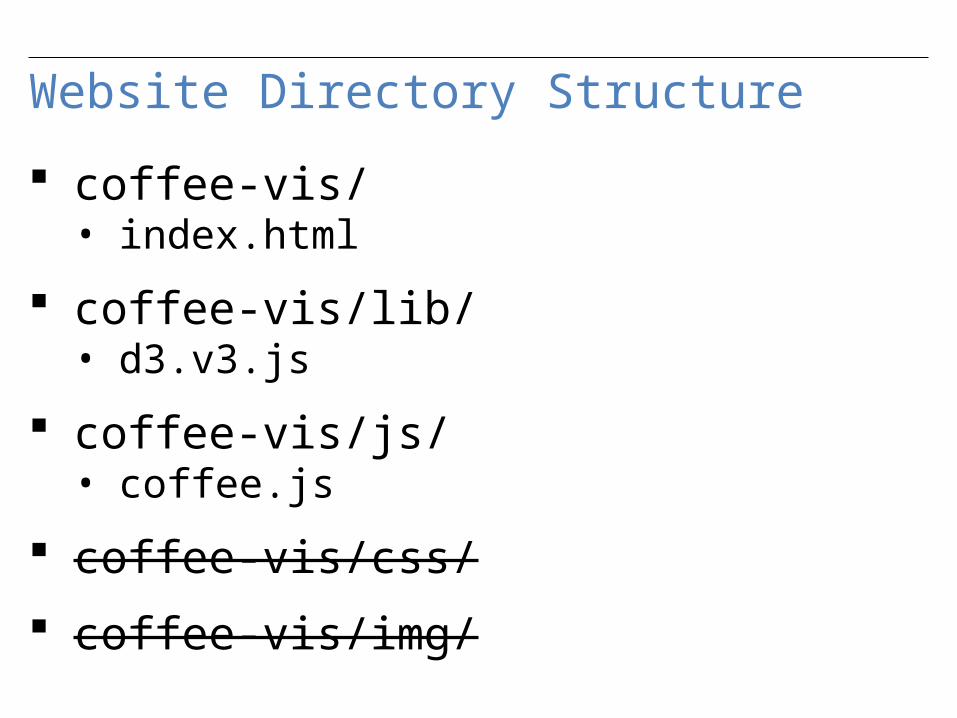
Website Directory Structure
coffee-vis/• index.html
coffee-vis/lib/• d3.v3.js
coffee-vis/js/• coffee.js
coffee-vis/css/
coffee-vis/img/
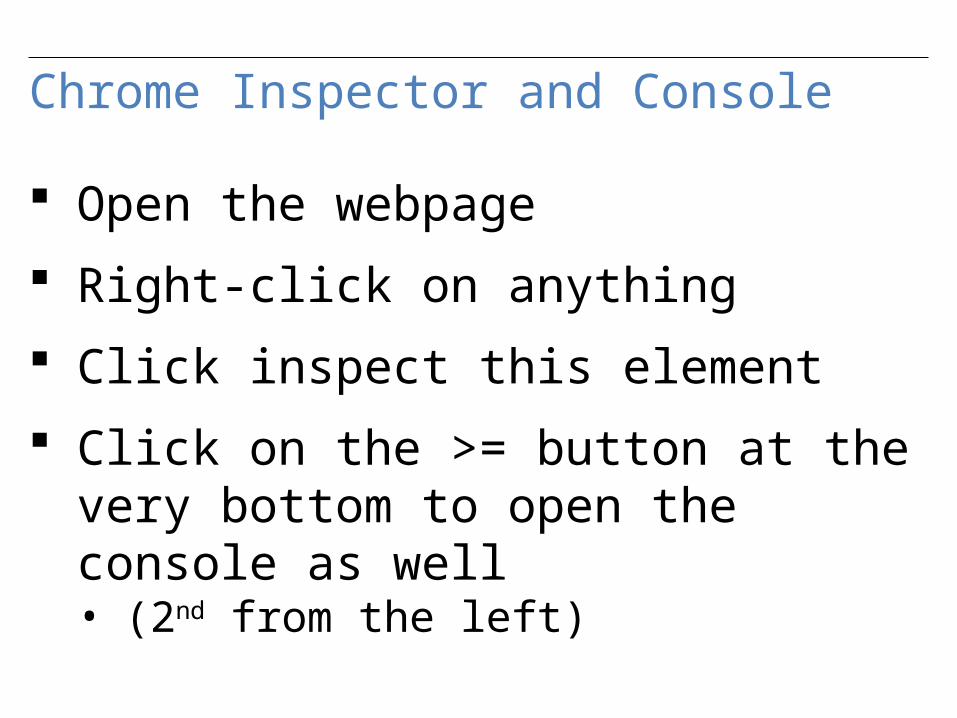
Chrome Inspector and Console
Open the webpage
Right-click on anything
Click inspect this element
Click on the >= button at the very bottom to open the console as well• (2nd from the left)

Starting a Local Webserver
Unzip the file into your home directory• (the folder named after your username)
Open either a Terminal (Mac) or Command Prompt (Windows)
Type cd coffee-vis and press enter
Type python -m SimpleHTTPServer 8000 and press enter
Go to your browser and go to http://localhost:8000
How many of you have experience with Javascript?

Javascript 101
All variables are global unless declared using var• x = 300 (global) vs. var x = 300 (local)
Semicolons are completely optional
“text” is the same as ‘text’
object.key is the same as object[‘key’]
print to the console using console.log( )

Javascript 102: Functional Programming
Javascript is a functional language
Functions are themselves objects!
Functions can be stored as variables
Functions can be passed as parameters
D3 uses these abilities extensively!

Array.map( )
Used for applying a function to each element of an array
The function provided takes one parameter (d):• d: a/each data point
https://developer.mozilla.org/en-US/docs/Web/JavaScript/Reference/Global_Objects/Array/map

Array.map( )
var x = [{val:1},{val:2},{val:3},{val:4}]
var a = x.map(function(d){return d.val;
})
a : [1,2,3,4]
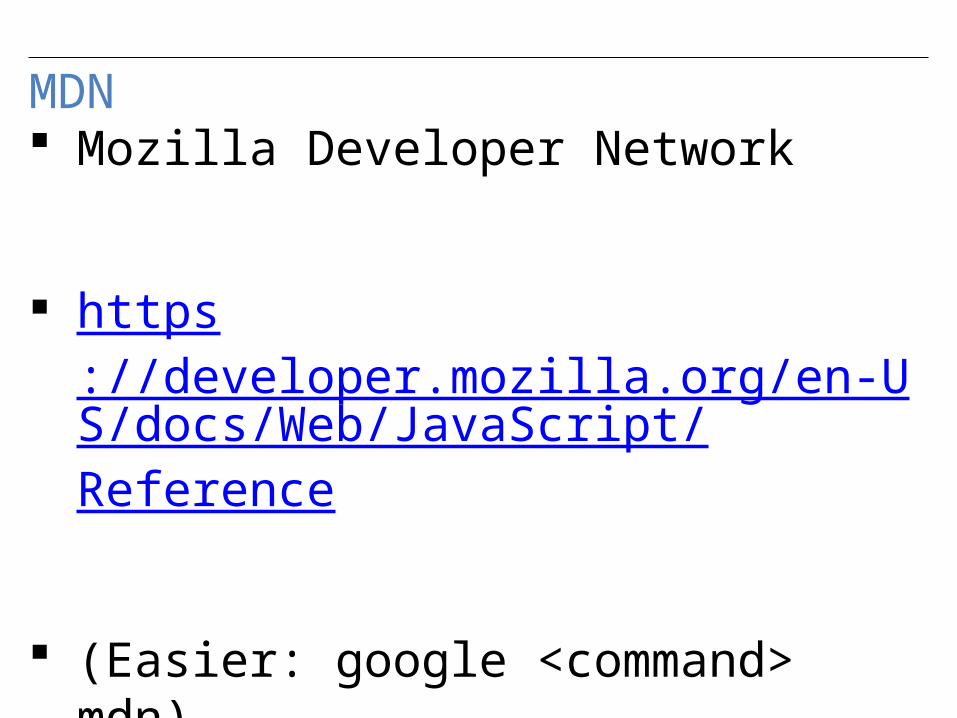
MDN
Mozilla Developer Network
https://developer.mozilla.org/en-US/docs/Web/JavaScript/Reference
(Easier: google <command> mdn)
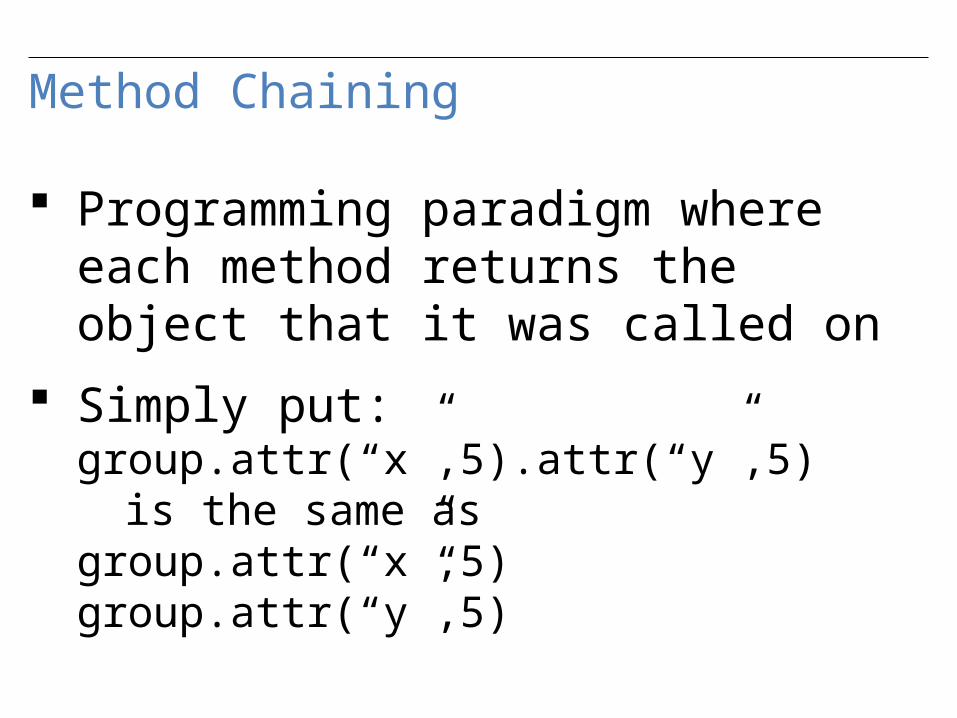
Method Chaining
Programming paradigm where each method returns the object that it was called on
Simply put:group.attr(“x”,5).attr(“y”,5)
is the same asgroup.attr(“x”,5)group.attr(“y”,5)
SVG BASICS
How many of you have experience with SVG?

How many have experience with 2D computer graphics (such as Java
Swing)?

x
y(0,0)
(width,height)
SVG Basics
<svg>
<rect>
<g>
<text> (after I’ve talked about D3)

<svg> elements
Overarching canvas
(optional) Attributes:• width• Height
Create with• d3.select(“#vis”).append(“svg:svg”)• (we already did this for you)

<rect> elements
Attributes:• width• height• x : (relative to the LEFT of the
container)• y : (relative to the TOP of the container)
Create with• .append(“svg:rect”)
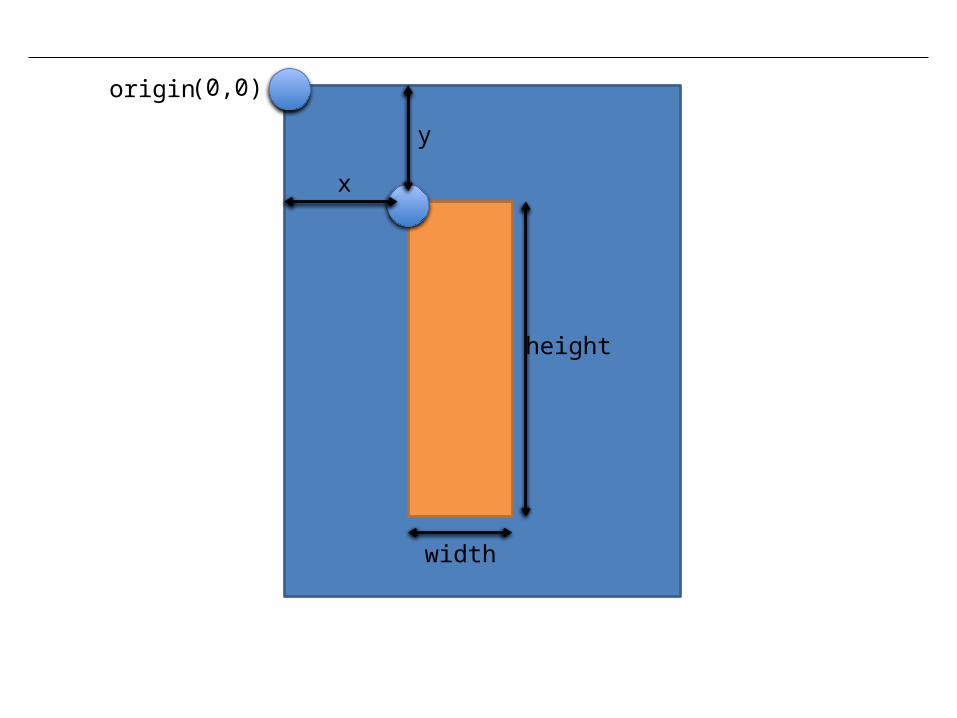
x
y
width
height
(0,0)origin

But what if we want to move all the rectangles just a smidge?
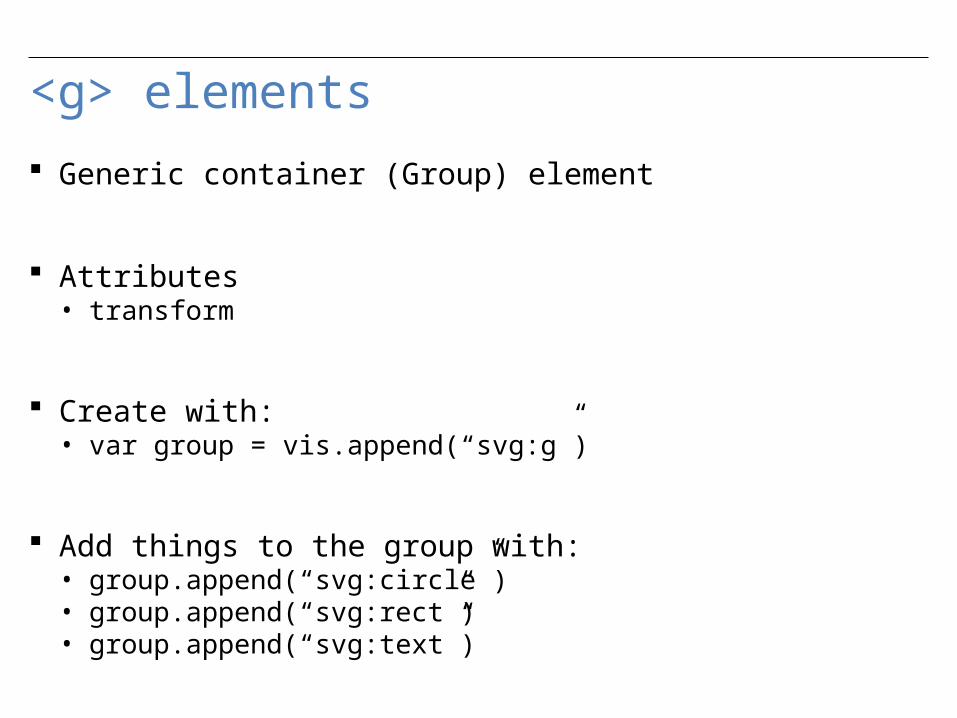
<g> elements
Generic container (Group) element
Attributes• transform
Create with:• var group = vis.append(“svg:g”)
Add things to the group with:• group.append(“svg:circle”)• group.append(“svg:rect”)• group.append(“svg:text”)
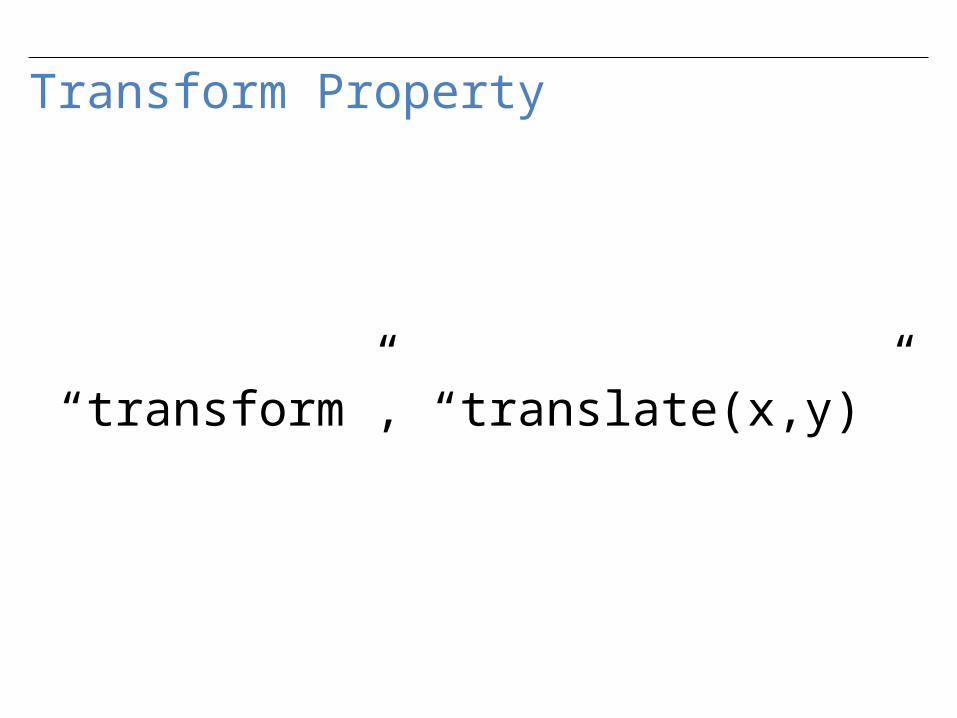
Transform Property
“transform”, “translate(x,y)”

.attr(transform,translate(x,y))
translate(30,20)30
20

AND NOW D3…
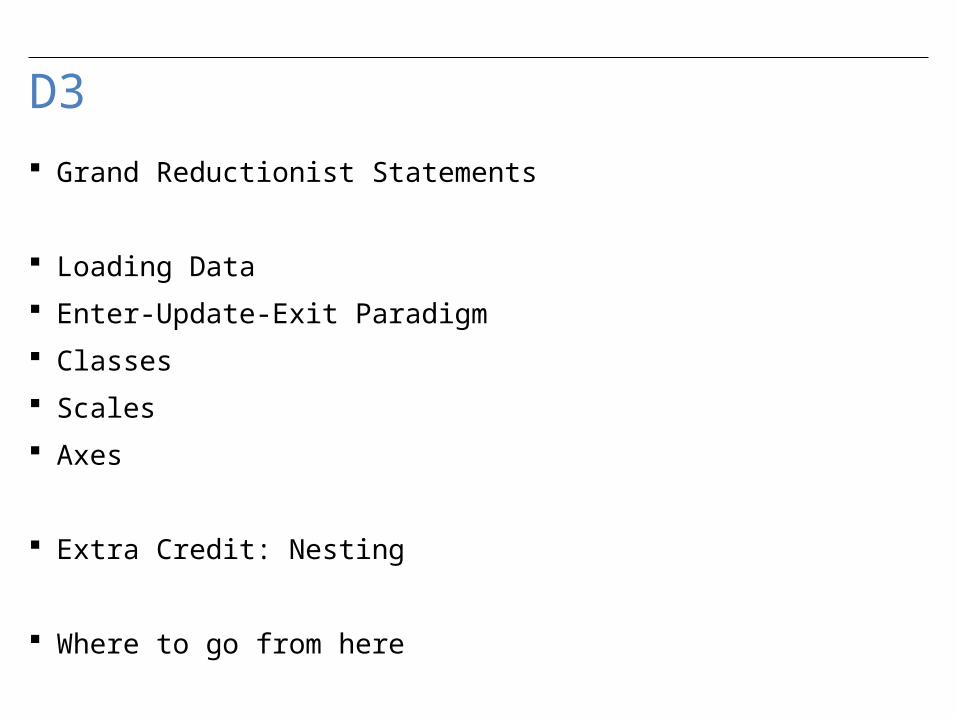
D3 Grand Reductionist Statements
Loading Data
Enter-Update-Exit Paradigm
Classes
Scales
Axes
Extra Credit: Nesting
Where to go from here
D3
A really powerful for-loop with a ton of helper functions.
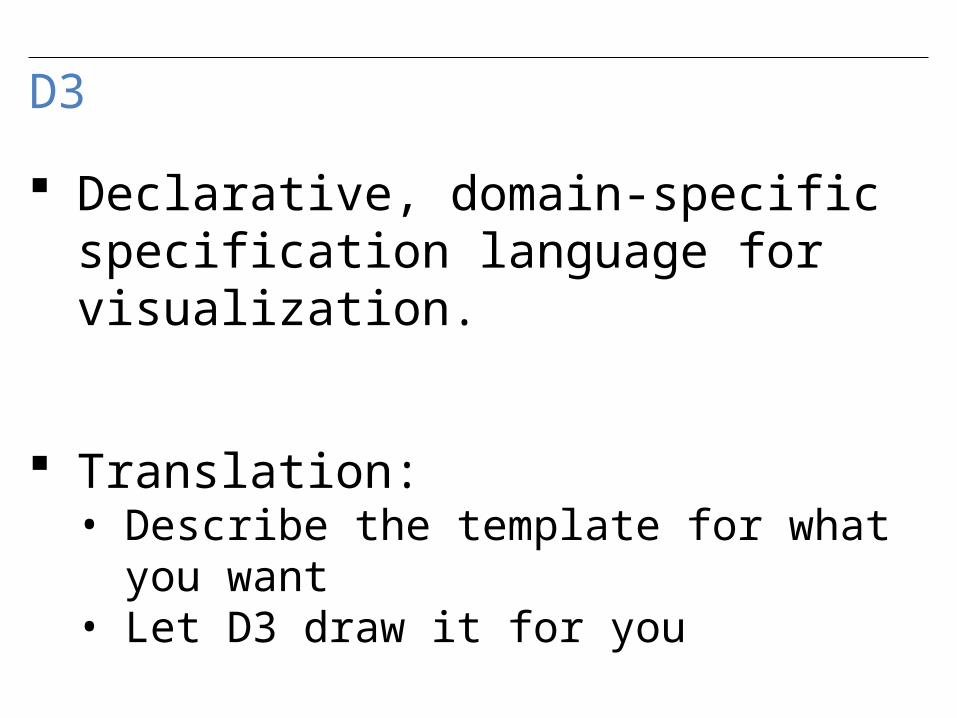
D3
Declarative, domain-specific specification language for visualization.
Translation:• Describe the template for what you
want• Let D3 draw it for you

Loading Data
d3.csv(fileloc,callback)• (There are others, but this is what
you need for the HW)
fileloc: file location• (“data/CoffeeData.csv”)
callback: function(rawdata){ }
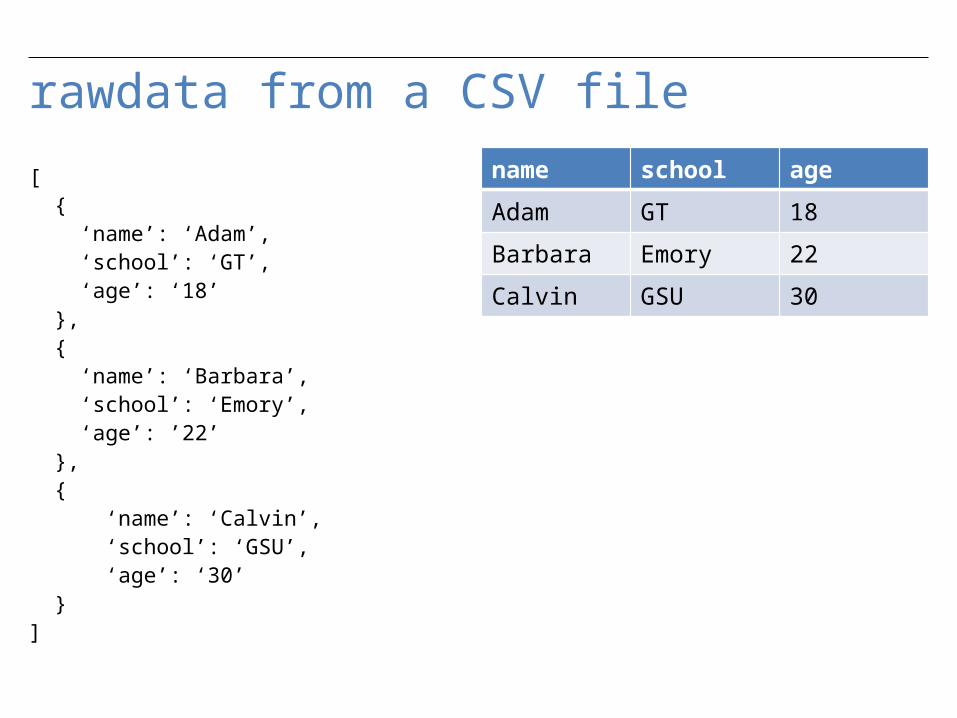
rawdata from a CSV filename school age
Adam GT 18
Barbara Emory 22
Calvin GSU 30
[ { ‘name’: ‘Adam’, ‘school’: ‘GT’, ‘age’: ‘18’ }, { ‘name’: ‘Barbara’, ‘school’: ‘Emory’, ‘age’: ’22’ }, { ‘name’: ‘Calvin’, ‘school’: ‘GSU’, ‘age’: ‘30’ }]
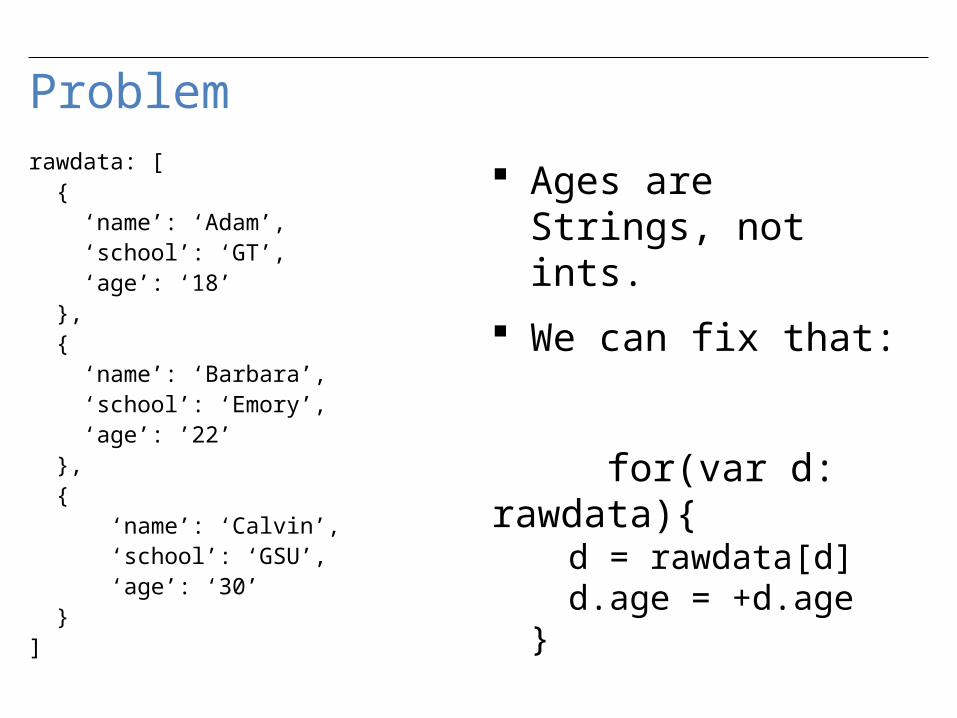
Problemrawdata: [ { ‘name’: ‘Adam’, ‘school’: ‘GT’, ‘age’: ‘18’ }, { ‘name’: ‘Barbara’, ‘school’: ‘Emory’, ‘age’: ’22’ }, { ‘name’: ‘Calvin’, ‘school’: ‘GSU’, ‘age’: ‘30’ }]
Ages are Strings, not ints.
We can fix that:
for(var d: rawdata){
d = rawdata[d]d.age =
+d.age}

Enter-Update-Exit
The most critical facet of how D3 works
If you learn nothing else today, learn the mantra!
“Enter-Update-Exit” “Enter-Update-Exit”
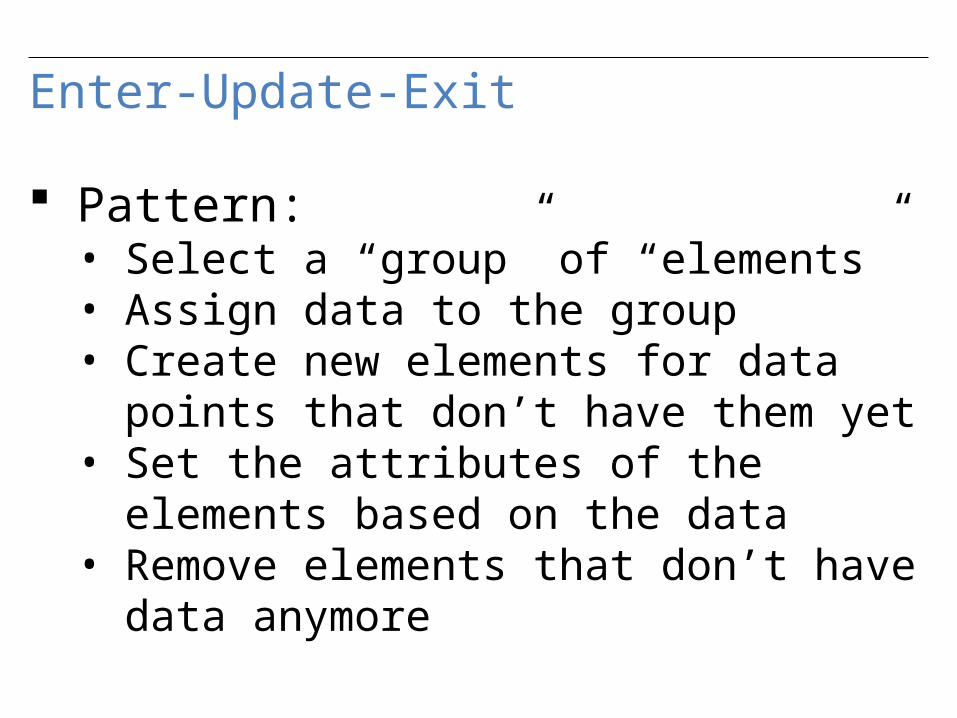
Enter-Update-Exit
Pattern:• Select a “group” of “elements”• Assign data to the group• Create new elements for data points
that don’t have them yet• Set the attributes of the elements
based on the data• Remove elements that don’t have
data anymore
Hardest part of D3 to wrap your head around:
You can select groups of elements that DON’T EXIST YET

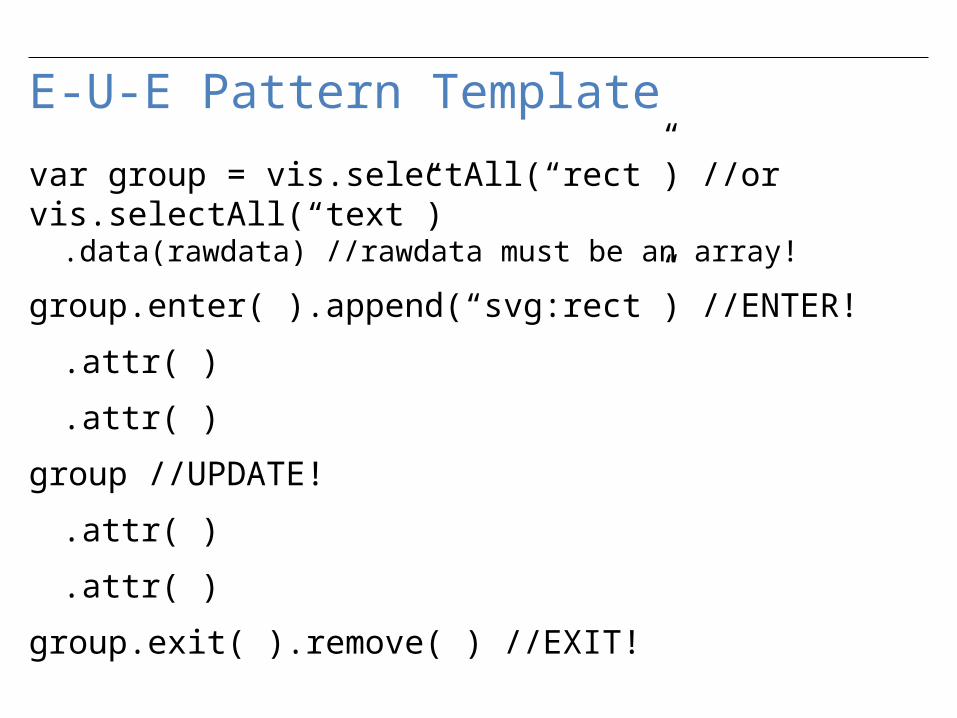
E-U-E Pattern Template
var group = vis.selectAll(“rect”) //or vis.selectAll(“text”)
.data(rawdata) //rawdata must be an array!
group.enter( ).append(“svg:rect”) //ENTER!
.attr( )
.attr( )
group //UPDATE!
.attr( )
.attr( )
group.exit( ).remove( ) //EXIT!

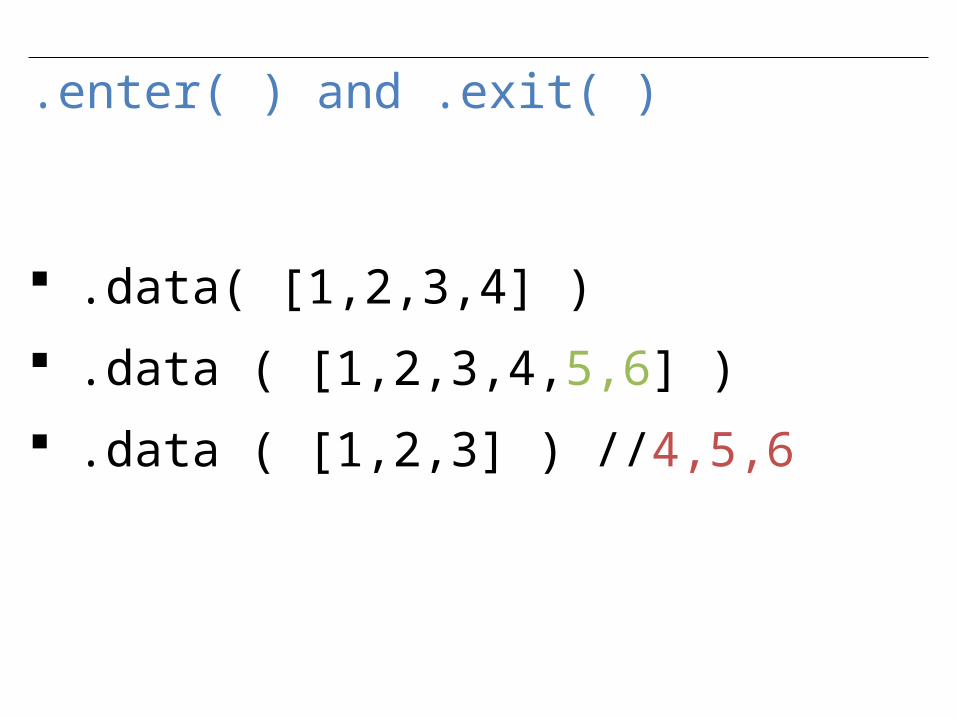
.enter( ) and .exit( )
.enter( )• New data points
.exit( )• Old data points
.enter( ) and .exit( )
.data( [1,2,3,4] )
.data ( [1,2,3,4,5,6] )
.data ( [1,2,3] ) //4,5,6
E-U-E Pattern Template
var group = vis.selectAll(“rect”) //or vis.selectAll(“text”)
.data(rawdata) //rawdata must be an array!
group.enter( ).append(“svg:rect”) //ENTER!
.attr( )
.attr( )
group //UPDATE!
.attr( )
.attr( )
group.exit( ).remove( ) //EXIT!

.attr( )
The Attribute Method
Sets attributes such as x, y, width, height, and fill
The technical details:• rect.attr(“x”, 5)• <rect x=“5”></rect>

.attr( ) and Functional Programming
[ {size: 10}, {size: 8}, {size: 12.2} ]
.attr(“height”, function(d,i){ return d.size })• d: the data point
.attr(“x”, function(d,i){ return i*5; })• i: the index of the data point
<rect height=“10” x=“5”></rect><rect height=“8” x=“10”></rect><rect height=“12.2” x=“15”></rect>
<text> elements
<text> elements I’m going to apologize in advance
here for the lousy job the w3c did with the <text> definition.
You’re going to have to just either memorize these things or keep referring back to http://www.w3c.org/TR/SVG/text.html (first Google hit for “svg text”) like I do.
<text> elements
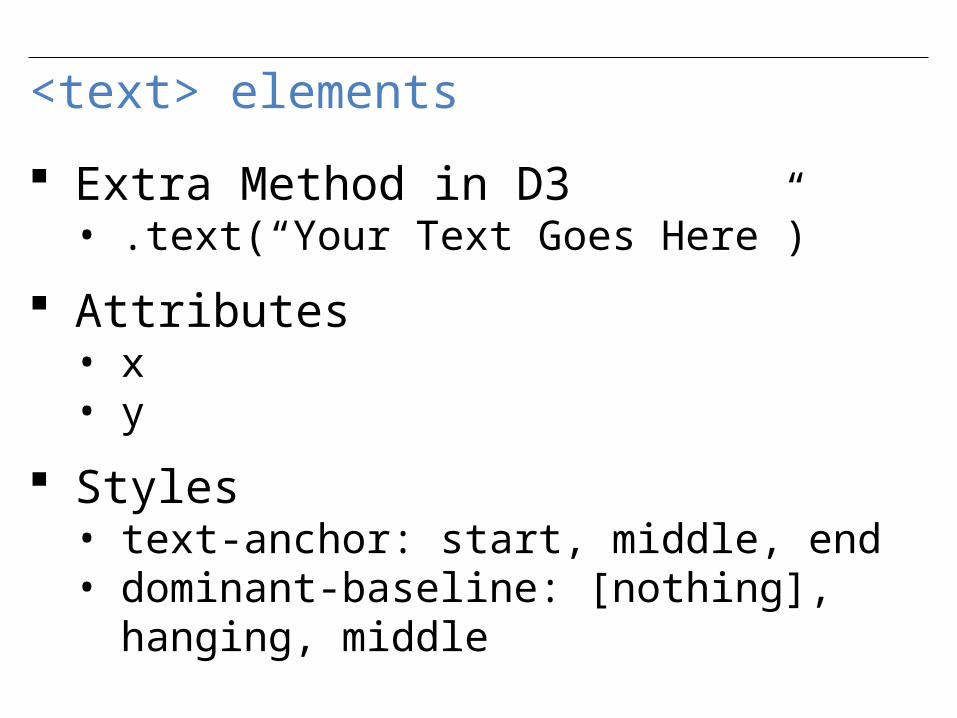
Extra Method in D3• .text(“Your Text Goes Here”)
Attributes• x• y
Styles• text-anchor: start, middle, end• dominant-baseline: [nothing],
hanging, middle

text-anchor style
This is my line of text.start endmiddle
Where is (0,0)?

dominant-baseline style
This is my line of text.hanging
default
middle
Where is (0,0)?
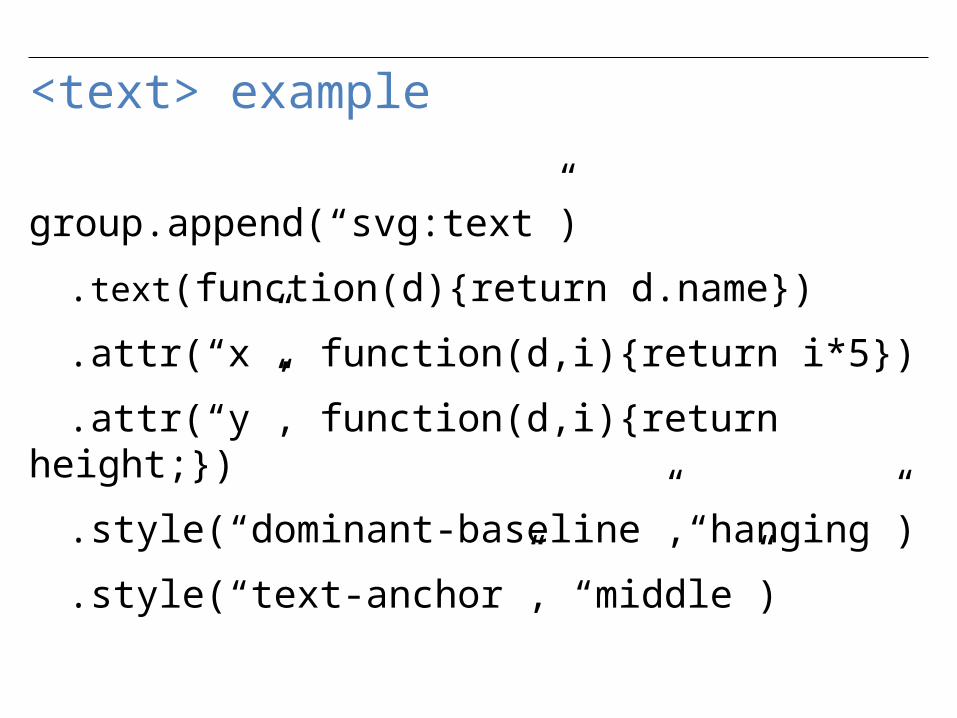
<text> example
group.append(“svg:text”)
.text(function(d){return d.name})
.attr(“x”, function(d,i){return i*5})
.attr(“y”, function(d,i){return height;})
.style(“dominant-baseline”,“hanging”)
.style(“text-anchor”, “middle”)
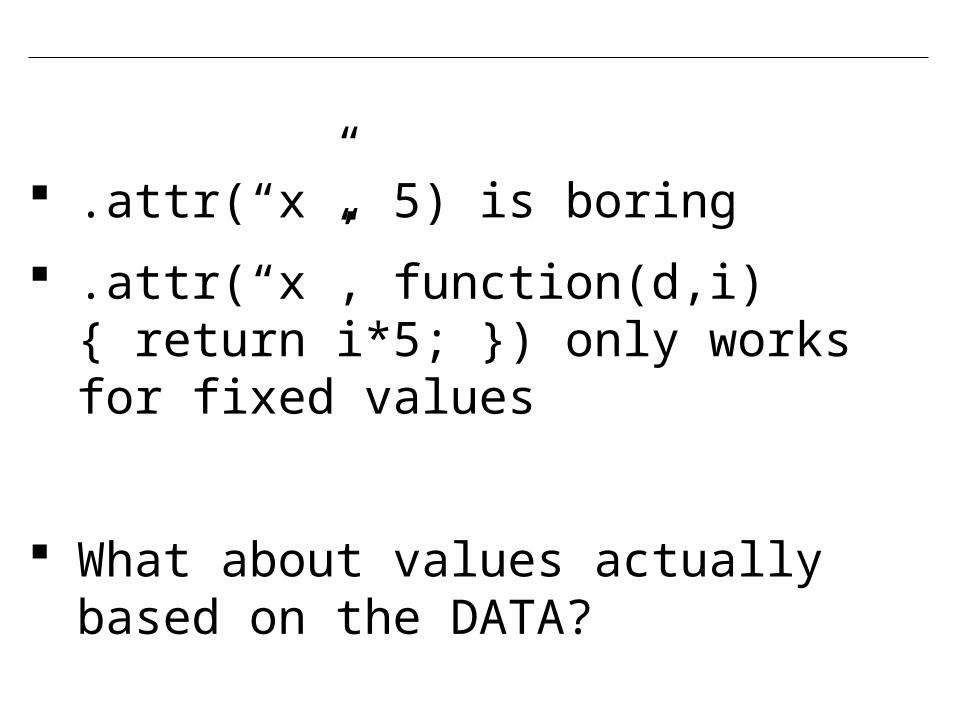
.attr(“x”, 5) is boring
.attr(“x”, function(d,i){ return i*5; }) only works for fixed values
What about values actually based on the DATA?
Scales
Scales
D3 has many types of scales
I am only going to cover two:• Linear Scales• Categorical (color) Scales

Linear Scales
var xscale = d3.scale.linear( )• .domain( [min, max] )• .range( [minOut, maxOut] )
group.attr(“x”, function(d,i){• return xscale(d.size);})
y = mx+b
Min and Max
But how do you figure out the min and max for the domain?

D3
A really powerful for-loop with a ton of helper functions.

Min and Max
d3.min( [ ] ) number
d3.max( [ ] ) number
d3.extent( [ ] ) [number,number]

Min and Max
d3.min( [ ] ) number
d3.max( [ ] ) number
d3.extent( [ ] ) [number,number]
Hint: All can be combined with• .map( function(d){ } ), which returns
an [ ]

Linear Scales
You can even keep the same scale, and just update the domain and/or range as necessary
Note: This will not update the graphics all on its own

So what about those colors in the HW?
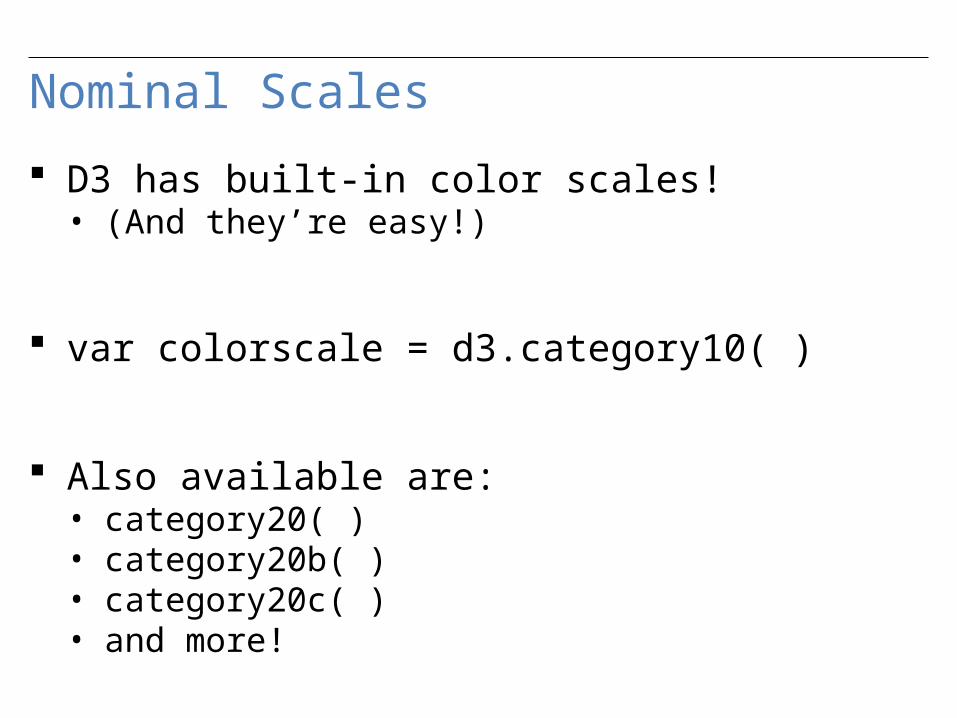
Nominal Scales
D3 has built-in color scales!• (And they’re easy!)
var colorscale = d3.category10( )
Also available are:• category20( )• category20b( )• category20c( )• and more!

Nominal Scales
[ {type:‘Bird’},{type:‘Rodent’},{type:‘Bird’} ]
var colorscale = d3.category10( )
.attr(“fill”,function(d,i){• return colorscale(d.type)}
• <rect fill=“blue”></rect>• <rect fill=“orange”></rect>• <rect fill=“blue”></rect>
Axes
D3 also has visual helper-functions
such as super-easy numerical axes!

Axes (not ax-es) yaxisglyph = chart.append(“g”)
yaxis = d3.svg.axis( ).scale( yscale ) //must be a numerical scale.orient( ‘left’ ) //or ‘right’ or ‘top’ or ‘bottom’.ticks( 6 ) //number of ticks, default is 10
yaxisglyph.call(yaxis)
Extra Credit
The method you need is d3.nest( )
Neither Ramik nor I will not explain it to you beyond that. It’s Extra Credit.
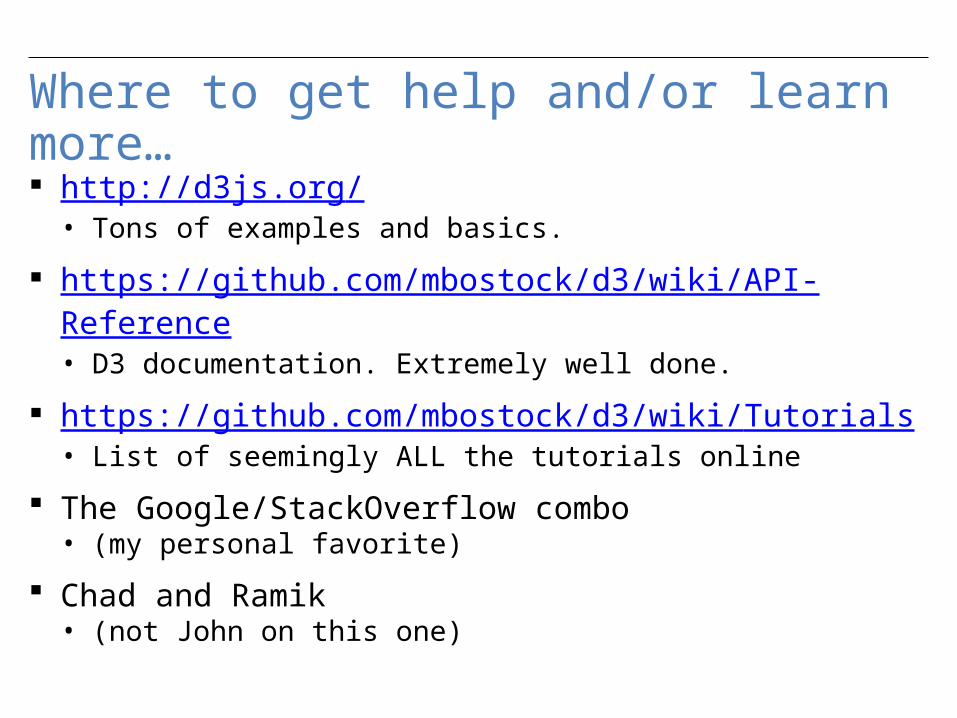
Where to get help and/or learn more… http://d3js.org/
• Tons of examples and basics.
https://github.com/mbostock/d3/wiki/API-Reference• D3 documentation. Extremely well done.
https://github.com/mbostock/d3/wiki/Tutorials• List of seemingly ALL the tutorials online
The Google/StackOverflow combo• (my personal favorite)
Chad and Ramik• (not John on this one)