d3tutorial - web.cse.ohio-state.edu
TRANSCRIPT
D3 TutorialHierarchical Layouts
Edit by Jiayi Xu and Han-Wei Shen, The Ohio State University
Hierarchical Layouts
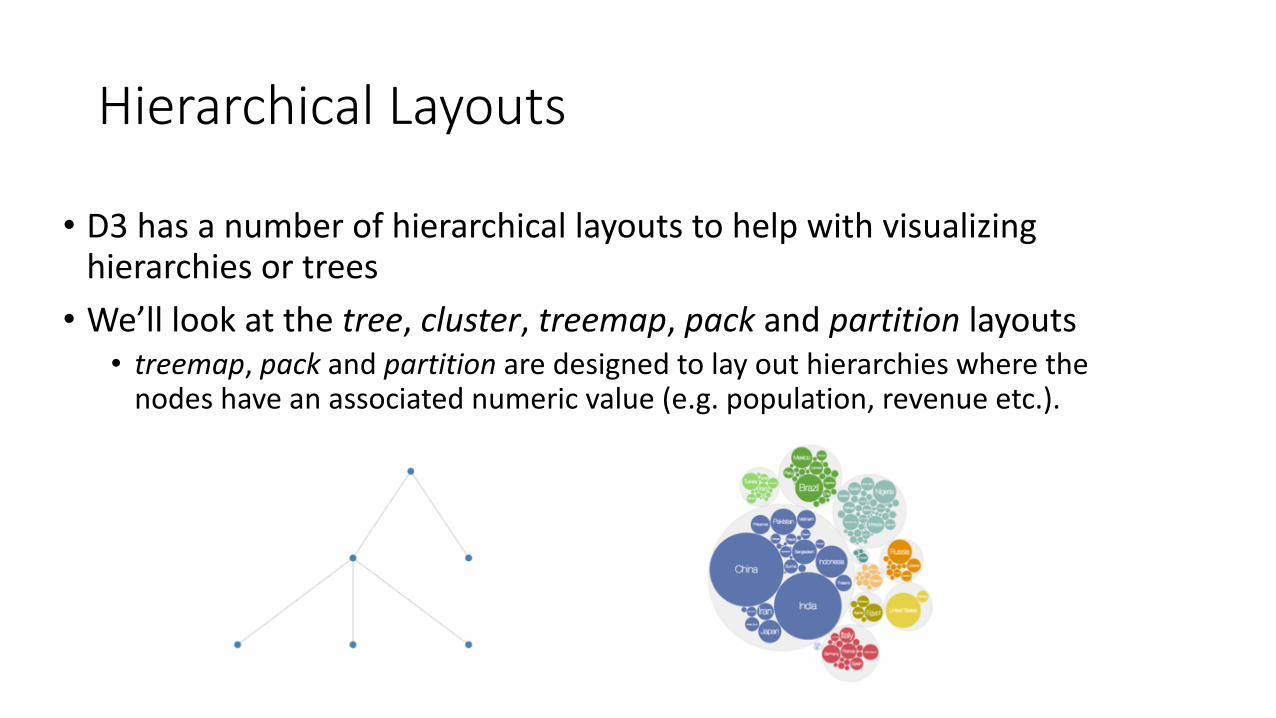
• D3 has a number of hierarchical layouts to help with visualizing hierarchies or trees• We’ll look at the tree, cluster, treemap, pack and partition layouts • treemap, pack and partition are designed to lay out hierarchies where the
nodes have an associated numeric value (e.g. population, revenue etc.).
Hierarchy – d3.hierarchy()
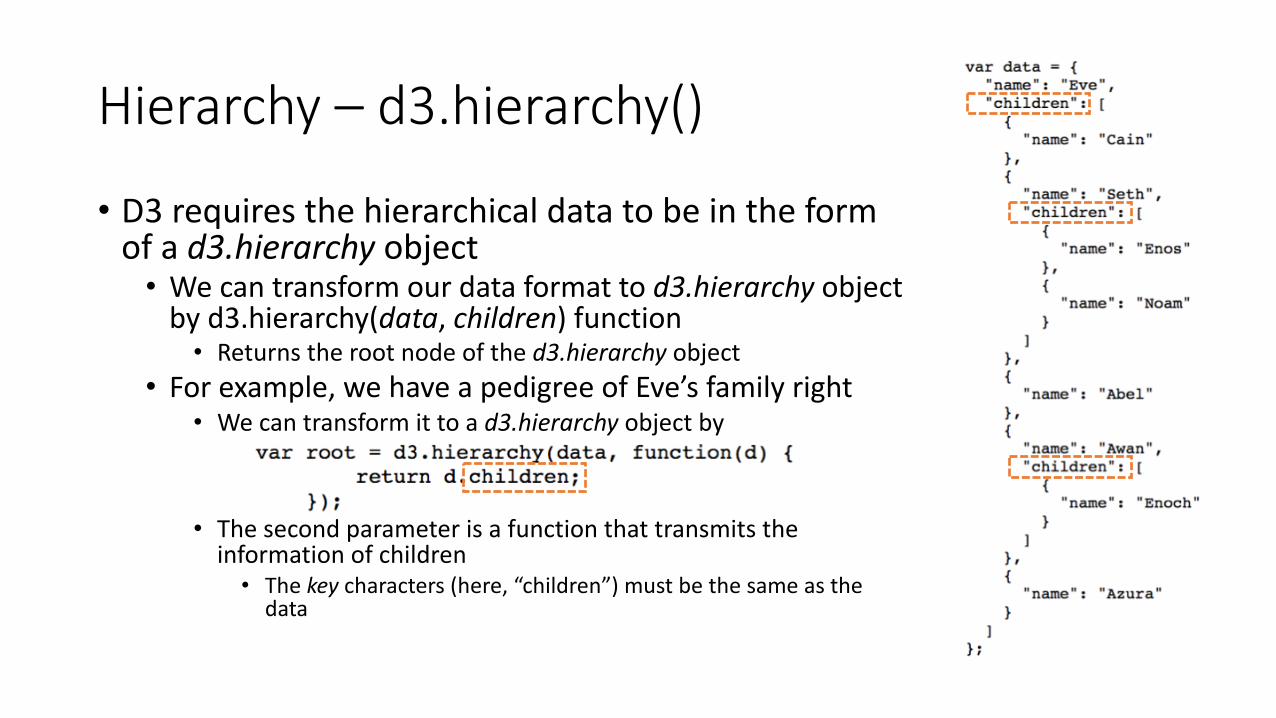
• D3 requires the hierarchical data to be in the form of a d3.hierarchy object• We can transform our data format to d3.hierarchy object
by d3.hierarchy(data, children) function• Returns the root node of the d3.hierarchy object
• For example, we have a pedigree of Eve’s family right• We can transform it to a d3.hierarchy object by
• The second parameter is a function that transmits the information of children• The key characters (here, “children”) must be the same as the
data
Hierarchy – d3.hierarchy()
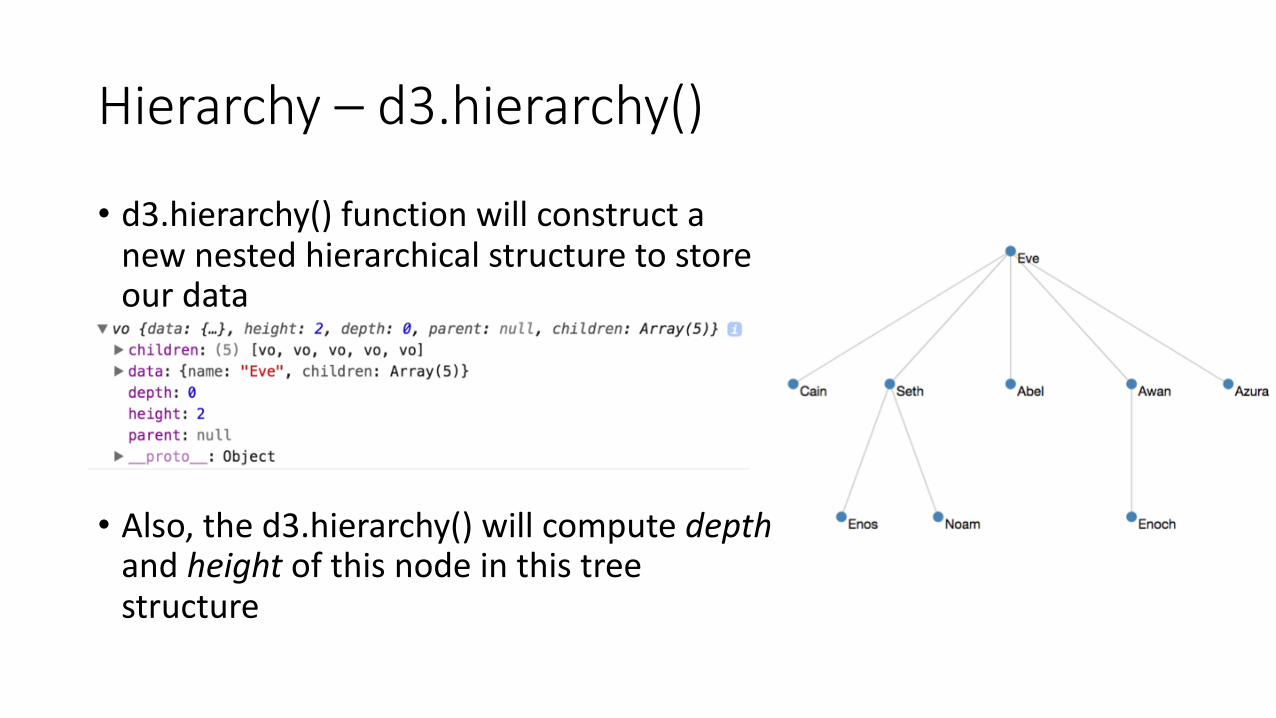
• d3.hierarchy() function will construct a new nested hierarchical structure to store our data
• Also, the d3.hierarchy() will compute depth and height of this node in this tree structure
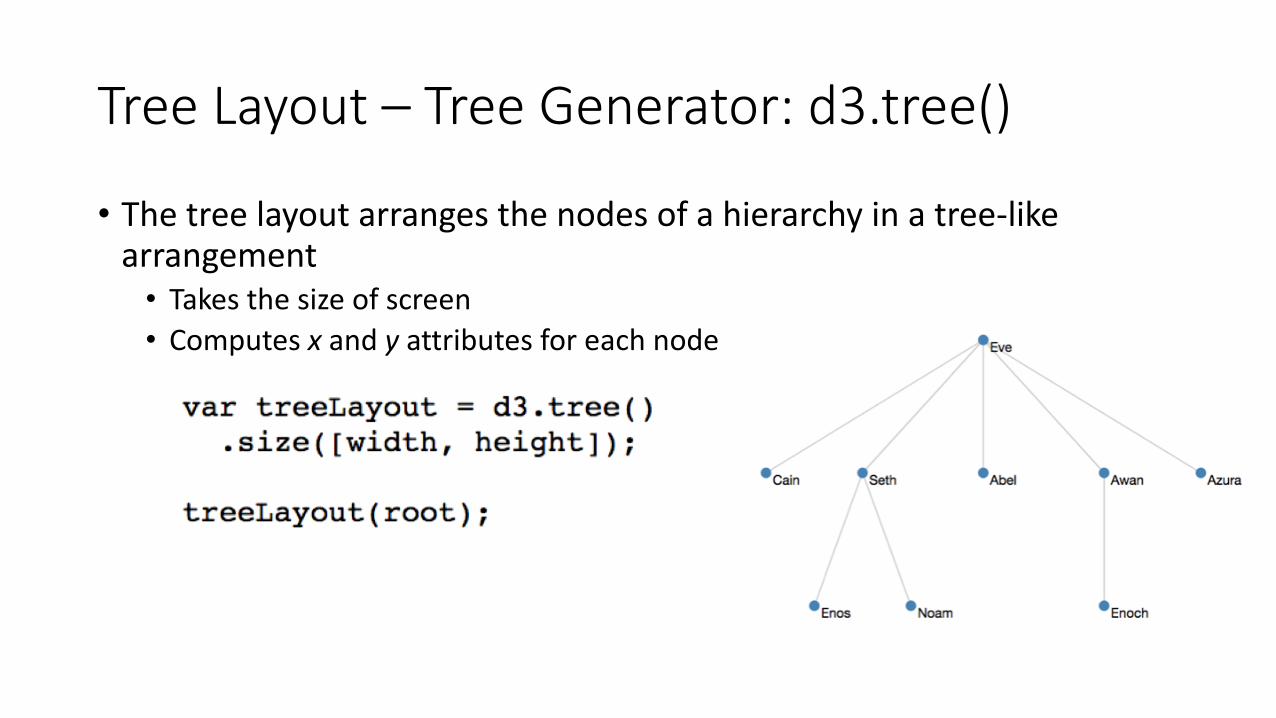
Tree Layout – Tree Generator: d3.tree()
• The tree layout arranges the nodes of a hierarchy in a tree-like arrangement• Takes the size of screen• Computes x and y attributes for each node
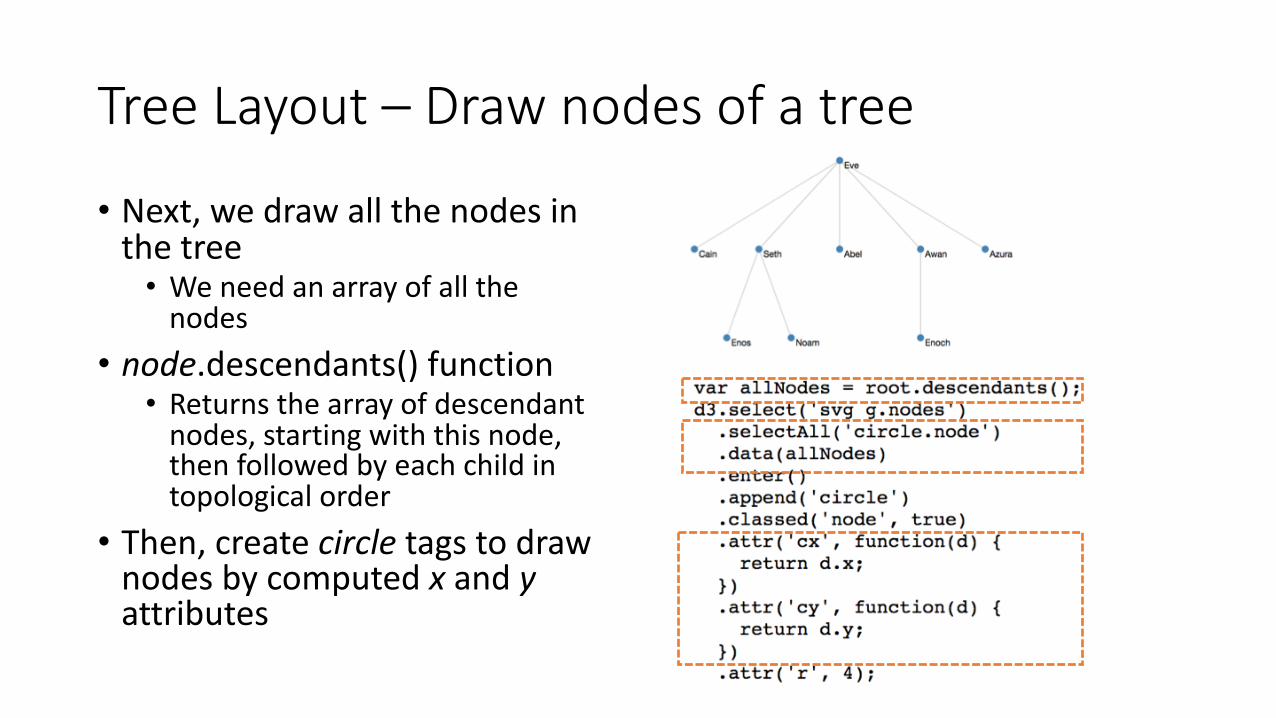
Tree Layout – Draw nodes of a tree
• Next, we draw all the nodes in the tree• We need an array of all the
nodes• node.descendants() function
• Returns the array of descendant nodes, starting with this node, then followed by each child in topological order
• Then, create circle tags to draw nodes by computed x and yattributes
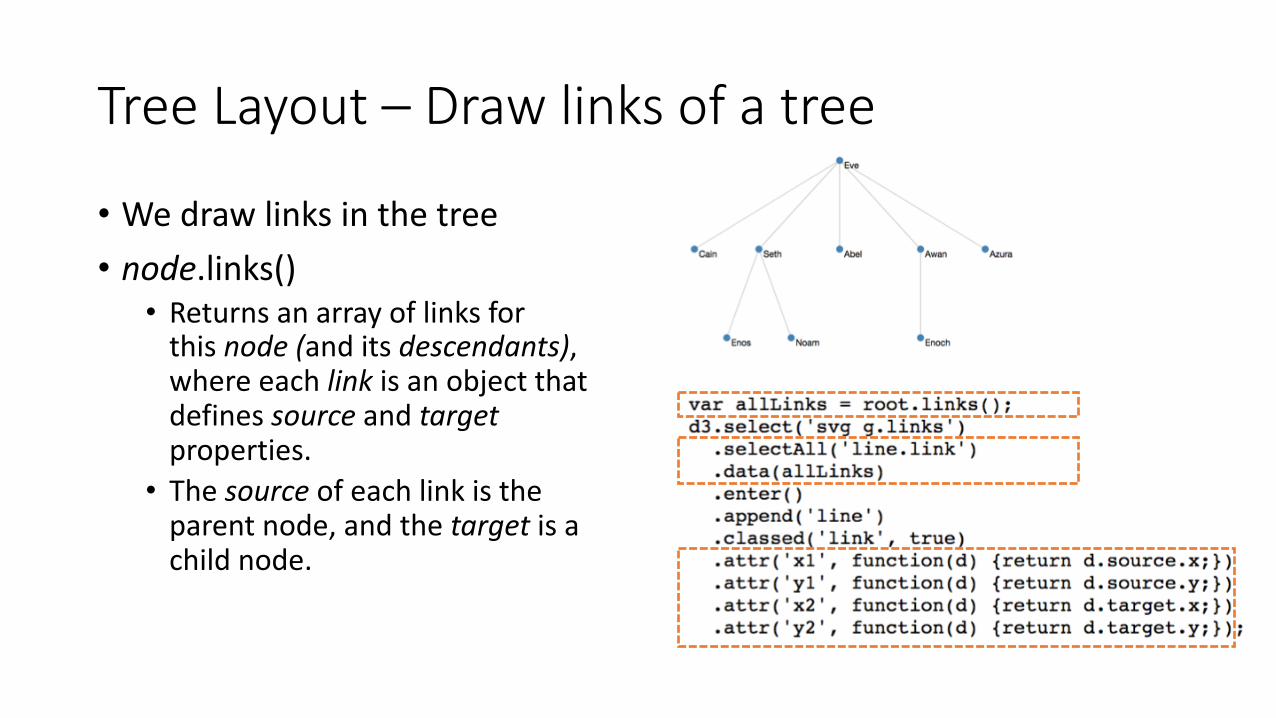
Tree Layout – Draw links of a tree
• We draw links in the tree• node.links()
• Returns an array of links for this node (and its descendants), where each link is an object that defines source and targetproperties. • The source of each link is the
parent node, and the target is a child node.
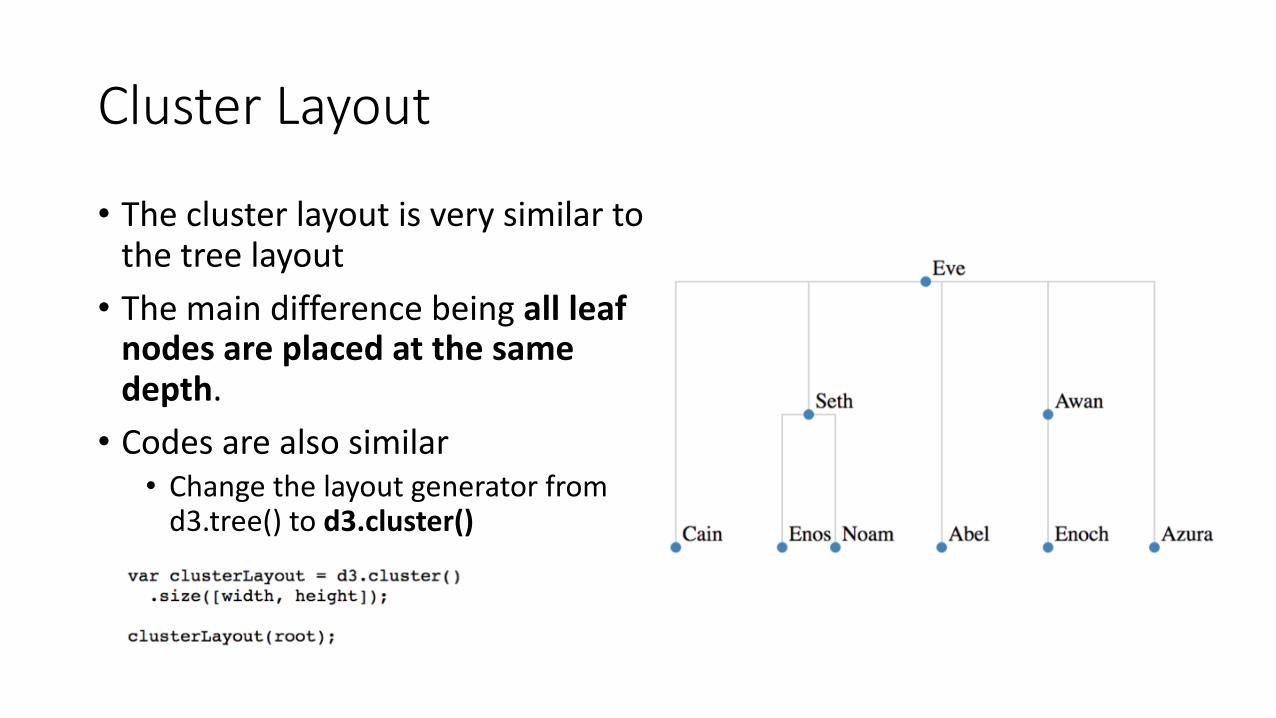
Cluster Layout
• The cluster layout is very similar to the tree layout• The main difference being all leaf
nodes are placed at the same depth.• Codes are also similar
• Change the layout generator from d3.tree() to d3.cluster()
Treemap Layout
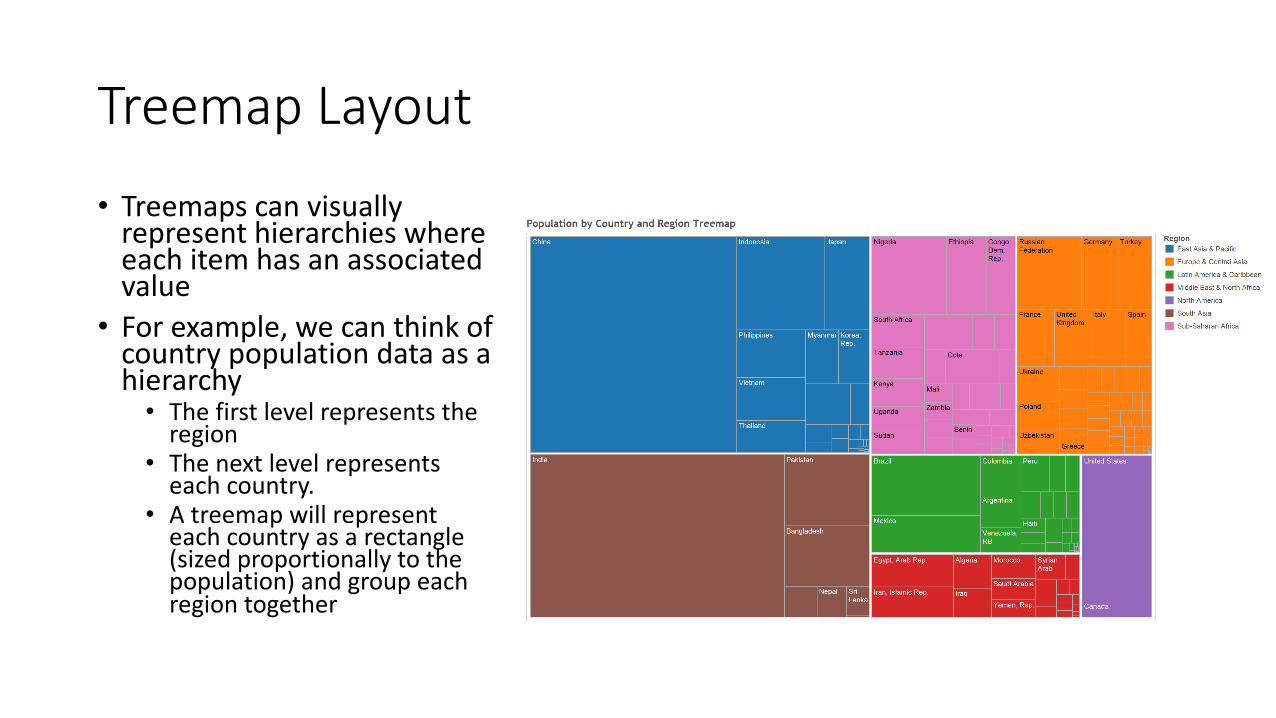
• Treemaps can visually represent hierarchies where each item has an associated value• For example, we can think of
country population data as a hierarchy• The first level represents the
region• The next level represents
each country. • A treemap will represent
each country as a rectangle (sized proportionally to the population) and group each region together

Treemap Layout – Create a treemap
• Data• A fake hierarchical data• Each leaf node has a quantity value (e.g.
population or revenue)
100 300 200
200

Treemap Layout – Create a treemap
• Construct the hierarchy structure
• Calculate values of parents• Equals to sum of children’s values• node.sum() can calculates the sums
automatically
100 300 200
200600
800
Treemap Layout – Create a treemap
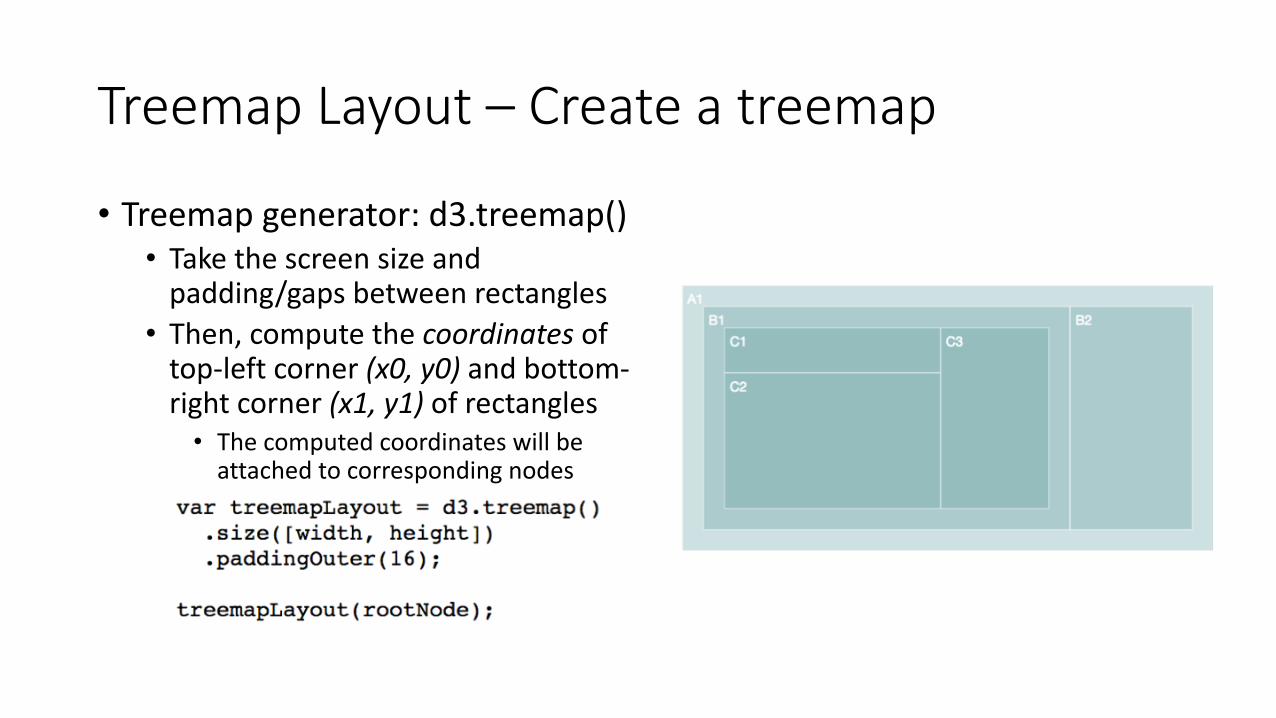
• Treemap generator: d3.treemap()• Take the screen size and
padding/gaps between rectangles• Then, compute the coordinates of
top-left corner (x0, y0) and bottom-right corner (x1, y1) of rectangles• The computed coordinates will be
attached to corresponding nodes
Treemap Layout – Create a treemap
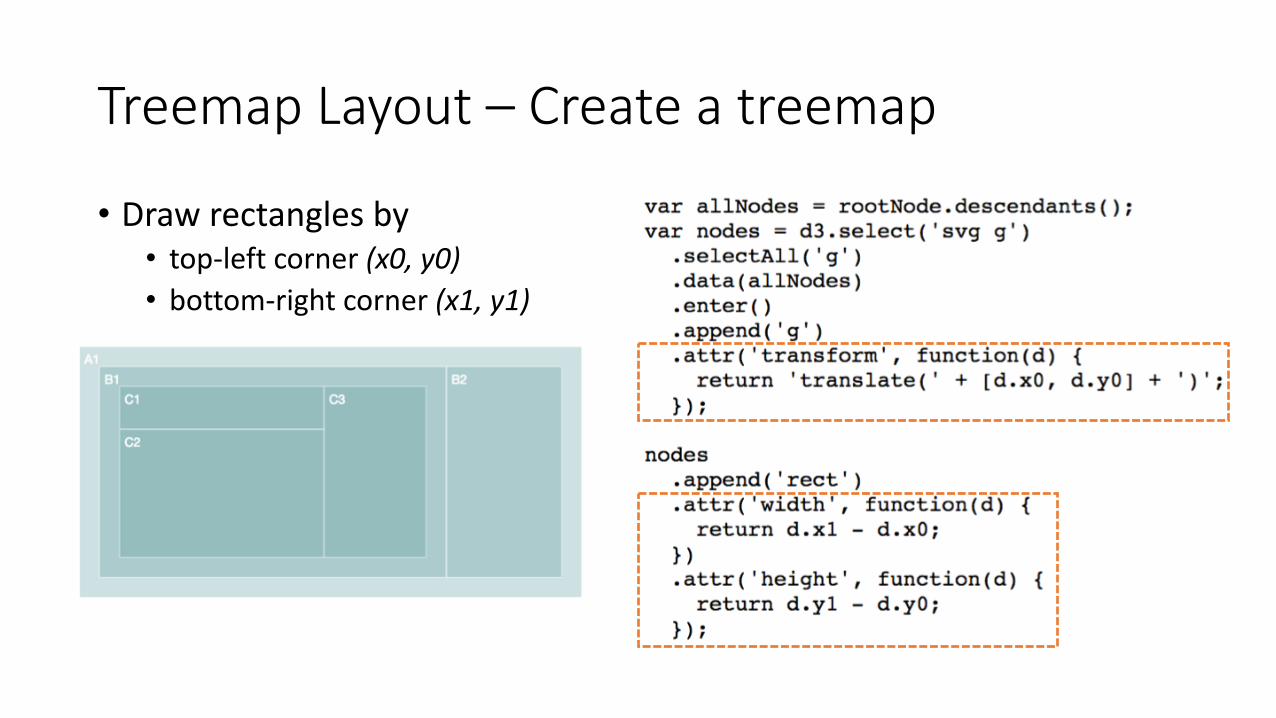
• Draw rectangles by• top-left corner (x0, y0)• bottom-right corner (x1, y1)
Treemap Layout – Tiling methods
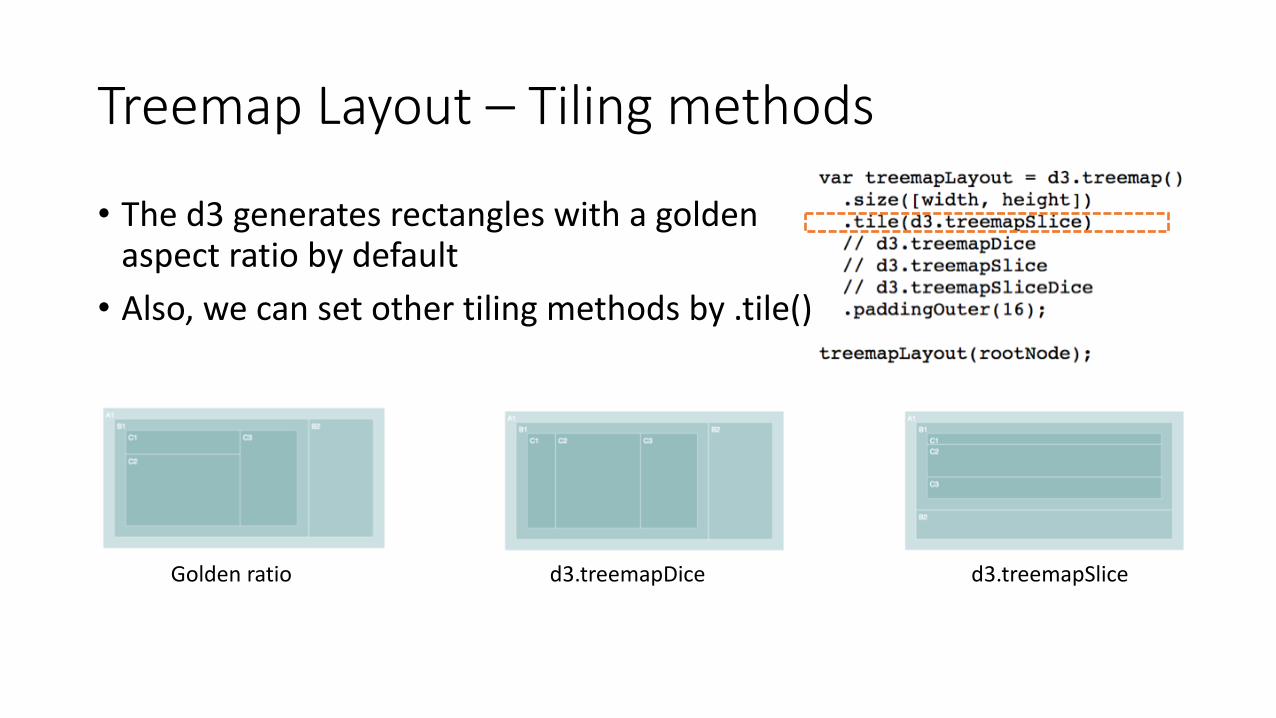
• The d3 generates rectangles with a golden aspect ratio by default• Also, we can set other tiling methods by .tile()
Golden ratio d3.treemapDice d3.treemapSlice
Pack Layout
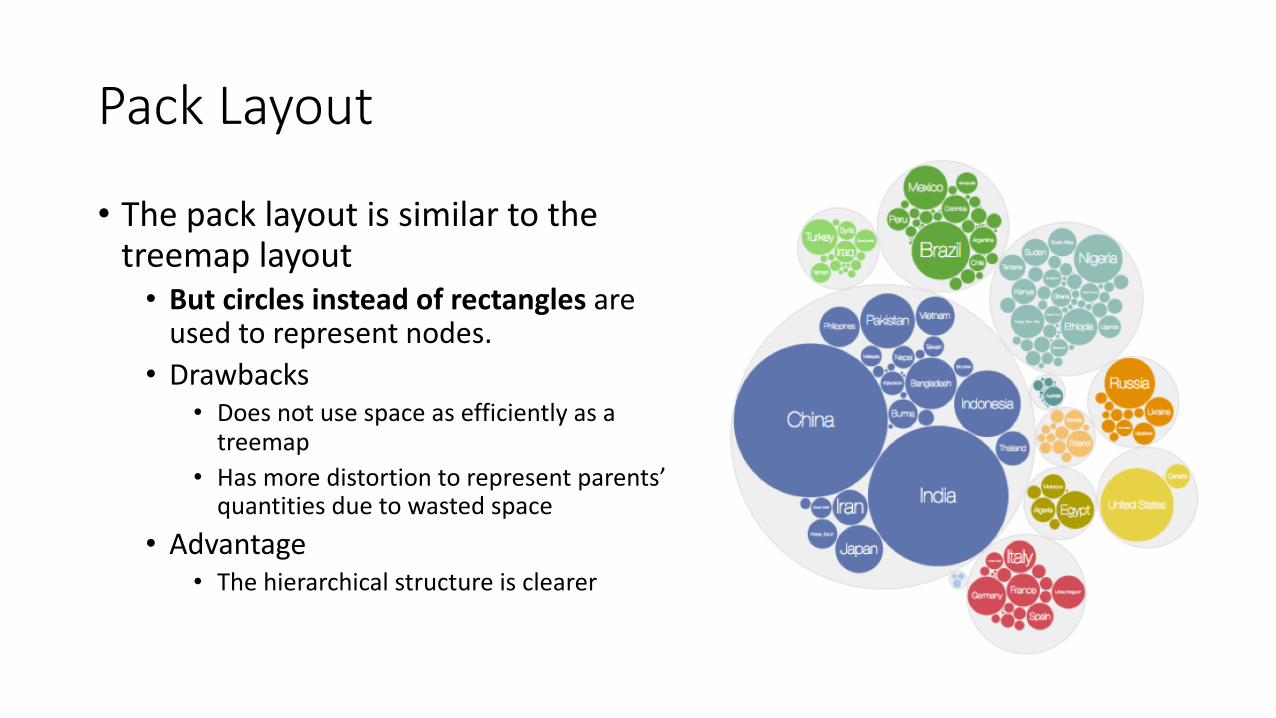
• The pack layout is similar to the treemap layout• But circles instead of rectangles are
used to represent nodes. • Drawbacks
• Does not use space as efficiently as a treemap
• Has more distortion to represent parents’ quantities due to wasted space
• Advantage• The hierarchical structure is clearer
Pack Layout – Create a circle packing
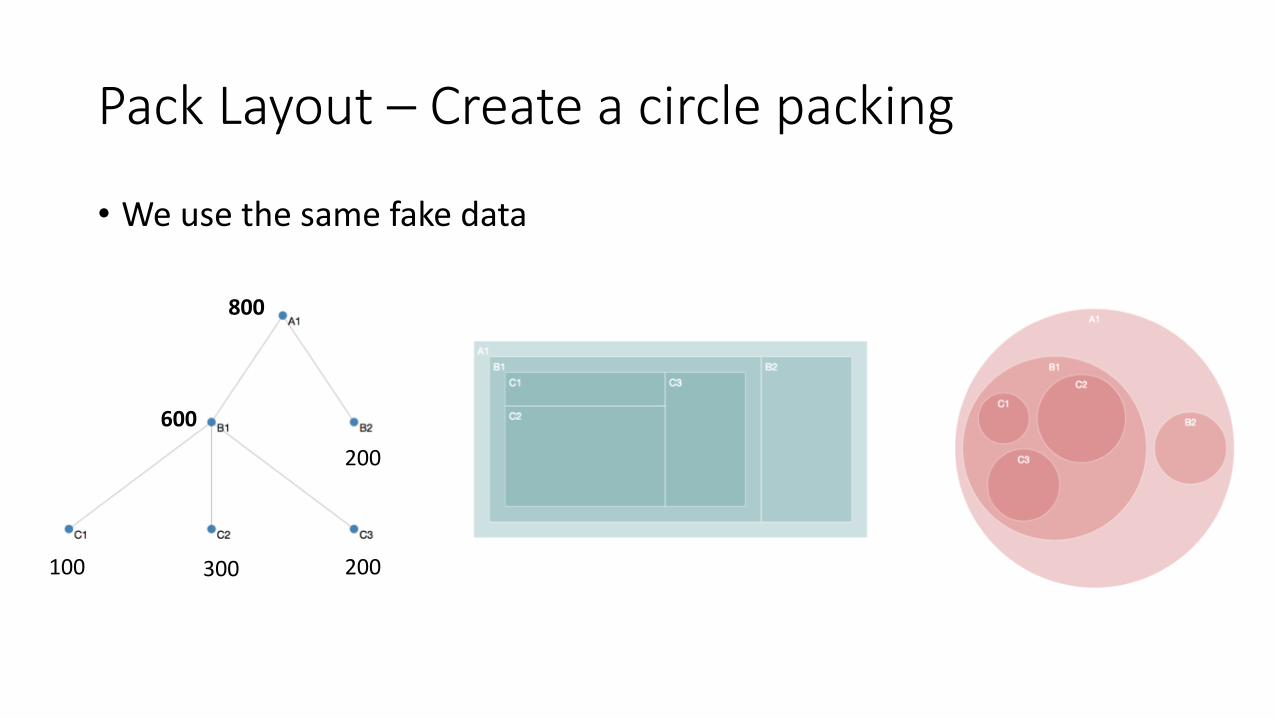
• We use the same fake data
100 300 200
200600
800
Pack Layout – Create a circle packing
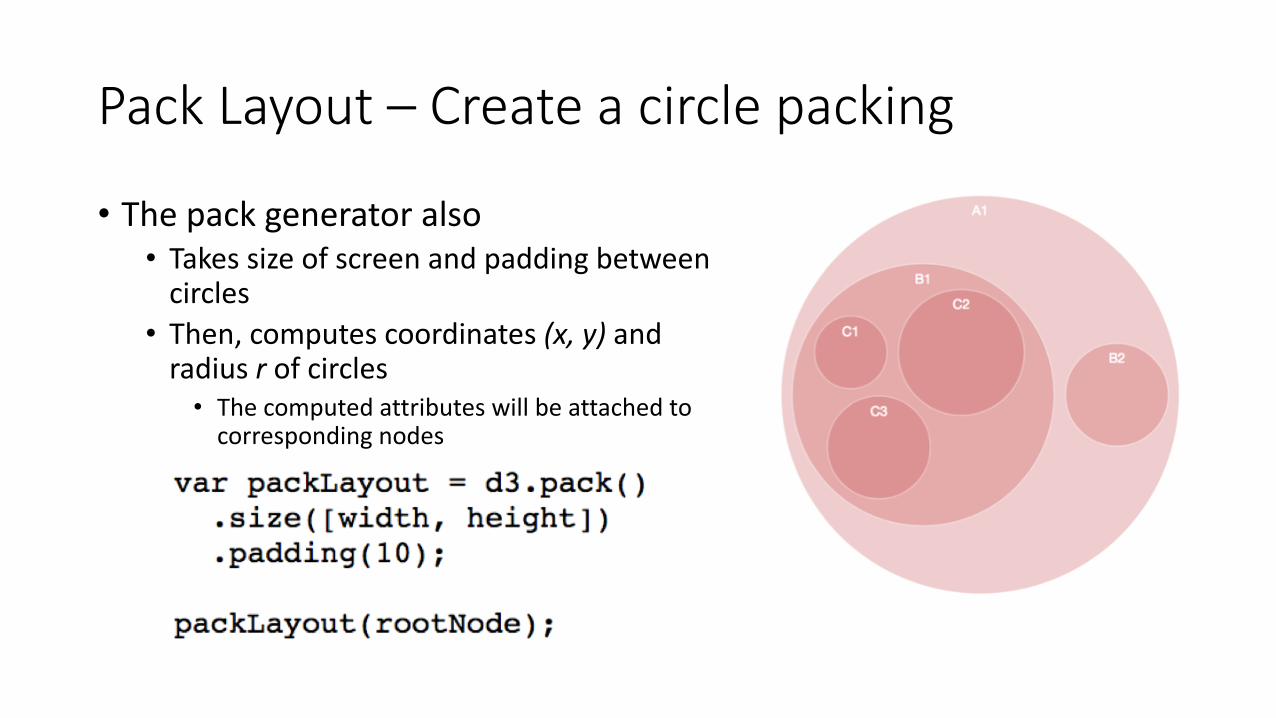
• The pack generator also• Takes size of screen and padding between
circles• Then, computes coordinates (x, y) and
radius r of circles• The computed attributes will be attached to
corresponding nodes
Pack Layout – Create a circle packing
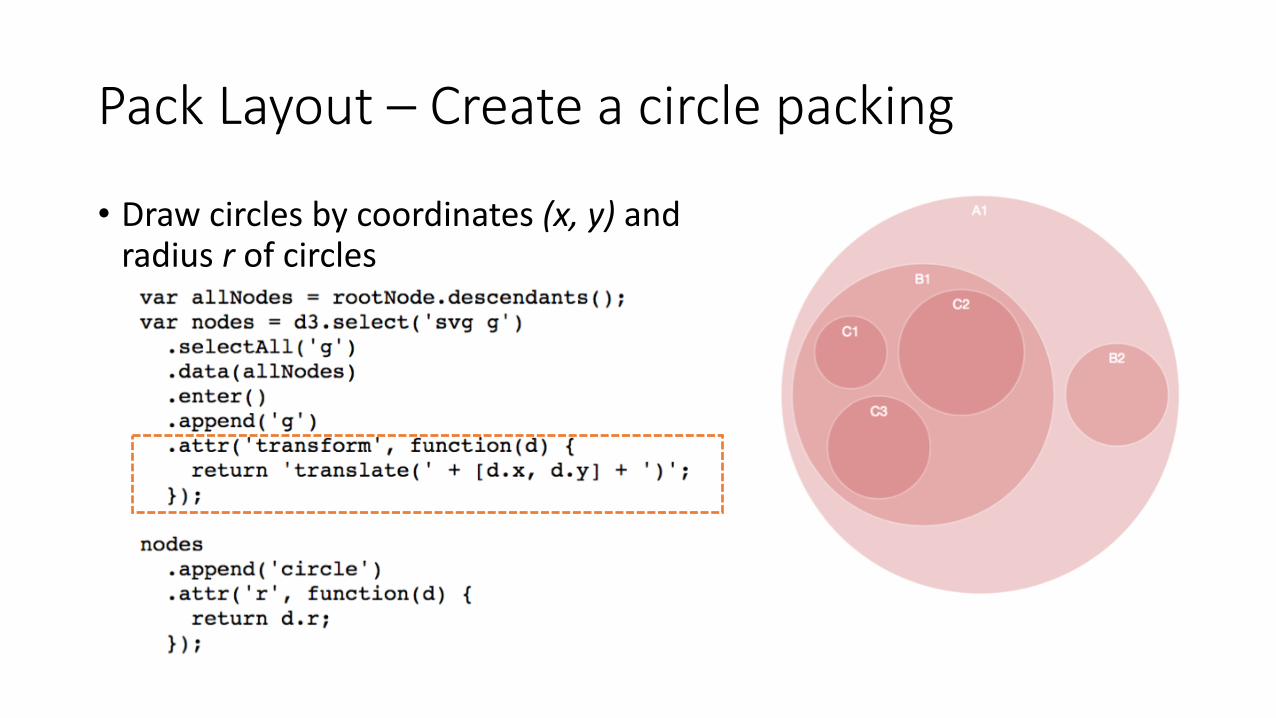
• Draw circles by coordinates (x, y) and radius r of circles
Partition Layout
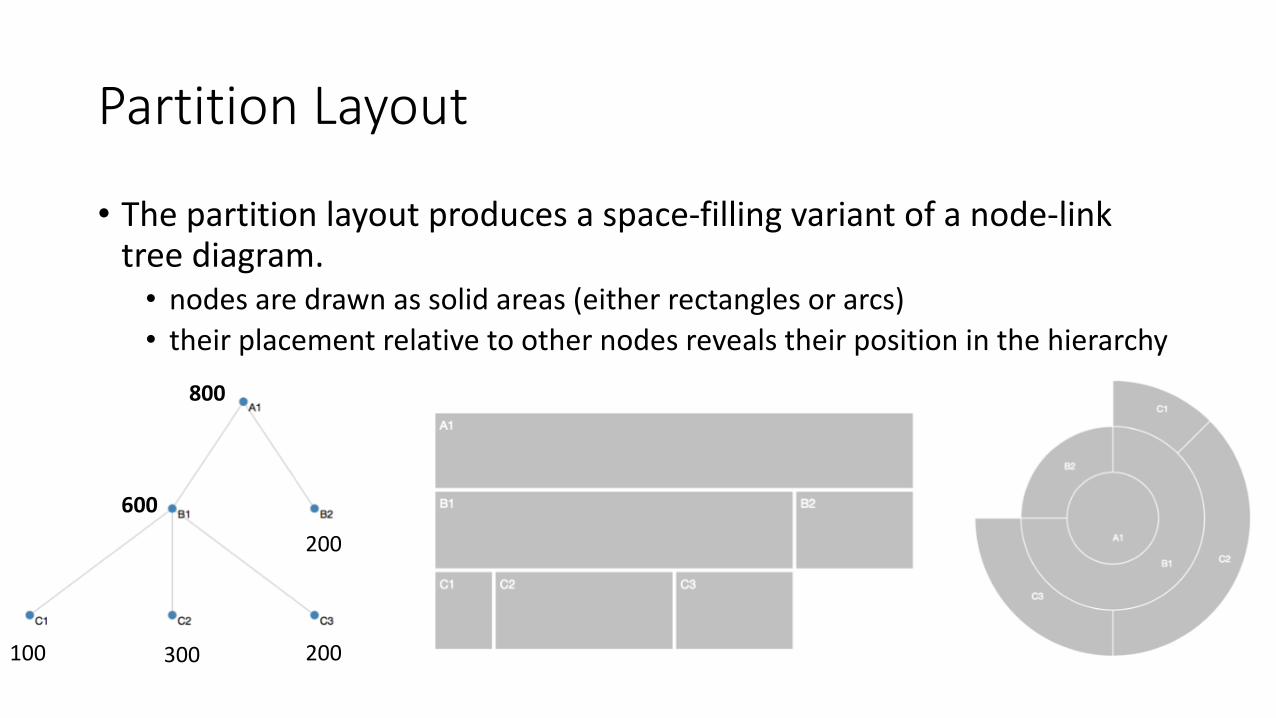
• The partition layout produces a space-filling variant of a node-link tree diagram.• nodes are drawn as solid areas (either rectangles or arcs)• their placement relative to other nodes reveals their position in the hierarchy
100 300 200
200600
800
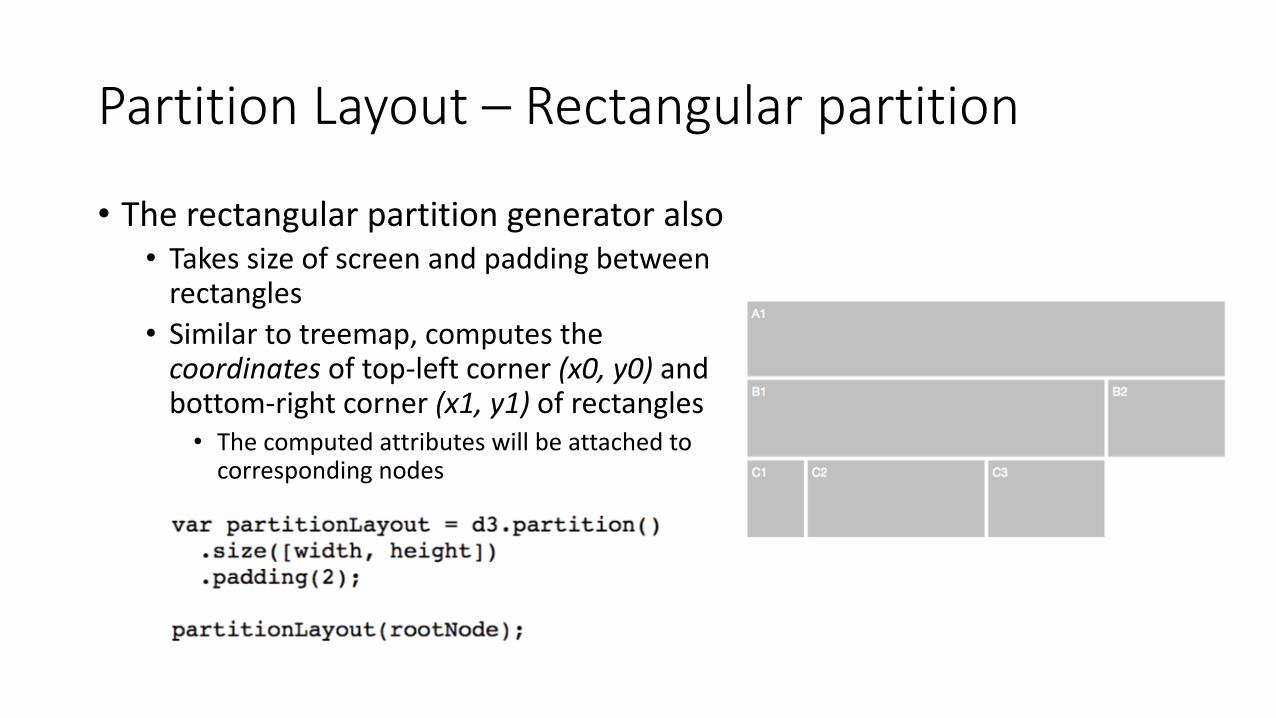
Partition Layout – Rectangular partition
• The rectangular partition generator also• Takes size of screen and padding between
rectangles• Similar to treemap, computes the
coordinates of top-left corner (x0, y0) and bottom-right corner (x1, y1) of rectangles• The computed attributes will be attached to
corresponding nodes

Partition Layout – Rectangular partition
• Similar to treemap, draw rectangles by• top-left corner (x0, y0)• bottom-right corner (x1, y1)
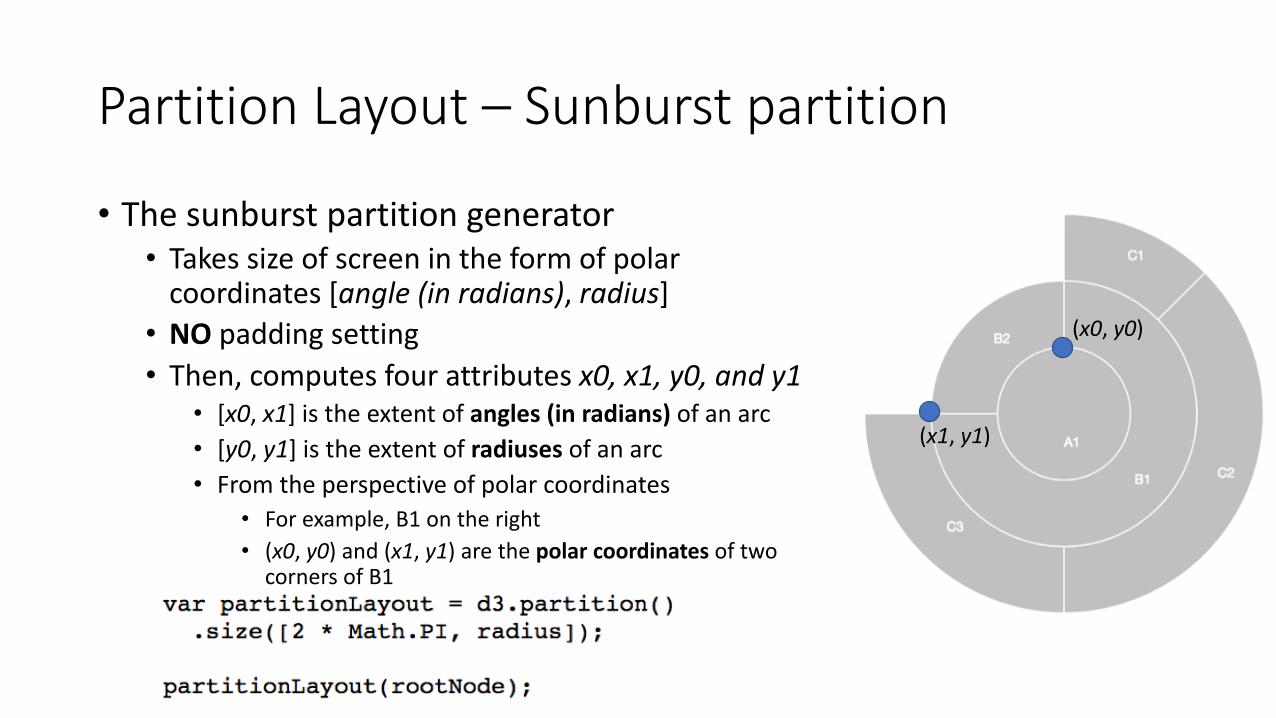
Partition Layout – Sunburst partition
• The sunburst partition generator• Takes size of screen in the form of polar
coordinates [angle (in radians), radius]• NO padding setting• Then, computes four attributes x0, x1, y0, and y1
• [x0, x1] is the extent of angles (in radians) of an arc• [y0, y1] is the extent of radiuses of an arc• From the perspective of polar coordinates
• For example, B1 on the right• (x0, y0) and (x1, y1) are the polar coordinates of two
corners of B1
(x0, y0)
(x1, y1)
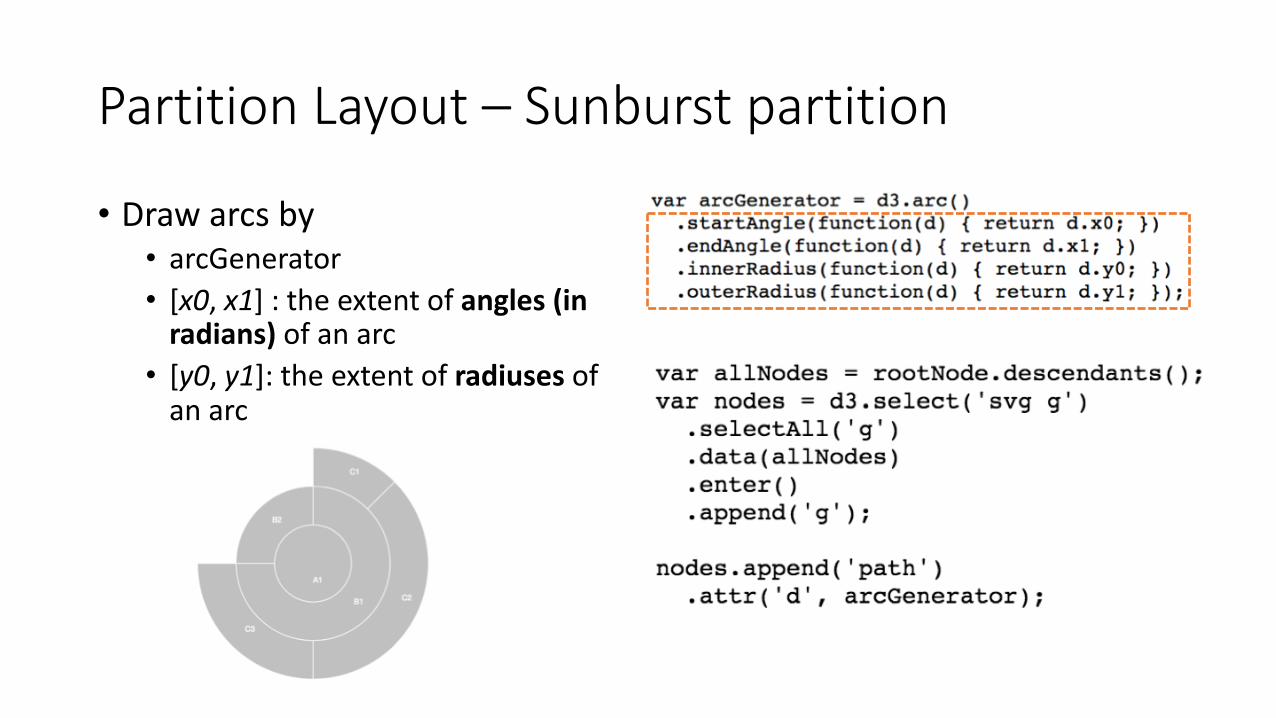
Partition Layout – Sunburst partition
• Draw arcs by• arcGenerator• [x0, x1] : the extent of angles (in
radians) of an arc• [y0, y1]: the extent of radiuses of
an arc