d4.4 report scenario modeling ebridge: empowering e … · d4.4 report scenario modeling ebridge:...
TRANSCRIPT

D4.4 Report Scenario Modeling eBRIDGE: Empowering e-fleets for business and private purposes in cities
Programme STEER Project number IEE/12/713/SI2.644746 Work package WP4 Evaluation and Scenarios Delivered September 2015 Authors Charalampos Marmaras – Cardiff University
e-mail: [email protected] Erotokritos Xydas – Cardiff University e-mail: [email protected] Liana M. Cipcigan – Cardiff University e-mail: [email protected]
Project coordinator Aida Abdulah – choice GmbH e-mail: [email protected]

2
Table of contents Table of contents ................................................................................................................. 2
1. Executive Summary ........................................................................................................ 3
2. Introduction ..................................................................................................................... 4
3. Background and purpose of the deliverable ................................................................. 4
4. Analysis on EV trips ........................................................................................................ 6
4.1 Data description ........................................................................................................... 6
4.2 Analysis & Results ....................................................................................................... 7
4.3 Conclusions ................................................................................................................26
5. Analysis on EV electricity consumption .......................................................................27
5.1 Data description ..........................................................................................................27
5.2 Analysis & Results ......................................................................................................27
5.3 Conclusions ................................................................................................................37
6. Analysis on CO2 emissions ...........................................................................................38
6.1 Data description ..........................................................................................................38
6.2 Data analysis methodology .........................................................................................38
6.3 Conclusions ................................................................................................................46
7. References ......................................................................................................................47

3
1. Executive Summary
This report presents the key finding arising from the participating sites Berlin (Germany),
Bregenz (Austria), Carmarthen (Wales), Lisbon (Portugal), Milan (Italy), Valencia (Spain) and
Vigo (Spain) using car sharing schemes for business and private urban travel. The extensive
volume of EVs trial data collected in the project was used to comprehensively characterize
the operational urban fleet performances. This analysis is important in the European context,
as there is limited (although rapidly growing) recording data of actual EVs usage and
charging patterns. The data collected is covering a period of more than two years, therefore
provides a relevant input into understanding the following factors:
1. Total number of Trips per Hour of Day
2. Total number of Trips per Day of Week
3. Total number of Trips per Month
4. Total travelled Distance (km) per Month
5. Total number of Trips per Trip Duration
6. Total number of Trips per Trip Distance
7. Total number of Trips per Trip Av. Speed
The evidence collected on actual usage patterns were used to calculate the weekly EV
usage probability and this stresses the importance of the quantitative data gathered in the
eBRIDGE trials.
The characteristics of the EV demand are very relevant to understand the charging behavior
and the charging stations usage. This can be used by the Distribution System Operators
(DSOs) to estimate the additional electricity demand for the EV charging and assist network
planning operators to accommodate the EVs additional load. The analysis of the eBRIDGE
trial data covers:
1. Total number of Ch. Events per Hour of Day
2. Total number of Ch. Events per Day of Week
3. Total number of Ch. Events per Month
4. Total consumed Energy (kWh) per Month
5. Total number of Ch. Events per Ch. Event Duration
6. Total number of Ch. Events per Ch. Event Energy
7. Av. Energy Consumption vs Av. Speed
Analyzing the data the probability of EVs charging station occupancy was calculated for the
car sharing EV fleet in Lisbon, the trial that provided the most comprehensive set of data.
When considering the well-to-tank emissions of EVs for year 2020 the predicted electricity
generation mix is highly important, as EVs do not cause local emissions but could shift
emissions to power generation facilities. The CO2 reduction analysis for year 2020 was
based on the following factors:
1. Projected number of ICE vehicles
2. Carbon intensity of ICE vehicles
3. Projected number of EVs
4. Energy consumption efficiency of EV
5. Carbon intensity of electricity generation
6. Annual travelled distance of ICE vehicles and EVs

4
2. Introduction
Electric vehicles (EVs) are potentially an important component of a clean and sustainable
transport future. Across the world, governments have started to implement CO2 emissions
cuts based on vehicle tax systems, targeting either acquisition taxes or annual road taxations
[1]. The ‘50 by 50’ Global Fuel Economy Initiative [2] sets the goal to increase the global car
fleet efficiency by 50% by 2050, for which a higher portion of cars are expected to be EV. To
reach this ambitious goal a higher portion of private transportation has to be covered by EV
as conventional cars are getting closer to the limits of the theoretical efficiency of combustion
engines and are unlikely to improve much further [1]. According to Citigroup Global Markets,
CO2 emission standards are a strong driver to introduce ‘zero’ or ‘near-zero’ emission cars
[3]. The innovation captured by electric vehicles is the reduction of CO2 emissions and the
resulting revolution in road transport particularly in highly urbanized areas. Electricity is likely
to become the preferred energy vector for a new generation of road vehicles. But the overall
reduction potential of electric vehicles is highly dependent on the assumed mixture of
electricity supply and the related carbon-intensity. Electric vehicles do not cause local
emissions but could move emissions to power generation facilities. Environmental benefits
arising from electro-mobility concept needs to be designed in a way that emission reduction
in the transport sector is not offset by increases of emission in other sectors.
eBRIDGE is a co-funded EU project to promote electric fleets for urban travel in European
cities. The project aims to bring innovation and new technologies to make today’s mobility
cleaner, more efficient and sustainable. During eBRIDGE, alternatives to current mobility
patterns will be explored in order to analyze whether electric mobility is a feasible option to
make cities cleaner and more sustainable. The project aims to demonstrate how the
introduction of electric vehicles in fleets for business and private urban travel can efficiently
contribute to the improvement of market conditions for the electric mobility sector.
3. Background and purpose of the deliverable
A detailed analysis of the data collected from the participating sites Berlin (Germany),
Bregenz (Austria), Carmarthen (Wales), Lisbon (Portugal), Milan (Italy), Valencia (Spain) and
Vigo (Spain) was conducted in order to analyze the usage patterns and travel behavior of
the car-sharing EV fleets. The data collected in each trial covered three board areas: (i)
characteristics of the EVs fleet (e.g. EVs type, number of cars, brand, vehicle range) (ii) the
distance and duration of each EV trip and (iii) the battery state of charge and the energy
consumption. Based on the data collected an analysis of EVs trips and EV energy
consumption was performed to evaluate the predicted EVs usage based on historical data
collected. The content of this analysis came from the authors’ expertise and knowledge in
analysis data from similar trials in UK [4] [5] [6].
This report is the deliverable of Task 4.4 of Work Package 4—Evaluation and Scenarios—of
the pilot schemes. In order to address the carbon reduction (IEE common performance
indicator), the CO2 emissions analysis was performed based on the projected carbon
intensity of the grid for each country and the predicted EVs uptake.

5
The participating sites car sharing fleets characteristics are:
1. Berlin - The case study is based on the e-Flinkster fleet located on the EUREF Campus, a business and research cluster with more than 40 companies and around 2,000 employees. Flinkster is the car sharing offer of DB FuhrparkService, operating a fleet of 240 vehicles in Berlin, of which 40 are electric (as of 2013).
2. Austria - Caruso peer-to-peer car sharing for both business and private purposes. 3. Vigo - “The Galician Automotive Cluster (CEAGA) gathers 105 entities, 41 big
companies and 64 SMEs. During eBRIDGE, a group of selected companies belonging to the Cluster will be provided with four full electric cars: 3 Citröen C-Zero and 1 Peugeot iOn, equipped with a monitoring system. From June 3rd 2013 to September 4th 2014, 372 people from 20 companies have used an electric car for their business trips.
4. Valencia Palma - E:Sharing started in 2011 as the first electric car sharing in Spain. operated by MOVUS in the metropolitan area of Valencia. Presently, the E:Sharing fleet consists of 9 electric cars of different models and stations in Valencia, Sagunto, Paterna and Alcoy.
5. Milan - GuidaMi car sharing fleet are located in the city center. GuidaMi offered ten E-vehicles (four full electric and six hybrids) to be used in a car sharing system by the citizens. The full electric vehicles are Citroen C-Zero and the hybrids are Toyota Prius.
6. Lisbon - Municipal de Lisboa and Occam electric vehicles in municipal fleet. By 2011 the municipality had already 5 light passenger EVs for generic transport activities and by the end of 2013 reached a total of 57 electric vehicles.
7. Carmarthen - the first local authority in Wales to introduce electric vehicles into its fleet. The Carmarthenshire County Council mixed car pool joined the eBRIDGE project with a fleet of six diesel and two electric cars in the beginning of 2011 (and the option to order an additional four EVs).
The BASE fleet vehicles presented in table below are used only for business and corporate
trips during the day and returned to the pool at the end of working hours. The users are
employees driving for business purposes.
BASE electric fleets Goal
Galician Automotive Cluster
(CEAGA - Cluster de Empresas de Automoción de Galicia)
CEAGA Business e-car Sharing
(Vigo, Spain)
To test the suitability of EVs for business travel of the CEAGA companies
City of Lisbon Fleet
(CML - Câmara Municipal de Lisboa)
(Lisbon, Portugal)
To optimize the fleet configuration of a municipal carpool of conventional cars and EVs
To test the suitability of the new electric models and match them with concrete municipal tasks/ activities
Carmarthenshire County Council Fleet
(Carmarthen, UK)
To reduce economic (mileage costs) and environmental (CO2 emissions) impacts of staff travel

6
The SHARE fleet vehicles presented in table below can be booked for business and private
trips. The e-car sharing users are employees and individuals. Companies and organizations
can include e-car sharing in their business mobility portfolio and individuals can benefit from
mobility on demand and avoid car ownership inconveniences.
SHARE electric fleets Goal
e-Flinkster Carsharing
(Berlin, Germany)
To analyze potential of e-car sharing to complement business mobility
Caruso Carsharing
(Austria)
To address the lack of working concepts and business models for P2P e-CS fleets
E:Sharing
(Valencia, Spain)
Optimization of the E:Sharing model
Regional Government of the Balearic Islands (CAIB - Govern de les Illes Balears)
(Palma de Mallorca, Spain)
To create a proper policy framework for the promotion of electric mobility in the Balearic Islands
GuidaMi
(Milan, Italy)
To promote e-car sharing and EVs among the GuidaMi customers
4. Analysis on EV trips
4.1 Data description
Data related to the trips of the car-sharing fleets were provided from each project partner.
The data are classified into three categories: per trip (PT), per booking (PB) and aggregated
(A). The PT category includes information about each trip of each EV in the corresponding
car-sharing fleet. The PB category refers to the cases where the information was not
available in a per trip granularity, but was recorded in the start/end of each vehicle booking.
In such cases one booking may include more than one trip. Nevertheless, useful knowledge
about the usage patterns can be extracted. In some cases the provided data included only
aggregated information for the whole car-sharing fleet (A category).
The data included information about the travelled distance, the date, the start times and
duration, the average speed and the number of trips from each car-sharing EV fleet. Table 1
shows the EV trips data availability and granularity from each car-sharing EV fleet.

7
Table 1: EV trips Data
Pilot
Data
-per trip PT
-per booking PB
-aggregated A
Spain Italy Portugal UK Germany Austria
Vig
o
Va
lencia
Mila
n
Lis
bon
Ca
rma
rth
en
Be
rlin
Bre
ge
nz
Distance PT A A PT PB PB PT
Date PT - - PT PB PB PT
Average speed PT - - PT - - -
Start Time PT - - PT PB PB PT
Duration PT - - PT PB PB PT
Number of trip A A A A A A A
4.2 Analysis & Results
In order to analyze the usage patterns and travel behavior of the car-sharing EV fleets, eight
characteristics were studied.
1. Total number of Trips per Hour of Day
This characteristic studies the hourly distribution in a day of the start times of all trips per
fleet. By studying this characteristic, we extract information regarding the usage patterns of
the EVs in each car-sharing fleet. Looking at the customer’s perspective, this characteristic
helps in drawing conclusions regarding the purpose of using a car-sharing fleet: (i) fleets for
work trips only Vigo, Lisbon, Carmarthen and (ii) commercial car sharing fleets, i.e. for all trip
purposes: Berlin, Valencia, Austria, Milan. The necessary data for studying this characteristic
is the start hour of each trip.
The results are presented in Fig. 1-6:

8
Vigo – The fleet is used for private trips
Fig. 1 Carmarthen – The fleet is used by employers for work trips only
Fig. 2
Lisbon - The fleet is used for private trips
Fig. 3

9
Berlin - commercial car sharing fleets, i.e. for all trip purposes:
Fig. 4
Fig. 5
Bregenz - Peer-to-peer car sharing, all trip purposes
Fig. 6

10
As seen from above figures, the start time for the majority of the trips was during daytime. In
Vigo, Lisbon, Berlin and Bregenz the start trip time’s distribution is similar and have few trips
during night hours. However, in Carmarthen there were no trips during night hours. This is
because the Carmarthen fleet is used only for work related trips during the working hours.
2. Total number of Trips per Day of Week
This characteristic studies the daily distribution in a week of all trips per fleet. Information
regarding the daily usage patterns is extracted. By looking at the most preferable days on
which the car-sharing fleets are used, information regarding the type of customers/users of e-
CS commercial systems, but also users of the non-commercial fleets and their trip purpose is
obtained. For example if the car-sharing EV fleet is used only in the weekdays and not on the
weekends, there is an indication that the fleet may belong to a company and is only available
for work related matters. The necessary data for studying this characteristic is the date of
each trip.
The results are presented in Fig. 7-12:
Vigo
Fig. 7
Carmarthen
Fig. 8

11
Lisbon
Fig. 9
Berlin
Fig. 10
Fig. 11

12
Bregenz
Fig. 12
In most cases except in Carmarthen, the car-sharing fleet was used for traveling in both
weekdays and weekends. Fig. 10-12 shows that the most trips in Berlin and Bregenz
occurred on Saturday. In the other cases, the majority of the trips occurred during weekdays.
3. Total number of Trips per Month
This characteristic shows the monthly distribution of all trips per fleet. By looking at the
monthly change of EV usage, information regarding the popularity of each car-sharing EV
fleet is extracted.
An increasing number of trips over time indicate success of the car-sharing scheme whereas
a decreasing number of trips indicate the need of a change in the marketing policy for the
commercial fleets. Low booking numbers for the other fleets indicate the need of greater
employees’ engagement with EVs, applying promotional measures, etc.
Furthermore using the monthly development, regression analysis can be also applied to
calculate the trend and forecast the future usage of each car-sharing EV fleet. The necessary
data for studying this characteristic is the date of each trip. Aggregated data can also be
used.
The results are presented in Fig. 13-20:
Vigo
Fig. 13

13
Valencia
Fig. 14
Carmarthen
Fig. 15
Lisbon
Fig. 16

14
Berlin
Fig. 17
Fig. 18

15
Bregenz: The data collected for this trial are covering a period of more than 4 years. The eBRIDGE project started in April 2013 but we considered that it is valuable to present the whole set of data to highlight the positive trend in the number of trips.
Fig. 19
Milan
Fig. 20
Fig 17-20 showed an increasing trend of the Total number of Trips per Month in Carmarthen,
Berlin, Bregenz and Milan. In the other pilots, the Total number of Trips per Month was more
constant.
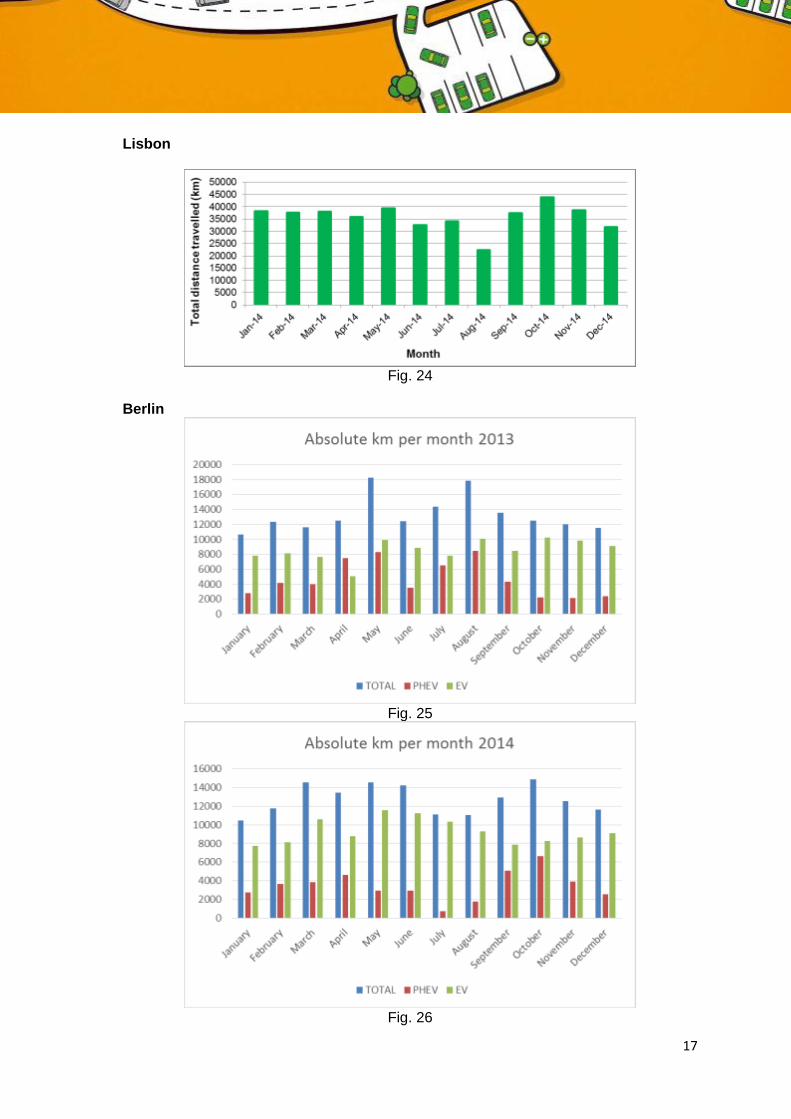
4. Total travelled Distance (km) per Month
This characteristic shows the monthly distribution of the aggregated travelled distance per
fleet. The monthly travelled distance is also associated with the EV usage, indicating the
energy requirements of the trips. Based on these energy requirements, the CO2 emissions
can also be calculated. Future projections are also possible, contributing to the scenario
modelling. The necessary data for studying this characteristic is the date and distance of
each trip. Aggregated data can also be used if available.
The results are presented in Fig. 21-28:

16
Vigo
Fig. 21
Valencia
Fig. 22
Carmarthen The data collected for his trail are covering a period of more than 4 years. The
eBRIDGE project started in April 2013 but we considered that is valuable to present the
whole set of data to highlight the total distance travelled. A fluctuation in the number of
available cars is quite typical for commercial car sharing fleet and private fleets.
Fig. 23
17
Lisbon
Fig. 24
Berlin
Fig. 25
Fig. 26

18
Bregenz
Fig. 27
Milan
Fig. 28
Slight increasing trend of the total travelled distance is shown for all car-sharing fleets.
Particularly in Bregenz, there is a significant increase in the total travelled distance. This
proves the success of the car-sharing EV fleet. In other cases, incentives or a different
marketing strategy could boost the popularity of the EV car-sharing fleet.
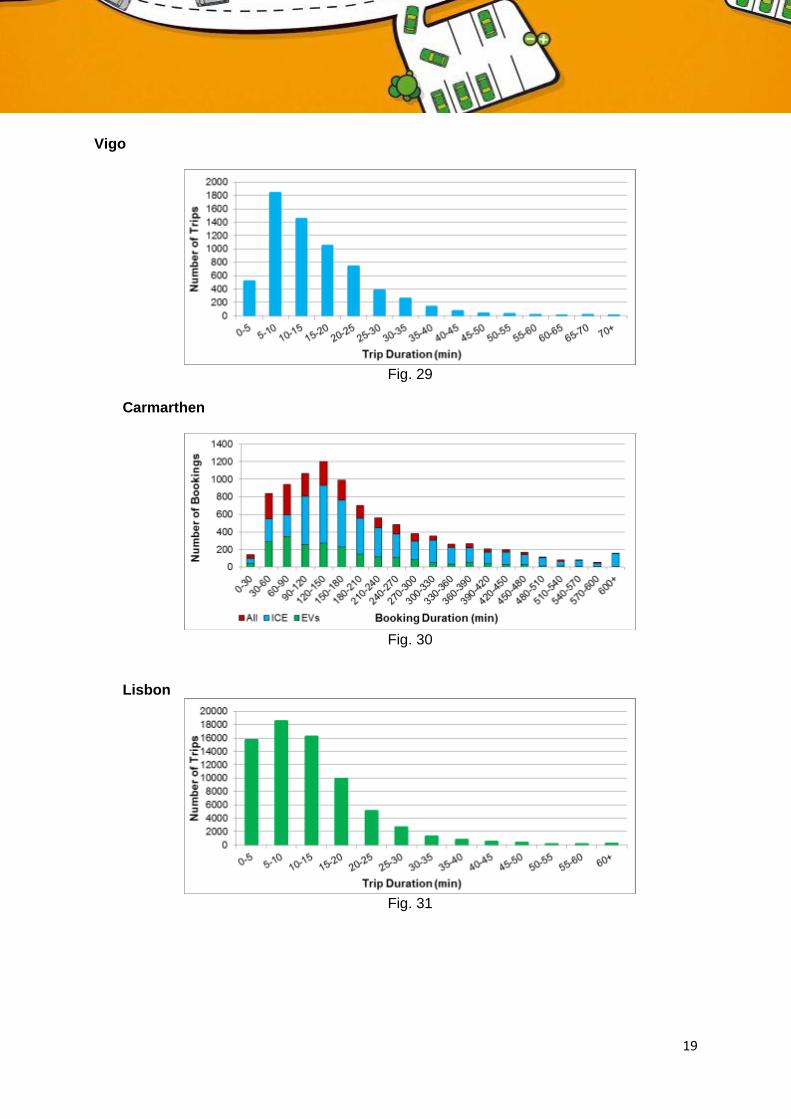
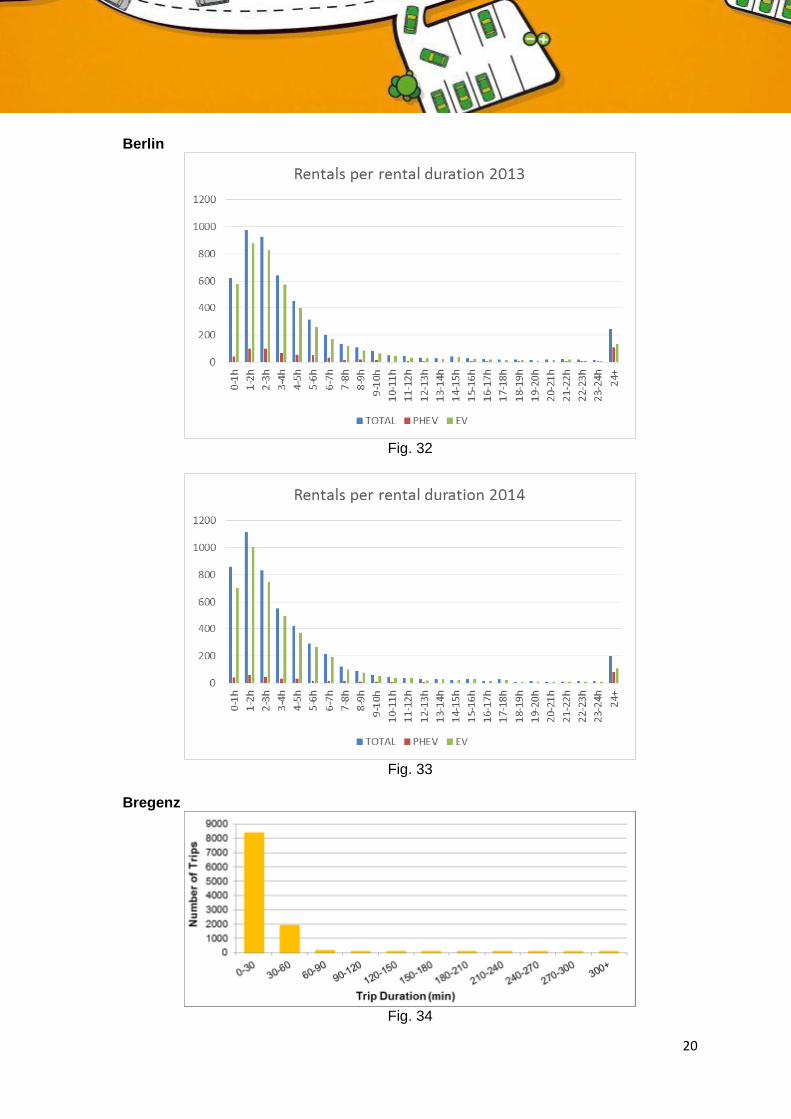
5. Total number of Trips per Trip Duration
This characteristic classifies the trips according to their duration. Different fixed duration
classes were used, adjusted to the characteristics of each individual fleet. In case the EVs
were used for very short trips, a duration period of 5min was used to illustrate the distribution
of the trips. On the other hand when the data were related to the vehicle bookings rather than
trips, a longer duration period was used to separate the classes (30min or 1h). The pricing
policy of the car-sharing company is affected by this characteristic and should optimize the
trade-off between revenues and customer satisfaction. The necessary data for studying this
characteristic is the duration of each trip.
The results are presented in Fig. 29-34:
19
Vigo
Fig. 29
Carmarthen
Fig. 30
Lisbon
Fig. 31
20
Berlin
Fig. 32
Fig. 33
Bregenz
Fig. 34

21
Fig. 30 and Figs. 32-33 presents Total number of Bookings per Booking Duration due to the
format of the provided data. This explains the longest durations shown on those figures. In
Vigo, Lisbon and Bregenz, where the data represented actual trip information, the majority of
the trips had duration of less than one hour.
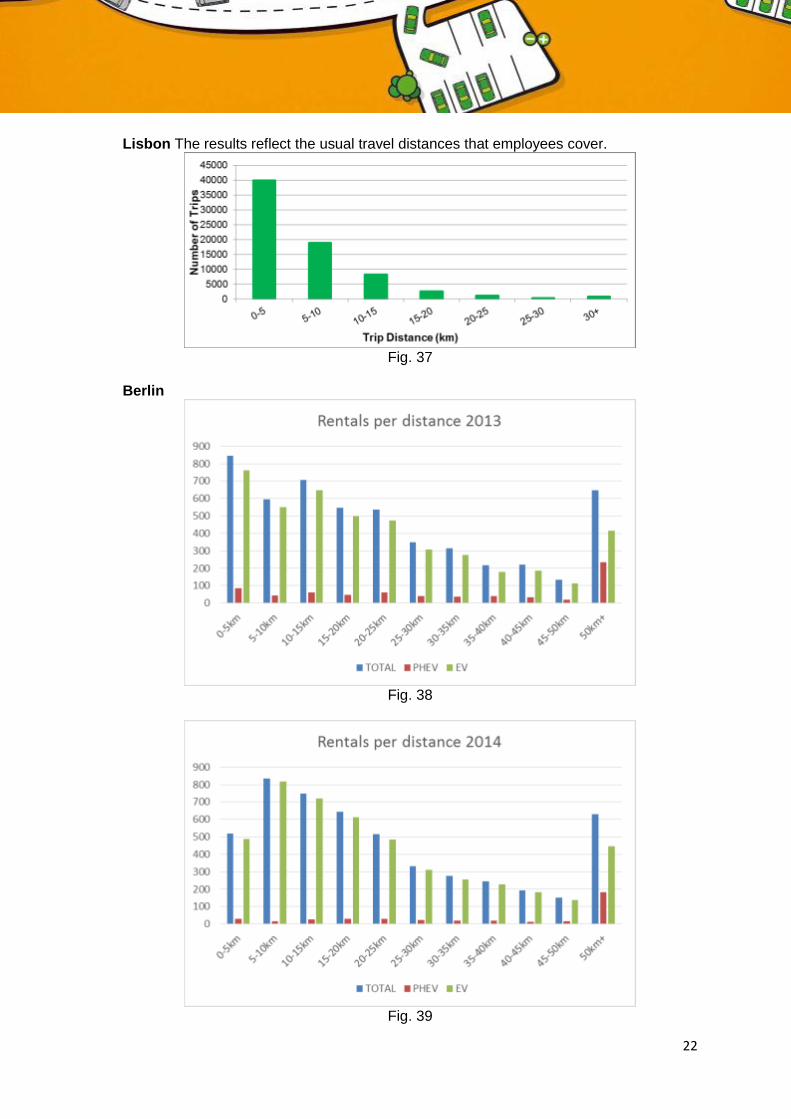
6. Total number of Trips per Trip Distance
This characteristic classifies the trips according to their distance. Fixed distance classes of
5km (5miles for UK) were used. Similarly to the previous characteristic, such information can
be used to study the driving behavior and the “range anxiety” of the EV drivers. This
information could be used by the car-sharing companies to improve the fleet composition, by
adjusting it to the customers’ driving needs. In case the trip distances of a car-sharing fleet
are relatively short, small battery EVs are suitable. On the other hand, in case the trip
distances are long, perhaps the extended driving range of plug-in hybrid vehicles could
satisfy the customer driving needs. The necessary data for studying this characteristic is the
duration of each trip.
The results are presented in Fig. 35-40:
Vigo The results reflect the usual travel distances that employees cover.
Fig. 35
Carmarthen
Fig. 36
22
Lisbon The results reflect the usual travel distances that employees cover.
Fig. 37
Berlin
Fig. 38
Fig. 39
23
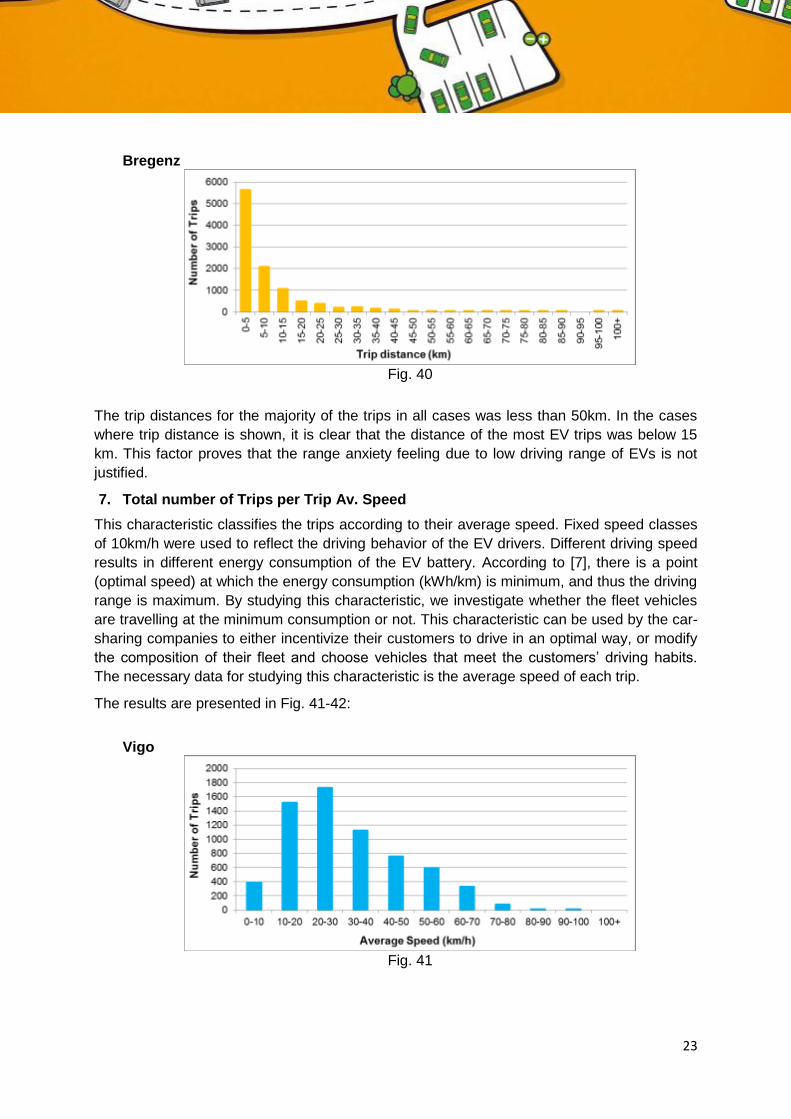
Bregenz
Fig. 40
The trip distances for the majority of the trips in all cases was less than 50km. In the cases
where trip distance is shown, it is clear that the distance of the most EV trips was below 15
km. This factor proves that the range anxiety feeling due to low driving range of EVs is not
justified.
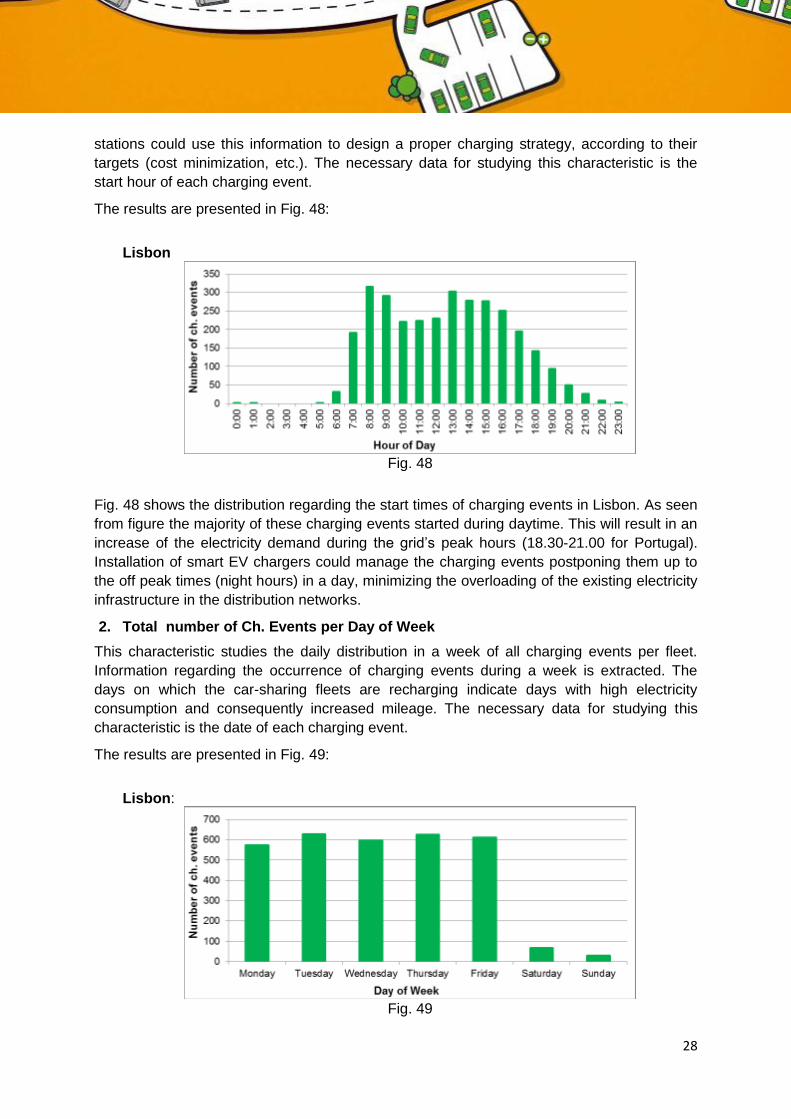
7. Total number of Trips per Trip Av. Speed
This characteristic classifies the trips according to their average speed. Fixed speed classes
of 10km/h were used to reflect the driving behavior of the EV drivers. Different driving speed
results in different energy consumption of the EV battery. According to [7], there is a point
(optimal speed) at which the energy consumption (kWh/km) is minimum, and thus the driving
range is maximum. By studying this characteristic, we investigate whether the fleet vehicles
are travelling at the minimum consumption or not. This characteristic can be used by the car-
sharing companies to either incentivize their customers to drive in an optimal way, or modify
the composition of their fleet and choose vehicles that meet the customers’ driving habits.
The necessary data for studying this characteristic is the average speed of each trip.
The results are presented in Fig. 41-42:
Vigo
Fig. 41

24
Lisbon
Fig. 42
Results related to average speed per trip were available only for Lisbon and Vigo. As seen
from the above figures, the average speed was relatively low in both cases. This
characteristic reflects the fact that EVs were used for driving inside the city.
8. EV usage Probability (weekly)
This characteristic shows the probability of having at least one vehicle of the car-sharing fleet
occupied during one week. By looking at this characteristic, a car-sharing company can
understand the usage patterns of its fleet and organize its operations accordingly
(maintenance, charging, cleaning etc). The usage probability is calculated using the
procedure presented in Fig. 43.
Fig. 43
Trip Data: Data regarding the date, the start time and the duration of each trip are used to
calculate the usage probability.
Trip Time series: An hourly time series is created for the whole period of the dataset,
containing the number of trips for every hour of the dataset, as presented in Fig. 44.

25
Fig. 44
Weekly Vector: A vector is created containing 168 values with the total number of trips on
each hour. Eq. 1 is used. N represents the total number of weeks in the dataset.
1
0
168N
n
inif , i = 1...168 Eq. 1
Usage Probability: The weekly vector is normalized so that all of its values sum to 1. The
total number of trips is calculated and every value of the vector is divided with it. The
remaining vector is the usage probability of the car-sharing fleet.
The results are presented in Fig. 45-47:
Vigo
Fig. 45

26
Carmarthen
Fig. 46
Bregenz
Fig. 47
The above figures show the hourly probability of an EV to be travelling during a week. In
Bregenz and Vigo the EV usage probability is periodically repeated every day including
weekend while in Carmarthen the EV usage probability is almost zero. This indicates the
minimum usage of EVs during weekends for the car-sharing EV fleet in Carmarthen.
4.3 Conclusions
The variation in the results depends by the type of the car sharing fleet: BASE fleet vehicles
or SHARE fleet vehicles as well as by the type and frequency of the data collected during
trials.

27
5. Analysis on EV electricity consumption
5.1 Data description
Limited data related to the electricity consumption of the car-sharing fleets were provided
from some project partners. The data are classified into two categories: per charging event
(PE) and aggregated (A). The PE category includes information about each charging event
of each EV in the corresponding car-sharing fleet. This requires a data recording capability
from the EV charging stations used by the car-sharing EV fleets. So far, this kind of data is
available only for the EV fleet in Lisbon. Aggregated data regarding the overall electricity
consumption was available for the fleets in Vigo (Spain) and Bregenz (Austria).
The data included information about the booking date, the start times and duration, the
energy consumption and the number of charging events from the car-sharing EV fleets.
Table 2 shows the EV electricity demand data availability and granularity from each car-
sharing EV fleet.
Table 2: EV electricity demand Data
Pilot
Data
-per charging event PE
-aggregated A
Spain Italy Portugal UK Germany Austria
Vig
o
Va
lencia
Mila
n
Lis
bon
Ca
rma
rth
en
Be
rlin
Bre
ge
nz
Start Time - - - PE - - -
Date - - - PE - - -
Energy Consumption A - - PE - - A
Duration - - - PE - - -
Number of charging event - - - A - - -
5.2 Analysis & Results
In order to analyze the charging patterns and electricity consumption of the car-sharing EV
fleets, the following eight characteristics were studied.
1. Total number of Ch. Events per Hour of Day
This characteristic studies the hourly distribution in a day of the start times of all charging
events of the EVs in each fleet. Information is extracted regarding the charging patterns of
the EVs in each car-sharing fleet. This characteristic identifies the hours at which the
charging demand is high (peak hours). Third party companies that manage the EV charging
28
stations could use this information to design a proper charging strategy, according to their
targets (cost minimization, etc.). The necessary data for studying this characteristic is the
start hour of each charging event.
The results are presented in Fig. 48:
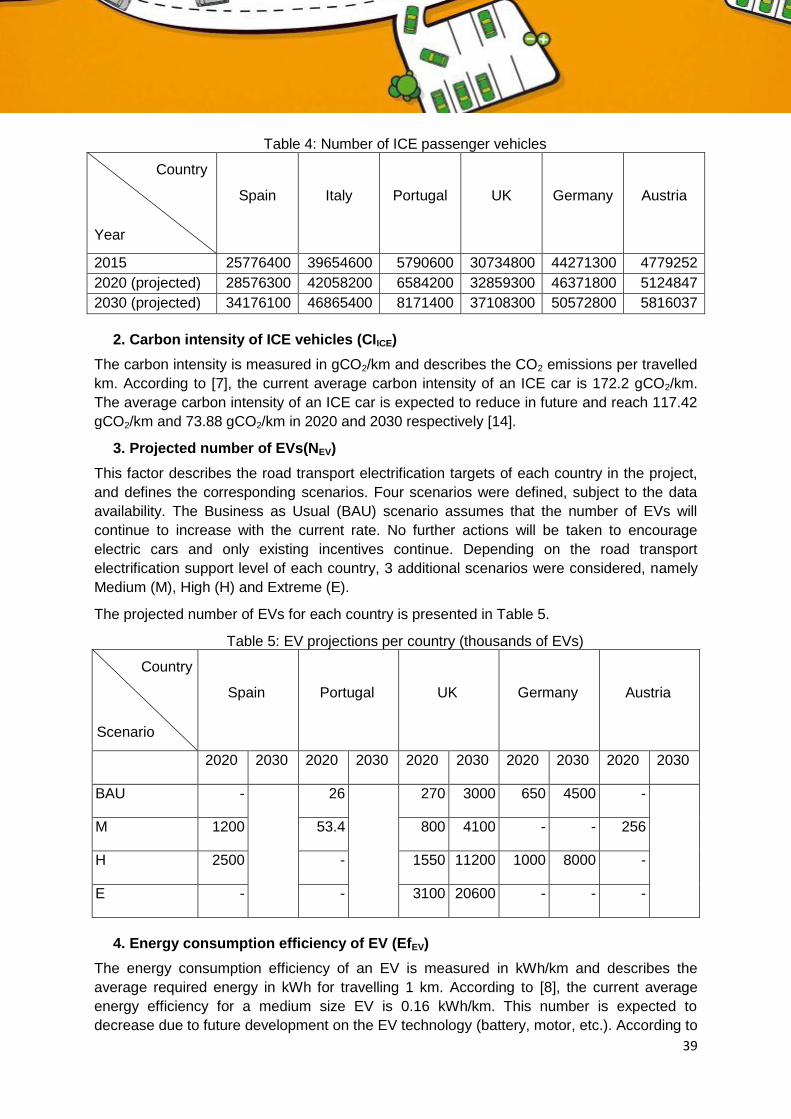
Lisbon
Fig. 48
Fig. 48 shows the distribution regarding the start times of charging events in Lisbon. As seen
from figure the majority of these charging events started during daytime. This will result in an
increase of the electricity demand during the grid’s peak hours (18.30-21.00 for Portugal).
Installation of smart EV chargers could manage the charging events postponing them up to
the off peak times (night hours) in a day, minimizing the overloading of the existing electricity
infrastructure in the distribution networks.
2. Total number of Ch. Events per Day of Week
This characteristic studies the daily distribution in a week of all charging events per fleet.
Information regarding the occurrence of charging events during a week is extracted. The
days on which the car-sharing fleets are recharging indicate days with high electricity
consumption and consequently increased mileage. The necessary data for studying this
characteristic is the date of each charging event.
The results are presented in Fig. 49:
Lisbon:
Fig. 49

29
The majority of the charging events occurred following a uniform distribution during
weekdays.
3. Total number of Ch. Events per Month
This characteristic shows the monthly distribution of all charging events per fleet. By looking
at the change of the number of charging events over time, information regarding the
utilization trend of the fleet’s charging stations is extracted. An increasing number of charging
events over time indicates the success of the car-sharing scheme and its popularity among
the customers. The necessary data for studying this characteristic is the date of each
charging event.
The results are presented in Fig. 50:
Lisbon
Fig. 50
Fig. 50 shows the Total number of Ch. Events per Month in the car-sharing fleet in Lisbon.
As seen from Fig, an increasing trend is shown, indicating the increasing energy
requirements of the EV fleet.
4. Total consumed Energy (kWh) per Month
This characteristic shows the monthly distribution of the aggregated electricity that was
consumed for charging each car-sharing EV fleet. The monthly energy requirements are
highly correlated with the total mileage of each car-sharing EV fleet, indicating the
aggregated travelled distance in a month. Based on these energy requirements, the CO2
emissions can also be calculated. Future projections are also possible using regression
analysis, contributing to the scenario modelling. The necessary data for studying this
characteristic is the date and energy of each charging event. However, due to unavailability
of data from all the car-sharing fleets, in some cases the Total travelled distance per month
was used to calculate the total consumed energy per month. A typical energy consumption of
0.16kWh/km was applied to calculate this characteristic [8].
The results are presented in Fig. 51-58:

30
Vigo
Fig. 51
Valencia
Fig. 52
Carmarthen
Fig. 53

31
Lisbon
Fig. 54
Berlin
Fig. 55
Fig. 56

32
Bregenz
Fig. 57
Milan
Fig. 58
The above figures show the Total consumed Energy (kWh) per Month for all car-sharing EV
fleets. The above figures are highly associated with the total travelled distance per month for
all corresponding car-sharing EV fleets.
5. Total number of Ch. Events per Ch. Event Duration
This characteristic classifies the charging events according to their duration. Fixed duration
classes were defined using a 30min interval. The duration of the charging events indicates
the utilization of the charging station as well as the trip’s length. Short charging events
indicate that the EVs of the car-sharing fleet are being used for relatively short distances.
Such information can also be used to study the “range anxiety” of the EV drivers due to its
correlation with the charging frequency. The necessary data for studying this characteristic is
the duration of each charging event.
The results are presented in Fig. 59:

33
Lisbon
Fig. 59
Fig. 59 shows the distribution of the charging duration of all charging events occurred in the
car sharing EV Fleet in Lisbon. The majority of the charging events lasted between 30 and
90 minutes. This indicates that EVs were frequently charged so that their batteries didn’t
reach low battery state of charge (SOC) levels. Specifically for Lisbon pilot it was found that
the drivers used to charge the batteries at the beginning of the trip without consideration of
the battery SOC. This behavior was improved in time as they were coming familiar with the
battery range in real conditions.
6. Total number of Ch. Events per Ch. Event Energy
This characteristic classifies the charging events according to their energy. Fixed distance
classes of 1kWh were used. Similarly to the previous characteristic, such information can be
used to study the utilization of each charging station. Conclusions can be also drawn
regarding the necessary technical characteristics of the charging stations in a car-sharing
company. In case the energy requirements are low, a slow charger could be sufficient to
deliver the necessary energy. On the other hand, if the energy requirements are high, a fast
charger with high power rate is needed. In this case the investment cost is increased
affecting the pricing policy of the car-sharing company. This information could be used by the
car-sharing companies to improve the charging infrastructure, and install the suitable
charging equipment. The necessary data for studying this characteristic is the energy of each
charging event.
The results are presented in Fig. 60:

34
Lisbon
Fig. 60
7. Av. Energy Consumption vs Av. Speed
This characteristic presents the correlation between the average speed (km/h) and the
energy consumption (kWh/km) for all trips of a car-sharing fleet. As mentioned before,
different driving speed results in different energy consumption of the EV battery. This is
illustrated with this characteristic by presenting the different energy consumption rate
(kWh.km) for every driving speed. This characteristic can be used by the car-sharing
companies to understand the performance of the EVs in their fleet and their customers’
driving habits. The necessary data for studying this characteristic is the average speed and
consumed energy of each trip.
The results are presented in Fig. 61-62:

35
Vigo
Fig. 61
Fig. 62
Fig. 61 shows a scatter plot between average speed and average consumption considering
the provided trip data of Lisbon. Fig. 62 shows a histogram about the average battery
consumption per trip. The above information could help car sharing company take decisions
about the composition of the EV fleet and the pricing policy as well.
8. EV Ch. Station Occupancy Probability (weekly)
This characteristic shows the probability of having at least one charging station of the car-
sharing fleet occupied during one week. By looking at this characteristic, a car-sharing
company can understand the recharging patterns of its fleet. If incentivized, the car-sharing
company could offer ancillary services to the electricity distribution network operators from its
charging stations [9, 10, 11, 12]. The occupancy probability is calculated using the procedure
presented in Fig. 63.

36
Fig. 63
Charging Event Data: Data regarding the date, the start time and the duration of each
charging event is used to calculate the occupancy probability.
Charging Demand Time series: An hourly time series is created for the whole period of the
dataset, containing the number of charging stations occupied on every hour of the dataset as
presented in Fig. 64.
Fig. 64
Weekly Vector: A vector is created containing 168 values with the total number of occupied
stations on each hour, using Eq. 1.
Occupancy Probability: The weekly vector is normalized so that all of its values sum to 1.
The total number of charging events is calculated and every value of the vector is divided
with it. The remaining vector is the occupancy probability of the charging stations of the car-
sharing company.
The results are presented in Fig. 65:

37
Lisbon
Fig. 65
The above figure shows the hourly probability of a charging station to be occupied (due to charging) during a week for the car sharing EV fleet in Lisbon. The occupancy probability of the charging stations reflects the fact that the majority of the charging events occur during weekdays.
5.3 Conclusions
A diversity effect is observed for the charging demand between pilots due to the type of car
sharing fleets. Trial data analysis has shown that the shape of the EV charging demand
depend on several factors, such as the number of vehicles involved, user type and day of the
week. The energy used per charging event is dependent on a number of factors: battery
capacity, the length of the charge, the type of charging and not least the driver behavior.
It is an expectation that the customer behavior will improve in time as they were coming
familiar with the battery range in real conditions with a beneficial effect in the reduction of
barriers to wide-spread of EVs adoption. Understanding the charging profile of vehicle drivers
and the impact of charging to local grid reliability is a key concern for utility providers.
Additionally, evaluating charging characteristics and behaviors can provide valuable insight
into the optimal charging levels required for home, workplace and public charging.

38
6. Analysis on CO2 emissions
6.1 Data description
Data related to the carbon emissions of each country were provided from the project
partners. The data are classified in two categories: Transport Statistics (TS) and Energy Mix
(EM). The TS category includes information about the road transport fleet composition and
the average daily travelled distance. The EM category includes information regarding the
energy generation mix. Table 3 shows the provided data from each project partner.
Table 3: Data related to carbon emission calculations
Pilot
Data
Spain Italy Portugal UK Germany Austria
Transport Statistics (TS)
Number of ICE vehicles
Number of private-hire vehicles
Number of EVs
Average Daily Travelled Distance
Energy Mix (EM)
Energy Generation Mix
6.2 Data analysis methodology
In order to analyze the CO2 emissions and produce future scenarios, the following factors
were considered:
1. Projected number of ICE vehicles (NICE)
Historical data were used to create future projections for 2020 and 2030. A time series was
created, presenting the total number of ICE cars for a country over time. Linear regression
analysis was applied on the time series, in order to calculate the mathematical formula
describing the relationship between the number of ICE cars (Y) and time (X in years). The
formula is described with Eq. 2:
XY 10 Eq. 2
, where β0 and β1 are the constant regression coefficients and ε is the random disturbance
(error). The slope β1 expresses the annual change of the number of ICE cars (in cars/year).
Using the Least Squares Method described in [13],the constant regression coefficients were
calculated. The number of ICE passenger vehicles for each country is presented in Table 4.
39
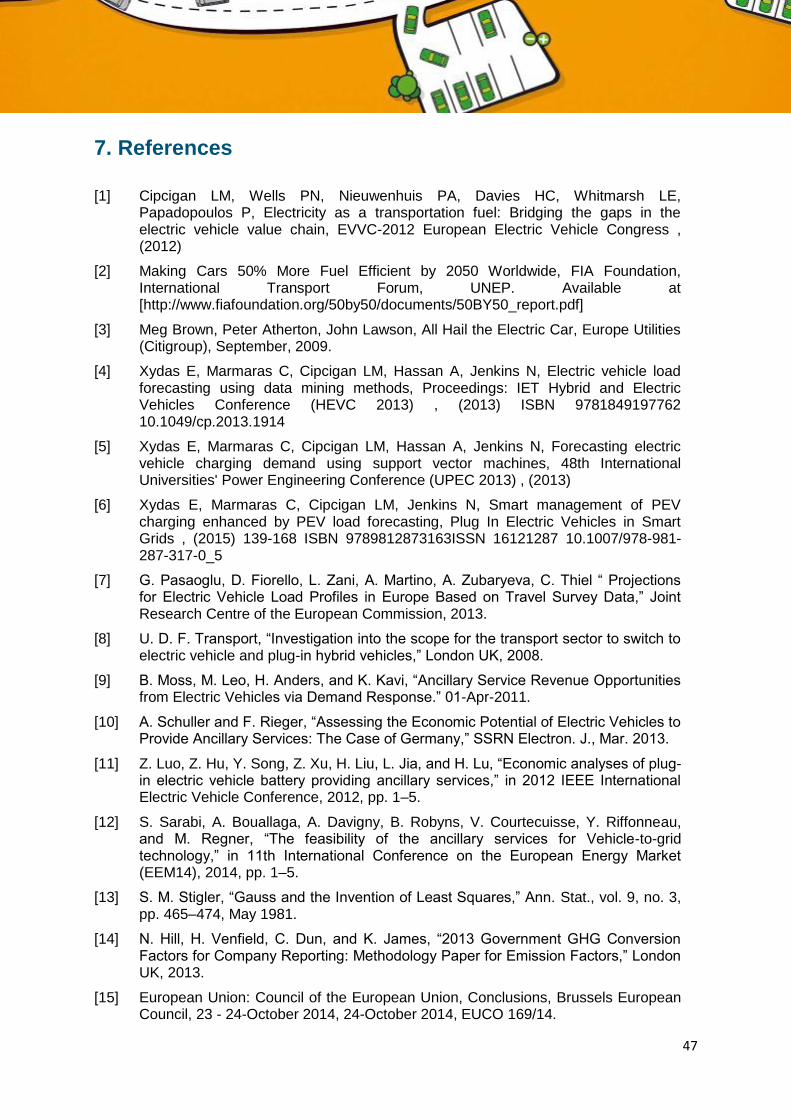
Table 4: Number of ICE passenger vehicles
Country
Year
Spain Italy Portugal UK Germany Austria
2015 25776400 39654600 5790600 30734800 44271300 4779252
2020 (projected) 28576300 42058200 6584200 32859300 46371800 5124847
2030 (projected) 34176100 46865400 8171400 37108300 50572800 5816037
2. Carbon intensity of ICE vehicles (CIICE)
The carbon intensity is measured in gCO2/km and describes the CO2 emissions per travelled
km. According to [7], the current average carbon intensity of an ICE car is 172.2 gCO2/km.
The average carbon intensity of an ICE car is expected to reduce in future and reach 117.42
gCO2/km and 73.88 gCO2/km in 2020 and 2030 respectively [14].
3. Projected number of EVs(NEV)
This factor describes the road transport electrification targets of each country in the project,
and defines the corresponding scenarios. Four scenarios were defined, subject to the data
availability. The Business as Usual (BAU) scenario assumes that the number of EVs will
continue to increase with the current rate. No further actions will be taken to encourage
electric cars and only existing incentives continue. Depending on the road transport
electrification support level of each country, 3 additional scenarios were considered, namely
Medium (M), High (H) and Extreme (E).
The projected number of EVs for each country is presented in Table 5.
Table 5: EV projections per country (thousands of EVs)
Country
Scenario
Spain Portugal UK Germany Austria
2020 2030 2020 2030 2020 2030 2020 2030 2020 2030
BAU -
26
270 3000 650 4500 -
M 1200 53.4 800 4100 - - 256
H 2500 - 1550 11200 1000 8000 -
E - - 3100 20600 - - -
4. Energy consumption efficiency of EV (EfEV)
The energy consumption efficiency of an EV is measured in kWh/km and describes the
average required energy in kWh for travelling 1 km. According to [8], the current average
energy efficiency for a medium size EV is 0.16 kWh/km. This number is expected to
decrease due to future development on the EV technology (battery, motor, etc.). According to

40
the same source, the energy efficiency of an EV in 2020 and 2030 will be 0.13 kWh/km and
0.11 kWh/km respectively.
5. Carbon intensity of electricity generation (CIgrid)
The carbon intensity of electricity generation represents the CO2 emissions related to the
electricity generation of each country. According to the EU directives [15], targets of 20% and
40% CO2 emissions reduction compared to the 1990 levels are set for 2020 and 2030
respectively. The total CO2 emissions for each country are presented in Table 6.
Table 6: CO2 emissions (in Mt)
Country
Year
Spain Italy Portugal UK Germany Austria
1990 77.66 137.21 16.33 237.74 426.95 13.84
2015 111.65 152.25 20.49 191.57 353.85 14.56
2020 (target) 62.12 109.77 13.06 190.19 341.56 11.07
2030 (target) 46.59 82.33 9.80 142.64 256.17 8.31
This factor is affected by the energy mix of each country, and its developments on electricity
generation (future penetration of renewable energy sources, decarbonisation of grid etc.).
Linear regression was applied on historical data, and the electricity generation was projected
to 2020 and 2030. In order to calculate the carbon intensity of the electricity generation of
each country, the CO2 emissions targets were divided with the projected electricity
generation of the corresponding year. The current and projected carbon intensity of the
electricity grid of each country is presented in Table 7.
Table 7: Carbon intensity of electricity grid (in gCO2/kWh)
Country
Year
Spain Italy Portugal UK Germany Austria
2015 328.01 467.24 368.26 485.71 569.71 203.12
2020 (projected) 162.61 314.25 213.43 462.47 526.93 145.12
2030 (projected) 100.12 207.78 135.52 320.61 364.71 97.08
6. Annual travelled distance of ICE vehicles and EVs (DICE , DEV)
The average daily travelled distance as well as the total number of cars is used to calculate
the annual travelled distance from ICE vehicles and EVs. The projected travelled distance of
ICE passenger vehicles for each country is presented in Table 8 for each scenario.

41
Table 8: Travelled distance projections from ICE vehicles per country (billions of km)
Country
Scenario
Spain Portugal UK Germany Austria
2020 2030 2020 2030 2020 2030 2020 2030 2020 2030
No EVs 388.8
-
89.6
-
447.1 504.9 631.0 688.2 69.7
-
BAU - 89.2 443.4 464.1 622.1 626.9 -
M 372.5 88.9 436.2 449.2 - - 66.2
H 354.8 - 426.0 352.5 617.4 579.3 -
E - - 404.9 224.6 - - -
The projected travelled distance from EVs for each country is presented in Table 9 for each
scenario.
Table 9: Travelled distance projections from EVs per country (billions of km)
Country
Scenario
Spain Portugal UK Germany Austria
2020 2030 2020 2030 2020 2030 2020 2030 2020 2030
BAU -
-
0.4
-
3.7 40.8 8.8 61.2 -
- M 16.3 0.7 10.9 55.8 - - 3.5
H 34.0 - 21.1 152.4 13.6 108.9 -
E - - 42.2 280.3 - - -
The procedure to calculate the carbon emissions (CE) is described in Fig. 66

42
Fig. 66
Using Tables 4-9 and the methodology described in Fig. 66, the results for each country are
presented in Fig. 67-76.
Spain
Fig. 67
Fig. 68

43
Portugal
Fig. 69
Fig. 70
UK
Fig. 71

44
Fig. 72
Germany
Fig. 73
Fig. 74

45
Austria
Fig. 75
Fig. 76
The above results refer to the electrification of the total passenger car fleet of each country.
Considering only the rental cars in the electrification scenarios, the CO2 reduction figures are
much lower. The projected CO2 emission reduction due to the electrification of the total
rental/car-sharing fleet per country is presented in Table 10 for each scenario.

46
Table 10: Projected CO2 emission reduction due to the electrification of the rental fleet (tn)
Country
Scenario
Portugal UK Germany Austria
2020 2030 2020 2030 2020 2030 2020 2030
BAU 494.9
-
1052.6 7881.3 2163.3 10336.5 -
-
M 1016.5 3118.7 10771.1 - - 1079.0
H - 6042.6 29423.5 3328.2 18376.1 -
E - 12085.1 54118.3 - - -
6.3 Conclusions
In order to analyze the CO2 emissions reduction arising from electric vehicle fleet in different
countries it was important to consider the predicted EVs uptake for year 2020 and 2030. This
study considered four scenarios for Electric Vehicles uptake: Business as Usual, Medium,
High and Extreme, and the choice of these scenarios was based on the data availability in
each country.
One of the key factors in determination of the environmental benefit from EVs was found to
be the energy mix used for charging the battery.
47
7. References
[1] Cipcigan LM, Wells PN, Nieuwenhuis PA, Davies HC, Whitmarsh LE, Papadopoulos P, Electricity as a transportation fuel: Bridging the gaps in the electric vehicle value chain, EVVC-2012 European Electric Vehicle Congress , (2012)
[2] Making Cars 50% More Fuel Efficient by 2050 Worldwide, FIA Foundation, International Transport Forum, UNEP. Available at [http://www.fiafoundation.org/50by50/documents/50BY50_report.pdf]
[3] Meg Brown, Peter Atherton, John Lawson, All Hail the Electric Car, Europe Utilities (Citigroup), September, 2009.
[4] Xydas E, Marmaras C, Cipcigan LM, Hassan A, Jenkins N, Electric vehicle load forecasting using data mining methods, Proceedings: IET Hybrid and Electric Vehicles Conference (HEVC 2013) , (2013) ISBN 9781849197762 10.1049/cp.2013.1914
[5] Xydas E, Marmaras C, Cipcigan LM, Hassan A, Jenkins N, Forecasting electric vehicle charging demand using support vector machines, 48th International Universities' Power Engineering Conference (UPEC 2013) , (2013)
[6] Xydas E, Marmaras C, Cipcigan LM, Jenkins N, Smart management of PEV charging enhanced by PEV load forecasting, Plug In Electric Vehicles in Smart Grids , (2015) 139-168 ISBN 9789812873163ISSN 16121287 10.1007/978-981-287-317-0_5
[7] G. Pasaoglu, D. Fiorello, L. Zani, A. Martino, A. Zubaryeva, C. Thiel “ Projections for Electric Vehicle Load Profiles in Europe Based on Travel Survey Data,” Joint Research Centre of the European Commission, 2013.
[8] U. D. F. Transport, “Investigation into the scope for the transport sector to switch to electric vehicle and plug-in hybrid vehicles,” London UK, 2008.
[9] B. Moss, M. Leo, H. Anders, and K. Kavi, “Ancillary Service Revenue Opportunities from Electric Vehicles via Demand Response.” 01-Apr-2011.
[10] A. Schuller and F. Rieger, “Assessing the Economic Potential of Electric Vehicles to Provide Ancillary Services: The Case of Germany,” SSRN Electron. J., Mar. 2013.
[11] Z. Luo, Z. Hu, Y. Song, Z. Xu, H. Liu, L. Jia, and H. Lu, “Economic analyses of plug-in electric vehicle battery providing ancillary services,” in 2012 IEEE International Electric Vehicle Conference, 2012, pp. 1–5.
[12] S. Sarabi, A. Bouallaga, A. Davigny, B. Robyns, V. Courtecuisse, Y. Riffonneau, and M. Regner, “The feasibility of the ancillary services for Vehicle-to-grid technology,” in 11th International Conference on the European Energy Market (EEM14), 2014, pp. 1–5.
[13] S. M. Stigler, “Gauss and the Invention of Least Squares,” Ann. Stat., vol. 9, no. 3, pp. 465–474, May 1981.
[14] N. Hill, H. Venfield, C. Dun, and K. James, “2013 Government GHG Conversion Factors for Company Reporting: Methodology Paper for Emission Factors,” London UK, 2013.
[15] European Union: Council of the European Union, Conclusions, Brussels European Council, 23 - 24-October 2014, 24-October 2014, EUCO 169/14.

48
The Project
eBRIDGE is a co-funded EU project to promote electric fleets for
urban travel in European cities. The project aims to bring innovation
and new technologies to make today’s mobility cleaner, more efficient
and sustainable.
The project explores alternatives to the current mobility patterns and
evaluate whether electric mobility is a feasible option to make cities
cleaner and more sustainable.
The seven pilots, Berlin (Germany), Milan (Italy), Lisbon (Portugal), Vigo (Spain), Valencia
(Spain), a selection of Austrian municipalities and Carmarthen (Wales) are developing
actions to optimise operational fleet performance, test and launch solutions to increase the
convenience and ease of use of car sharing offers and finally, raise awareness among the
target groups through engaging marketing approaches on the suitability of electric mobility
for urban transport and commuting.
The eBRIDGE team involves technical experts, academics, associations, public
administrations, mobility providers and public transport and car sharing operators.
