d5.1: initial experiment description and results · wickboldt (ufrgs), ariel dalla-costa (ufrgs),...
TRANSCRIPT
D5.1: Initial experiment description and results
Work package WP 5 Task T5.1, T5.2 and T5.3
Due date 28/02/2018 Submission date 28/02/2018
Editor IT
Version 1.0
Authors Paulo Marques (IT), Pekka Aho (VTT), Johann M. Marquez-Barja (IMEC), Yi Zhang (TCD), Pedro Alvarez (TCD), Frank Slyne (TCD), Diarmuid Collins(TCD), Christian Bluemm (TCD), Marco Ruffini (TCD), Luiz DaSilva (TCD), Valerio Frascolla (INTEL), Magnus Martinello (UNIVBRIS), Carlos Meixner (UNIVBRIS), Daniel F. Macedo (UFMG), Vinicius Fonseca (UFMG), Júlio Guimarães (UFMG), Matheus Nunes (UFMG), João Zenóbio (UFMG), Carlos Silva (UFC), Emanuel Dário (UFC), Raphael Braga (UFC), Alexandre Albano (UFC), João Pinheiro (UFC), Rodrigo Cavalcanti (UFC), André Almeida (UFC), Edmundo Madeira (UNICAMP), Leandro Villas (UNICAMP), Luiz Bittencourt (UNICAMP), Nelson Fonseca (UNICAMP), Carlos Astudillo (UNICAMP), Eduardo Gama (UNICAMP), Tiago Andrade (UNICAMP), Henrique Resende (UFRGS), Juliano Wickboldt (UFRGS), Ariel Dalla-Costa (UFRGS), Rafael Martins (UFRGS), Matias Schimuneck (UFRGS), Gabriel Lando (UFRGS), Ana Trevisan (UFRGS), Moisés Ribeiro (UFES), Ricardo Mello (UFES), Rodolfo Villaça (UFES), Magnos Martinello (UFES), Alexandre Carmo (UFES), Felippe Mendonça (UFES), Diego Cardoso (UFES), Isabela Ceravolo (UFES), Cristina Dominicini (UFES), Rodolfo Picoreti (UFES), Rafael Guimarães (UFES), Pedro Hasse (UFES), Víctor García (UFES)
Reviewers Juliano Araujo Wickboldt
Luiz DaSilva
Abstract This deliverable presents the first batch of innovation experiments of the project
Keywords Experiments, showcases, wireless/optical convergence
This project has received funding from the European Union's
Horizon 2020 for research, technological development, and
demonstration under grant agreement no. 688941 (FUTEBOL),
as well from the Digital Information and Communication
Research and Development Science Center (CTIC), Brazil.
FUTEBOL – H2020 688941
D5.1: Initial experiment description and results
© FUTEBOL Consortium 2016-2019 Page 2 of 60
Document Revision History
Version Date Description of change List of contributor(s)
v.0.1 18/09/2017 First ToC IT
v0.20 28/12/2017 Review by Juliano Wickboldt UFRGS
v0.3 17/01/2018 Clean draft IT
v0.4 13/02/2018 Review by Luiz DaSilva TCD
v1.0 26/02/2018 Review by Juliano Wickboldt UFRGS
Project co-funded by the European Commission in the H2020 Programme
Nature of the deliverable: to specify R, P, D, O*
Dissemination Level
PU Public ✓
PP Restricted to other programme participants (including the Commission Services)
RE Restricted to bodies determined by the FUTEBOL project
CO Confidential to FUTEBOL project and Commission Services
Copyright notice
© 2016 - 2018 FUTEBOL Consortium
This report is based in parts on
*R: report, P: prototype, D: demonstrator, O: other
FUTEBOL – H2020 688941
D5.1: Initial experiment description and results
© FUTEBOL Consortium 2016-2019 Page 3 of 60
EXECUTIVE SUMMARY
This Deliverable reports the first results of five FUTEBOL’s experiments. These initial results address a range of issues that span wireless and optical networks. Those issues include: spectrum sharing in the 3.5 GHz band, network management and real-time robots control using the SDN approach, and monitoring/processing data from IoT devices. The experiments’ results reported in this deliverable display a wide range of capabilities available in FUTEBOL research facilities for use of partners and third-party experimenters in converged wireless/optical networks. These experiments will continue towards the end of the project and the final results will be presented in D5.2.
FUTEBOL – H2020 688941
D5.1: Initial experiment description and results
© FUTEBOL Consortium 2016-2019 Page 4 of 60
TABLE OF CONTENTS
1 Introduction 8
2 Experiment 1 – LSA/SAS for extended lte capacity with E2E QoE 9
2.1 Objectives of experiment 1 9
2.2 Showcase set up 10
2.3 Initial results 14
2.4 Control framework application 17
2.5 Next steps 18
3 Experiment 2.1 – Heterogeneous wireless-optical network management with SDN and virtualization 19
3.1 Objectives of experiment 2.1 19
3.2 Showcase set up 20
3.3 Control framework application 26
3.4 Initial results 27
3.5 Next steps 31
4 Experiment 2.2 – Real-time remote control of robots over a wireless-optical SDN-enabled Infrastructure 35
4.1 Objectives of experiment 2.2 35
4.2 Showcase set up 36
4.3 Control framework application 40
4.4 Initial results 40
4.5 Next steps 41
5 Experiment 3.1 – Adaptive cloud/fog for IoT according to network capacity and service latency requirements 43
5.1 Objectives of experiment 3.1 43
5.2 Showcase set up 43
5.3 Control framework application 46
5.4 Initial results 47
5.5 Next steps 50
6 Experiment 3.2 – Radio-over-fiber for IoT environment monitoring 52
6.2 Showcase set up 53
6.3 Control framework application 53
6.4 Initial results 54
6.5 Next steps 56
7 Conclusions 59
8 References 60
FUTEBOL – H2020 688941
D5.1: Initial experiment description and results
© FUTEBOL Consortium 2016-2019 Page 5 of 60
ABBREVIATIONS
AP Access Point
ADC Analog-Digital Conversion
ANATEL Agência Nacional de Telecomunicações
API Application Program Interface
BBU Base Band Unit
CBTM Cloud Based Testbed Manager
CBRS Citizens Broadband Radio Service
CBSD CBRS devices
CC Cloud Computing
CTIC Communication Research and Development Science Centre
D-RoF Digitized Radio Over Fibre
D2D Device-To-Device
DAC Digital-Analog Conversion
DASH Dynamic Adaptive Streaming Over Http
DCC Departamento De Ciências da Computação
DL Downlink
DP Domain Proxy
DX.X Deliverable X.X
E-commerce Electronic Commerce
E2E End-To-End
EIRP Equivalent Isotropically Radiated Power
ESC Environment Sensing Capability
eNB Evolved Node Base
eNodeB Evolved Node Base
ETSI European Telecommunications Standards Institute
EX.X Experiment X.X
Fed4FIRE Federation for Future Internet Research and Experimentation
FIBRE Future Internet Brazilian Environment for Experimentation
FUTEBOL Federated Union of Telecommunications Research Facilities for An Eu-Brazil Open Laboratory
GAA General Authorized Access
GPS Global Positioning System
H2M Human-To-Machine
IoT Internet of Things
IQ In-phase/Quadrature
FUTEBOL – H2020 688941
D5.1: Initial experiment description and results
© FUTEBOL Consortium 2016-2019 Page 6 of 60
IT Instituto de Telecomunicações (FUTEBOL partner)
ITU International Telecommunication Union
KPI Key Performance Indicator
LSA Licensed Shared Access
LTE Long Term Evolution
M2M Machine-To-Machine
MAC Medium Access Control Layer
MbDSAS Management by Delegation Smart Object Aware System
MDC Micro Data Centre
MX Metric X
NFV Network Function Virtualization
OCF Ofelia Control Framework
OMF Orbit Management Framework
PA Priority Access
PER Package Error Rate
PHY Physical Layer
PMSE Programme Making and Special Events
PON Passive Optical Network
QoE Quality of Experience
QoS Quality of Service
RAN Radio Access Network
REM Radio Environment Map
RF Radio Frequency
RoF Radio over Fibre
RRH Remote Radio Head
RRS Reconfigurable Radio Systems
Rspec Request SpecificationSAS Spectrum Access System
SFA Slice-based Federation Architecture
SDR Software Defined Radio
SoA State-of-the-art
TCD Trinity College Dublin (FUTEBOL partner)
TX Test X
UE User Equipment
UFC Universidade Federal do Ceará (FUTEBOL partner)
UFES Universidade Federal do Espirito Santo (FUTEBOL partner)
UFRGS Universidade Federal do Rio Grande Do Sul (FUTEBOL partner)

FUTEBOL – H2020 688941
D5.1: Initial experiment description and results
© FUTEBOL Consortium 2016-2019 Page 7 of 60
UK United Kingdom
UL Uplink
UNICAMP Universidade de Campinas (FUTEBOL partner)
UNIVBRIS University of Bristol (FUTEBOL partner)
URLLC Ultra-Reliable Low Latency Communications
USRP Universal Software Radio Peripheral
VERONA Video Environment for Real-Time Objective and Subjective Network Analysis
VM Virtual Machine
VNF Virtualized Network Function
VTT VTT Technical Research Centre of Finland (FUTEBOL partner)
WAN Wide Area Network
WP Work Package

FUTEBOL – H2020 688941
D5.1: Initial experiment description and results
© FUTEBOL Consortium 2016-2019 Page 8 of 60
1 INTRODUCTION
The FUTEBOL project is establishing research facilities (testbeds) in both Europe and Brazil to advance research and innovation on the convergence of wireless/optical telecommunication networks. This may lead to enhancements to commercial products and services, telecommunications business models, and education, thus generating a positive impact on society.
To this end, the project focuses on three use cases of relevance to researchers in industry and academia working on the design and development of future communications networks. Each of those use cases has its own showcases mapped into tangible experiments.
As elaborated in deliverables D2.1 and D2.2 the use cases and experiments considered in the project are:
Use case 1: The impact of broadband wireless and Dynamic Spectrum Access on optical
infrastructure
• Experiment 1 – LSA/SAS for extended LTE capacity with E2E QoE.
Use case 2: The design of optical backhaul for next-generation wireless
• Experiment 2.1 – Heterogeneous wireless-optical network management with SDN and virtualization
• Experiment 2.2 – Real-time remote control of robots over a wireless-optical SDN-enabled infrastructure
Use case 3: The interplay between bursty, low data rate wireless and optical network architectures
• Experiment 3.1 – Adaptive cloud/fog for IoT according to network capacity and service latency requirements
• Experiment 3.2 – Radio-over-fibre for IoT environment monitoring.
The reporting of the initial results for each experiment is structured in the following way:
Objectives – presents and details the main objectives to be achieved by the experiment;
Showcase set up – elaborates on the testbed configuration and steps that need to be fulfilled in order to effectively set up the experiment;
Control framework – describers the integration of the experiment in the FUTEBOL federation and control framework;
Initial results – presents initial experimental results using FUTEBOL testbeds;
Next steps – outlines the next steps being taken by the consortium partners towards the final the implementation of each experiment.
FUTEBOL – H2020 688941
D5.1: Initial experiment description and results
© FUTEBOL Consortium 2016-2019 Page 9 of 60
2 EXPERIMENT 1 – LSA/SAS FOR EXTENDED LTE CAPACITY WITH E2E
QOE
2.1 Objectives of experiment 1
The main objective of this experiment is to test the protocols and interfaces of a new spectrum sharing model SAS (Spectrum Access System), and quantify its performance in terms of end-to-end (E2E) QoE, considering the wireless and the optical domains of the network infrastructure. The experiment uses the LSA/SAS testbed provided by VTT in Finland. The results of the experiment will be used to reinforce links with the Brazilian regulatory agency - Agência Nacional de Telecomunicações (ANATEL) – bringing the view of a more flexible and heterogeneous spectrum management for digital inclusion in Brazil.
LSA vs. SAS spectrum sharing models
In the United States, an approach to spectrum sharing that has been gaining traction is the Citizens Broadband Radio Service (CBRS) governed by SAS (Spectrum Access System), in the 3550–3700 MHz band. Incumbent users have the highest priority in terms of spectrum access and protection against interference from other users at any location and time. While LSA is a two-tier model, SAS has three tiers, including the General Authorized Access (GAA) tier, to facilitate opportunistic spectrum use. Priority Access (PA) users are allocated to exclusive channels and protected from other PA and GAA users. In the GAA tier, multiple users can use a given channel, and thus there is no interference protection. Compared to LSA, SAS allows a more dynamic and complex sharing model, which is likely to promote competition and foster innovation. SAS is also more likely to provide more efficient spectrum utilization and better support for the deployment of small cells. Small cells with low-power communication enable smaller exclusion zones, thus providing more spectrum optimization opportunities than macro sites. A major difference to the LSA concept is that SAS uses spectrum sensing in obtaining information about the current spectrum use. To meet the mission-critical requirements of military incumbent users, it is required that sensing is used in and adjacent to the 3.5 GHz band to detect incumbent radar activity in coastal areas and near inland military bases. Confidentiality of the sensitive military incumbent user information is ensured through strict operational security requirements and corresponding certification of the sensing elements, as well as with operator authorization. Similarly, as in LSA, at the core of the SAS concept is a database system. Incumbent users may provide spectrum usage information, such as duration of the use and operational parameters such as transmitter identity, location, antenna height, transmission power, interference tolerance capability and protection contour, to be included in the database. SAS can use either a database or a database-plus-sensing approach to identify the available spectrum opportunities. Previous studies on the SAS development have focused on the technical and theoretical aspects of the research work. In order to start practical testing and trials of the SAS concept, design and implementation are also important. Recent publications discussing architectural considerations of SAS include [1] and [2]. In addition, a messaging protocol for the SAS operation has been proposed in [3]. Currently, several member companies and research organizations of the Wireless Innovation Forum (WInnForum) are jointly developing interfaces, protocols and messaging formats for SAS. Some of the specified requests enable spectrum inquiries, granting permissions to use spectrum, and spectrum relinquishment between SAS and CBRS devices (CBSDs) What is currently missing in the SoA are analyses of the dynamics and time domain performance of SAS. Previous work has focused more on spatial and frequency domain considerations. One of the
FUTEBOL – H2020 688941
D5.1: Initial experiment description and results
© FUTEBOL Consortium 2016-2019 Page 10 of 60
most important performance indicators is the evacuation time from the first indication of incumbent use in the same band and location to the time the band is cleared of any interfering secondary systems such as LTE base stations. In the case of an informing incumbent, the evacuation time determines how much in advance the incumbent user needs to declare its intention to use the spectrum at a certain location to avoid interference. In the case of sensing, the evacuation time is directly linked to the detection requirements. In this experiment we use the recent standard specifications from WInnForum [3] [4] [5] to study the SAS operation with a focus on the evacuation and reconfiguration performance. The system is implemented and evacuation and reconfiguration time values are measured and analysed in a live commercial network environment. It is important to carry out field tests to prove that the relevant SAS requirements can be met using commercial networks and systems.
2.2 Showcase set up
SAS reference architecture
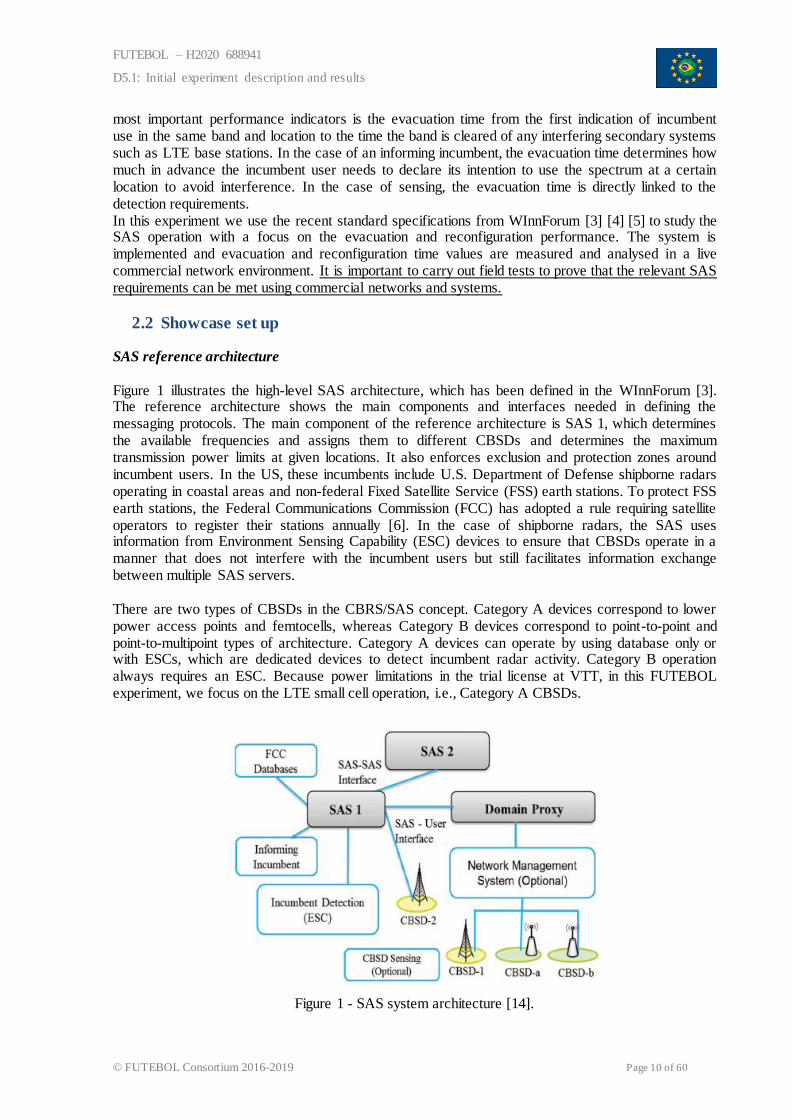
Figure 1 illustrates the high-level SAS architecture, which has been defined in the WInnForum [3]. The reference architecture shows the main components and interfaces needed in defining the messaging protocols. The main component of the reference architecture is SAS 1, which determines the available frequencies and assigns them to different CBSDs and determines the maximum transmission power limits at given locations. It also enforces exclusion and protection zones around incumbent users. In the US, these incumbents include U.S. Department of Defense shipborne radars operating in coastal areas and non-federal Fixed Satellite Service (FSS) earth stations. To protect FSS earth stations, the Federal Communications Commission (FCC) has adopted a rule requiring satellite operators to register their stations annually [6]. In the case of shipborne radars, the SAS uses information from Environment Sensing Capability (ESC) devices to ensure that CBSDs operate in a manner that does not interfere with the incumbent users but still facilitates information exchange between multiple SAS servers. There are two types of CBSDs in the CBRS/SAS concept. Category A devices correspond to lower power access points and femtocells, whereas Category B devices correspond to point-to-point and point-to-multipoint types of architecture. Category A devices can operate by using database only or with ESCs, which are dedicated devices to detect incumbent radar activity. Category B operation always requires an ESC. Because power limitations in the trial license at VTT, in this FUTEBOL experiment, we focus on the LTE small cell operation, i.e., Category A CBSDs.
Figure 1 - SAS system architecture [14].
FUTEBOL – H2020 688941
D5.1: Initial experiment description and results
© FUTEBOL Consortium 2016-2019 Page 11 of 60
SAS protocol
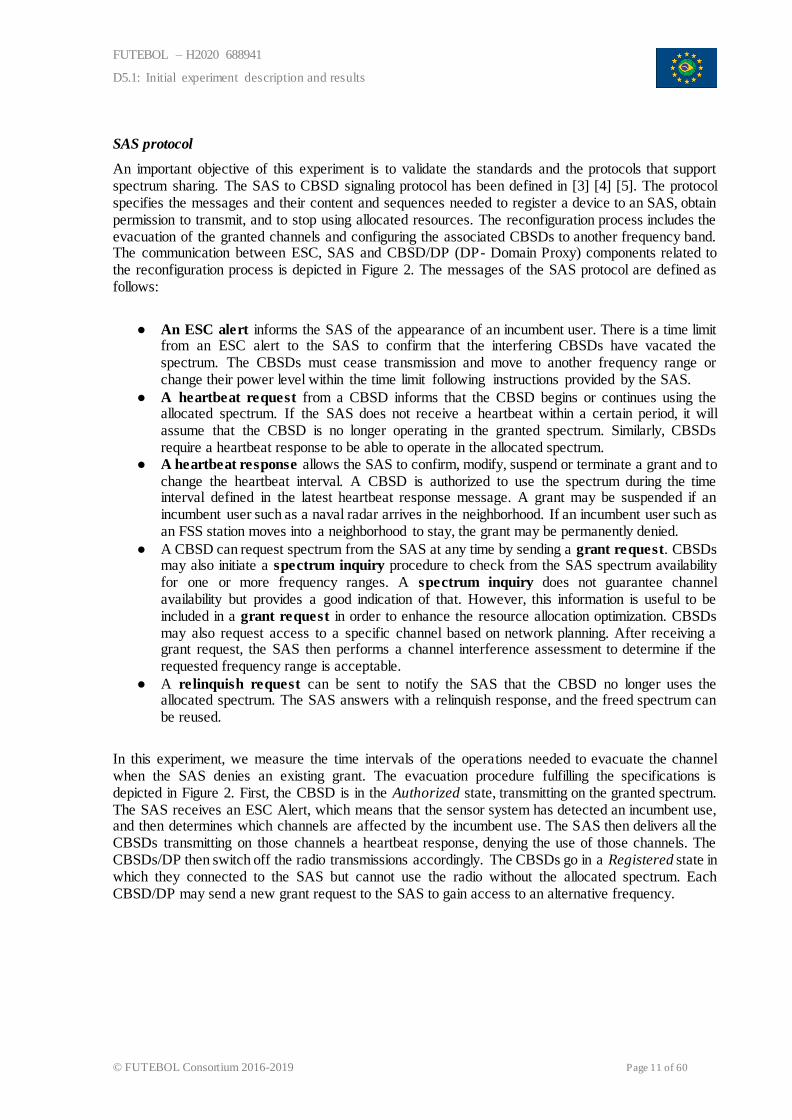
An important objective of this experiment is to validate the standards and the protocols that support spectrum sharing. The SAS to CBSD signaling protocol has been defined in [3] [4] [5]. The protocol specifies the messages and their content and sequences needed to register a device to an SAS, obtain permission to transmit, and to stop using allocated resources. The reconfiguration process includes the evacuation of the granted channels and configuring the associated CBSDs to another frequency band. The communication between ESC, SAS and CBSD/DP (DP- Domain Proxy) components related to the reconfiguration process is depicted in Figure 2. The messages of the SAS protocol are defined as follows:
● An ESC alert informs the SAS of the appearance of an incumbent user. There is a time limit from an ESC alert to the SAS to confirm that the interfering CBSDs have vacated the spectrum. The CBSDs must cease transmission and move to another frequency range or change their power level within the time limit following instructions provided by the SAS.
● A heartbeat request from a CBSD informs that the CBSD begins or continues using the allocated spectrum. If the SAS does not receive a heartbeat within a certain period, it will assume that the CBSD is no longer operating in the granted spectrum. Similarly, CBSDs require a heartbeat response to be able to operate in the allocated spectrum.
● A heartbeat response allows the SAS to confirm, modify, suspend or terminate a grant and to change the heartbeat interval. A CBSD is authorized to use the spectrum during the time interval defined in the latest heartbeat response message. A grant may be suspended if an incumbent user such as a naval radar arrives in the neighborhood. If an incumbent user such as an FSS station moves into a neighborhood to stay, the grant may be permanently denied.
● A CBSD can request spectrum from the SAS at any time by sending a grant request. CBSDs may also initiate a spectrum inquiry procedure to check from the SAS spectrum availability for one or more frequency ranges. A spectrum inquiry does not guarantee channel availability but provides a good indication of that. However, this information is useful to be included in a grant request in order to enhance the resource allocation optimization. CBSDs may also request access to a specific channel based on network planning. After receiving a grant request, the SAS then performs a channel interference assessment to determine if the requested frequency range is acceptable.
● A relinquish request can be sent to notify the SAS that the CBSD no longer uses the allocated spectrum. The SAS answers with a relinquish response, and the freed spectrum can be reused.
In this experiment, we measure the time intervals of the operations needed to evacuate the channel when the SAS denies an existing grant. The evacuation procedure fulfilling the specifications is depicted in Figure 2. First, the CBSD is in the Authorized state, transmitting on the granted spectrum. The SAS receives an ESC Alert, which means that the sensor system has detected an incumbent use, and then determines which channels are affected by the incumbent use. The SAS then delivers all the CBSDs transmitting on those channels a heartbeat response, denying the use of those channels. The CBSDs/DP then switch off the radio transmissions accordingly. The CBSDs go in a Registered state in which they connected to the SAS but cannot use the radio without the allocated spectrum. Each CBSD/DP may send a new grant request to the SAS to gain access to an alternative frequency.
FUTEBOL – H2020 688941
D5.1: Initial experiment description and results
© FUTEBOL Consortium 2016-2019 Page 12 of 60
Figure 2- CBSD reconfiguration protocol after receiving an ESC Alert. [4]
Measurement Setup
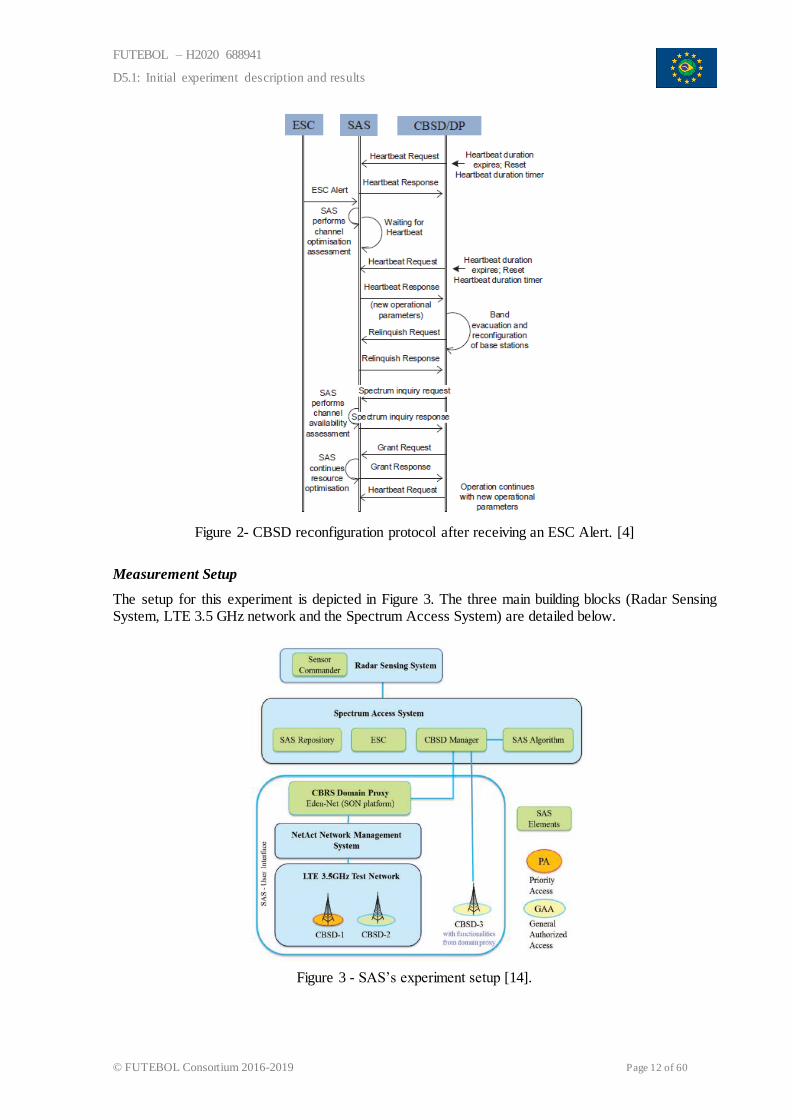
The setup for this experiment is depicted in Figure 3. The three main building blocks (Radar Sensing System, LTE 3.5 GHz network and the Spectrum Access System) are detailed below.
Figure 3 - SAS’s experiment setup [14].
FUTEBOL – H2020 688941
D5.1: Initial experiment description and results
© FUTEBOL Consortium 2016-2019 Page 13 of 60
Radar Sensing System
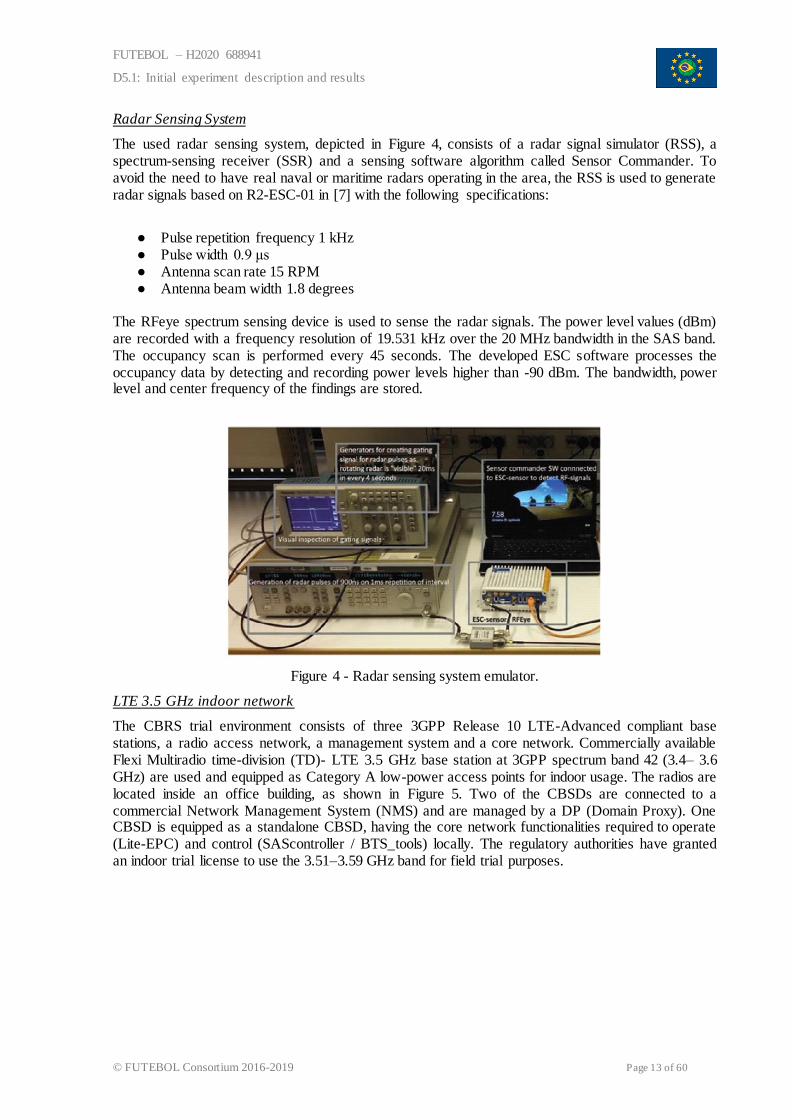
The used radar sensing system, depicted in Figure 4, consists of a radar signal simulator (RSS), a spectrum-sensing receiver (SSR) and a sensing software algorithm called Sensor Commander. To avoid the need to have real naval or maritime radars operating in the area, the RSS is used to generate radar signals based on R2-ESC-01 in [7] with the following specifications:
● Pulse repetition frequency 1 kHz ● Pulse width 0.9 μs ● Antenna scan rate 15 RPM ● Antenna beam width 1.8 degrees
The RFeye spectrum sensing device is used to sense the radar signals. The power level values (dBm) are recorded with a frequency resolution of 19.531 kHz over the 20 MHz bandwidth in the SAS band. The occupancy scan is performed every 45 seconds. The developed ESC software processes the occupancy data by detecting and recording power levels higher than -90 dBm. The bandwidth, power level and center frequency of the findings are stored.
Figure 4 - Radar sensing system emulator.
LTE 3.5 GHz indoor network
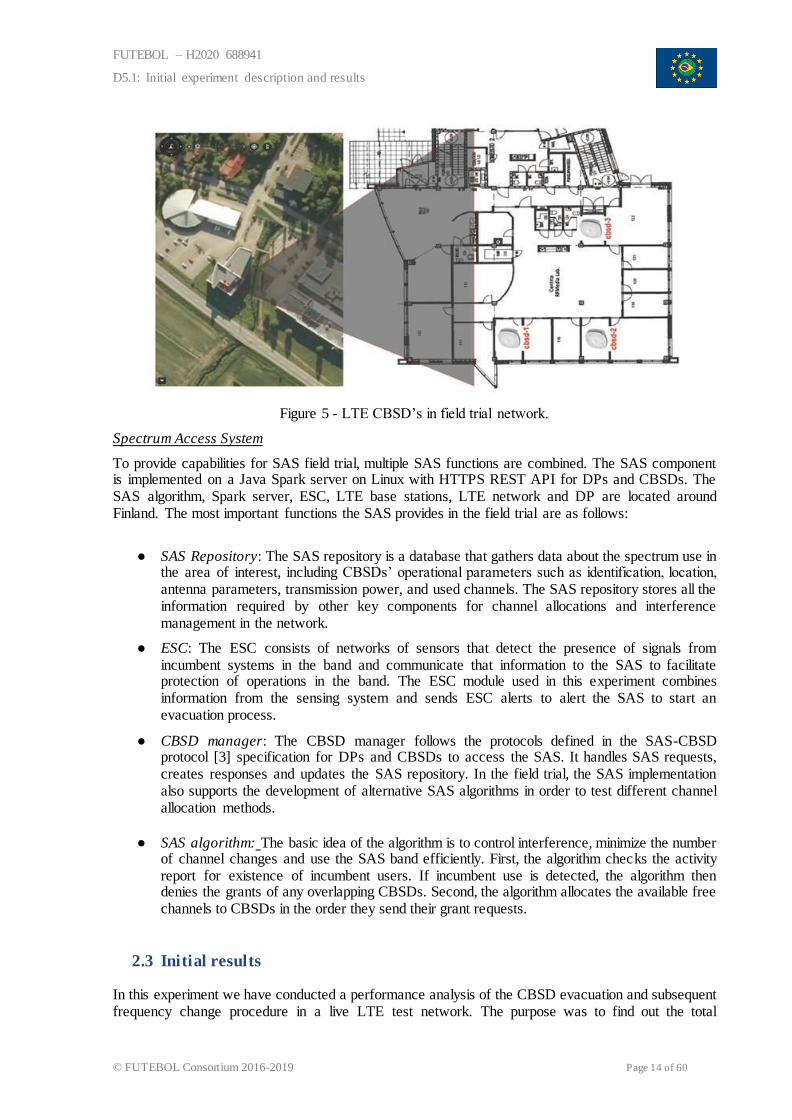
The CBRS trial environment consists of three 3GPP Release 10 LTE-Advanced compliant base stations, a radio access network, a management system and a core network. Commercially available Flexi Multiradio time-division (TD)- LTE 3.5 GHz base station at 3GPP spectrum band 42 (3.4– 3.6 GHz) are used and equipped as Category A low-power access points for indoor usage. The radios are located inside an office building, as shown in Figure 5. Two of the CBSDs are connected to a commercial Network Management System (NMS) and are managed by a DP (Domain Proxy). One CBSD is equipped as a standalone CBSD, having the core network functionalities required to operate (Lite-EPC) and control (SAScontroller / BTS_tools) locally. The regulatory authorities have granted an indoor trial license to use the 3.51–3.59 GHz band for field trial purposes.
FUTEBOL – H2020 688941
D5.1: Initial experiment description and results
© FUTEBOL Consortium 2016-2019 Page 14 of 60
Figure 5 - LTE CBSD’s in field trial network.
Spectrum Access System
To provide capabilities for SAS field trial, multiple SAS functions are combined. The SAS component is implemented on a Java Spark server on Linux with HTTPS REST API for DPs and CBSDs. The SAS algorithm, Spark server, ESC, LTE base stations, LTE network and DP are located around Finland. The most important functions the SAS provides in the field trial are as follows:
● SAS Repository: The SAS repository is a database that gathers data about the spectrum use in the area of interest, including CBSDs’ operational parameters such as identification, location, antenna parameters, transmission power, and used channels. The SAS repository stores all the information required by other key components for channel allocations and interference management in the network.
● ESC: The ESC consists of networks of sensors that detect the presence of signals from incumbent systems in the band and communicate that information to the SAS to facilitate protection of operations in the band. The ESC module used in this experiment combines information from the sensing system and sends ESC alerts to alert the SAS to start an evacuation process.
● CBSD manager: The CBSD manager follows the protocols defined in the SAS-CBSD protocol [3] specification for DPs and CBSDs to access the SAS. It handles SAS requests, creates responses and updates the SAS repository. In the field trial, the SAS implementation also supports the development of alternative SAS algorithms in order to test different channel allocation methods.
● SAS algorithm: The basic idea of the algorithm is to control interference, minimize the number of channel changes and use the SAS band efficiently. First, the algorithm checks the activity report for existence of incumbent users. If incumbent use is detected, the algorithm then denies the grants of any overlapping CBSDs. Second, the algorithm allocates the available free channels to CBSDs in the order they send their grant requests.
2.3 Initial results
In this experiment we have conducted a performance analysis of the CBSD evacuation and subsequent frequency change procedure in a live LTE test network. The purpose was to find out the total
FUTEBOL – H2020 688941
D5.1: Initial experiment description and results
© FUTEBOL Consortium 2016-2019 Page 15 of 60
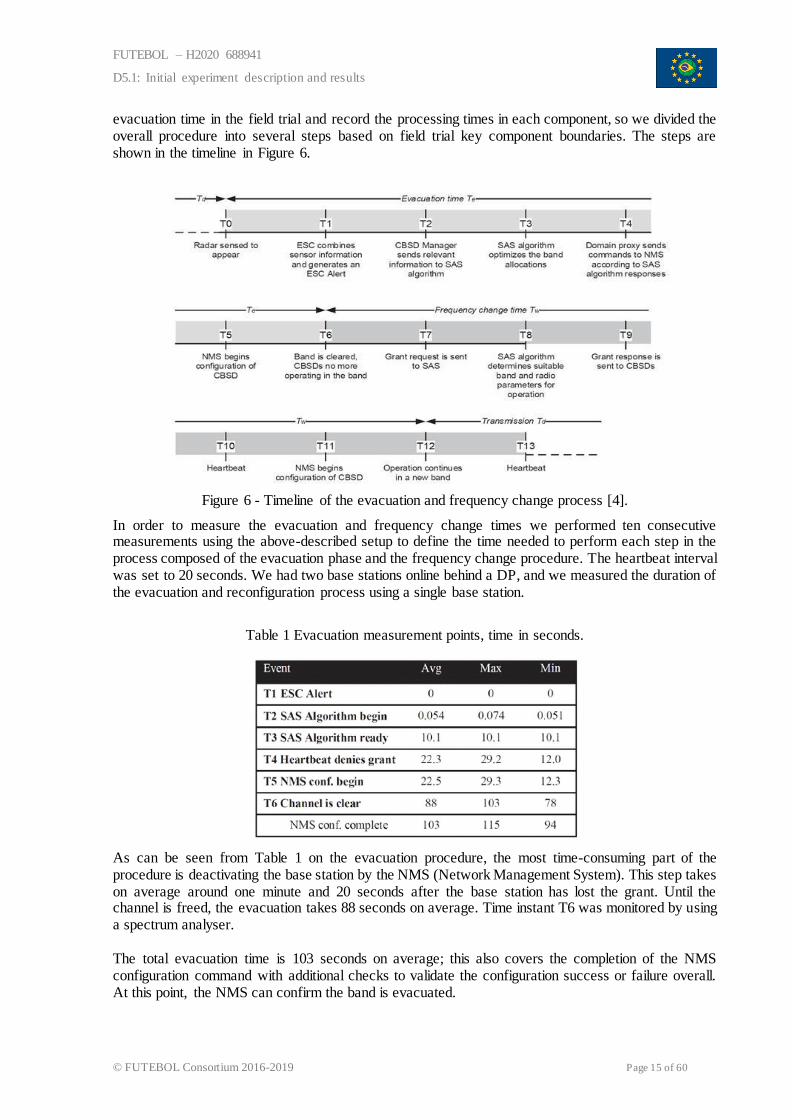
evacuation time in the field trial and record the processing times in each component, so we divided the overall procedure into several steps based on field trial key component boundaries. The steps are shown in the timeline in Figure 6.
Figure 6 - Timeline of the evacuation and frequency change process [4].
In order to measure the evacuation and frequency change times we performed ten consecutive measurements using the above-described setup to define the time needed to perform each step in the process composed of the evacuation phase and the frequency change procedure. The heartbeat interval was set to 20 seconds. We had two base stations online behind a DP, and we measured the duration of the evacuation and reconfiguration process using a single base station.
Table 1 Evacuation measurement points, time in seconds.
As can be seen from Table 1 on the evacuation procedure, the most time-consuming part of the procedure is deactivating the base station by the NMS (Network Management System). This step takes on average around one minute and 20 seconds after the base station has lost the grant. Until the channel is freed, the evacuation takes 88 seconds on average. Time instant T6 was monitored by using a spectrum analyser. The total evacuation time is 103 seconds on average; this also covers the completion of the NMS configuration command with additional checks to validate the configuration success or failure overall. At this point, the NMS can confirm the band is evacuated.
FUTEBOL – H2020 688941
D5.1: Initial experiment description and results
© FUTEBOL Consortium 2016-2019 Page 16 of 60
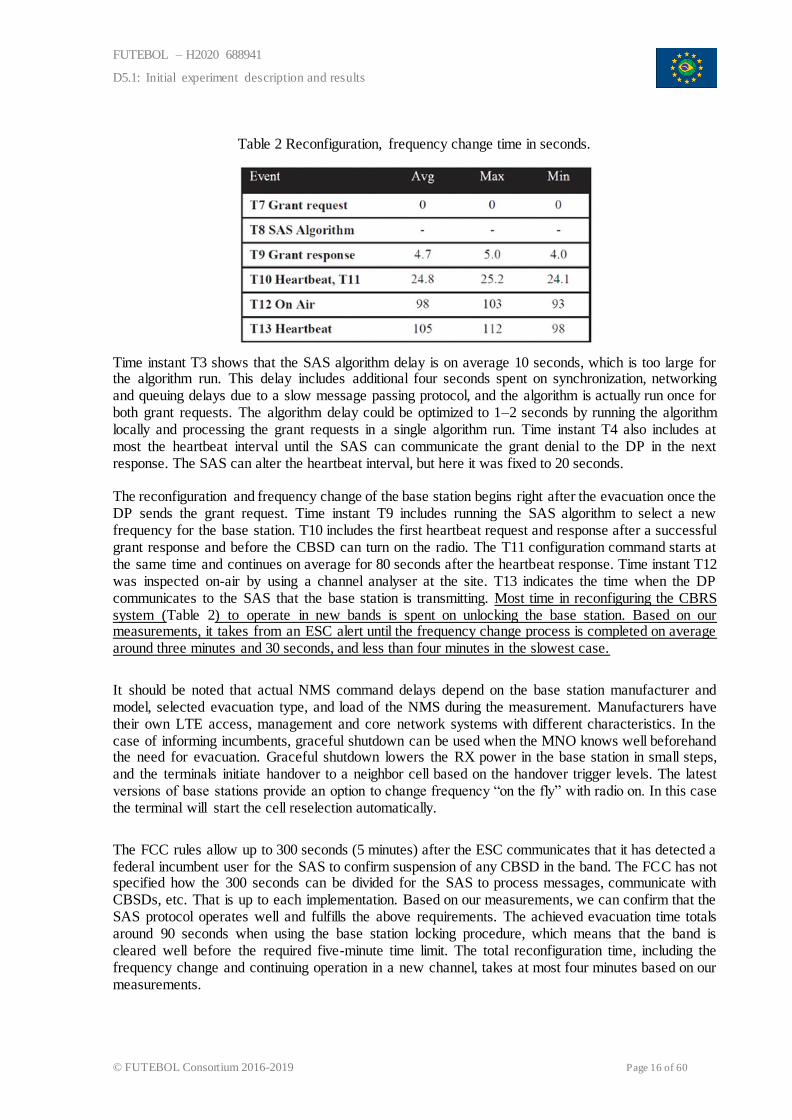
Table 2 Reconfiguration, frequency change time in seconds.
Time instant T3 shows that the SAS algorithm delay is on average 10 seconds, which is too large for the algorithm run. This delay includes additional four seconds spent on synchronization, networking and queuing delays due to a slow message passing protocol, and the algorithm is actually run once for both grant requests. The algorithm delay could be optimized to 1–2 seconds by running the algorithm locally and processing the grant requests in a single algorithm run. Time instant T4 also includes at most the heartbeat interval until the SAS can communicate the grant denial to the DP in the next response. The SAS can alter the heartbeat interval, but here it was fixed to 20 seconds. The reconfiguration and frequency change of the base station begins right after the evacuation once the DP sends the grant request. Time instant T9 includes running the SAS algorithm to select a new frequency for the base station. T10 includes the first heartbeat request and response after a successful grant response and before the CBSD can turn on the radio. The T11 configuration command starts at the same time and continues on average for 80 seconds after the heartbeat response. Time instant T12 was inspected on-air by using a channel analyser at the site. T13 indicates the time when the DP communicates to the SAS that the base station is transmitting. Most time in reconfiguring the CBRS system (Table 2) to operate in new bands is spent on unlocking the base station. Based on our measurements, it takes from an ESC alert until the frequency change process is completed on average around three minutes and 30 seconds, and less than four minutes in the slowest case.
It should be noted that actual NMS command delays depend on the base station manufacturer and model, selected evacuation type, and load of the NMS during the measurement. Manufacturers have their own LTE access, management and core network systems with different characteristics. In the case of informing incumbents, graceful shutdown can be used when the MNO knows well beforehand the need for evacuation. Graceful shutdown lowers the RX power in the base station in small steps, and the terminals initiate handover to a neighbor cell based on the handover trigger levels. The latest versions of base stations provide an option to change frequency “on the fly” with radio on. In this case the terminal will start the cell reselection automatically.
The FCC rules allow up to 300 seconds (5 minutes) after the ESC communicates that it has detected a federal incumbent user for the SAS to confirm suspension of any CBSD in the band. The FCC has not specified how the 300 seconds can be divided for the SAS to process messages, communicate with CBSDs, etc. That is up to each implementation. Based on our measurements, we can confirm that the SAS protocol operates well and fulfills the above requirements. The achieved evacuation time totals around 90 seconds when using the base station locking procedure, which means that the band is cleared well before the required five-minute time limit. The total reconfiguration time, including the frequency change and continuing operation in a new channel, takes at most four minutes based on our measurements.
FUTEBOL – H2020 688941
D5.1: Initial experiment description and results
© FUTEBOL Consortium 2016-2019 Page 17 of 60
2.4 Control framework application
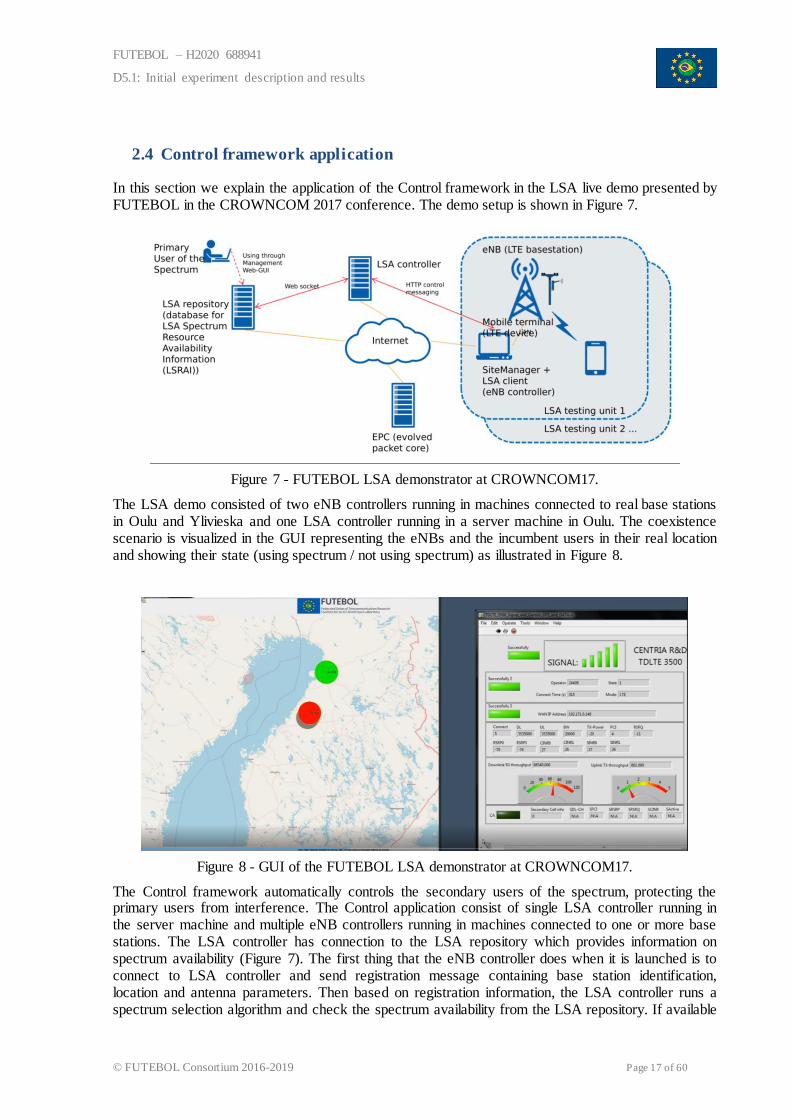
In this section we explain the application of the Control framework in the LSA live demo presented by FUTEBOL in the CROWNCOM 2017 conference. The demo setup is shown in Figure 7.
Figure 7 - FUTEBOL LSA demonstrator at CROWNCOM17.
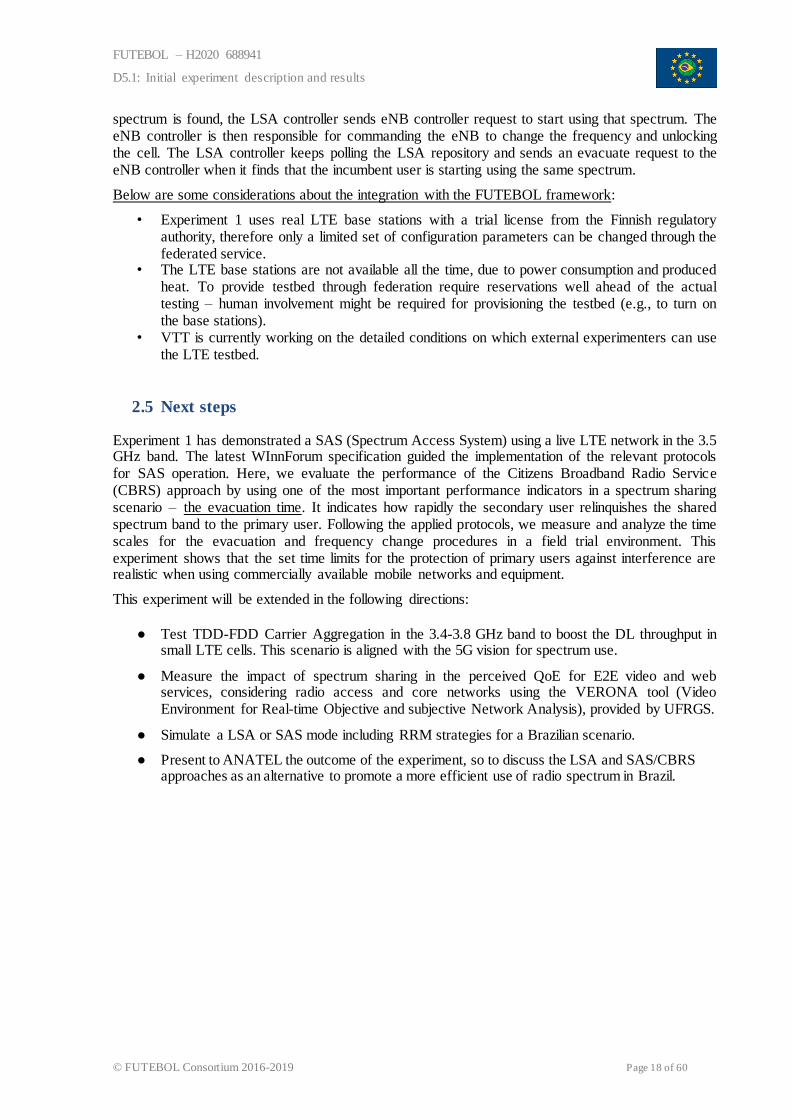
The LSA demo consisted of two eNB controllers running in machines connected to real base stations in Oulu and Ylivieska and one LSA controller running in a server machine in Oulu. The coexistence scenario is visualized in the GUI representing the eNBs and the incumbent users in their real location and showing their state (using spectrum / not using spectrum) as illustrated in Figure 8.
Figure 8 - GUI of the FUTEBOL LSA demonstrator at CROWNCOM17.
The Control framework automatically controls the secondary users of the spectrum, protecting the primary users from interference. The Control application consist of single LSA controller running in the server machine and multiple eNB controllers running in machines connected to one or more base stations. The LSA controller has connection to the LSA repository which provides information on spectrum availability (Figure 7). The first thing that the eNB controller does when it is launched is to connect to LSA controller and send registration message containing base station identification, location and antenna parameters. Then based on registration information, the LSA controller runs a spectrum selection algorithm and check the spectrum availability from the LSA repository. If available
FUTEBOL – H2020 688941
D5.1: Initial experiment description and results
© FUTEBOL Consortium 2016-2019 Page 18 of 60
spectrum is found, the LSA controller sends eNB controller request to start using that spectrum. The eNB controller is then responsible for commanding the eNB to change the frequency and unlocking the cell. The LSA controller keeps polling the LSA repository and sends an evacuate request to the eNB controller when it finds that the incumbent user is starting using the same spectrum.
Below are some considerations about the integration with the FUTEBOL framework:
• Experiment 1 uses real LTE base stations with a trial license from the Finnish regulatory authority, therefore only a limited set of configuration parameters can be changed through the federated service.
• The LTE base stations are not available all the time, due to power consumption and produced heat. To provide testbed through federation require reservations well ahead of the actual testing – human involvement might be required for provisioning the testbed (e.g., to turn on the base stations).
• VTT is currently working on the detailed conditions on which external experimenters can use the LTE testbed.
2.5 Next steps
Experiment 1 has demonstrated a SAS (Spectrum Access System) using a live LTE network in the 3.5 GHz band. The latest WInnForum specification guided the implementation of the relevant protocols for SAS operation. Here, we evaluate the performance of the Citizens Broadband Radio Service (CBRS) approach by using one of the most important performance indicators in a spectrum sharing scenario – the evacuation time. It indicates how rapidly the secondary user relinquishes the shared spectrum band to the primary user. Following the applied protocols, we measure and analyze the time scales for the evacuation and frequency change procedures in a field trial environment. This experiment shows that the set time limits for the protection of primary users against interference are realistic when using commercially available mobile networks and equipment.
This experiment will be extended in the following directions:
● Test TDD-FDD Carrier Aggregation in the 3.4-3.8 GHz band to boost the DL throughput in small LTE cells. This scenario is aligned with the 5G vision for spectrum use.
● Measure the impact of spectrum sharing in the perceived QoE for E2E video and web services, considering radio access and core networks using the VERONA tool (Video Environment for Real-time Objective and subjective Network Analysis), provided by UFRGS.
● Simulate a LSA or SAS mode including RRM strategies for a Brazilian scenario.
● Present to ANATEL the outcome of the experiment, so to discuss the LSA and SAS/CBRS approaches as an alternative to promote a more efficient use of radio spectrum in Brazil.
FUTEBOL – H2020 688941
D5.1: Initial experiment description and results
© FUTEBOL Consortium 2016-2019 Page 19 of 60
3 EXPERIMENT 2.1 – HETEROGENEOUS WIRELESS-OPTICAL NETWORK
MANAGEMENT WITH SDN AND VIRTUALIZATION
This experiment focuses on heterogeneous network management with SDN and network virtualization. In particular, we are looking at the possibility of integrating wireless and optical networks for joint control and management. This experiment has been divided into three stages, which are: 1) Split radio processing; 2) Network Functions Virtualization (NFV); 3) D2D and Coded Caching. We have been working on individual experiments on each stage, as well as integrating multiple stages together in order to build joint showcases involving multiple testbeds from different project partners.
3.1 Objectives of experiment 2.1
The objectives of experiment 2.1, proposed in D2.2, are the following:
1. Demonstrate new methods of dynamically changing the split of radio functionality,
between fronthaul and backhaul, in a Cloud Radio Access Network (RAN) environment .
TCD is planning the demonstration of dynamic fronthaul/backhaul technology switching with LTE network running on a Passive Optical Network (PON). This experiment is the ultimate target for the end of this project. In year 2 of the project, we implemented the backhaul network and fronthaul network through PON individually, with the support of an LTE software based on Software-Defined Radio (SDR), and a BBU pool based on virtual machines (VMs).
2. Demonstrate the impacts and benefits of deploying a common control plane for
heterogeneous networks, with wireless SDR elements and fixed SDN elements.
To support the demonstration of a common control plane for Software-Defined Radio (SDR) and Software-Defined Network (SDN), TCD is in the process of integrating their mobile access network testbed (with PON and LTE base stations) together with UNIBRIS’s optical core network testbed. TCD’s PON testbed will transmit mobile fronthaul traffic and background wired network traffic using the same fibre. The fronthaul bandwidth is controlled by TCD’s RYU-based SDN controller. TCD’s SDN controller is designed to be orchestrated by UNIBRIS’s ABNO orchestrator, which is a core element of FUTEBOL control framework. A demonstration is planned to show how the ABNO orchestrator manages to control both radio parameters at TCD’s testbed and optical transmission parameters at UNIBRIS’s testbed at the same time.
3. Demonstrate the benefits and impacts of using new methods of dynamically migrating an
application server near to end-users, depending on application demand.
The dynamic migration of services is a research topic that has been led in the project by UFRGS. More specifically, in this first initial stage of experimentation, we have tested and demonstrated the migration of a video service between two separate regions. These tests were intended to adjust the service according to the demand from clients in each region. The main idea is to bring the service closer to the region that requires more bandwidth consumption, trying to improve the quality of experience for the majority of users. The development includes an orchestrator that runs an algorithm based on monitoring information received from each region. The algorithm decides what is the best placement of the service, and migrates it accordingly. The migration mechanism includes the integration with FUTEBOL’s Container Orchestration and Provisioning Architecture (COPA), which manages the lifecycle of services. Also, COPA provides a REST API for the orchestrator to collect monitoring data, and provides an interface for triggering the migrations between hosts. The experiment was performed using the COPA federated in UFRGS testbed. Throughout the rest of this section we describe in more detail the setup and results associated with this objective.
4. Explore the tradeoff between network load gains and processing delay introduced by
coded caching.
FUTEBOL – H2020 688941
D5.1: Initial experiment description and results
© FUTEBOL Consortium 2016-2019 Page 20 of 60
The creation process of a D2D group has already been implemented successfully in the UFMG testbed and is being prepared to be integrated with the coded caching part, which is the main focus of this objective. By the end of Year 2 of the FUTEBOL project, UFMG and UFC were in the final phase of implementation of a demonstrator which aims to accomplish this objective. The coded caching is implemented as a middleware layer managing the VLC server and client, with the capacity of coding and decoding the video chunks.
5. Explore how device-to-device (D2D) communication as well as coded caching may be used to alleviate the operator's network, and how such dynamicity will impact the management
of the optical and wireless parts of the network.
This objective is closely related to Stage 3, and is being developed by UFC and UFMG. One crucial point that also has been set for such objective, was to observe the tradeoff between the performance gains with the use of D2D and coded caching and the impact of those techniques in the management of the optical and wireless parts of the network.
Given the above point, and considering the current infrastructure of the testbeds for each partner involved in the experiment (UFMG/UFRGS/TCD/UNIVBRIS), as well as the approaches adopted in each stage, we decided to focus primarily on optimizations in the D2D/coded caching implementations.
Since Stage 3 involves the employment of D2D and coded caching in an operator’s network, one mandatory task in order to accomplish this objective is the emulation of a 4G infrastructure and its successful integration with a D2D group. By the end of Year 2, we have successfully emulated a set of 4G User Equipment (UE) connected with a 4G evolved NodeB (eNB), all through the use of a set of USRPs and miniPCs available in the UFMG testbed. In some cases, the miniPCs running the UEs were also connected through a D2D group, with the employment of Wi-Fi Direct. We observed the performance improvement that can be achieved when a set of files is downloaded with the use of D2D and 4G in a cooperative manner. More details about the use cases are given in Section 3.2 and results are presented in Section 3.4.
Finally, it is worth mentioning that the complete accomplishment of this objective depends directly on the conclusion of the fourth objective, since there are software dependencies between them, for example, the successful integration of D2D and coded caching implementations.
3.2 Showcase set up
The showcase in this Experiment 2.1 consists of 3 stages, which are the following:
Stage 1 - Split radio processing
Stage 2 - Network Functions Virtualization (NFV)
Stage 3 - D2D and Coded Caching
These 3 stages for the showcases are designed to map to the previously introduced objectives. During the implementation, we first work on individual experiments separately in different stages and then we proceed to integrate multiple stages together. The following text reports the progress in each stage and the showcase set-ups.
Stage 1 - Split radio processing
In this stage of showcase we focus on building a Cloud Radio Access Network (C-RAN) testbed, and integrate an optical network with an LTE network using SDN and SDR technologies. C-RAN is one of the promising network architectures for next-generation mobile communication. The idea of C-RAN is to integrate multiple Baseband Units (BBUs) for signal processing in centralized BBU pools, in order to manage the utilization of processing resources more flexibly and in a more energy-efficient way. The optical network between BBU and RRH is referred to as the mobile fronthaul. In this stage of the experiment, we are working on the fronthaul control and management.
FUTEBOL – H2020 688941
D5.1: Initial experiment description and results
© FUTEBOL Consortium 2016-2019 Page 21 of 60
Flexible bandwidth mobile fronthaul implementation with PON and SDN
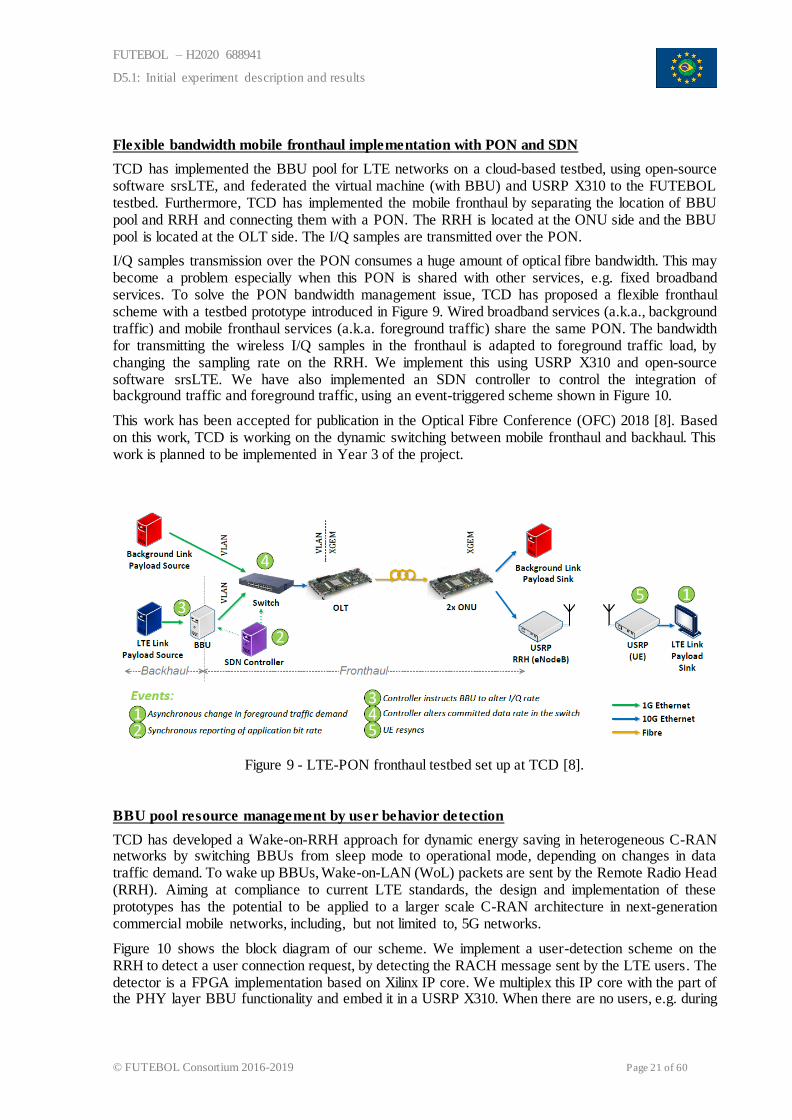
TCD has implemented the BBU pool for LTE networks on a cloud-based testbed, using open-source software srsLTE, and federated the virtual machine (with BBU) and USRP X310 to the FUTEBOL testbed. Furthermore, TCD has implemented the mobile fronthaul by separating the location of BBU pool and RRH and connecting them with a PON. The RRH is located at the ONU side and the BBU pool is located at the OLT side. The I/Q samples are transmitted over the PON.
I/Q samples transmission over the PON consumes a huge amount of optical fibre bandwidth. This may become a problem especially when this PON is shared with other services, e.g. fixed broadband services. To solve the PON bandwidth management issue, TCD has proposed a flexible fronthaul scheme with a testbed prototype introduced in Figure 9. Wired broadband services (a.k.a., background traffic) and mobile fronthaul services (a.k.a. foreground traffic) share the same PON. The bandwidth for transmitting the wireless I/Q samples in the fronthaul is adapted to foreground traffic load, by changing the sampling rate on the RRH. We implement this using USRP X310 and open-source software srsLTE. We have also implemented an SDN controller to control the integration of background traffic and foreground traffic, using an event-triggered scheme shown in Figure 10.
This work has been accepted for publication in the Optical Fibre Conference (OFC) 2018 [8]. Based on this work, TCD is working on the dynamic switching between mobile fronthaul and backhaul. This work is planned to be implemented in Year 3 of the project.
Figure 9 - LTE-PON fronthaul testbed set up at TCD [8].
BBU pool resource management by user behavior detection
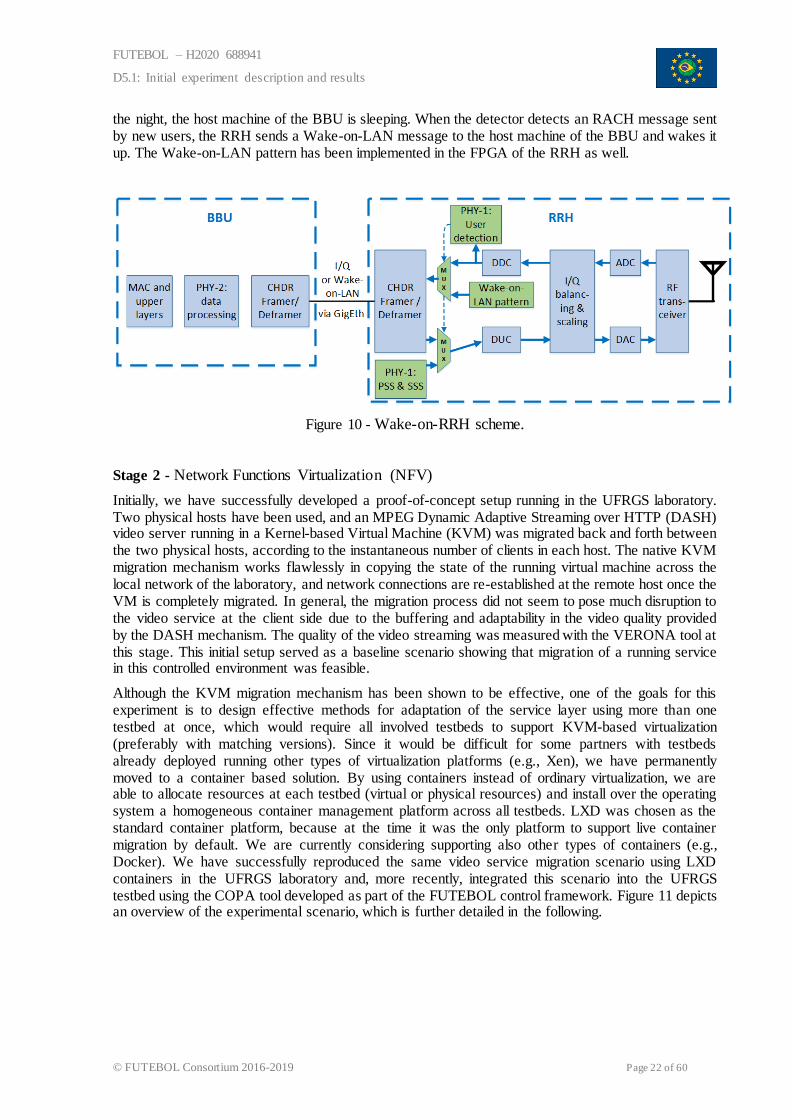
TCD has developed a Wake-on-RRH approach for dynamic energy saving in heterogeneous C-RAN networks by switching BBUs from sleep mode to operational mode, depending on changes in data traffic demand. To wake up BBUs, Wake-on-LAN (WoL) packets are sent by the Remote Radio Head (RRH). Aiming at compliance to current LTE standards, the design and implementation of these prototypes has the potential to be applied to a larger scale C-RAN architecture in next-generation commercial mobile networks, including, but not limited to, 5G networks.
Figure 10 shows the block diagram of our scheme. We implement a user-detection scheme on the RRH to detect a user connection request, by detecting the RACH message sent by the LTE users. The detector is a FPGA implementation based on Xilinx IP core. We multiplex this IP core with the part of the PHY layer BBU functionality and embed it in a USRP X310. When there are no users, e.g. during
FUTEBOL – H2020 688941
D5.1: Initial experiment description and results
© FUTEBOL Consortium 2016-2019 Page 22 of 60
the night, the host machine of the BBU is sleeping. When the detector detects an RACH message sent by new users, the RRH sends a Wake-on-LAN message to the host machine of the BBU and wakes it up. The Wake-on-LAN pattern has been implemented in the FPGA of the RRH as well.
Figure 10 - Wake-on-RRH scheme.
Stage 2 - Network Functions Virtualization (NFV)
Initially, we have successfully developed a proof-of-concept setup running in the UFRGS laboratory. Two physical hosts have been used, and an MPEG Dynamic Adaptive Streaming over HTTP (DASH) video server running in a Kernel-based Virtual Machine (KVM) was migrated back and forth between the two physical hosts, according to the instantaneous number of clients in each host. The native KVM migration mechanism works flawlessly in copying the state of the running virtual machine across the local network of the laboratory, and network connections are re-established at the remote host once the VM is completely migrated. In general, the migration process did not seem to pose much disruption to the video service at the client side due to the buffering and adaptability in the video quality provided by the DASH mechanism. The quality of the video streaming was measured with the VERONA tool at this stage. This initial setup served as a baseline scenario showing that migration of a running service in this controlled environment was feasible.
Although the KVM migration mechanism has been shown to be effective, one of the goals for this experiment is to design effective methods for adaptation of the service layer using more than one testbed at once, which would require all involved testbeds to support KVM-based virtualization (preferably with matching versions). Since it would be difficult for some partners with testbeds already deployed running other types of virtualization platforms (e.g., Xen), we have permanently moved to a container based solution. By using containers instead of ordinary virtualization, we are able to allocate resources at each testbed (virtual or physical resources) and install over the operating system a homogeneous container management platform across all testbeds. LXD was chosen as the standard container platform, because at the time it was the only platform to support live container migration by default. We are currently considering supporting also other types of containers (e.g., Docker). We have successfully reproduced the same video service migration scenario using LXD containers in the UFRGS laboratory and, more recently, integrated this scenario into the UFRGS testbed using the COPA tool developed as part of the FUTEBOL control framework. Figure 11 depicts an overview of the experimental scenario, which is further detailed in the following.
FUTEBOL – H2020 688941
D5.1: Initial experiment description and results
© FUTEBOL Consortium 2016-2019 Page 23 of 60
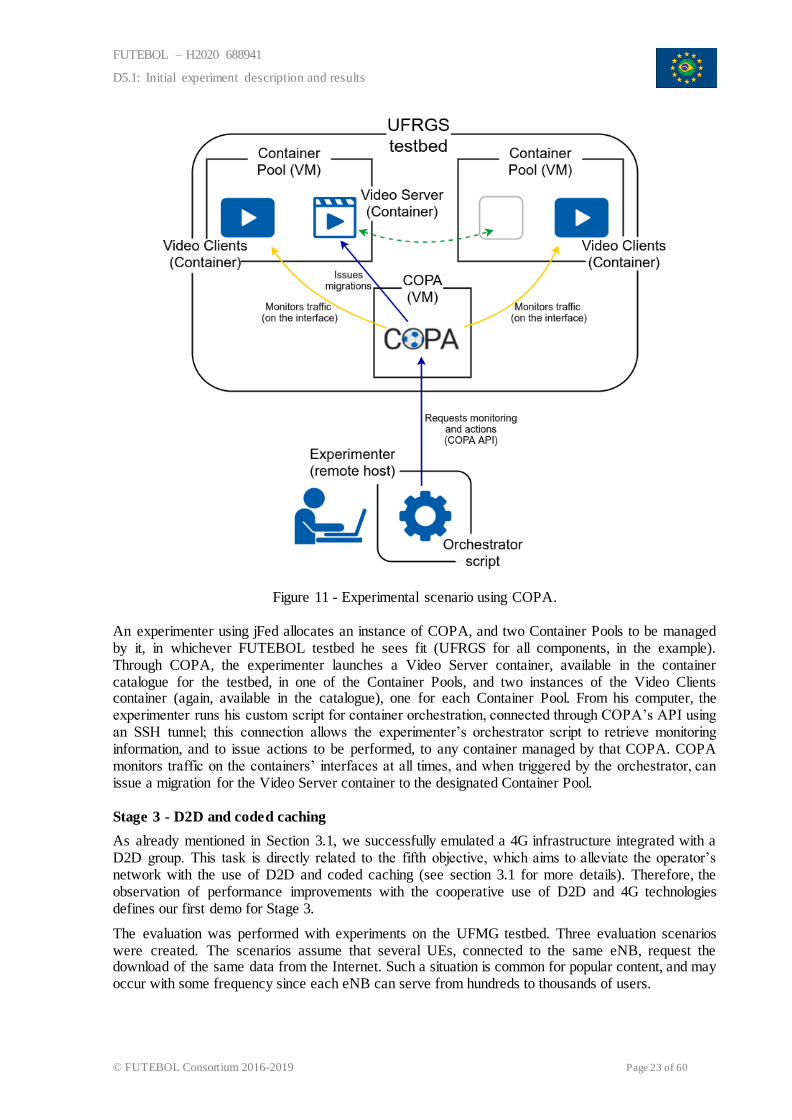
Figure 11 - Experimental scenario using COPA.
An experimenter using jFed allocates an instance of COPA, and two Container Pools to be managed by it, in whichever FUTEBOL testbed he sees fit (UFRGS for all components, in the example). Through COPA, the experimenter launches a Video Server container, available in the container catalogue for the testbed, in one of the Container Pools, and two instances of the Video Clients container (again, available in the catalogue), one for each Container Pool. From his computer, the experimenter runs his custom script for container orchestration, connected through COPA’s API using an SSH tunnel; this connection allows the experimenter’s orchestrator script to retrieve monitoring information, and to issue actions to be performed, to any container managed by that COPA. COPA monitors traffic on the containers’ interfaces at all times, and when triggered by the orchestrator, can issue a migration for the Video Server container to the designated Container Pool. Stage 3 - D2D and coded caching
As already mentioned in Section 3.1, we successfully emulated a 4G infrastructure integrated with a D2D group. This task is directly related to the fifth objective, which aims to alleviate the operator’s network with the use of D2D and coded caching (see section 3.1 for more details). Therefore, the observation of performance improvements with the cooperative use of D2D and 4G technologies defines our first demo for Stage 3.
The evaluation was performed with experiments on the UFMG testbed. Three evaluation scenarios were created. The scenarios assume that several UEs, connected to the same eNB, request the download of the same data from the Internet. Such a situation is common for popular content, and may occur with some frequency since each eNB can serve from hundreds to thousands of users.
FUTEBOL – H2020 688941
D5.1: Initial experiment description and results
© FUTEBOL Consortium 2016-2019 Page 24 of 60
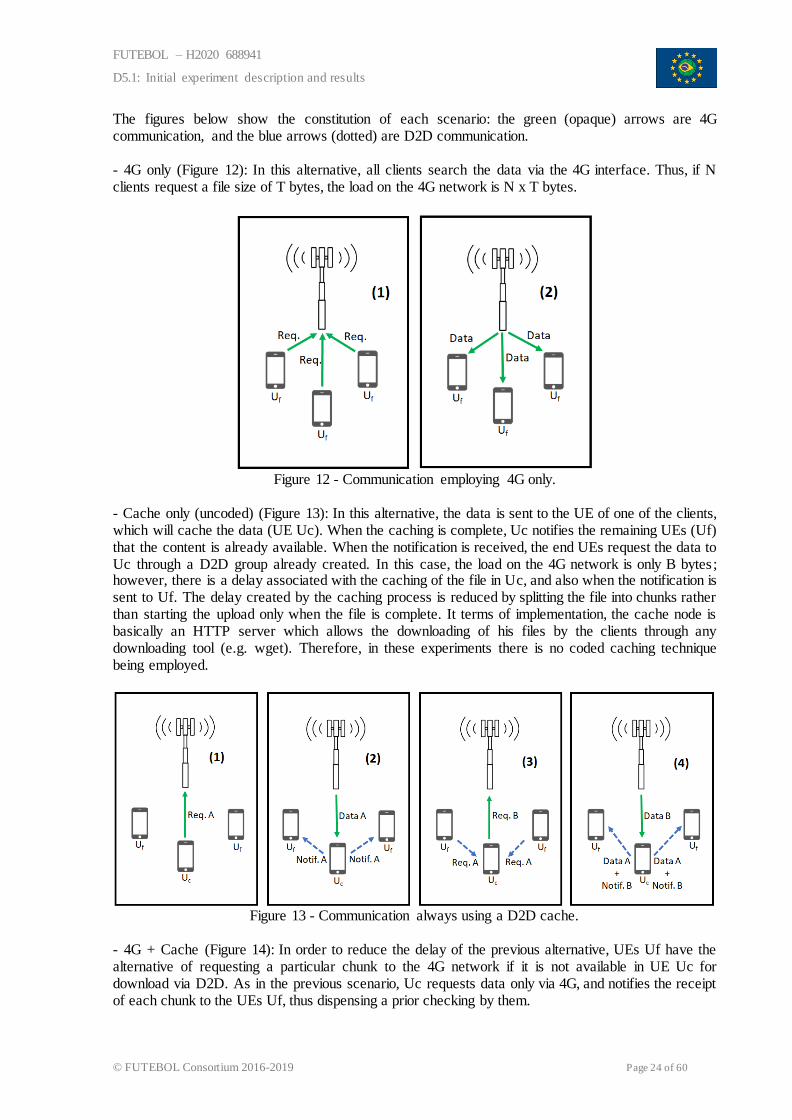
The figures below show the constitution of each scenario: the green (opaque) arrows are 4G communication, and the blue arrows (dotted) are D2D communication. - 4G only (Figure 12): In this alternative, all clients search the data via the 4G interface. Thus, if N clients request a file size of T bytes, the load on the 4G network is N x T bytes.
Figure 12 - Communication employing 4G only.
- Cache only (uncoded) (Figure 13): In this alternative, the data is sent to the UE of one of the clients, which will cache the data (UE Uc). When the caching is complete, Uc notifies the remaining UEs (Uf) that the content is already available. When the notification is received, the end UEs request the data to Uc through a D2D group already created. In this case, the load on the 4G network is only B bytes; however, there is a delay associated with the caching of the file in Uc, and also when the notification is sent to Uf. The delay created by the caching process is reduced by splitting the file into chunks rather than starting the upload only when the file is complete. It terms of implementation, the cache node is basically an HTTP server which allows the downloading of his files by the clients through any downloading tool (e.g. wget). Therefore, in these experiments there is no coded caching technique being employed.
Figure 13 - Communication always using a D2D cache.
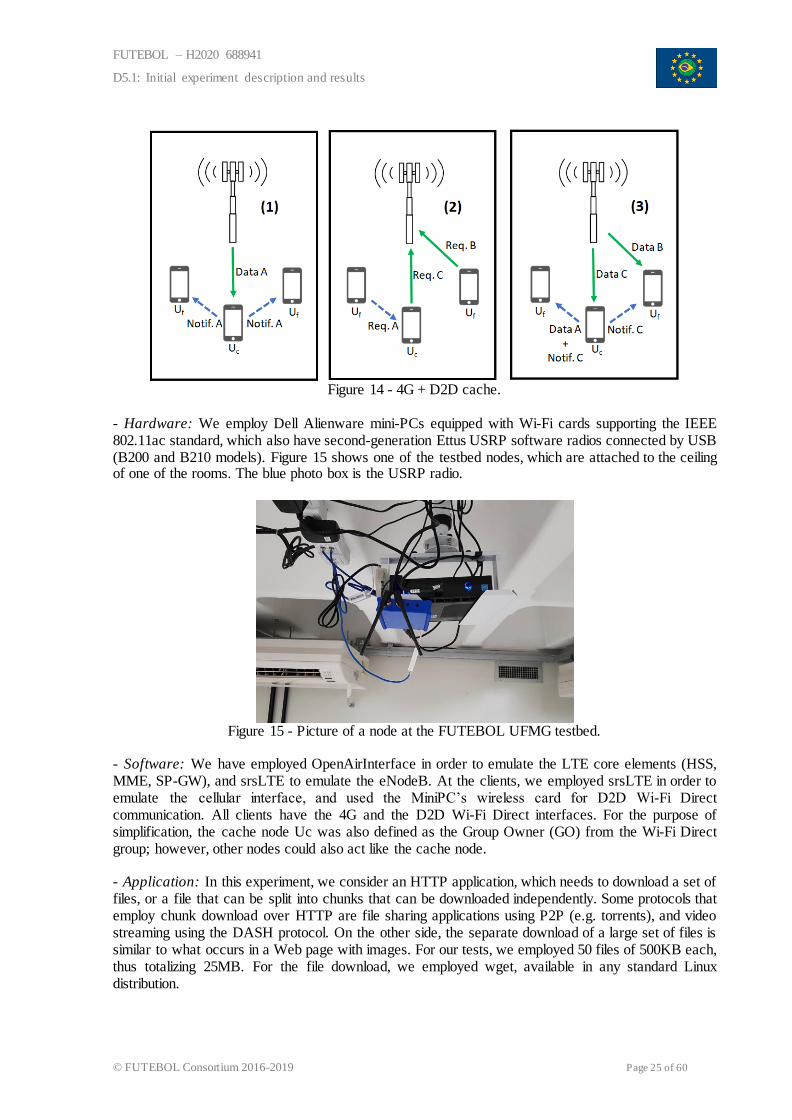
- 4G + Cache (Figure 14): In order to reduce the delay of the previous alternative, UEs Uf have the alternative of requesting a particular chunk to the 4G network if it is not available in UE Uc for download via D2D. As in the previous scenario, Uc requests data only via 4G, and notifies the receipt of each chunk to the UEs Uf, thus dispensing a prior checking by them.
FUTEBOL – H2020 688941
D5.1: Initial experiment description and results
© FUTEBOL Consortium 2016-2019 Page 25 of 60
Figure 14 - 4G + D2D cache.
- Hardware: We employ Dell Alienware mini-PCs equipped with Wi-Fi cards supporting the IEEE 802.11ac standard, which also have second-generation Ettus USRP software radios connected by USB (B200 and B210 models). Figure 15 shows one of the testbed nodes, which are attached to the ceiling of one of the rooms. The blue photo box is the USRP radio.
Figure 15 - Picture of a node at the FUTEBOL UFMG testbed.
- Software: We have employed OpenAirInterface in order to emulate the LTE core elements (HSS, MME, SP-GW), and srsLTE to emulate the eNodeB. At the clients, we employed srsLTE in order to emulate the cellular interface, and used the MiniPC’s wireless card for D2D Wi-Fi Direct communication. All clients have the 4G and the D2D Wi-Fi Direct interfaces. For the purpose of simplification, the cache node Uc was also defined as the Group Owner (GO) from the Wi-Fi Direct group; however, other nodes could also act like the cache node. - Application: In this experiment, we consider an HTTP application, which needs to download a set of files, or a file that can be split into chunks that can be downloaded independently. Some protocols that employ chunk download over HTTP are file sharing applications using P2P (e.g. torrents), and video streaming using the DASH protocol. On the other side, the separate download of a large set of files is similar to what occurs in a Web page with images. For our tests, we employed 50 files of 500KB each, thus totalizing 25MB. For the file download, we employed wget, available in any standard Linux distribution.
FUTEBOL – H2020 688941
D5.1: Initial experiment description and results
© FUTEBOL Consortium 2016-2019 Page 26 of 60
- Evaluated performance metrics: Two performance metrics were considered:
- Total download time for a file: This is the time it takes to load a graphic from a web page (or to load a chunk belonging to a video). We consider this as the main metric, since it is directly linked to the user experience.
- Average throughput of a file: It considers the average throughput rate of a file, and accounts for the difference between download times.
3.3 Control framework application
Stage 1 - Split radio processing
To support the demonstration of a common control plane for Software-Defined Radio (SDR) and Software-Defined Networking (SDN), TCD has been working on integrating their mobile access network testbed (with PON and LTE base station) together with UNIBRIS’s Optical core network testbed. TCD’s PON testbed is planned to transmit mobile fronthaul traffic and background wired network traffic in the same fibre. The fronthaul bandwidth is controlled by TCD’s RYU-based SDN controller. TCD’s SDN controller is designed to be orchestrated by UNIBRIS’s ABNO SDN orchestrator that is the core framework of FUTEBOL control framework. By the time this deliverable is written, a demonstration is being implemented to show the ABNO orchestrator manages to control both radio parameters at TCD’s testbed and optical transmission parameters at UNIBRIS’s testbed at the same time. Two testbeds (TCD and Bristol) are being connected with vxLAN technology. Control plane and data plane is being implemented for exchanging control message and data stream. More details are introduced in deliverable D4.3.
Stage 2 - Network Functions Virtualization (NFV)
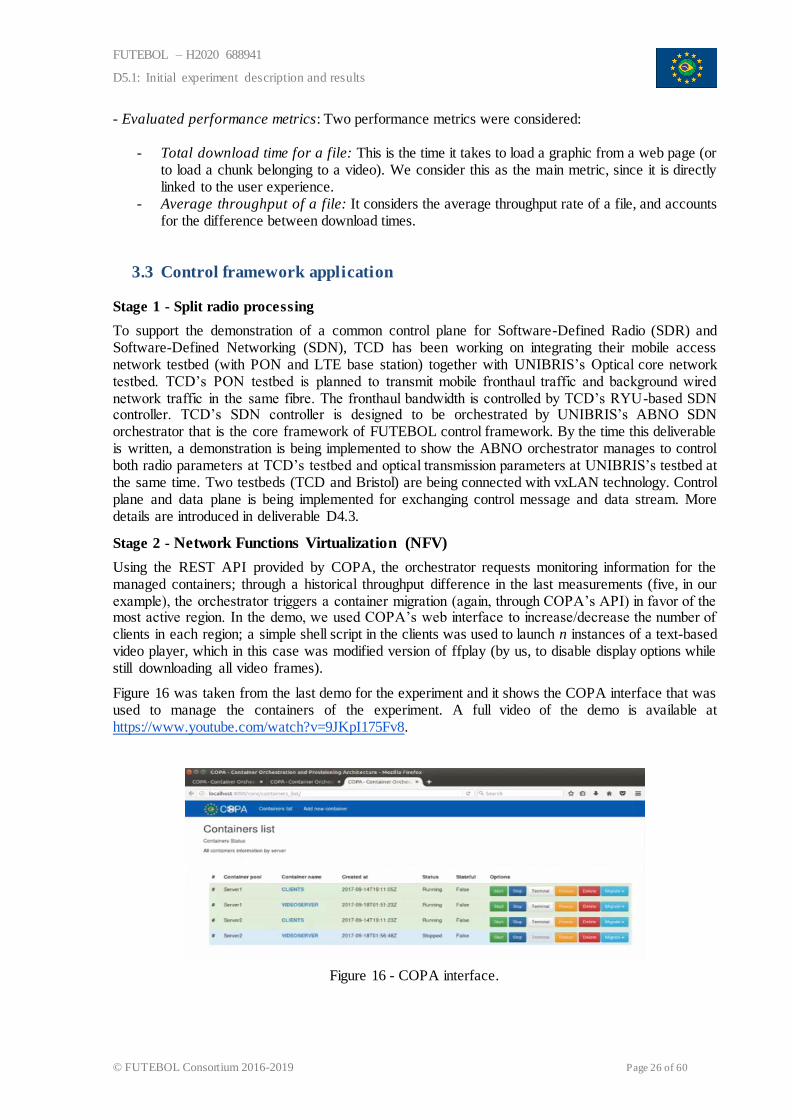
Using the REST API provided by COPA, the orchestrator requests monitoring information for the managed containers; through a historical throughput difference in the last measurements (five, in our example), the orchestrator triggers a container migration (again, through COPA’s API) in favor of the most active region. In the demo, we used COPA’s web interface to increase/decrease the number of clients in each region; a simple shell script in the clients was used to launch n instances of a text-based video player, which in this case was modified version of ffplay (by us, to disable display options while still downloading all video frames).
Figure 16 was taken from the last demo for the experiment and it shows the COPA interface that was used to manage the containers of the experiment. A full video of the demo is available at https://www.youtube.com/watch?v=9JKpI175Fv8.
Figure 16 - COPA interface.

FUTEBOL – H2020 688941
D5.1: Initial experiment description and results
© FUTEBOL Consortium 2016-2019 Page 27 of 60
Because COPA is not yet available in testbeds other than UFRGS’, inter-testbed migration is planned for Year 3. To achieve it, we are now working on the deployment of COPA’s VMs and allocating code in the remaining testbeds. Making COPA available in TCD’s and BRISTOL’s testbeds, for instance, will allow us to perform any kind of cross-testbed container placement, as initially intended. Having the option of cloning running containers, in addition to the migration option, is also a factor we still hope to have working in the near future; because most our containers are somehow interconnected to each other, we still have to work on re-establishing the connections for the cloned container, steering the traffic between the two instances as needed.
Stage 3 - D2D and coded caching
Since the first demo involving the integration of 4G and D2D was tested singly in the UFMG testbed, the integration with the services implemented in the other stages and the implementation decisions related with the control framework are set as future work.
Nevertheless, we plan to refactor the whole developed code, in order to allow the proper allocation of the implemented services in one or more of the partners’ testbeds. The initial proposal is to allow the use of D2D and coded caching in a predefined setup, in a similar way as the experiments from Stage 3 that were described in Section 3.2.
Therefore, the initial integration with the existing tools from the FUTEBOL Control Framework will be only partial. This is mainly based on the obtained experience in the first demos at the UFMG testbed.
3.4 Initial results
In this section we are reporting the results in each stage of the experiment.
Stage 1 - Split radio processing
Flexible bandwidth mobile fronthaul implementation with PON and SDN
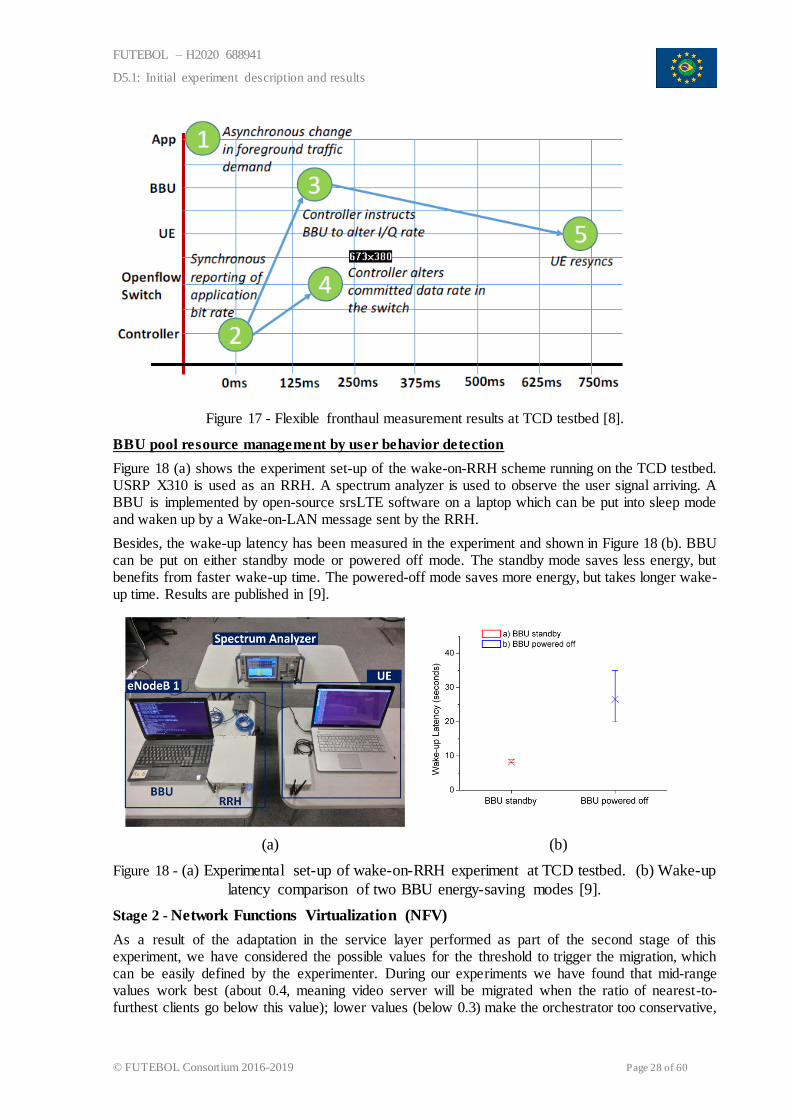
As mentioned in the previous section, TCD has implemented the flexible bandwidth fronthaul on a PON, sharing with background wired network traffic. Figure 17 shows measured timings of the process of changing the cell’s bandwidth. The events 1-4 show how the controller reconfigures the BBU from an initial state of 3 MHz to 5 MHz bandwidth. After increasing the LTE application traffic, corresponding to Event 1, the controller sets the number of PRBs to 25 (5 MHz) and reconfigures the Committed Information Rate (CIR) of the switch to cope with the extra load. Using traffic traces, we measure a time period of about 150 ms for the control plane to react to the load increase in terms of reporting to the BBU and reconfiguring the Openflow switch. The final step towards Event 5, the change to the sampling rate, takes most of the reconfiguration time. This is due to the fact that the USRP has old samples buffered, belonging to the previous configuration (i.e., 15 PRBs). These samples will be transmitted at the new rate (25 PRBs), which is the wrong rate for them. Consequently, the UE is momentarily desynchronized from the transmission, leading to an overall reconfiguration time of 750 ms [8].
FUTEBOL – H2020 688941
D5.1: Initial experiment description and results
© FUTEBOL Consortium 2016-2019 Page 28 of 60
Figure 17 - Flexible fronthaul measurement results at TCD testbed [8].
BBU pool resource management by user behavior detection
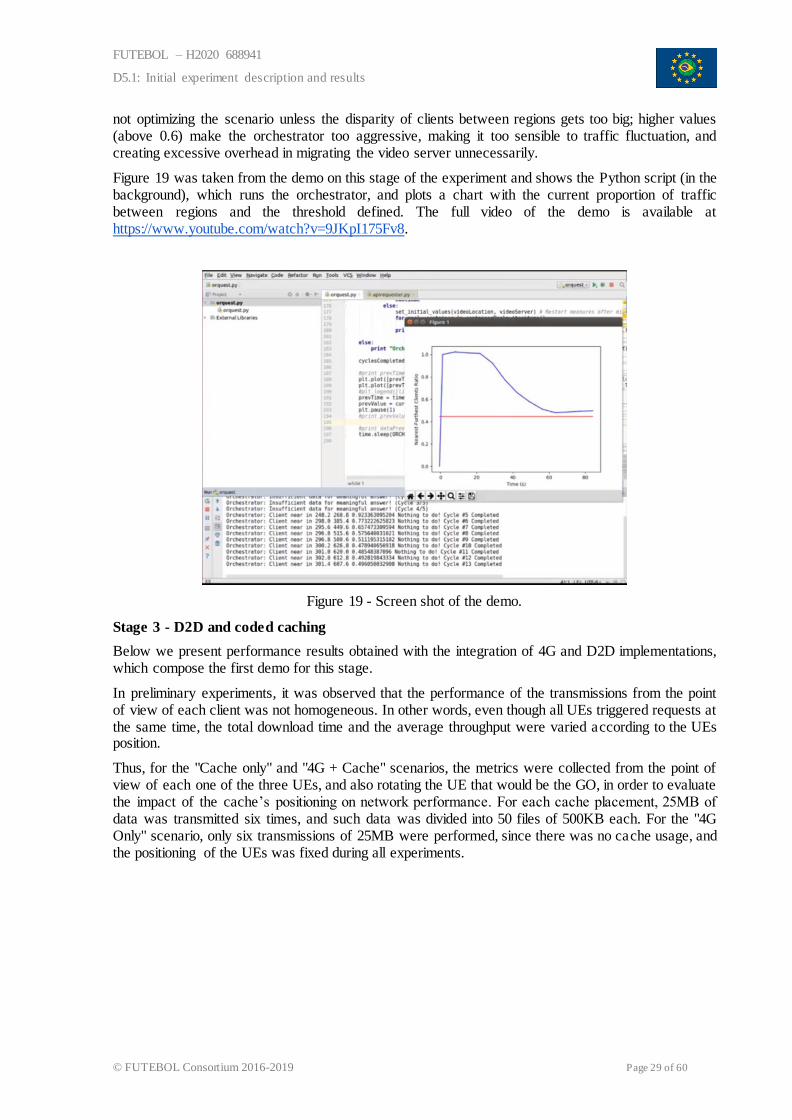
Figure 18 (a) shows the experiment set-up of the wake-on-RRH scheme running on the TCD testbed. USRP X310 is used as an RRH. A spectrum analyzer is used to observe the user signal arriving. A BBU is implemented by open-source srsLTE software on a laptop which can be put into sleep mode and waken up by a Wake-on-LAN message sent by the RRH.
Besides, the wake-up latency has been measured in the experiment and shown in Figure 18 (b). BBU can be put on either standby mode or powered off mode. The standby mode saves less energy, but benefits from faster wake-up time. The powered-off mode saves more energy, but takes longer wake-up time. Results are published in [9].
(a) (b)
Figure 18 - (a) Experimental set-up of wake-on-RRH experiment at TCD testbed. (b) Wake-up
latency comparison of two BBU energy-saving modes [9].
Stage 2 - Network Functions Virtualization (NFV)
As a result of the adaptation in the service layer performed as part of the second stage of this experiment, we have considered the possible values for the threshold to trigger the migration, which can be easily defined by the experimenter. During our experiments we have found that mid-range values work best (about 0.4, meaning video server will be migrated when the ratio of nearest-to-furthest clients go below this value); lower values (below 0.3) make the orchestrator too conservative,
FUTEBOL – H2020 688941
D5.1: Initial experiment description and results
© FUTEBOL Consortium 2016-2019 Page 29 of 60
not optimizing the scenario unless the disparity of clients between regions gets too big; higher values (above 0.6) make the orchestrator too aggressive, making it too sensible to traffic fluctuation, and creating excessive overhead in migrating the video server unnecessarily.
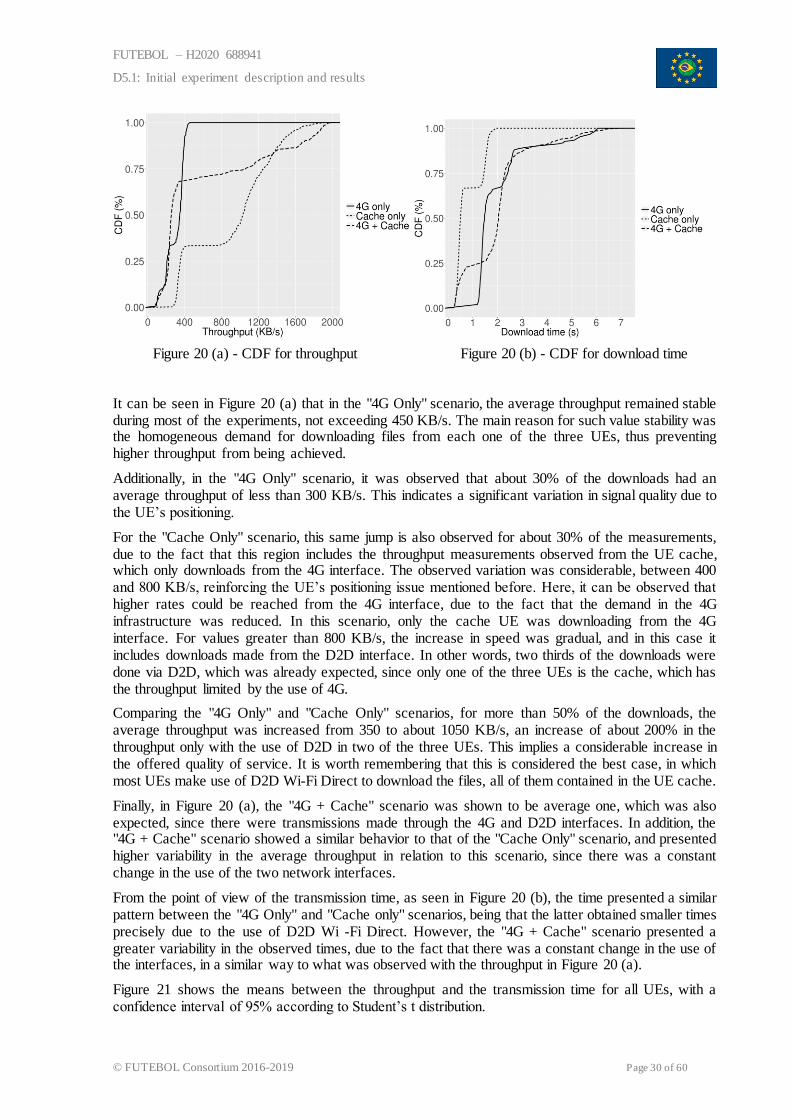
Figure 19 was taken from the demo on this stage of the experiment and shows the Python script (in the background), which runs the orchestrator, and plots a chart with the current proportion of traffic between regions and the threshold defined. The full video of the demo is available at https://www.youtube.com/watch?v=9JKpI175Fv8.
Figure 19 - Screen shot of the demo.
Stage 3 - D2D and coded caching
Below we present performance results obtained with the integration of 4G and D2D implementations, which compose the first demo for this stage.
In preliminary experiments, it was observed that the performance of the transmissions from the point of view of each client was not homogeneous. In other words, even though all UEs triggered requests at the same time, the total download time and the average throughput were varied according to the UEs position.
Thus, for the "Cache only" and "4G + Cache" scenarios, the metrics were collected from the point of view of each one of the three UEs, and also rotating the UE that would be the GO, in order to evaluate the impact of the cache’s positioning on network performance. For each cache placement, 25MB of data was transmitted six times, and such data was divided into 50 files of 500KB each. For the "4G Only" scenario, only six transmissions of 25MB were performed, since there was no cache usage, and the positioning of the UEs was fixed during all experiments.
FUTEBOL – H2020 688941
D5.1: Initial experiment description and results
© FUTEBOL Consortium 2016-2019 Page 30 of 60
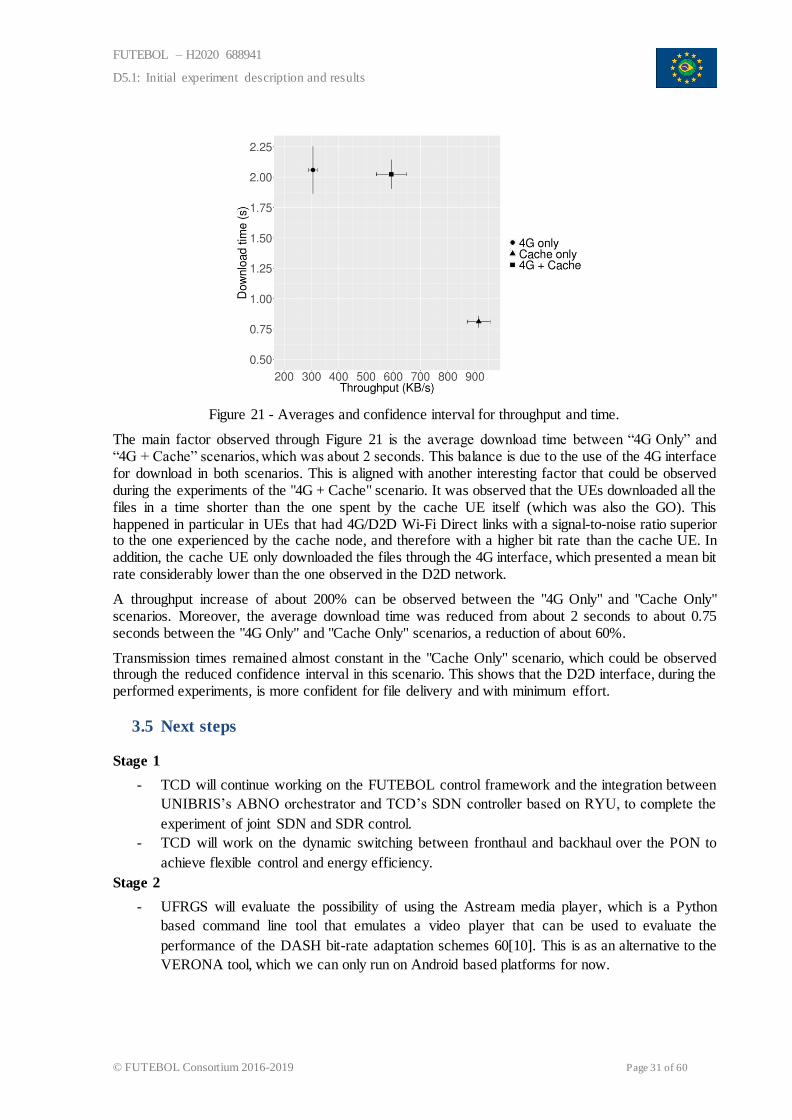
Figure 20 (a) - CDF for throughput Figure 20 (b) - CDF for download time
It can be seen in Figure 20 (a) that in the "4G Only" scenario, the average throughput remained stable during most of the experiments, not exceeding 450 KB/s. The main reason for such value stability was the homogeneous demand for downloading files from each one of the three UEs, thus preventing higher throughput from being achieved.
Additionally, in the "4G Only" scenario, it was observed that about 30% of the downloads had an average throughput of less than 300 KB/s. This indicates a significant variation in signal quality due to the UE’s positioning.
For the "Cache Only" scenario, this same jump is also observed for about 30% of the measurements, due to the fact that this region includes the throughput measurements observed from the UE cache, which only downloads from the 4G interface. The observed variation was considerable, between 400 and 800 KB/s, reinforcing the UE’s positioning issue mentioned before. Here, it can be observed that higher rates could be reached from the 4G interface, due to the fact that the demand in the 4G infrastructure was reduced. In this scenario, only the cache UE was downloading from the 4G interface. For values greater than 800 KB/s, the increase in speed was gradual, and in this case it includes downloads made from the D2D interface. In other words, two thirds of the downloads were done via D2D, which was already expected, since only one of the three UEs is the cache, which has the throughput limited by the use of 4G.
Comparing the "4G Only" and "Cache Only" scenarios, for more than 50% of the downloads, the average throughput was increased from 350 to about 1050 KB/s, an increase of about 200% in the throughput only with the use of D2D in two of the three UEs. This implies a considerable increase in the offered quality of service. It is worth remembering that this is considered the best case, in which most UEs make use of D2D Wi-Fi Direct to download the files, all of them contained in the UE cache.
Finally, in Figure 20 (a), the "4G + Cache" scenario was shown to be average one, which was also expected, since there were transmissions made through the 4G and D2D interfaces. In addition, the "4G + Cache" scenario showed a similar behavior to that of the "Cache Only" scenario, and presented higher variability in the average throughput in relation to this scenario, since there was a constant change in the use of the two network interfaces.
From the point of view of the transmission time, as seen in Figure 20 (b), the time presented a similar pattern between the "4G Only" and "Cache only" scenarios, being that the latter obtained smaller times precisely due to the use of D2D Wi -Fi Direct. However, the "4G + Cache" scenario presented a greater variability in the observed times, due to the fact that there was a constant change in the use of the interfaces, in a similar way to what was observed with the throughput in Figure 20 (a).
Figure 21 shows the means between the throughput and the transmission time for all UEs, with a confidence interval of 95% according to Student’s t distribution.
FUTEBOL – H2020 688941
D5.1: Initial experiment description and results
© FUTEBOL Consortium 2016-2019 Page 31 of 60
Figure 21 - Averages and confidence interval for throughput and time.
The main factor observed through Figure 21 is the average download time between “4G Only” and “4G + Cache” scenarios, which was about 2 seconds. This balance is due to the use of the 4G interface for download in both scenarios. This is aligned with another interesting factor that could be observed during the experiments of the "4G + Cache" scenario. It was observed that the UEs downloaded all the files in a time shorter than the one spent by the cache UE itself (which was also the GO). This happened in particular in UEs that had 4G/D2D Wi-Fi Direct links with a signal-to-noise ratio superior to the one experienced by the cache node, and therefore with a higher bit rate than the cache UE. In addition, the cache UE only downloaded the files through the 4G interface, which presented a mean bit rate considerably lower than the one observed in the D2D network.
A throughput increase of about 200% can be observed between the "4G Only" and "Cache Only" scenarios. Moreover, the average download time was reduced from about 2 seconds to about 0.75 seconds between the "4G Only" and "Cache Only" scenarios, a reduction of about 60%.
Transmission times remained almost constant in the "Cache Only" scenario, which could be observed through the reduced confidence interval in this scenario. This shows that the D2D interface, during the performed experiments, is more confident for file delivery and with minimum effort.
3.5 Next steps
Stage 1
- TCD will continue working on the FUTEBOL control framework and the integration between
UNIBRIS’s ABNO orchestrator and TCD’s SDN controller based on RYU, to complete the
experiment of joint SDN and SDR control.
- TCD will work on the dynamic switching between fronthaul and backhaul over the PON to
achieve flexible control and energy efficiency.
Stage 2
- UFRGS will evaluate the possibility of using the Astream media player, which is a Python
based command line tool that emulates a video player that can be used to evaluate the
performance of the DASH bit-rate adaptation schemes 60[10]. This is as an alternative to the
VERONA tool, which we can only run on Android based platforms for now.
FUTEBOL – H2020 688941
D5.1: Initial experiment description and results
© FUTEBOL Consortium 2016-2019 Page 32 of 60
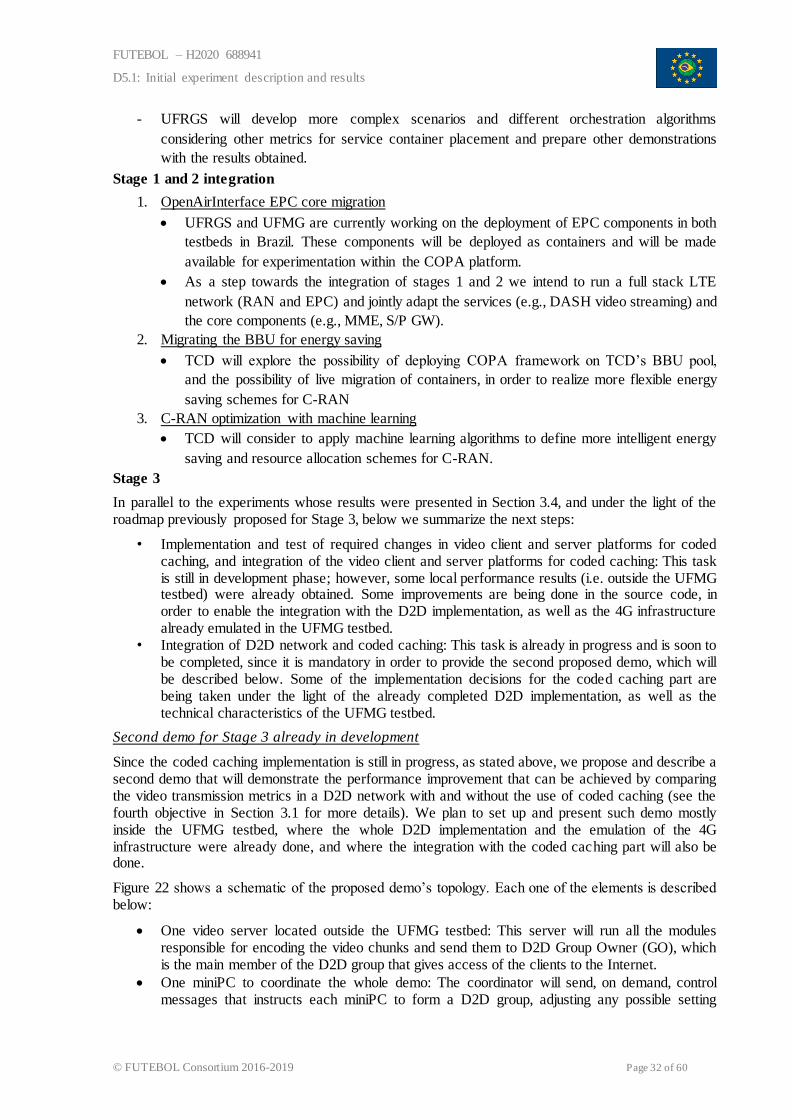
- UFRGS will develop more complex scenarios and different orchestration algorithms
considering other metrics for service container placement and prepare other demonstrations
with the results obtained.
Stage 1 and 2 integration
1. OpenAirInterface EPC core migration
UFRGS and UFMG are currently working on the deployment of EPC components in both
testbeds in Brazil. These components will be deployed as containers and will be made
available for experimentation within the COPA platform.
As a step towards the integration of stages 1 and 2 we intend to run a full stack LTE
network (RAN and EPC) and jointly adapt the services (e.g., DASH video streaming) and
the core components (e.g., MME, S/P GW).
2. Migrating the BBU for energy saving
TCD will explore the possibility of deploying COPA framework on TCD’s BBU pool,
and the possibility of live migration of containers, in order to realize more flexible energy
saving schemes for C-RAN
3. C-RAN optimization with machine learning
TCD will consider to apply machine learning algorithms to define more intelligent energy
saving and resource allocation schemes for C-RAN.
Stage 3
In parallel to the experiments whose results were presented in Section 3.4, and under the light of the roadmap previously proposed for Stage 3, below we summarize the next steps:
• Implementation and test of required changes in video client and server platforms for coded caching, and integration of the video client and server platforms for coded caching: This task is still in development phase; however, some local performance results (i.e. outside the UFMG testbed) were already obtained. Some improvements are being done in the source code, in order to enable the integration with the D2D implementation, as well as the 4G infrastructure already emulated in the UFMG testbed.
• Integration of D2D network and coded caching: This task is already in progress and is soon to be completed, since it is mandatory in order to provide the second proposed demo, which will be described below. Some of the implementation decisions for the coded caching part are being taken under the light of the already completed D2D implementation, as well as the technical characteristics of the UFMG testbed.
Second demo for Stage 3 already in development
Since the coded caching implementation is still in progress, as stated above, we propose and describe a second demo that will demonstrate the performance improvement that can be achieved by comparing the video transmission metrics in a D2D network with and without the use of coded caching (see the fourth objective in Section 3.1 for more details). We plan to set up and present such demo mostly inside the UFMG testbed, where the whole D2D implementation and the emulation of the 4G infrastructure were already done, and where the integration with the coded caching part will also be done.
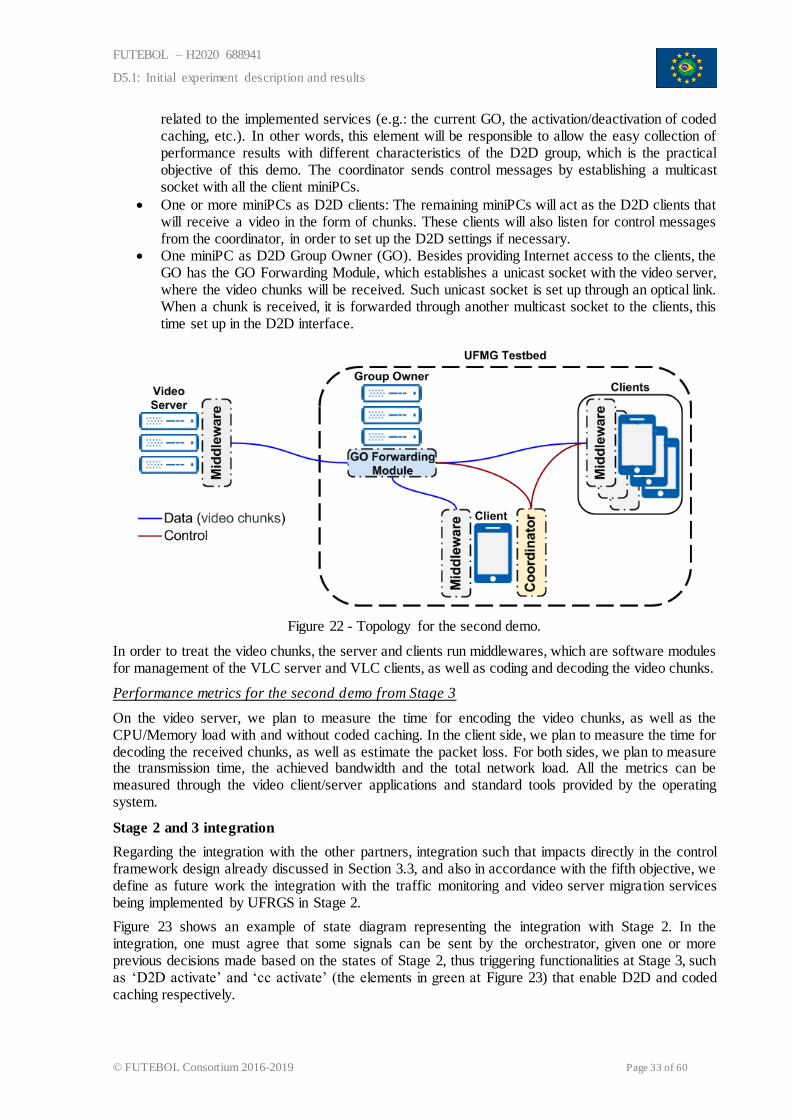
Figure 22 shows a schematic of the proposed demo’s topology. Each one of the elements is described below:
One video server located outside the UFMG testbed: This server will run all the modules responsible for encoding the video chunks and send them to D2D Group Owner (GO), which is the main member of the D2D group that gives access of the clients to the Internet.
One miniPC to coordinate the whole demo: The coordinator will send, on demand, control messages that instructs each miniPC to form a D2D group, adjusting any possible setting
FUTEBOL – H2020 688941
D5.1: Initial experiment description and results
© FUTEBOL Consortium 2016-2019 Page 33 of 60
related to the implemented services (e.g.: the current GO, the activation/deactivation of coded caching, etc.). In other words, this element will be responsible to allow the easy collection of performance results with different characteristics of the D2D group, which is the practical objective of this demo. The coordinator sends control messages by establishing a multicast socket with all the client miniPCs.
One or more miniPCs as D2D clients: The remaining miniPCs will act as the D2D clients that will receive a video in the form of chunks. These clients will also listen for control messages from the coordinator, in order to set up the D2D settings if necessary.
One miniPC as D2D Group Owner (GO). Besides providing Internet access to the clients, the GO has the GO Forwarding Module, which establishes a unicast socket with the video server, where the video chunks will be received. Such unicast socket is set up through an optical link. When a chunk is received, it is forwarded through another multicast socket to the clients, this time set up in the D2D interface.
Figure 22 - Topology for the second demo.
In order to treat the video chunks, the server and clients run middlewares, which are software modules for management of the VLC server and VLC clients, as well as coding and decoding the video chunks.
Performance metrics for the second demo from Stage 3
On the video server, we plan to measure the time for encoding the video chunks, as well as the CPU/Memory load with and without coded caching. In the client side, we plan to measure the time for decoding the received chunks, as well as estimate the packet loss. For both sides, we plan to measure the transmission time, the achieved bandwidth and the total network load. All the metrics can be measured through the video client/server applications and standard tools provided by the operating system.
Stage 2 and 3 integration
Regarding the integration with the other partners, integration such that impacts directly in the control framework design already discussed in Section 3.3, and also in accordance with the fifth objective, we define as future work the integration with the traffic monitoring and video server migration services being implemented by UFRGS in Stage 2.
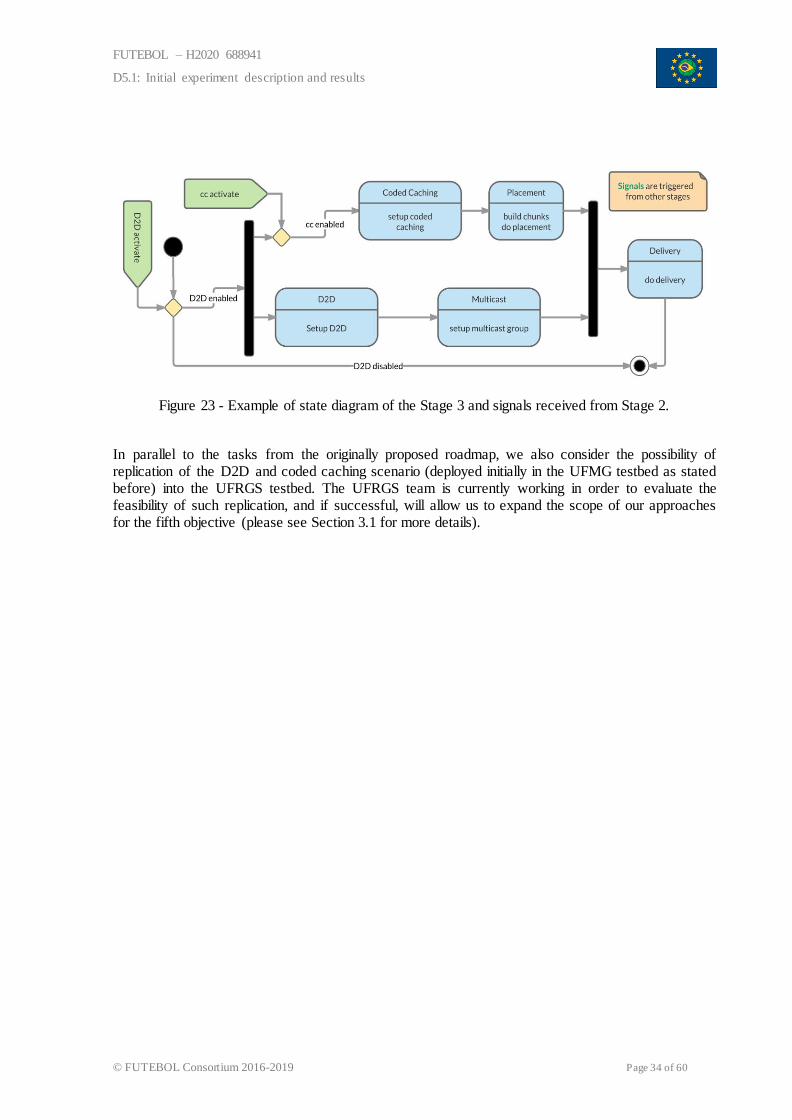
Figure 23 shows an example of state diagram representing the integration with Stage 2. In the integration, one must agree that some signals can be sent by the orchestrator, given one or more previous decisions made based on the states of Stage 2, thus triggering functionalities at Stage 3, such as ‘D2D activate’ and ‘cc activate’ (the elements in green at Figure 23) that enable D2D and coded caching respectively.
FUTEBOL – H2020 688941
D5.1: Initial experiment description and results
© FUTEBOL Consortium 2016-2019 Page 34 of 60
Figure 23 - Example of state diagram of the Stage 3 and signals received from Stage 2.
In parallel to the tasks from the originally proposed roadmap, we also consider the possibility of replication of the D2D and coded caching scenario (deployed initially in the UFMG testbed as stated before) into the UFRGS testbed. The UFRGS team is currently working in order to evaluate the feasibility of such replication, and if successful, will allow us to expand the scope of our approaches for the fifth objective (please see Section 3.1 for more details).
FUTEBOL – H2020 688941
D5.1: Initial experiment description and results
© FUTEBOL Consortium 2016-2019 Page 35 of 60
4 EXPERIMENT 2.2 – REAL-TIME REMOTE CONTROL OF ROBOTS OVER A
WIRELESS-OPTICAL SDN-ENABLED INFRASTRUCTURE
4.1 Objectives of experiment 2.2
Experiment 2.2 focuses on evaluating the impact of SDN and cloud computing technologies in systems running real-time applications with low E2E latency and high bandwidth requirements. In light of the new generation of robotics as a service (e.g., rehabilitation therapies, robot localization and navigation, assistive robotics) provided by intelligent spaces, this experiment illustrates the real-time remote control of a mobile robot. Intelligent spaces can be described as environments equipped with a network of sensors, used to gather information about the surroundings, and a supervisor system that analyses such information and enables task execution through a network of actuators. For experiment 2.2, the intelligent space used by FUTEBOL has four cameras, a wirelessly commanded mobile robot unit, and an SDN switch connecting the intelligent space to an edge datacenter. The mobile robot has very little onboard computation, memory, or software, being commanded by remotely generated control signals. Over such setup, experiment 2.2 integrates SDN and cloud computing techniques to leverage latency-bound and communication and computation resources to enable the so-called cloud robotics paradigm in intelligent spaces.
The complete architecture of experiment 2.2 involves three basic groups of resources: an intelligent space, an edge datacenter, and remote datacenters. The intelligent space contains cameras, which transmit data to edge and/or remote datacenters, a remotely controlled robot, and a set of wireless devices. The cloud (represented by edge and remote datacenters) is responsible for processing data, determining the robot localization based on camera images, and, in turn, generating control commands back to the robot.
In an indoor scenario, the mobile robotic platform contains only the necessary components for wireless communication and execution of control commands (i.e., the robot does not use extrinsic sensors nor executes control algorithms). The cameras gather images from the intelligent space and send them to image processing and localization services in the cloud. The robot’s localization is then compared against the desired trajectory (i.e., target position defined as a function of time and not as a series of discrete positions) and a control service, also in the cloud, produces the control command, which is transmitted using wired and wireless networks to the robot in the intelligent space.
The intelligent space camera's frame rate will dictate deadlines for both network latency and services. In other words, after a image frame is captured, it must be sent to the cloud platform, localization and control services must be executed, and the control signal should arrive at the robot before the next image frame is captured, thus setting stringent QoS requirements. Otherwise, if the control command does not reach the robot on time, the outdated information is no longer accurate, causing the robot to deviate from the planned trajectory, which might lead to overall robot instability in extreme cases.
This experiment aims to explore the bottlenecks in the cloud-fiber-wireless for running applications involving cyber-physical systems. Note that both network and datacenter infrastructures will impose bottlenecks in terms of throughput and latency to the remote control of the robot. Thus, classic network performance indicators are important metrics to be assessed alongside with the robot’s trajectory error, which is the distance between the current robot position and the defined trajectory in a given instant of time. Experiment 2.2 tackles stringent latency and bandwidth requirements by orchestrating both SDN-enabled networks and elastic resources in cloud computing. The ways in which SDN and NFV can be used to improve orchestration are investigated, exploring how to perform better computing and network resource utilization.
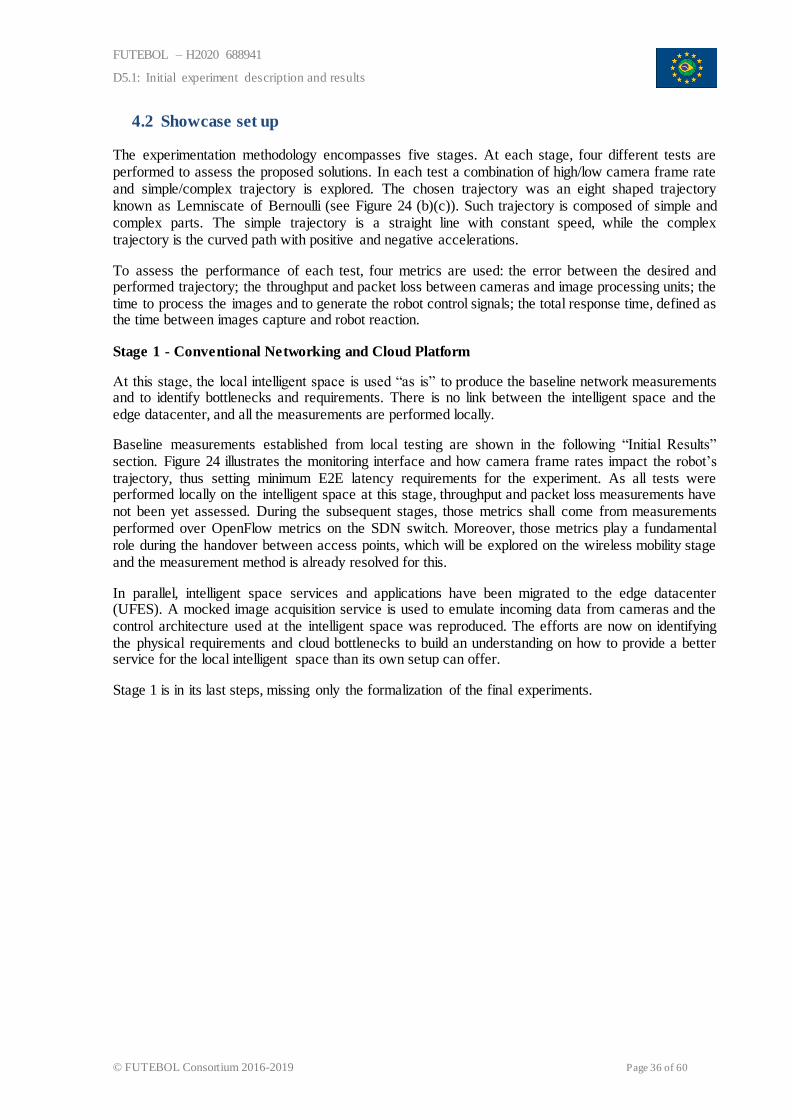
FUTEBOL – H2020 688941
D5.1: Initial experiment description and results
© FUTEBOL Consortium 2016-2019 Page 36 of 60
4.2 Showcase set up
The experimentation methodology encompasses five stages. At each stage, four different tests are performed to assess the proposed solutions. In each test a combination of high/low camera frame rate and simple/complex trajectory is explored. The chosen trajectory was an eight shaped trajectory known as Lemniscate of Bernoulli (see Figure 24 (b)(c)). Such trajectory is composed of simple and complex parts. The simple trajectory is a straight line with constant speed, while the complex trajectory is the curved path with positive and negative accelerations.
To assess the performance of each test, four metrics are used: the error between the desired and performed trajectory; the throughput and packet loss between cameras and image processing units; the time to process the images and to generate the robot control signals; the total response time, defined as the time between images capture and robot reaction.
Stage 1 - Conventional Networking and Cloud Platform
At this stage, the local intelligent space is used “as is” to produce the baseline network measurements and to identify bottlenecks and requirements. There is no link between the intelligent space and the edge datacenter, and all the measurements are performed locally.
Baseline measurements established from local testing are shown in the following “Initial Results” section. Figure 24 illustrates the monitoring interface and how camera frame rates impact the robot’s trajectory, thus setting minimum E2E latency requirements for the experiment. As all tests were performed locally on the intelligent space at this stage, throughput and packet loss measurements have not been yet assessed. During the subsequent stages, those metrics shall come from measurements performed over OpenFlow metrics on the SDN switch. Moreover, those metrics play a fundamental role during the handover between access points, which will be explored on the wireless mobility stage and the measurement method is already resolved for this.
In parallel, intelligent space services and applications have been migrated to the edge datacenter (UFES). A mocked image acquisition service is used to emulate incoming data from cameras and the control architecture used at the intelligent space was reproduced. The efforts are now on identifying the physical requirements and cloud bottlenecks to build an understanding on how to provide a better service for the local intelligent space than its own setup can offer.
Stage 1 is in its last steps, missing only the formalization of the final experiments.
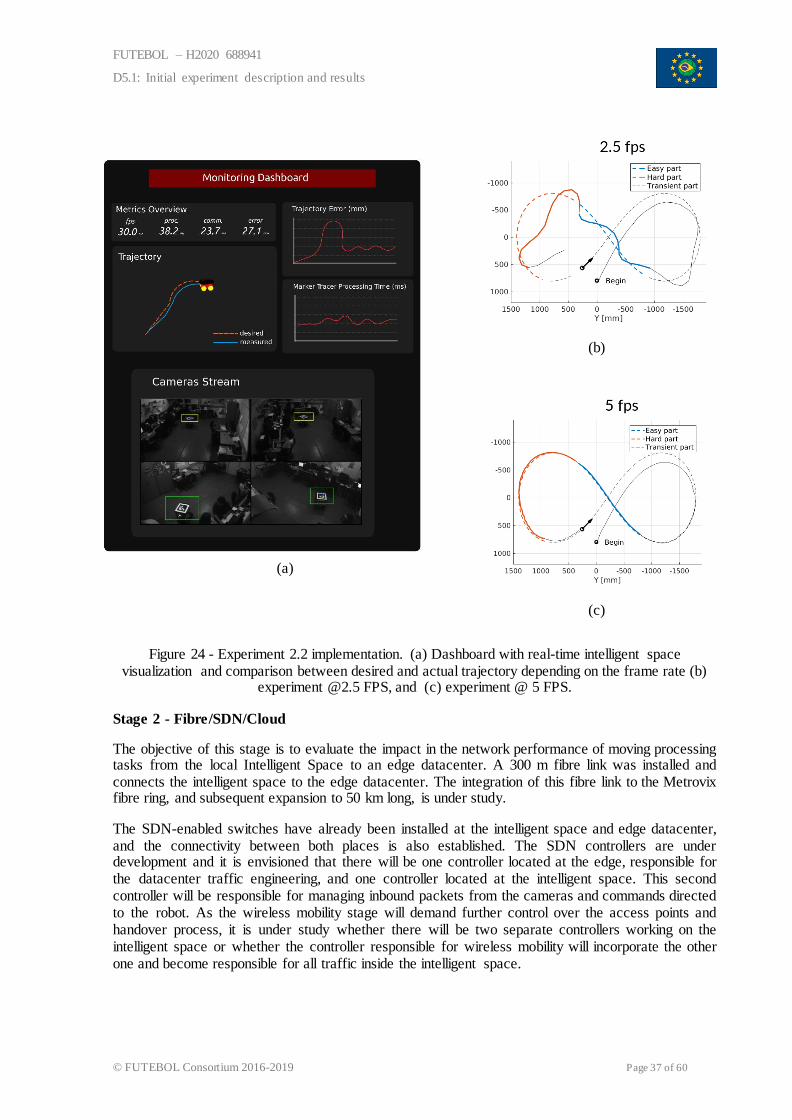
FUTEBOL – H2020 688941
D5.1: Initial experiment description and results
© FUTEBOL Consortium 2016-2019 Page 37 of 60
(a)
(b)
(c)
Figure 24 - Experiment 2.2 implementation. (a) Dashboard with real-time intelligent space visualization and comparison between desired and actual trajectory depending on the frame rate (b)
experiment @2.5 FPS, and (c) experiment @ 5 FPS.
Stage 2 - Fibre/SDN/Cloud
The objective of this stage is to evaluate the impact in the network performance of moving processing tasks from the local Intelligent Space to an edge datacenter. A 300 m fibre link was installed and connects the intelligent space to the edge datacenter. The integration of this fibre link to the Metrovix fibre ring, and subsequent expansion to 50 km long, is under study.
The SDN-enabled switches have already been installed at the intelligent space and edge datacenter, and the connectivity between both places is also established. The SDN controllers are under development and it is envisioned that there will be one controller located at the edge, responsible for the datacenter traffic engineering, and one controller located at the intelligent space. This second controller will be responsible for managing inbound packets from the cameras and commands directed to the robot. As the wireless mobility stage will demand further control over the access points and handover process, it is under study whether there will be two separate controllers working on the intelligent space or whether the controller responsible for wireless mobility will incorporate the other one and become responsible for all traffic inside the intelligent space.
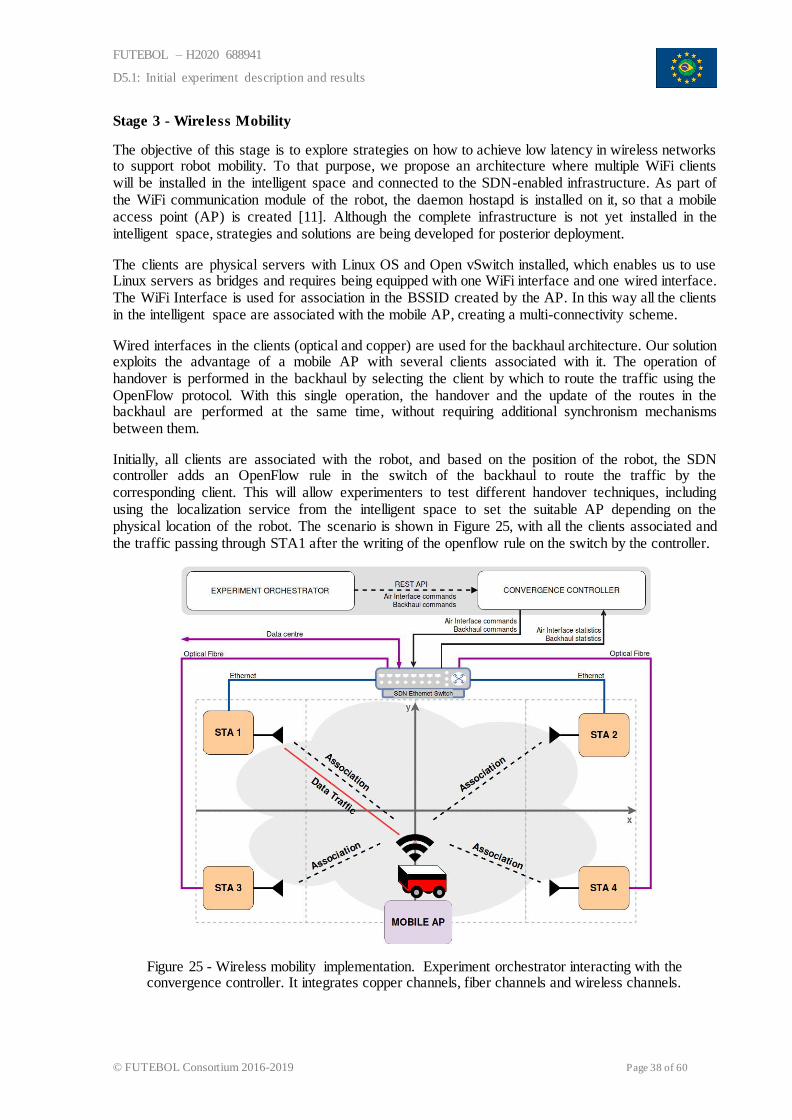
FUTEBOL – H2020 688941
D5.1: Initial experiment description and results
© FUTEBOL Consortium 2016-2019 Page 38 of 60
Stage 3 - Wireless Mobility
The objective of this stage is to explore strategies on how to achieve low latency in wireless networks to support robot mobility. To that purpose, we propose an architecture where multiple WiFi clients will be installed in the intelligent space and connected to the SDN-enabled infrastructure. As part of the WiFi communication module of the robot, the daemon hostapd is installed on it, so that a mobile access point (AP) is created [11]. Although the complete infrastructure is not yet installed in the intelligent space, strategies and solutions are being developed for posterior deployment.
The clients are physical servers with Linux OS and Open vSwitch installed, which enables us to use Linux servers as bridges and requires being equipped with one WiFi interface and one wired interface. The WiFi Interface is used for association in the BSSID created by the AP. In this way all the clients in the intelligent space are associated with the mobile AP, creating a multi-connectivity scheme.
Wired interfaces in the clients (optical and copper) are used for the backhaul architecture. Our solution exploits the advantage of a mobile AP with several clients associated with it. The operation of handover is performed in the backhaul by selecting the client by which to route the traffic using the OpenFlow protocol. With this single operation, the handover and the update of the routes in the backhaul are performed at the same time, without requiring additional synchronism mechanisms between them.
Initially, all clients are associated with the robot, and based on the position of the robot, the SDN controller adds an OpenFlow rule in the switch of the backhaul to route the traffic by the corresponding client. This will allow experimenters to test different handover techniques, including using the localization service from the intelligent space to set the suitable AP depending on the physical location of the robot. The scenario is shown in Figure 25, with all the clients associated and the traffic passing through STA1 after the writing of the openflow rule on the switch by the controller.
Figure 25 - Wireless mobility implementation. Experiment orchestrator interacting with the convergence controller. It integrates copper channels, fiber channels and wireless channels.
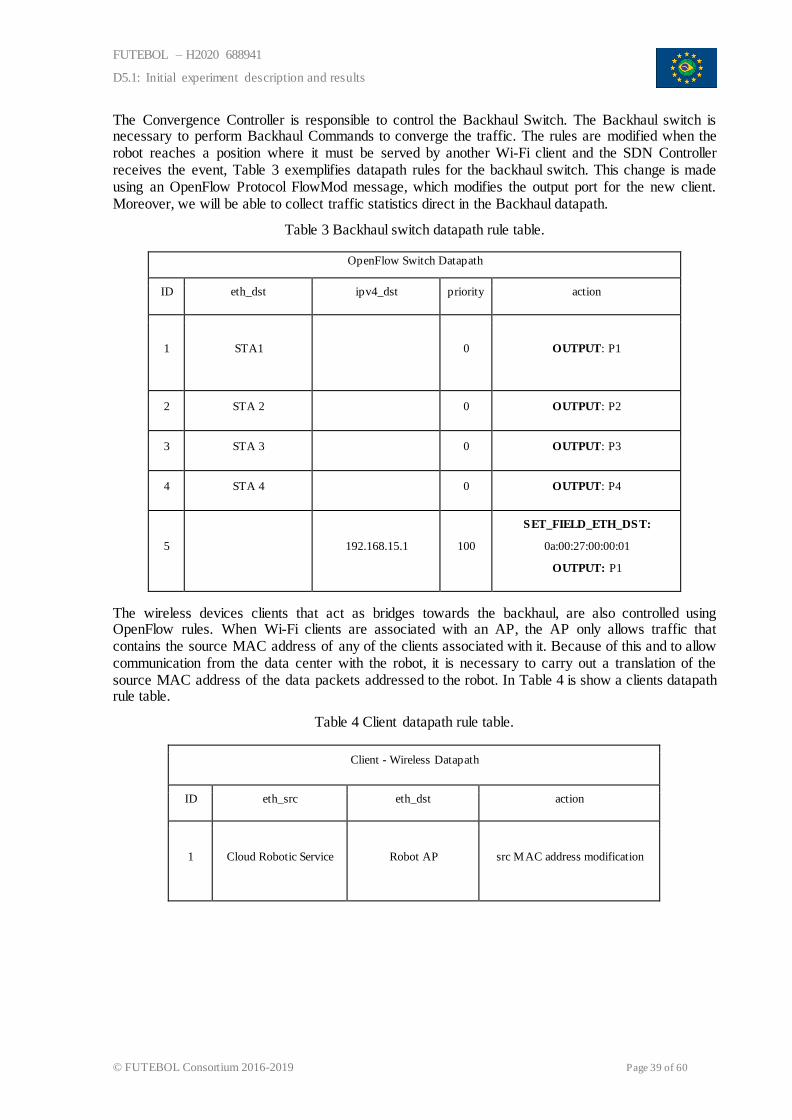
FUTEBOL – H2020 688941
D5.1: Initial experiment description and results
© FUTEBOL Consortium 2016-2019 Page 39 of 60
The Convergence Controller is responsible to control the Backhaul Switch. The Backhaul switch is necessary to perform Backhaul Commands to converge the traffic. The rules are modified when the robot reaches a position where it must be served by another Wi-Fi client and the SDN Controller receives the event, Table 3 exemplifies datapath rules for the backhaul switch. This change is made using an OpenFlow Protocol FlowMod message, which modifies the output port for the new client. Moreover, we will be able to collect traffic statistics direct in the Backhaul datapath.
Table 3 Backhaul switch datapath rule table.
OpenFlow Switch Datapath
ID eth_dst ipv4_dst priority action
1 STA1 0 OUTPUT: P1
2 STA 2 0 OUTPUT: P2
3 STA 3 0 OUTPUT: P3
4 STA 4 0 OUTPUT: P4
5 192.168.15.1 100
SET_FIELD_ETH_DST:
0a:00:27:00:00:01
OUTPUT: P1
The wireless devices clients that act as bridges towards the backhaul, are also controlled using OpenFlow rules. When Wi-Fi clients are associated with an AP, the AP only allows traffic that contains the source MAC address of any of the clients associated with it. Because of this and to allow communication from the data center with the robot, it is necessary to carry out a translation of the source MAC address of the data packets addressed to the robot. In Table 4 is show a clients datapath rule table.
Table 4 Client datapath rule table.
Client - Wireless Datapath
ID eth_src eth_dst action
1 Cloud Robotic Service Robot AP src MAC address modification
FUTEBOL – H2020 688941
D5.1: Initial experiment description and results
© FUTEBOL Consortium 2016-2019 Page 40 of 60
4.3 Control framework application
UFES developed the O2CMF tool, which is part of the FUTEBOL Control Framework. It supports the federation and orchestration of cloud computing resources. In Y3, we plan to extend O2CMF to support the federation and orchestration of SDN resources.
OpenStack was chosen as the cloud operating system, because it has extensive support by the open source cloud community, and a strong ecosystem of companies that rely on it to run their business. Users can manage the OpenStack cloud through a web-based dashboard, command-line tools, APIs, a SDK, or via RESTful web services. While cloud computing resources are managed by OpenStack, the other resources in UFES testbed (e.g., SDN switches and APs) will be managed by an SDN Controller.
The user will request the provisioning of three main blocks of resources at UFES testbed, being VM and LAN connectivity, the intelligent space itself, and SDN switches. The experiment starts with a provisioning phase using jFed tool, which communicates with the UFES testbed using the O2CMF interfaces.
After the provisioning phase, the experimenter will control its resources to perform the experiment by interacting with an experiment Orchestrator that performs actions, such as: to set wireless AP parameters (e.g., power and channel); to set camera parameters (e.g., fps and resolution); to control the handover based on the robot location; to retrieve monitoring and measurement information from the resources; and to perform horizontal scaling of VNF components.
4.4 Initial results
During the first stage, several tests were performed exploring different camera frame rates over the same trajectory. The baseline metrics already assessed on stage 1, preliminary measurements of mean trajectory errors, of the time to process the images and to generate the robot control signals (processing time), and total response time are shown in Table 5. As it can be seen, there are clear indicators of the need for high camera frame rate in order to guarantee that the trajectory error is kept low. However, the system “as is” cannot stand higher frame rates without clogging the network and processing units since there is no efficient integrated traffic engineering and orchestration tool in this conventional scenario.
Table 5 Preliminary result: trajectory error and processing time.
Camera
frame rate
Mean simple trajectory
error (mm)
Mean complex
trajectory error (mm) Metric Mean (ms)
2.5 103.5419 321.1945
Processing time 34.9
Total response time 48.61
10 19.3572 69.1819
Processing time 31.4
Total response time 42.1
As for the efforts on stage 2, connectivity between the intelligent space and the edge datacenter has been established. This stage also makes use of stage 1 efforts, and all the services and applications previously running on the intelligent space have migrated to the edge datacenter. As for the measurements inside the datacenter, a configuration setup was implemented on OpenStack Devstack (Pike) to perform the measurements of the desired metrics. The modules that are being used are
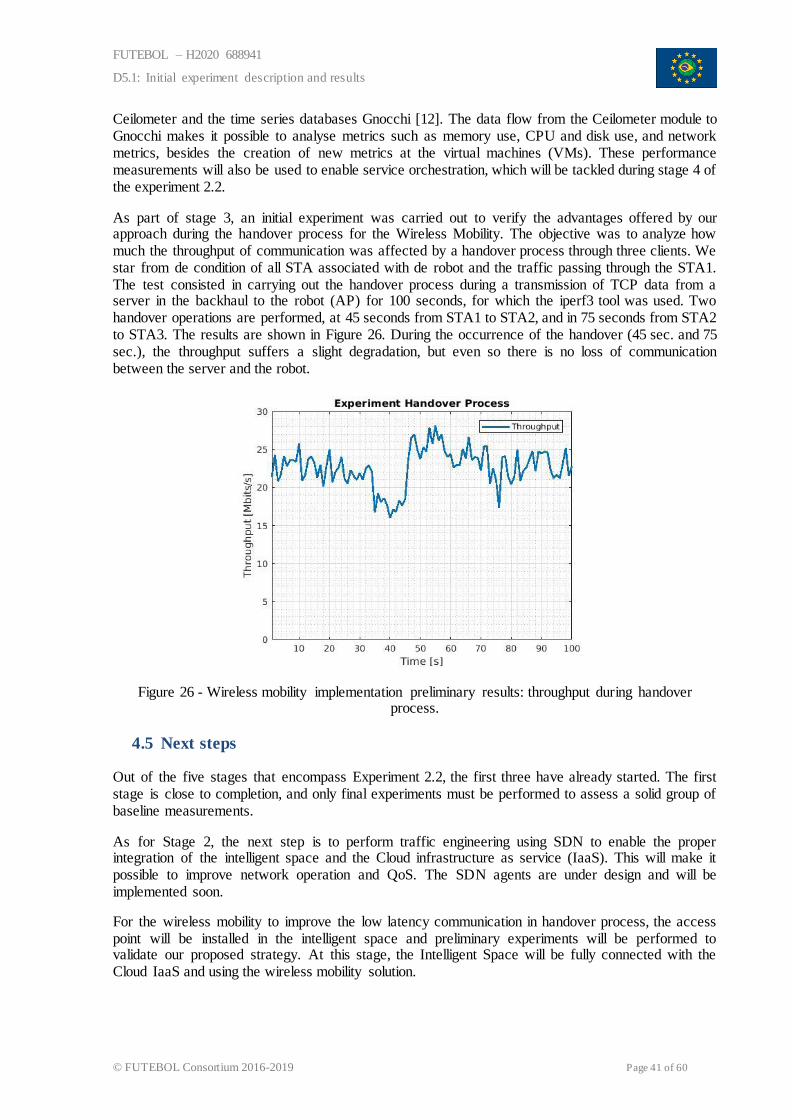
FUTEBOL – H2020 688941
D5.1: Initial experiment description and results
© FUTEBOL Consortium 2016-2019 Page 41 of 60
Ceilometer and the time series databases Gnocchi [12]. The data flow from the Ceilometer module to Gnocchi makes it possible to analyse metrics such as memory use, CPU and disk use, and network metrics, besides the creation of new metrics at the virtual machines (VMs). These performance measurements will also be used to enable service orchestration, which will be tackled during stage 4 of the experiment 2.2.
As part of stage 3, an initial experiment was carried out to verify the advantages offered by our approach during the handover process for the Wireless Mobility. The objective was to analyze how much the throughput of communication was affected by a handover process through three clients. We star from de condition of all STA associated with de robot and the traffic passing through the STA1. The test consisted in carrying out the handover process during a transmission of TCP data from a server in the backhaul to the robot (AP) for 100 seconds, for which the iperf3 tool was used. Two handover operations are performed, at 45 seconds from STA1 to STA2, and in 75 seconds from STA2 to STA3. The results are shown in Figure 26. During the occurrence of the handover (45 sec. and 75 sec.), the throughput suffers a slight degradation, but even so there is no loss of communication between the server and the robot.
Figure 26 - Wireless mobility implementation preliminary results: throughput during handover process.
4.5 Next steps
Out of the five stages that encompass Experiment 2.2, the first three have already started. The first stage is close to completion, and only final experiments must be performed to assess a solid group of baseline measurements.
As for Stage 2, the next step is to perform traffic engineering using SDN to enable the proper integration of the intelligent space and the Cloud infrastructure as service (IaaS). This will make it possible to improve network operation and QoS. The SDN agents are under design and will be implemented soon.
For the wireless mobility to improve the low latency communication in handover process, the access point will be installed in the intelligent space and preliminary experiments will be performed to validate our proposed strategy. At this stage, the Intelligent Space will be fully connected with the Cloud IaaS and using the wireless mobility solution.
FUTEBOL – H2020 688941
D5.1: Initial experiment description and results
© FUTEBOL Consortium 2016-2019 Page 42 of 60
Stages 4 and 5 will be tackled during the 3rd year of the project, after the end of the Stage 2, following the original schedule. Stage 4 aims to evaluate the impact of service management and orchestration techniques in the overall application performance with the use of NFV and SDN. Stage 5 aims to assess the impact of a broad integration encompassing edge and remote datacenters.
FUTEBOL – H2020 688941
D5.1: Initial experiment description and results
© FUTEBOL Consortium 2016-2019 Page 43 of 60
5 EXPERIMENT 3.1 – ADAPTIVE CLOUD/FOG FOR IOT ACCORDING TO
NETWORK CAPACITY AND SERVICE LATENCY REQUIREMENTS
5.1 Objectives of experiment 3.1
Experiment 3.1 is about enabling the interplay between wireless and optical networks for the Internet of Things (IoT). The main research areas are Fog and Cloud computing, optical/wireless convergence and IoT. In this experiment, we address the needs of an optical-wireless infrastructure to provide ubiquitous IoT communication, involving devices ranging from low complexity sensors and actuators (luminosity and smart light bulbs) to more advanced ones (multimedia sensors and smart glasses).
Integrating the ubiquity of communication in a unified optical/wireless network is a challenge for applications combining information from different types of sources (for example, streaming from multimedia devices versus low burst communication of low complexity sensors). Another challenge lies in real-time IoT applications that are not delay tolerant and are battery constrained. Such applications not able to deal with high latency imposed by network concurrence and lack of exclusivity. The last challenge is how to manage the signaling overhead created by the high number of devices. To handle this type of transaction the network needs to support a truly connectionless mode of operation, where devices can simply wake up and send a short burst of data to closer data centers.
The experiment measures the impact of Fog and Cloud computing, validating their use as part of future network infrastructures for IoT deployments in an optical/wireless environment. Using the Fog/Cloud in Experiment 3.1, we can process the workload of different IoT applications, like smart energy metering, security systems, water toxicity sensors, air pollution detectors, etc. These workloads impact differently the optical and the wireless network domains.
The integration between wireless and optical networks in this experiment comes from the fact that the optical network can be used as an efficient transport mechanism for IoT wireless data to be processed in the Cloud, due to the high capacity and low latency provided by optical transmission technologies. The converged optical/wireless network control is essential to address the requirements of IoT data transmission and analytics and to offer the highest flexibility and reactivity to changing load demands.
Fog enables the reduction of latency for IoT applications and the decreasing of the total data traffic between smart objects and the Cloud transported over optical and wireless medium. Such performance enhancement can be measured regarding capacity and latency gains. Also, the experiment brings of an intelligent mechanism to decide whenever the Fog is required. This arrangement will dynamically allocate the locus of computing (Local, Fog, or Cloud) according to optical/wireless network conditions, tailored to latency-constrained IoT applications.
In short, the main objective of experiment 3.1 is to use the FUTEBOL Federation to set up a flexible optical-wireless network to interconnect smart objects and explore the interplay between Fog and Cloud to enhance the performance of a converged optical wireless network. This optical-wireless integration will create a tradeoff between Fog and Cloud when applied to IoT environments while considering different conditions of optical and wireless links.
5.2 Showcase set up
In the first year of this experiment we have built a smart lighting system in which a person can control the lights through either voice or sign language commands. In particular, the lights can be controlled in three levels: turn on/off, increase/decrease brightness, and change color. This system spans a wireless and an optical network and is divided into two segments. In the first segment, the command (voice or sign language) is captured. At the second segment, which operates across the optical network, is where the captured command is processed. In this case, processing can occur in a gateway, local server, or in
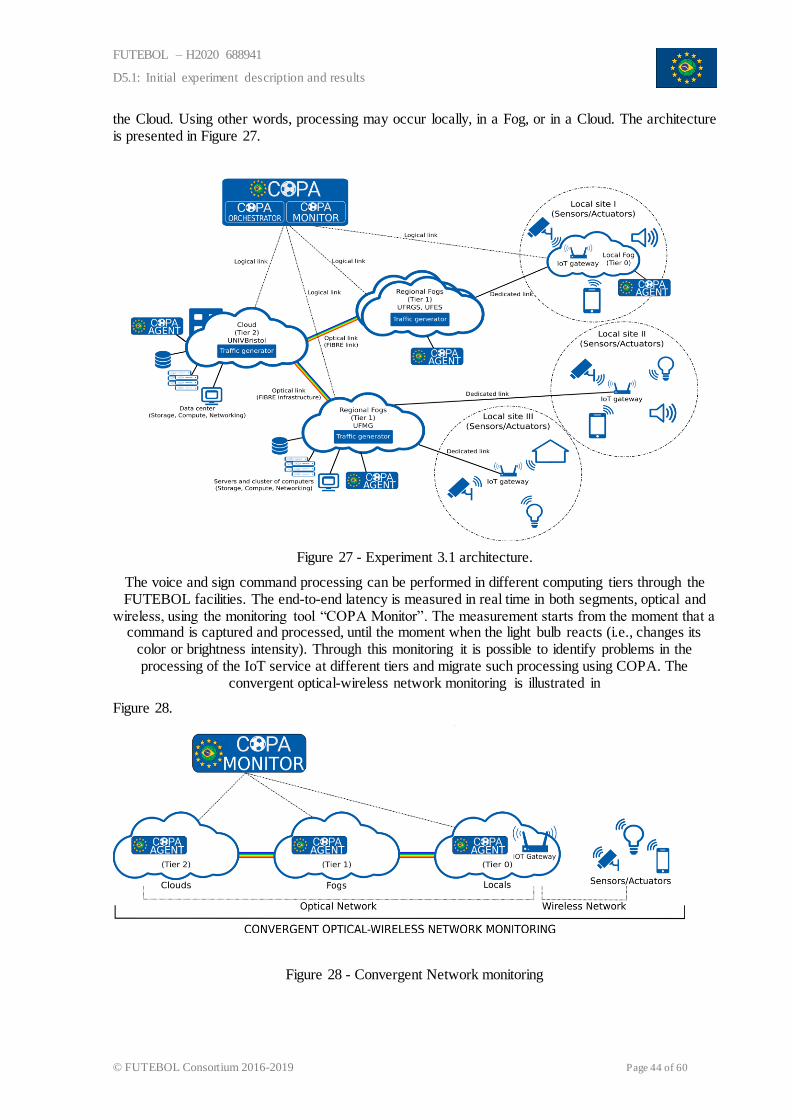
FUTEBOL – H2020 688941
D5.1: Initial experiment description and results
© FUTEBOL Consortium 2016-2019 Page 44 of 60
the Cloud. Using other words, processing may occur locally, in a Fog, or in a Cloud. The architecture is presented in Figure 27.
Figure 27 - Experiment 3.1 architecture.
The voice and sign command processing can be performed in different computing tiers through the FUTEBOL facilities. The end-to-end latency is measured in real time in both segments, optical and
wireless, using the monitoring tool “COPA Monitor”. The measurement starts from the moment that a command is captured and processed, until the moment when the light bulb reacts (i.e., changes its
color or brightness intensity). Through this monitoring it is possible to identify problems in the processing of the IoT service at different tiers and migrate such processing using COPA. The
convergent optical-wireless network monitoring is illustrated in
Figure 28.
Figure 28 - Convergent Network monitoring

FUTEBOL – H2020 688941
D5.1: Initial experiment description and results
© FUTEBOL Consortium 2016-2019 Page 45 of 60
COPA is our newest proposal for the experiment, which linked the monitoring data to orchestration algorithms. COPA is a tool of the FUTEBOL control framework capable of monitoring the network and migrating the processing to the most appropriate location, all through an accessible interface.
Figure 29 shows a sequence diagram illustrating the processing of a command given to the smart bulb. It runs in three tiers: tier 0 (Local), tier 1 (Fog) and tier 2 (Cloud). Each tier has a Virtual Machine (VM), created using the Cloud Based Testbed Manager (CBTM), in which the container service is available. In tier 0, we have the IoT application that is implemented using Raspberry Pi 3 and a set of smart light bulbs and their controller. In this tier an Access Point (Gateway) is located to connect the Raspberry Pis to the network. Tier 1 contains a Virtual Machine (VMServer), a data center that has the capability to process video/sound on demand to send the results to both Smart Objects (i.e. voice sensor and smart bulb) and the Cloud. Tier 2 represents the cloud, that is linked to the optical infrastructure where VMs at UNIVBRIS process the voice or sign language commands.
Figure 29 - Experiment 3.1 implemented scenario
This system evaluates, by means of different computing tiers, the performance of the IoT application in terms of latency in system response to either voice or sign language commands. Note that, in the future, our system can be connected to other IoT devices in smart homes/buildings. This type of application would make everyday life easier, especially for people with disabilities. At the moment, we run the demonstration system in a wireless network research laboratory to explore IoT applications in a controlled environment.
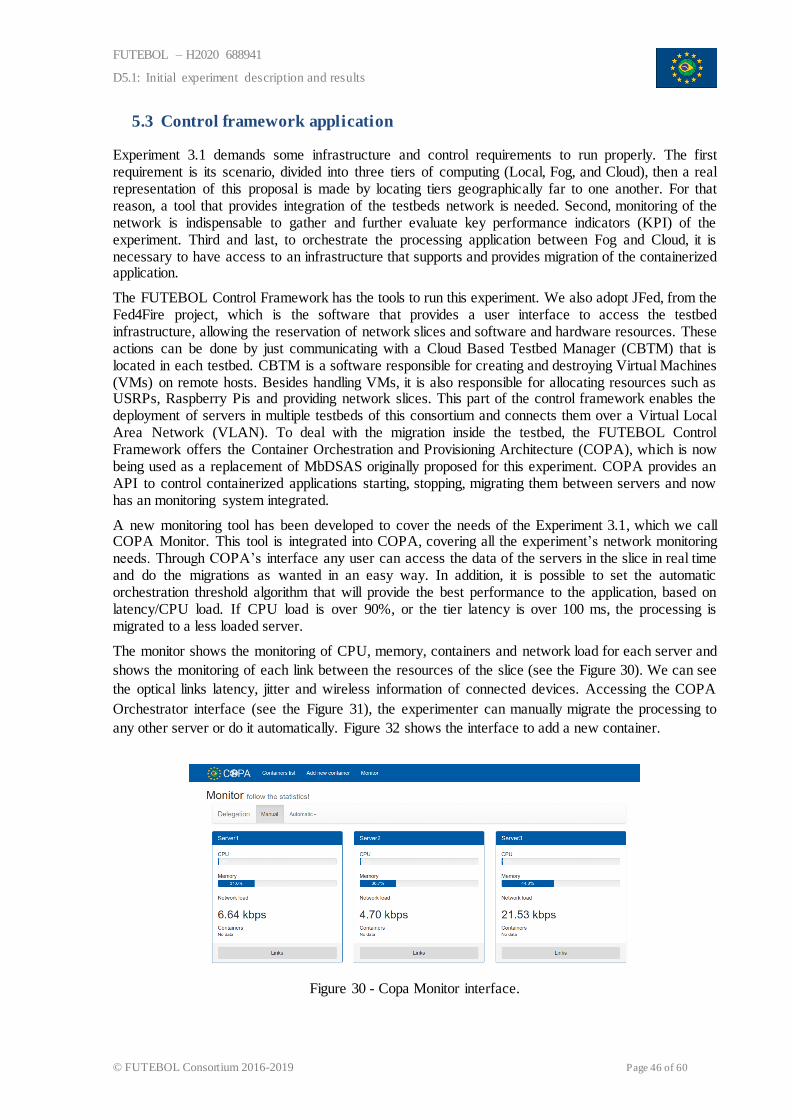
FUTEBOL – H2020 688941
D5.1: Initial experiment description and results
© FUTEBOL Consortium 2016-2019 Page 46 of 60
5.3 Control framework application
Experiment 3.1 demands some infrastructure and control requirements to run properly. The first requirement is its scenario, divided into three tiers of computing (Local, Fog, and Cloud), then a real representation of this proposal is made by locating tiers geographically far to one another. For that reason, a tool that provides integration of the testbeds network is needed. Second, monitoring of the network is indispensable to gather and further evaluate key performance indicators (KPI) of the experiment. Third and last, to orchestrate the processing application between Fog and Cloud, it is necessary to have access to an infrastructure that supports and provides migration of the containerized application.
The FUTEBOL Control Framework has the tools to run this experiment. We also adopt JFed, from the Fed4Fire project, which is the software that provides a user interface to access the testbed infrastructure, allowing the reservation of network slices and software and hardware resources. These actions can be done by just communicating with a Cloud Based Testbed Manager (CBTM) that is located in each testbed. CBTM is a software responsible for creating and destroying Virtual Machines (VMs) on remote hosts. Besides handling VMs, it is also responsible for allocating resources such as USRPs, Raspberry Pis and providing network slices. This part of the control framework enables the deployment of servers in multiple testbeds of this consortium and connects them over a Virtual Local Area Network (VLAN). To deal with the migration inside the testbed, the FUTEBOL Control Framework offers the Container Orchestration and Provisioning Architecture (COPA), which is now being used as a replacement of MbDSAS originally proposed for this experiment. COPA provides an API to control containerized applications starting, stopping, migrating them between servers and now has an monitoring system integrated.
A new monitoring tool has been developed to cover the needs of the Experiment 3.1, which we call COPA Monitor. This tool is integrated into COPA, covering all the experiment’s network monitoring needs. Through COPA’s interface any user can access the data of the servers in the slice in real time and do the migrations as wanted in an easy way. In addition, it is possible to set the automatic orchestration threshold algorithm that will provide the best performance to the application, based on latency/CPU load. If CPU load is over 90%, or the tier latency is over 100 ms, the processing is migrated to a less loaded server.
The monitor shows the monitoring of CPU, memory, containers and network load for each server and
shows the monitoring of each link between the resources of the slice (see the Figure 30). We can see
the optical links latency, jitter and wireless information of connected devices. Accessing the COPA
Orchestrator interface (see the Figure 31), the experimenter can manually migrate the processing to
any other server or do it automatically. Figure 32 shows the interface to add a new container.
Figure 30 - Copa Monitor interface.
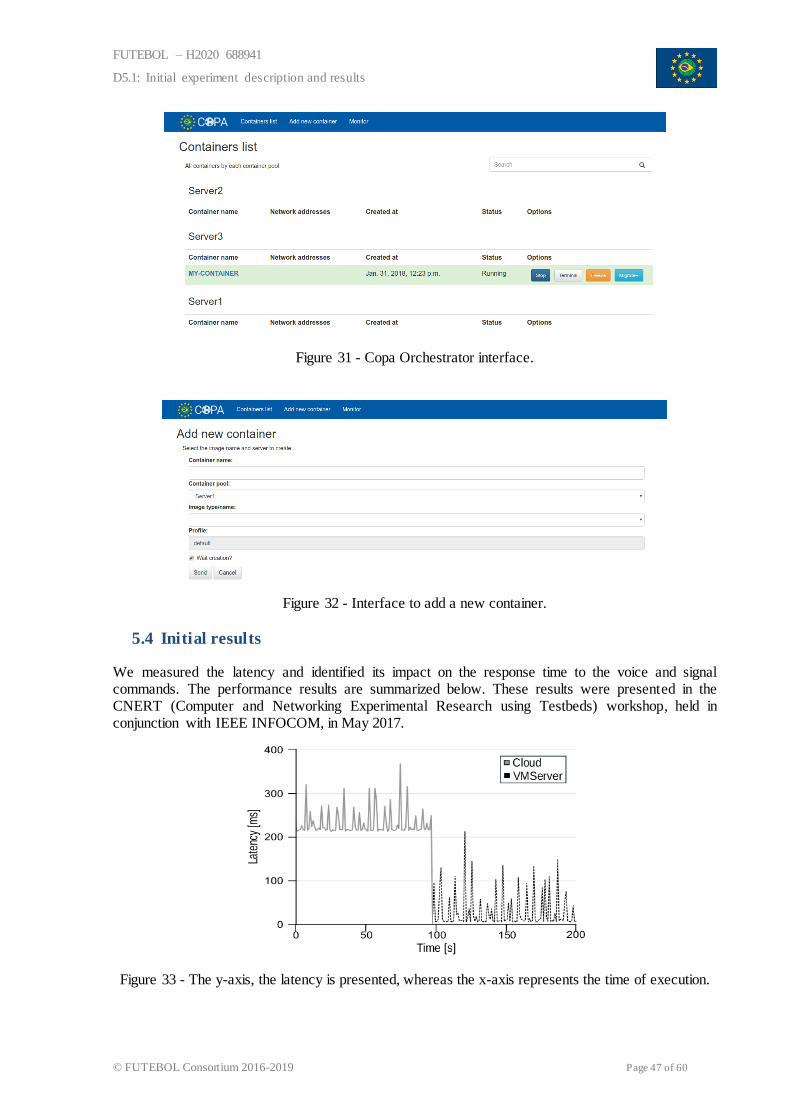
FUTEBOL – H2020 688941
D5.1: Initial experiment description and results
© FUTEBOL Consortium 2016-2019 Page 47 of 60
Figure 31 - Copa Orchestrator interface.
Figure 32 - Interface to add a new container.
5.4 Initial results
We measured the latency and identified its impact on the response time to the voice and signal commands. The performance results are summarized below. These results were presented in the CNERT (Computer and Networking Experimental Research using Testbeds) workshop, held in conjunction with IEEE INFOCOM, in May 2017.
Figure 33 - The y-axis, the latency is presented, whereas the x-axis represents the time of execution.
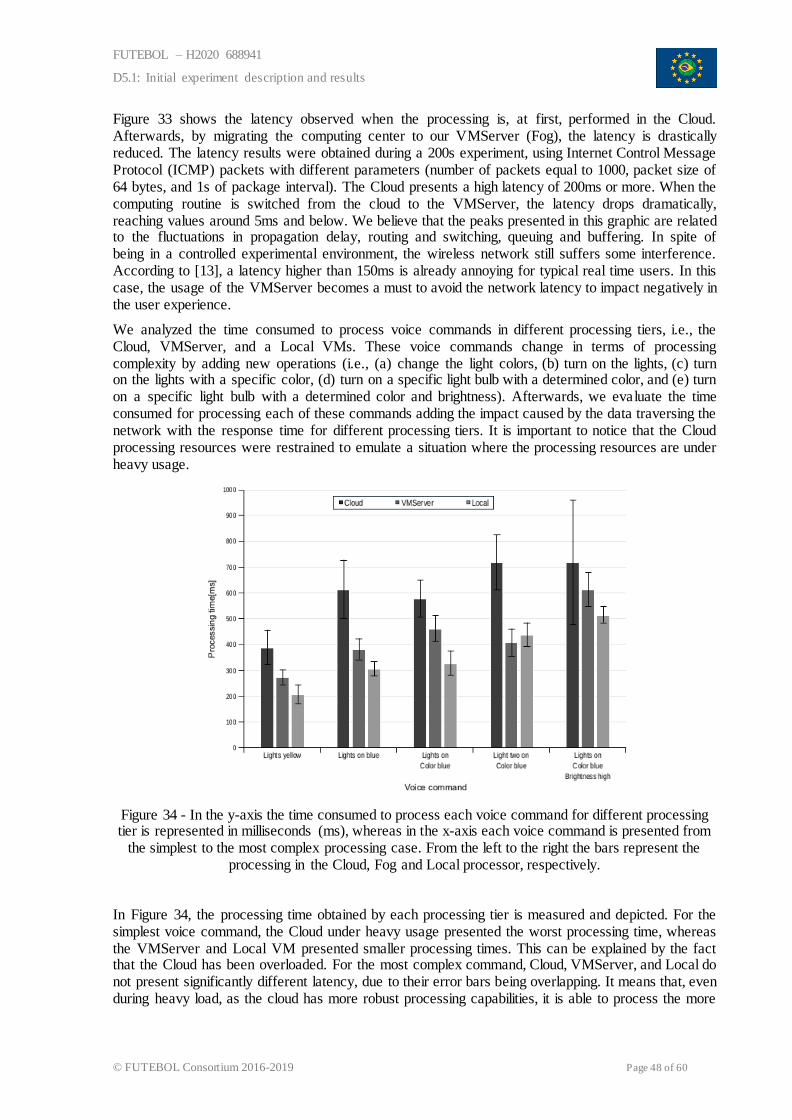
FUTEBOL – H2020 688941
D5.1: Initial experiment description and results
© FUTEBOL Consortium 2016-2019 Page 48 of 60
Figure 33 shows the latency observed when the processing is, at first, performed in the Cloud. Afterwards, by migrating the computing center to our VMServer (Fog), the latency is drastically reduced. The latency results were obtained during a 200s experiment, using Internet Control Message Protocol (ICMP) packets with different parameters (number of packets equal to 1000, packet size of 64 bytes, and 1s of package interval). The Cloud presents a high latency of 200ms or more. When the computing routine is switched from the cloud to the VMServer, the latency drops dramatically, reaching values around 5ms and below. We believe that the peaks presented in this graphic are related to the fluctuations in propagation delay, routing and switching, queuing and buffering. In spite of being in a controlled experimental environment, the wireless network still suffers some interference. According to [13], a latency higher than 150ms is already annoying for typical real time users. In this case, the usage of the VMServer becomes a must to avoid the network latency to impact negatively in the user experience.
We analyzed the time consumed to process voice commands in different processing tiers, i.e., the Cloud, VMServer, and a Local VMs. These voice commands change in terms of processing complexity by adding new operations (i.e., (a) change the light colors, (b) turn on the lights, (c) turn on the lights with a specific color, (d) turn on a specific light bulb with a determined color, and (e) turn on a specific light bulb with a determined color and brightness). Afterwards, we evaluate the time consumed for processing each of these commands adding the impact caused by the data traversing the network with the response time for different processing tiers. It is important to notice that the Cloud processing resources were restrained to emulate a situation where the processing resources are under heavy usage.
Figure 34 - In the y-axis the time consumed to process each voice command for different processing tier is represented in milliseconds (ms), whereas in the x-axis each voice command is presented from
the simplest to the most complex processing case. From the left to the right the bars represent the processing in the Cloud, Fog and Local processor, respectively.
In Figure 34, the processing time obtained by each processing tier is measured and depicted. For the simplest voice command, the Cloud under heavy usage presented the worst processing time, whereas the VMServer and Local VM presented smaller processing times. This can be explained by the fact that the Cloud has been overloaded. For the most complex command, Cloud, VMServer, and Local do not present significantly different latency, due to their error bars being overlapping. It means that, even during heavy load, as the cloud has more robust processing capabilities, it is able to process the more
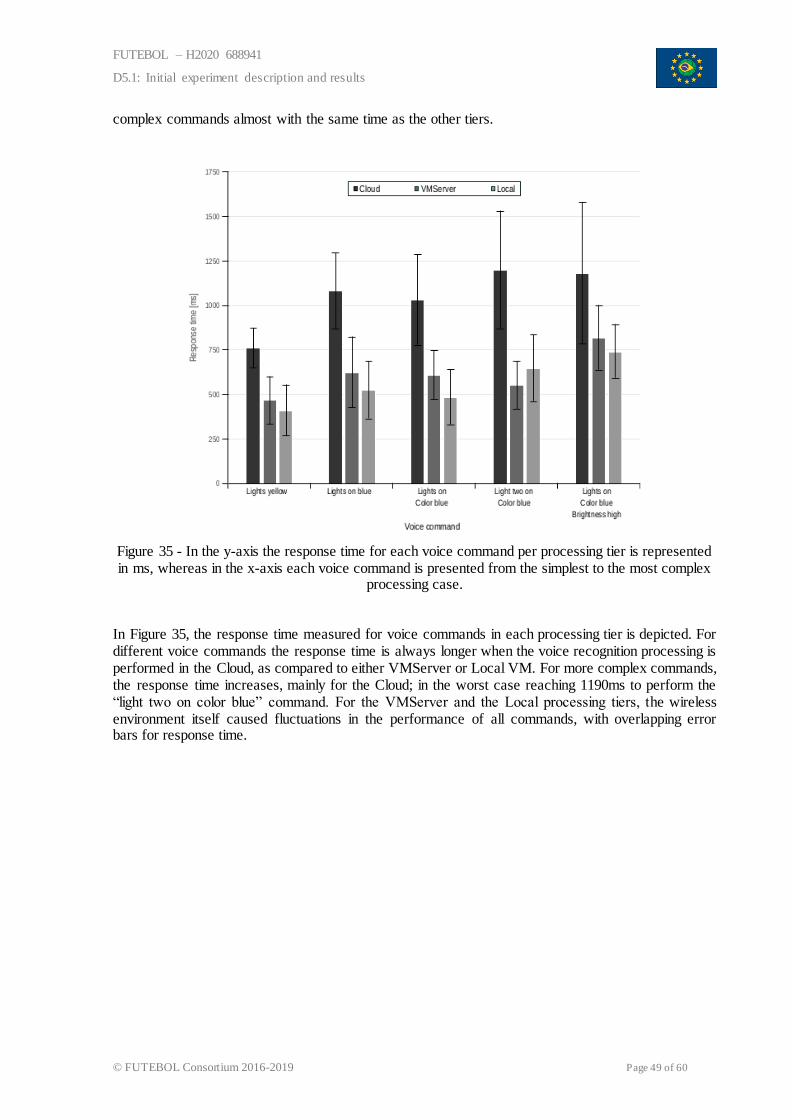
FUTEBOL – H2020 688941
D5.1: Initial experiment description and results
© FUTEBOL Consortium 2016-2019 Page 49 of 60
complex commands almost with the same time as the other tiers.
Figure 35 - In the y-axis the response time for each voice command per processing tier is represented in ms, whereas in the x-axis each voice command is presented from the simplest to the most complex
processing case.
In Figure 35, the response time measured for voice commands in each processing tier is depicted. For different voice commands the response time is always longer when the voice recognition processing is performed in the Cloud, as compared to either VMServer or Local VM. For more complex commands, the response time increases, mainly for the Cloud; in the worst case reaching 1190ms to perform the “light two on color blue” command. For the VMServer and the Local processing tiers, the wireless environment itself caused fluctuations in the performance of all commands, with overlapping error bars for response time.
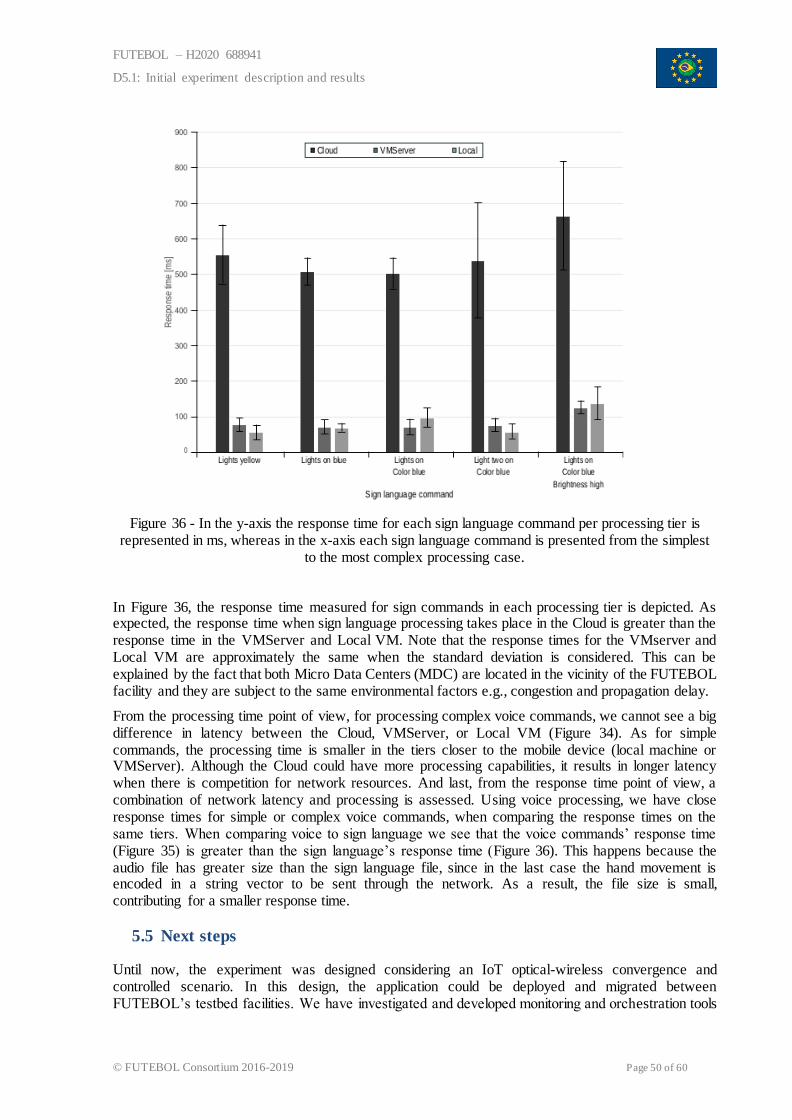
FUTEBOL – H2020 688941
D5.1: Initial experiment description and results
© FUTEBOL Consortium 2016-2019 Page 50 of 60
Figure 36 - In the y-axis the response time for each sign language command per processing tier is represented in ms, whereas in the x-axis each sign language command is presented from the simplest
to the most complex processing case.
In Figure 36, the response time measured for sign commands in each processing tier is depicted. As expected, the response time when sign language processing takes place in the Cloud is greater than the response time in the VMServer and Local VM. Note that the response times for the VMserver and Local VM are approximately the same when the standard deviation is considered. This can be explained by the fact that both Micro Data Centers (MDC) are located in the vicinity of the FUTEBOL facility and they are subject to the same environmental factors e.g., congestion and propagation delay.
From the processing time point of view, for processing complex voice commands, we cannot see a big difference in latency between the Cloud, VMServer, or Local VM (Figure 34). As for simple commands, the processing time is smaller in the tiers closer to the mobile device (local machine or VMServer). Although the Cloud could have more processing capabilities, it results in longer latency when there is competition for network resources. And last, from the response time point of view, a combination of network latency and processing is assessed. Using voice processing, we have close response times for simple or complex voice commands, when comparing the response times on the same tiers. When comparing voice to sign language we see that the voice commands’ response time (Figure 35) is greater than the sign language’s response time (Figure 36). This happens because the audio file has greater size than the sign language file, since in the last case the hand movement is encoded in a string vector to be sent through the network. As a result, the file size is small, contributing for a smaller response time.
5.5 Next steps
Until now, the experiment was designed considering an IoT optical-wireless convergence and controlled scenario. In this design, the application could be deployed and migrated between FUTEBOL’s testbed facilities. We have investigated and developed monitoring and orchestration tools
FUTEBOL – H2020 688941
D5.1: Initial experiment description and results
© FUTEBOL Consortium 2016-2019 Page 51 of 60
for an application service based on latency and processing time metrics. We also collected new metrics to use as KPIs: jitter and throughput. The user can manually or automatically delegate the processing application to any of the locus of computing available through a friendly user interface. Doing it, the experimenter can evaluate the deployment of computer routine in different tiers. That research brought great results that were shown in the previous sections, but it is not enough to evaluate a real-world scenario.
The addition of network traffic congestion is very important for the best representation of this scenario. When an IoT device connects to the network provider, multiple other devices are disputing the network resources with it. So the study of how the Experiment 3.1 can cover this is already occurring. Simulating network traffic concurrence patterns would be good to determine what is the best classes of IoT devices that could utilize the network link together. This could be done by using tools like Iperf, which is a network bandwidth measuring tool. This software can create network traffic congestion and affect the QoS of the current connections.
Given the new changes of the experiment scenario, the automation of the management solution needs to be updated, so the IoT application service could have the best performance. Besides that, we need to determine what type of decision making algorithm is best to be used, e.g., artificial neural networks or fuzzy logic. Thus, we need to decide what QoS metrics are relevant for an IoT device. Another metric that must be considered is the burden caused in the network by the migration of the computation routine. If the size of the containerized application is too large, the network capacity that will be required to migrate this processing will be enormous. So the change of the processing location would not be relevant only for the application owner, but to all the services connected to this network.
After this, the deployment in the testbeds and validation throughout the consortium of this experiment will be done. So the assessment of some eventual bugs can be performed and the evaluation of the future results can be made.
Regarding publication plans, we have started to write a journal paper counting on a contribution from Intel. The title is “Supporting Real-Time IoT applications Using Container Migration in Fog Environments”, and the objective is to evaluate the inherent gains of the processing center repositioning near the edge of the network and what were the lessons learned during the experiment development, mainly about the functional convergence between wireless and optical networks.
FUTEBOL – H2020 688941
D5.1: Initial experiment description and results
© FUTEBOL Consortium 2016-2019 Page 52 of 60
6 EXPERIMENT 3.2 – RADIO-OVER-FIBER FOR IOT ENVIRONMENT
MONITORING
6.1 Objectives of experiment 3.2
Radio-over-Fiber (RoF) technology has emerged as an important candidate for wireless access networks, due to some advantages such as high transmission capacity and immunity to electromagnetic interference. It enables the processing of several radio frequency (RF) signals into a centralized entity. Consequently, it reduces the complexity of the access nodes, allowing the installation of simple antennas since the entire intelligence and control will be moved to a central entity, for instance in the cloud. Therefore, it can reduce the cost in the deployment of access network using cheaper antennas, and it can provide low overhead as well as scalability and transparency.
RoF systems consist of heterogeneous networks composed of wireless and optical links. Unlike traditional optical communications networks, in which a baseband signal is transmitted into the optical fibers, in RoF one or multiple analog carriers are transported into the fibers.
The RoF link lies within the physical layer of the wireless system to be supported, and thus, it becomes an extension of the radio access domain. This enables the possibility to dynamically allocate radio resources, optimizing the spectrum utilization.
Motivated by the advantages provided by the RoF technology and the ubiquity enabled by the Internet of Things (IoT), this experiment aims to develop an efficient RoF environmental monitoring system at the University of Campinas (UNICAMP) to monitor the environment in the university using an optical infrastructure already deployed with underused resources and dark fibers. Moreover, this experiment will deploy equipment at UFRGS to offer a configurable, distributed RoF testbed.
This experiment focuses on the set up of a robust and flexible environmental monitoring at UNICAMP, using several heterogeneous IoT wireless sensors devices over an optical infrastructure already deployed. The main objectives of the experiment includes:
● Efficient data reporting – IoT devices are responsible to gather and measure environment-related data as well as send them to a central entity for further processing and analyzing. To do so, a multi-hop protocol must be employed due to the short-range communication present in these devices.
● Suitable modulation and generation process – RoF is responsible for modulating RF signals into the optical fibre as well as demodulate the signals received through the fibre to RF signals. Such process can be analogue (RoF) or digitized (D-RoF), in which analogue RF signals are converted to digital serial bit stream before transmission over optical fiber link. Therefore, we will compare the performance of RoF and D-RoF process describing the advantages and drawbacks of each process to employ a suitable one and avoid introducing an undesired latency, which can potentially degrade system performance.
● Real-time remote reconfiguration – the IoT devices will gather and measure different environment-related data, but not all IoT devices have to report the same data and these measures do not need to be reported at the same time, i.e., different devices can measure different environment-related data and each measure can be reported with a different periodicity. Furthermore, some applications and experimenter do not have interest in a specific measure, and consequently can avoid such report. In this way, to enable an easy reconfiguration to each application and experiment according to specific needs, a real-time remote configuration mechanism will be deployed.
● Data analysis – measurements reported by each IoT device, according to each profile, are stored in a database to be further analysed. In this way, each profile will be capable to access its specific measurement reports to be visualized in real-time. Moreover, historical data can be provided as well filters can be applied to improve the data analysis.
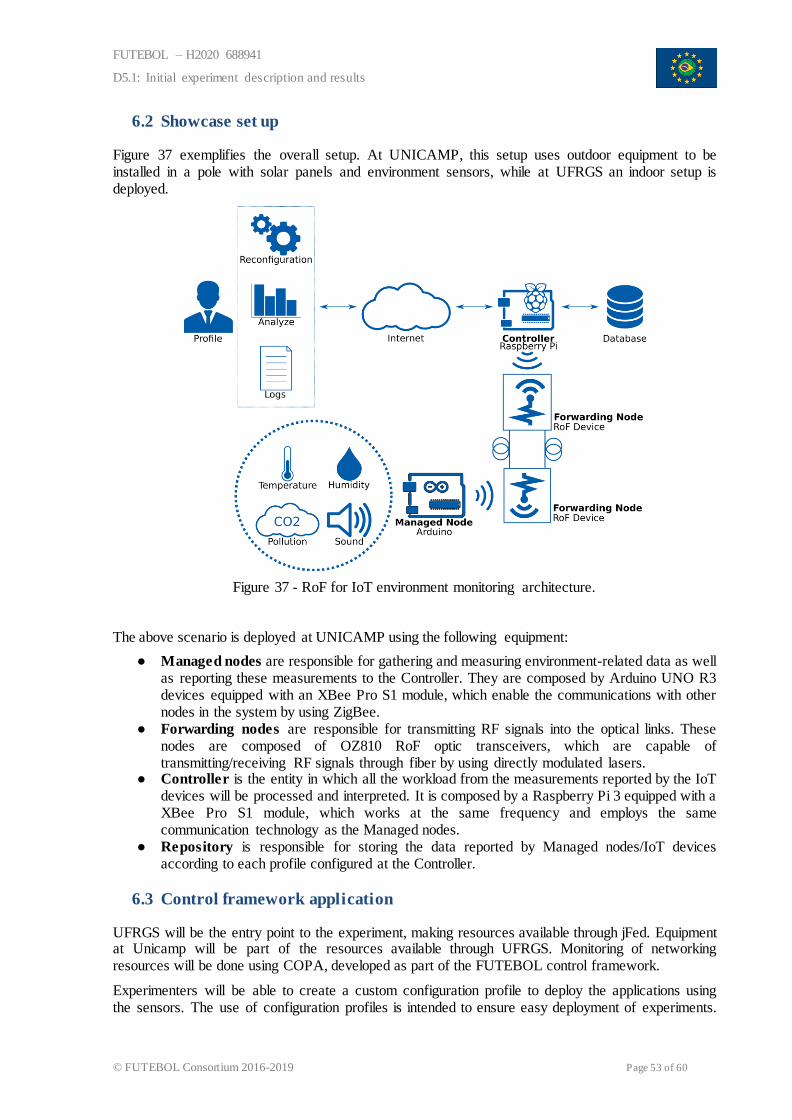
FUTEBOL – H2020 688941
D5.1: Initial experiment description and results
© FUTEBOL Consortium 2016-2019 Page 53 of 60
6.2 Showcase set up
Figure 37 exemplifies the overall setup. At UNICAMP, this setup uses outdoor equipment to be installed in a pole with solar panels and environment sensors, while at UFRGS an indoor setup is deployed.
Figure 37 - RoF for IoT environment monitoring architecture.
The above scenario is deployed at UNICAMP using the following equipment:
● Managed nodes are responsible for gathering and measuring environment-related data as well as reporting these measurements to the Controller. They are composed by Arduino UNO R3 devices equipped with an XBee Pro S1 module, which enable the communications with other nodes in the system by using ZigBee.
● Forwarding nodes are responsible for transmitting RF signals into the optical links. These nodes are composed of OZ810 RoF optic transceivers, which are capable of transmitting/receiving RF signals through fiber by using directly modulated lasers.
● Controller is the entity in which all the workload from the measurements reported by the IoT devices will be processed and interpreted. It is composed by a Raspberry Pi 3 equipped with a XBee Pro S1 module, which works at the same frequency and employs the same communication technology as the Managed nodes.
● Repository is responsible for storing the data reported by Managed nodes/IoT devices according to each profile configured at the Controller.
6.3 Control framework application
UFRGS will be the entry point to the experiment, making resources available through jFed. Equipment at Unicamp will be part of the resources available through UFRGS. Monitoring of networking resources will be done using COPA, developed as part of the FUTEBOL control framework.
Experimenters will be able to create a custom configuration profile to deploy the applications using the sensors. The use of configuration profiles is intended to ensure easy deployment of experiments.
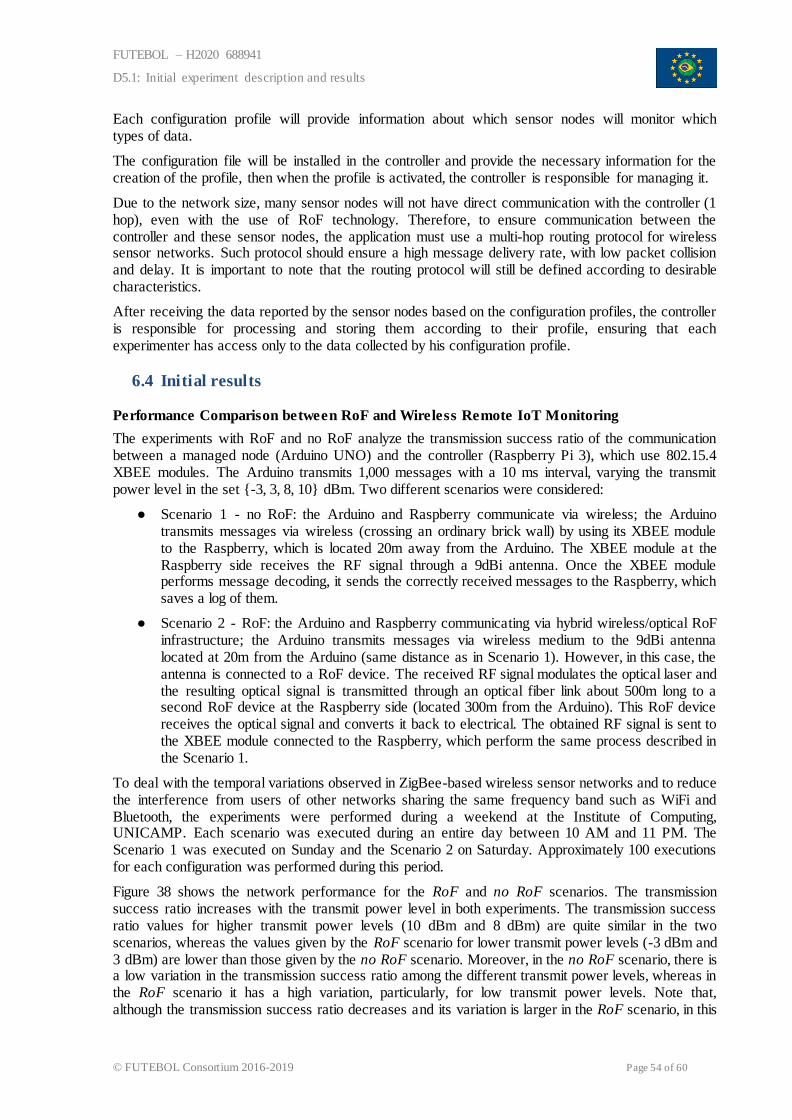
FUTEBOL – H2020 688941
D5.1: Initial experiment description and results
© FUTEBOL Consortium 2016-2019 Page 54 of 60
Each configuration profile will provide information about which sensor nodes will monitor which types of data.
The configuration file will be installed in the controller and provide the necessary information for the creation of the profile, then when the profile is activated, the controller is responsible for managing it.
Due to the network size, many sensor nodes will not have direct communication with the controller (1 hop), even with the use of RoF technology. Therefore, to ensure communication between the controller and these sensor nodes, the application must use a multi-hop routing protocol for wireless sensor networks. Such protocol should ensure a high message delivery rate, with low packet collision and delay. It is important to note that the routing protocol will still be defined according to desirable characteristics.
After receiving the data reported by the sensor nodes based on the configuration profiles, the controller is responsible for processing and storing them according to their profile, ensuring that each experimenter has access only to the data collected by his configuration profile.
6.4 Initial results
Performance Comparison between RoF and Wireless Remote IoT Monitoring
The experiments with RoF and no RoF analyze the transmission success ratio of the communication between a managed node (Arduino UNO) and the controller (Raspberry Pi 3), which use 802.15.4 XBEE modules. The Arduino transmits 1,000 messages with a 10 ms interval, varying the transmit power level in the set {-3, 3, 8, 10} dBm. Two different scenarios were considered:
● Scenario 1 - no RoF: the Arduino and Raspberry communicate via wireless; the Arduino transmits messages via wireless (crossing an ordinary brick wall) by using its XBEE module to the Raspberry, which is located 20m away from the Arduino. The XBEE module at the Raspberry side receives the RF signal through a 9dBi antenna. Once the XBEE module performs message decoding, it sends the correctly received messages to the Raspberry, which saves a log of them.
● Scenario 2 - RoF: the Arduino and Raspberry communicating via hybrid wireless/optical RoF infrastructure; the Arduino transmits messages via wireless medium to the 9dBi antenna located at 20m from the Arduino (same distance as in Scenario 1). However, in this case, the antenna is connected to a RoF device. The received RF signal modulates the optical laser and the resulting optical signal is transmitted through an optical fiber link about 500m long to a second RoF device at the Raspberry side (located 300m from the Arduino). This RoF device receives the optical signal and converts it back to electrical. The obtained RF signal is sent to the XBEE module connected to the Raspberry, which perform the same process described in the Scenario 1.
To deal with the temporal variations observed in ZigBee-based wireless sensor networks and to reduce the interference from users of other networks sharing the same frequency band such as WiFi and Bluetooth, the experiments were performed during a weekend at the Institute of Computing, UNICAMP. Each scenario was executed during an entire day between 10 AM and 11 PM. The Scenario 1 was executed on Sunday and the Scenario 2 on Saturday. Approximately 100 executions for each configuration was performed during this period.
Figure 38 shows the network performance for the RoF and no RoF scenarios. The transmission success ratio increases with the transmit power level in both experiments. The transmission success ratio values for higher transmit power levels (10 dBm and 8 dBm) are quite similar in the two scenarios, whereas the values given by the RoF scenario for lower transmit power levels (-3 dBm and 3 dBm) are lower than those given by the no RoF scenario. Moreover, in the no RoF scenario, there is a low variation in the transmission success ratio among the different transmit power levels, whereas in the RoF scenario it has a high variation, particularly, for low transmit power levels. Note that, although the transmission success ratio decreases and its variation is larger in the RoF scenario, in this
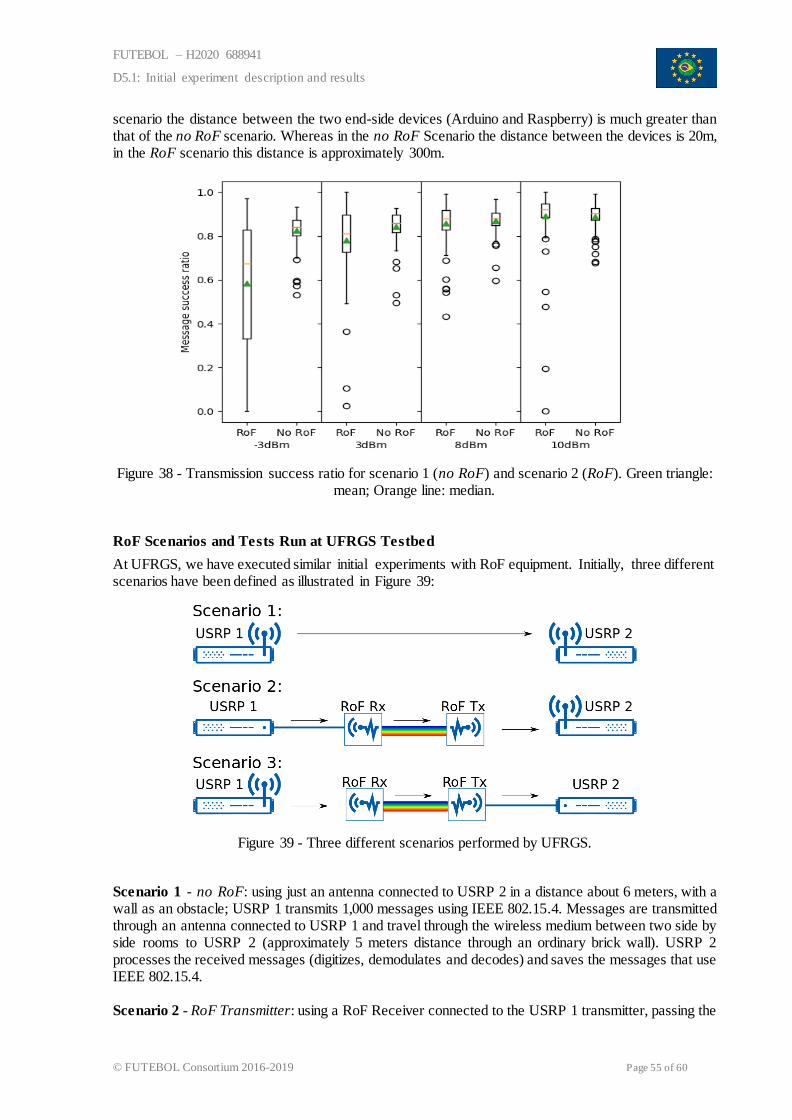
FUTEBOL – H2020 688941
D5.1: Initial experiment description and results
© FUTEBOL Consortium 2016-2019 Page 55 of 60
scenario the distance between the two end-side devices (Arduino and Raspberry) is much greater than that of the no RoF scenario. Whereas in the no RoF Scenario the distance between the devices is 20m, in the RoF scenario this distance is approximately 300m.
Figure 38 - Transmission success ratio for scenario 1 (no RoF) and scenario 2 (RoF). Green triangle: mean; Orange line: median.
RoF Scenarios and Tests Run at UFRGS Testbed
At UFRGS, we have executed similar initial experiments with RoF equipment. Initially, three different scenarios have been defined as illustrated in Figure 39:
Figure 39 - Three different scenarios performed by UFRGS.
Scenario 1 - no RoF: using just an antenna connected to USRP 2 in a distance about 6 meters, with a wall as an obstacle; USRP 1 transmits 1,000 messages using IEEE 802.15.4. Messages are transmitted through an antenna connected to USRP 1 and travel through the wireless medium between two side by side rooms to USRP 2 (approximately 5 meters distance through an ordinary brick wall). USRP 2 processes the received messages (digitizes, demodulates and decodes) and saves the messages that use IEEE 802.15.4. Scenario 2 - RoF Transmitter: using a RoF Receiver connected to the USRP 1 transmitter, passing the
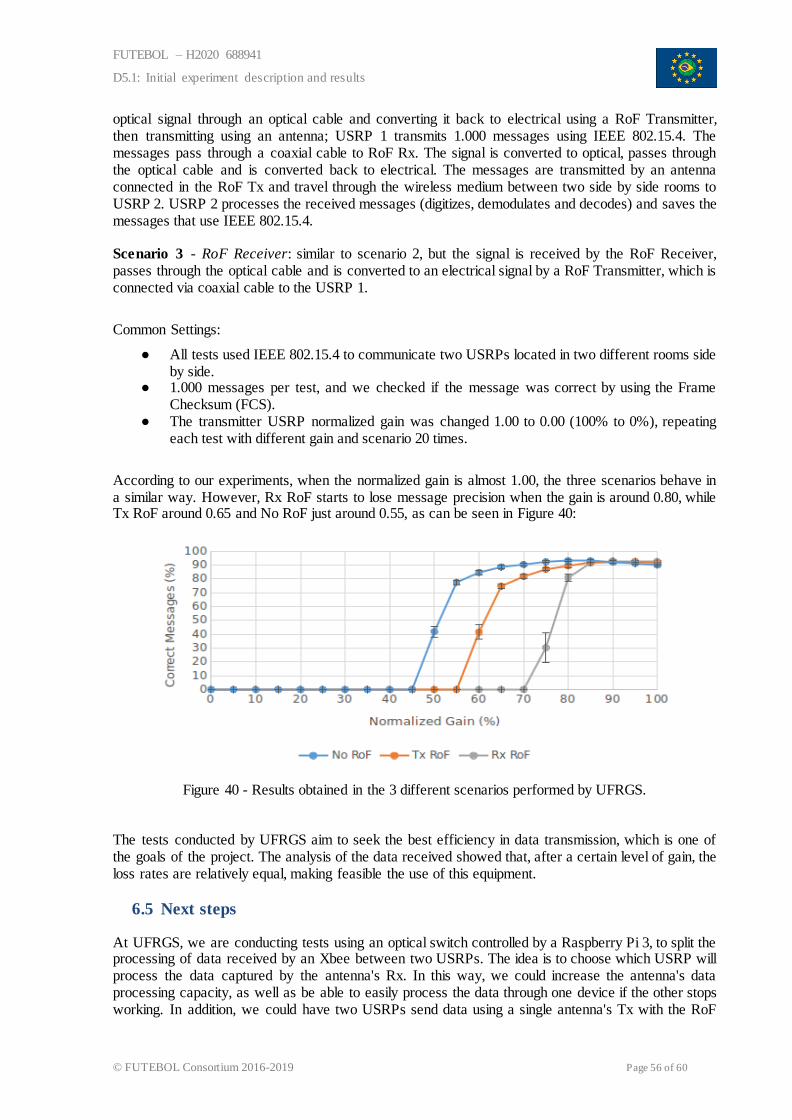
FUTEBOL – H2020 688941
D5.1: Initial experiment description and results
© FUTEBOL Consortium 2016-2019 Page 56 of 60
optical signal through an optical cable and converting it back to electrical using a RoF Transmitter, then transmitting using an antenna; USRP 1 transmits 1.000 messages using IEEE 802.15.4. The messages pass through a coaxial cable to RoF Rx. The signal is converted to optical, passes through the optical cable and is converted back to electrical. The messages are transmitted by an antenna connected in the RoF Tx and travel through the wireless medium between two side by side rooms to USRP 2. USRP 2 processes the received messages (digitizes, demodulates and decodes) and saves the messages that use IEEE 802.15.4. Scenario 3 - RoF Receiver: similar to scenario 2, but the signal is received by the RoF Receiver, passes through the optical cable and is converted to an electrical signal by a RoF Transmitter, which is connected via coaxial cable to the USRP 1.
Common Settings:
● All tests used IEEE 802.15.4 to communicate two USRPs located in two different rooms side by side.
● 1.000 messages per test, and we checked if the message was correct by using the Frame Checksum (FCS).
● The transmitter USRP normalized gain was changed 1.00 to 0.00 (100% to 0%), repeating each test with different gain and scenario 20 times.
According to our experiments, when the normalized gain is almost 1.00, the three scenarios behave in a similar way. However, Rx RoF starts to lose message precision when the gain is around 0.80, while Tx RoF around 0.65 and No RoF just around 0.55, as can be seen in Figure 40:
Figure 40 - Results obtained in the 3 different scenarios performed by UFRGS.
The tests conducted by UFRGS aim to seek the best efficiency in data transmission, which is one of the goals of the project. The analysis of the data received showed that, after a certain level of gain, the loss rates are relatively equal, making feasible the use of this equipment.
6.5 Next steps
At UFRGS, we are conducting tests using an optical switch controlled by a Raspberry Pi 3, to split the processing of data received by an Xbee between two USRPs. The idea is to choose which USRP will process the data captured by the antenna's Rx. In this way, we could increase the antenna's data processing capacity, as well as be able to easily process the data through one device if the other stops working. In addition, we could have two USRPs send data using a single antenna's Tx with the RoF
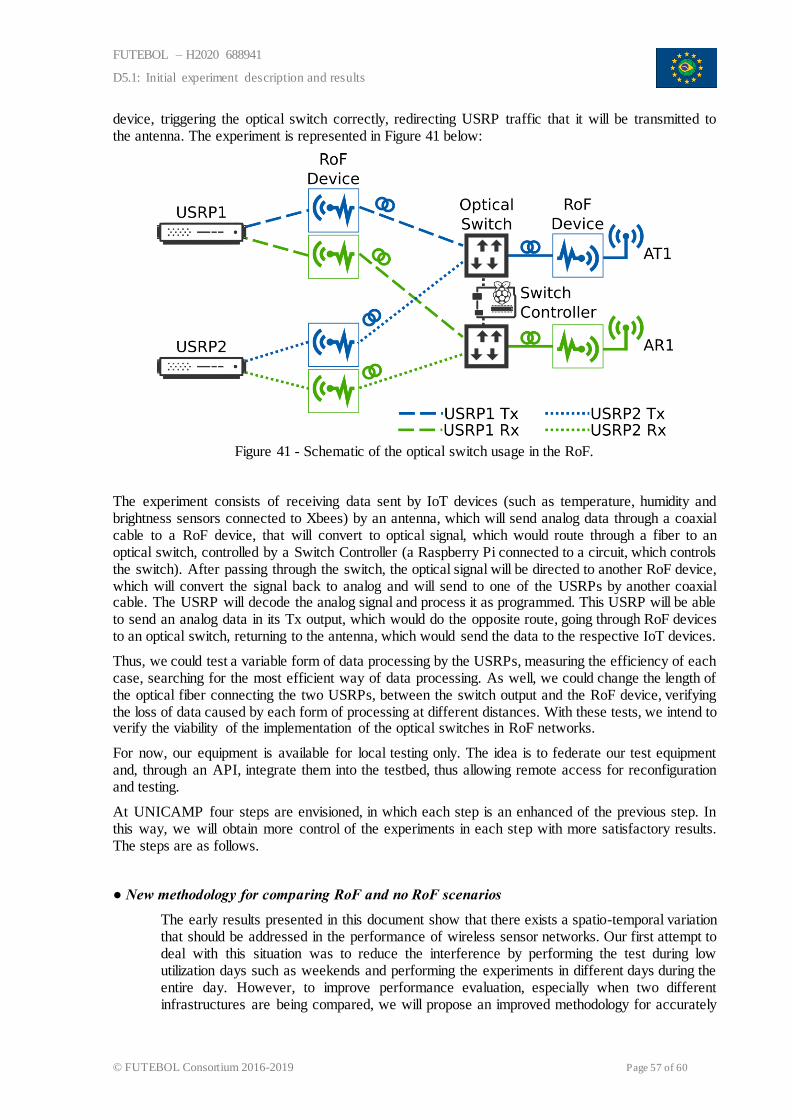
FUTEBOL – H2020 688941
D5.1: Initial experiment description and results
© FUTEBOL Consortium 2016-2019 Page 57 of 60
device, triggering the optical switch correctly, redirecting USRP traffic that it will be transmitted to the antenna. The experiment is represented in Figure 41 below:
Figure 41 - Schematic of the optical switch usage in the RoF.
The experiment consists of receiving data sent by IoT devices (such as temperature, humidity and brightness sensors connected to Xbees) by an antenna, which will send analog data through a coaxial cable to a RoF device, that will convert to optical signal, which would route through a fiber to an optical switch, controlled by a Switch Controller (a Raspberry Pi connected to a circuit, which controls the switch). After passing through the switch, the optical signal will be directed to another RoF device, which will convert the signal back to analog and will send to one of the USRPs by another coaxial cable. The USRP will decode the analog signal and process it as programmed. This USRP will be able to send an analog data in its Tx output, which would do the opposite route, going through RoF devices to an optical switch, returning to the antenna, which would send the data to the respective IoT devices.
Thus, we could test a variable form of data processing by the USRPs, measuring the efficiency of each case, searching for the most efficient way of data processing. As well, we could change the length of the optical fiber connecting the two USRPs, between the switch output and the RoF device, verifying the loss of data caused by each form of processing at different distances. With these tests, we intend to verify the viability of the implementation of the optical switches in RoF networks.
For now, our equipment is available for local testing only. The idea is to federate our test equipment and, through an API, integrate them into the testbed, thus allowing remote access for reconfiguration and testing.
At UNICAMP four steps are envisioned, in which each step is an enhanced of the previous step. In this way, we will obtain more control of the experiments in each step with more satisfactory results. The steps are as follows.
● New methodology for comparing RoF and no RoF scenarios
The early results presented in this document show that there exists a spatio-temporal variation that should be addressed in the performance of wireless sensor networks. Our first attempt to deal with this situation was to reduce the interference by performing the test during low utilization days such as weekends and performing the experiments in different days during the entire day. However, to improve performance evaluation, especially when two different infrastructures are being compared, we will propose an improved methodology for accurately
FUTEBOL – H2020 688941
D5.1: Initial experiment description and results
© FUTEBOL Consortium 2016-2019 Page 58 of 60
comparing RoF and no RoF scenarios.
● Single-hop scenario with more devices creating a small IoT infrastructure
We plan to deploy several nodes (about 20 nodes) in the UNICAMP campus to test scalability of the infrastructure. The traffic rate, packet size, and transmit power will be varied.
● Multi-hop scenario using RoF as access interface
This scenario will use the same number of node as the previous single-hop scenario. However, the nodes will be deployed in the UNICAMP campus in a larger area to assess multi-hop routing protocols.
● Various routing algorithms: the performance of different routing protocols will be assessed under a large scenario with multi-hop only and with RoF scenarios. Protocols such as Information Fusion-based Role Assignment (InFRA) and Data Aggregation Aware Routing Protocol (DAARP) will be studied.
● Test and analyze the impact of RoF on IoT communications: comparison of the scenarios with RoF and without RoF using metrics such as total energy consumption, transmission packets delay and total coverage area. This will provide a multi-hop communication vs RoF-based scenario to cover large areas.
● Node Reconfiguration
This test focuses on checking if other experimenters and/or IoT applications have been capable of accessing the platform and reconfiguring according to their needs. In order to do this, we need to verify whether a experimenter can create a specific profile to select which environment-related data each Managed node will gather and measure as well as configure the periodicity report of each measurement. In addition, to ensure the reconfiguration, the Controller needs to receive a confirmation message of each Managed node that will be reconfigured. However, in case of not receiving a confirmation message from a specific Managed node, the reconfiguration message needs to be re-sent to that node to be reconfigured. It is important to notice that the configuration of each profile can be accessed and reconfigured on-the-fly by each experimenter. Furthermore, an interface will be implemented to provide real-time access to the data reporting and to enable to analyze it as well as analyze the history of data reporting of each profile. Furthermore, to provide a suitable real-time reconfiguration the platform performance needs to be analyzed.
The following metrics will be evaluated in these experiments:
● Average successful packet reception ratio: average ratio of the number of packets successfully received divided by the total number of packets sent;
● Average packet delay: average time spent to the packets arrive in the controller; ● Coverage area: maximum distance between the device and the controller to the transmission
to be performed with a single-hop; ● Energy Efficiency: energy consumed by the devices divided by the number of successful
packets that arrived in the controller; ● Total number of reconfiguration messages: number of reconfiguration messages generated
by the Controller to reconfigure the overall platform according to profile changes or upon creating a new profile;
● Reconfiguration delay: time spent to reconfigure the overall platform, i.e. the time to reconfiguration messages reach the Forwarding nodes jointly with the RoF/D-RoF process and the time to the reconfiguration messages reach all specified Managed nodes. It is important to notice that in this delay is also add the time spent to re-sent reconfiguration messages to nodes that did not confirm the receipt.
FUTEBOL – H2020 688941
D5.1: Initial experiment description and results
© FUTEBOL Consortium 2016-2019 Page 59 of 60
7 CONCLUSIONS
This deliverable provided a comprehensive report on the initial results of five experiments of the FUTEBOL project. These experiments addressed a number of research challenges in wireless and optical convergent networks, including spectrum sharing in the 3.5 GHz band, network management and real-time robots control using SDN, and monitoring/processing data from IoT devices. Measurements and analysis were carried out to evaluate the performance of the specific experiments and publicly demonstrate the benefits of the FUTEBOL research infrastructure and the FUTEBOL Control Framework in exploring the boundaries of wireless/optical networks. The final results of the FUTEBOL experiments will be reported in deliverable D5.2 – “Additional experiment description and results”.
FUTEBOL – H2020 688941
D5.1: Initial experiment description and results
© FUTEBOL Consortium 2016-2019 Page 60 of 60
8 REFERENCES
[1] M. M. Sohul, Y. Miao, T. Yang and J. H. Reed, “Spectrum access system for the citizen broadband radio service,” IEEE Communications Magazine, vol. 53, pp. 18–25, Jul. 2015.
[2] C. W. Kim, J. Ryoo and M. M. Buddhikot, “Design and implementation of an end-to-end architecture for 3.5 GHz shared spectrum,” in Proc. DySPAN, pp. 23–34, Sep.-Oct. 2015.
[3] Wireless Innovation Forum, “SAS to CBSD protocol technical report- B,” version. V0.5.0, February 2016.
[4] Wireless Innovation Forum, “Interim SAS to CBSD Protocol Technical Report A,” Version 1.0.0, October 2015.
[5] Wireless Innovation Forum, “SAS to User Protocol Technical Specification,” July 2016.
[6] FCC GN Docket No. 12-354, “Amendment of the Commission’s rules with regard to Commercial Operations in the 3550-3650 MHz band,” May 2016.
[7] Wireless Innovation Forum, “CBRS Operational and Functional Requirements,” WINNF-15-S-0112-V1.0.0 Sept 2016.
[8] P. Alvarez, F. Slyne, C. Bluemm, J. Marquez-Barja, L. A. DaSilva, and M. Ruffini, “Experimental Demonstration of SDN-Controlled Variable-Rate Fronthaul for Converged LTE-over-PON”, Optical Networking and Communication Conference (OFC), San Diego, CA, 11-15 March 2018.
[9] C. Bluemm, Y. Zhang, P. Alvarez, M. Ruffini, and L. A. DaSilva, “Dynamic Energy Savings in Cloud-RAN: An Experimental Assessment and Implementation,” IEEE ICC Workshops, Paris, France, 21-25 May 2017.
[10] Zhao, S., Muppala, G., Li, Z., Medhi, D. Smooth Streaming with MPEG-DASH using SDN-Based Application-Aware Networking. 2018 International Conference on Computing, Networking and Communication (ICNC).
[11] M. Gowda, A. Dhekne, R. R. Choudhury, "The Case for Robotic Wireless Networks," Proceedings of the 25th World Wide Web Conference, Montreal, 2016, pp. 1317-1327.
[12] OpenStack, “Gnocchi - OpenStack” 2018. [Online]. Available: https://wiki.openstack.org/wiki/Gnocchi
[13] Satyanarayanan, Mahadev, Paramvir Bahl, Ramón Caceres, and Nigel Davies. "The case for vm-based cloudlets in mobile computing." IEEE pervasive Computing 8, no. 4 (2009).
[14] Marko Palola, Marko Hoyhtya, Pekka Aho, “Field trial of the 3.5 GHz citizens broadband radio service governed by a spectrum access system (SAS)”, 2017 IEEE International Symposium on Dynamic Spectrum Access Networks (DySPAN).