d5.3-eventvideo test sequences, ground-truth and ...p)-eventvide…d5.3v1 eventvideo test sequences,...
TRANSCRIPT

TEC2011-25995 EventVideo (2012-2014)
Strategies for Object Segmentation, Detection and Tracking in Complex
Environments for Event Detection in Video Surveillance and Monitoring
D5.3v1
EVENTVIDEO TEST SEQUENCES, GROUND-
TRUTH AND EVALUATION METHODOLOGY
Video Processing and Understanding Lab
Escuela Politécnica Superior
Universidad Autónoma de Madrid
Supported by

D5.3v1 .EventVideo test sequences, ground-truth and evaluation methodology
AUTHOR LIST
Álvaro García Martin
José M. Martínez
Juan C. SanMiguel [email protected]
CHANGE LOG
Version Date Editor Description
0.0 18/06/2012 Juan C. SanMiguel Initial version
0.1 22/06/2012 Álvaro García Martín Video object segmentation and
People modeling and detection
(datasets and evaluation
methodology with ground-truth)
0.2 25/06/2012 Juan C. SanMiguel Evaluation methodology without
ground-truth
Final revision
1.0 28/06/2012 José M. Martínez Version 1

D5.3v1 EventVideo test sequences, ground-truth and evaluation methodology 1
CONTENTS:
1. INTRODUCTION .................................................................................................. 3
1.1. MOTIVATION ..................................................................................................... 3 1.2. DOCUMENT STRUCTURE .................................................................................... 3
2. EVALUATION SCENARIOS ............................................................................... 5
2.1. SELECTED ANALYSIS STAGES ............................................................................. 5 2.2. SCENARIO CLASSIFICATION ............................................................................... 6
3. EVALUATION MATERIAL ................................................................................ 9
3.1. VIDEO OBJECT SEGMENTATION .......................................................................... 9 3.1.1. Chroma Video Segmentation Ground-truth – CVSG ............................... 9
3.2. PEOPLE MODELLING AND DETECTION .............................................................. 14 3.2.1. Person Detection dataset - PDds ........................................................... 14
3.3. VIDEO OBJECT TRACKING ................................................................................ 17
3.3.1. Single Object Video Tracking dataset- SOVTds ..................................... 17 3.4. EVENT DETECTION ........................................................................................... 20
3.4.1. Abandoned and Stolen Object Discrimination dataset - ASODds ......... 20
3.4.2. Event Detection dataset – EDds ............................................................. 21
4. EVALUATION METHODOLOGY ................................................................... 23
4.1. BASED ON GROUND-TRUTH DATA .................................................................... 23 4.1.1. Video object segmentation ...................................................................... 23
4.1.2. People modeling and detection............................................................... 25 4.1.3. Video object tracking .............................................................................. 27
4.1.4. Event detection ....................................................................................... 27 4.2. NOT BASED ON GROUND-TRUTH DATA ............................................................. 28
4.2.1. Video object segmentation ...................................................................... 29
4.2.2. Video object tracking .............................................................................. 30
5. CONCLUSIONS ................................................................................................... 33
6. REFERENCES ........................................................................................................ I
APPENDIX ................................................................................................................... III
7. ADDITIONAL DATASETS FOR EVALUATION .......................................... III
7.1. VIDEO OBJECT SEGMENTATION ......................................................................... III 7.1.1. VSSN2006 ................................................................................................ iii 7.1.2. IPPR06 .................................................................................................... iii
7.1.3. Change Detection 2012 ............................................................................ iv 7.1.4. SABS .......................................................................................................... v
7.2. PEOPLE MODELLING AND DETECTION ................................................................ V 7.2.1. TUD-Pedestrians ....................................................................................... v 7.2.2. DCII .......................................................................................................... vi 7.2.3. Caltech Pedestrian Dataset .................................................................... vii
7.2.4. ETHZ ..................................................................................................... viii
7.3. VIDEO OBJECT TRACKING ............................................................................... VIII 7.3.1. SPEVI .................................................................................................... viii

D5.3v1 EventVideo test sequences, ground-truth and evaluation methodology 2
7.3.2. ETISEO ..................................................................................................... ix 7.3.3. PETS .......................................................................................................... x 7.3.4. CAVIAR ................................................................................................. xiii 7.3.5. VISOR ..................................................................................................... xiv
7.3.6. iLids ......................................................................................................... xv 7.3.7. Clemson dataset ...................................................................................... xvi 7.3.8. MIT Traffic Dataset ................................................................................ xvi
7.4. EVENT DETECTION ......................................................................................... XVII 7.4.1. PETS 2006 ............................................................................................. xvii
7.4.2. PETS 2007 ............................................................................................. xvii 7.4.3. AVSS 2007 ............................................................................................. xvii
7.4.4. CVSG .................................................................................................... xviii 7.4.5. ViSOR ................................................................................................... xviii 7.4.6. CANDELA ............................................................................................ xviii 7.4.7. CANTATA ............................................................................................. xviii

D5.3v1 EventVideo test sequences, ground-truth and evaluation methodology 3
1. Introduction
1.1. Motivation
During the past years, automatic video surveillance systems have experienced a great
development driven by the need of security in private and public places. Many approaches are
available whose effectiveness is not clear [1]. They have to deal with a huge variety of
environments that might change over time (e.g., lighting conditions) or present a substantial
difference (e.g., sunny or rainy day). Hence, the performance of such systems can degrade
significantly in these situations [2].
To precisely identify which approaches operate better in certain situations or applications,
performance evaluation has been proposed in the literature as a way to determine their strengths
and weaknesses. The widely used empirical approach consists on the performance evaluation
through the analysis of the obtained results. For such analysis, two main aspects have to be
specified: the dataset (a set of sequences covering the situations that the algorithm might face
being large enough to represent real world conditions) and the metrics to measure the precision
of algorithms (which allow to quantify their performance). These two aspects are also known as
the evaluation protocol [3][4].
Traditional performance evaluation approaches use metrics based on ground-truth
information that represents a manual annotation of the ideal result. The generation of the ground
truth is usually a time consuming step and, therefore, limits the amount of data in the dataset.
Although there are other approaches not focused on ground-truth information [5][6], most of the
current literature assumes the availability of such data. Furthermore, the existence of several
metrics increases the complexity of designing an evaluation protocol. Another point to be taken
into account is the increasing quantity of video data available, which generates a new need to
automate and optimize the whole tracking evaluation process.
In this document, we focus on the main stages that compose a typical video surveillance
system (addressed within the EventVideo project) and describe the evaluation scenarios of the
EventVideo project. Then, we briefly review the material to be used for each stage: the test
sequences, the ground-truth and the evaluation methodologies.
1.2. Document structure
This document contains the following chapters:
Chapter 1: Introduction to this document

D5.3v1 EventVideo test sequences, ground-truth and evaluation methodology 4
Chapter 2: Overview of the evaluation scenarios proposed in the EventVideo project
Chapter 3: Describes the available evaluation material for the main stages of video
surveillance systems that are also studied in the EventVideo project
Chapter 4: Defines the two evaluation methodologies used in the EventVideo project
Chapter 5: Finish this document with some conclusions and future work.
Chapter 6: Finish this document with some conclusions and future work.

D5.3v1 EventVideo test sequences, ground-truth and evaluation methodology 5
2. Evaluation scenarios
2.1. Selected analysis stages
For the EventVideo project, we consider the typical stages that compose a video surveillance
system (depicted in Figure 1). They are:
Video object segmentation: It detects the moving objects in the scene by applying
sequential analysis steps such as foreground analysis, noise filtering and shadow
removal. The output of this stage is a binary mask indicating the foreground objects.
People modeling and detection: The likelihood (score) of being people is computed for
each candidate region (that could either a frame region or a blob extracted from the
foreground binary mask). A person model has to be pre-computed and the task
comprises to find the similarity of such model and the observed blobs. The output of this
stage is a numerical value (score) for each analyzed candidate.
Video object tracking: It consists on locating an object or objects of interest as they
move in time throughout a scene by means of a vision device such as a camera. The
output of such stage in the location of each tracked target (its position and size).
Event recognition: It detects events using the information from the previous stages. An
event is considered as an action performed by a person (e.g., interaction with objects,
walking). The output of this stage includes a descriptor with the score (the likelihood of
the event), the frame span and the location of the event.
Semantic
Description
Foreground Object
DetectionVideo object
segmentation
People modeling
and detection
Video object
Tracking
Event
recognition
Figure 1 – Typical processing chain for a video surveillance system

D5.3v1 EventVideo test sequences, ground-truth and evaluation methodology 6
2.2. Scenario classification
For the EventVideo project, the evaluation process considers different types of scenarios that
represent the visual data obtained in real world conditions at different stages considered in the
project (e.g., video object segmentation and tracking). For understanding the limitations of
current approaches, each scenario is classified according to two criteria: complexity and density.
The former describes if the visual data represents situations that can be easily characterized or
not. For example, video object segmentation based on background subtraction can be easily
performed when dealing with static cameras without moving background objects but the
complexity highly increases when dealing with moving cameras or motion in the background.
The latter describes a critical aspect in video surveillance: the number of moving objects (e.g.,
people) in the sequence. Independently of the problems being addressed, an increasing number
of objects affect the performance of the system. This fact is particularly interesting in video
surveillance as it is applied to crowded places such as airports, train stations and mass sport
events. For example, the detection of abandoned objects presents variable difficulty depending
on the number of moving objects in the scene (fewer people, less complexity). Finally, we
consider two levels for each criterion: low and high. The two criteria and their values can be
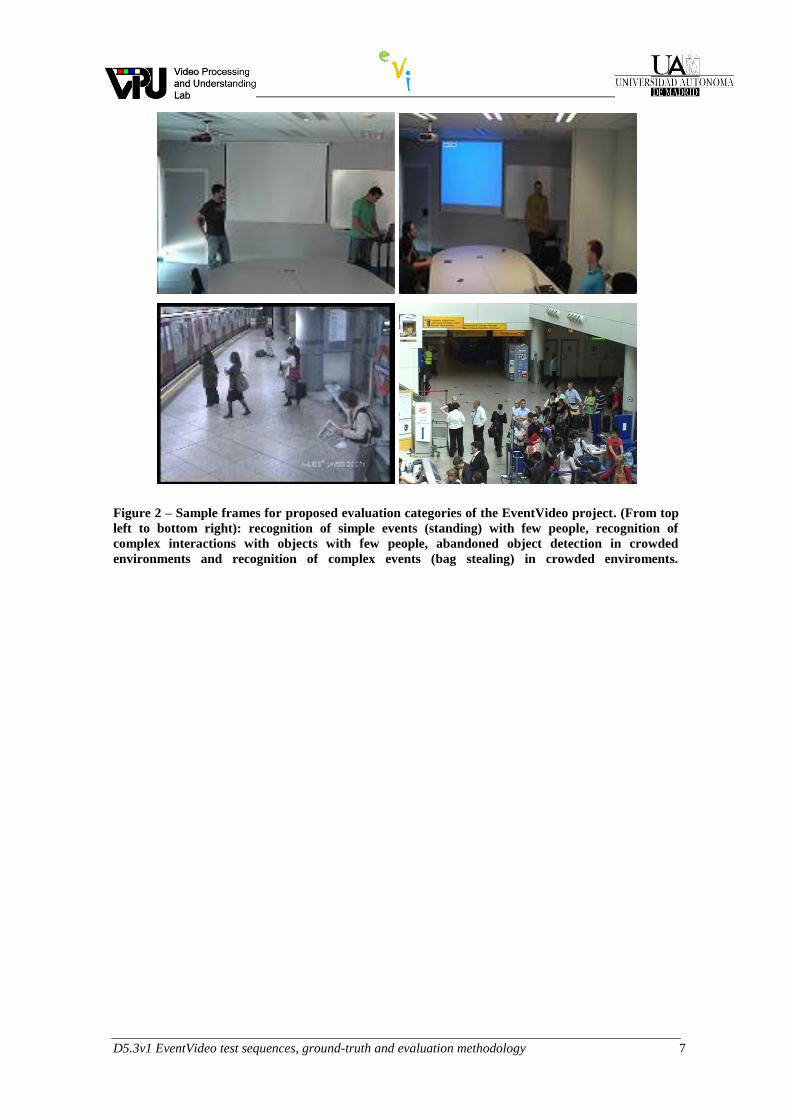
summarized as shown in Table 1. Sample frames are depicted in Figure 2.
Scenario Complexity Density
S1 Low Low
S2 High Low
S3 Low High
S4 High High
Table 1 – Proposed scenario classification in the EventVideo project
D5.3v1 EventVideo test sequences, ground-truth and evaluation methodology 7
Figure 2 – Sample frames for proposed evaluation categories of the EventVideo project. (From top
left to bottom right): recognition of simple events (standing) with few people, recognition of
complex interactions with objects with few people, abandoned object detection in crowded
environments and recognition of complex events (bag stealing) in crowded enviroments.


D5.3v1 EventVideo test sequences, ground-truth and evaluation methodology 9
3. Evaluation material
For each analysis stage mentioned in section 2.1, we describe the available evaluation
material based on visual information to be used within the EventVideo project
3.1. Video object segmentation
For video object segmentation, one dataset has been created by the VPULab focused on the
main problems that affect motion-based algorithms for video-object segmentation. Moreover, an
analysis of publicly available datasets is also provided in the appendix.
3.1.1. Chroma Video Segmentation Ground-truth – CVSG
The CVSG dataset [10] consists of a set of video scripts which have then been filmed
according to a thorough review and classification of the critical factors that affect the behavior
of segmentation algorithms. Foreground objects have been recorded in a chroma studio, in order
to automatically obtain pixel-level high quality segmentation masks for each generated
sequence. The resulting corpus contains the segmentation ground-truth plus filmed sequences
mounted over different backgrounds. Table 2 summarizes the critical factors that have been
considered. Since specific settings for these factors can significantly increase (high complexity
settings) or decrease (low complexity settings) segmentation accuracy, they seem a convenient
mechanism to regulate sequence complexity, allowing the generation of multiple complexity
scenarios (only low-density S1-S2 scenarios, 14 sequences). We next describe these factors
including a brief discussion on their influence on the overall sequence complexity.
Foreground (Objects) Background Camera
Single objects Groups
Tex
tura
l co
mp
lex
ity
Mu
ltim
odal
ity
Mo
tio
n s
chem
e
Tex
tura
l co
mp
lex
ity
Ap
par
ent
vel
oci
ty
Ob
ject
str
uct
ure
Un
cov
ered
exte
nt
Ob
ject
siz
e
Fra
me
larg
est
vel
oci
ty
dif
fere
nce
Ob
ject
inte
ract
ion
s
Table 2 – Critical factors in motion-based object segmentation

D5.3v1 EventVideo test sequences, ground-truth and evaluation methodology 10
Foreground critical factors
Moving objects properties significantly influencing segmentation accuracy have been
divided into single-object and object-group properties. Within the first set we have included:
1. Textural complexity. Motion segmentation algorithms need to establish the amount
of change within an area between two consecutive frames; the more distinctive
spatial information is, the more reliable the estimation of this amount can be
expected. Hence low complexity settings for this critical factor correspond to high
textured objects, whereas color uniformity corresponds to higher complexity.
2. Apparent velocity. Since background normally presents instabilities and noise, too
slow objects (which result in small temporal changes) are hard to discriminate.
However, too fast ones require large search windows in motion estimation and
tracking, thus degrading efficiency and normally also influencing accuracy,
especially when optical flow is being derived from the motion compensation vectors
available in coded sequences. Therefore, slow or fast objects correspond to high
complexity settings, while complexity decreases the more similar are the velocities
of the camera and the objects.
3. Object structure. Perfectly rigid objects obviously simplify segmentation when
working with optical flow approaches. In situations in which this constraint is only
verified piece-wise accuracy can be degraded if individual objects are to be
extracted from the moving object masks or when handling object parts which might
remain motionless whilst the whole object is globally undergoing a specific motion
(e.g., the alternatively static feet of a walking person while the rest of the body is
propelled forward). This latter case along with non-rigid objects undergoing a
completely chaotic motion have been classified as high complexity. Simpler cases
of piece-wise rigid objects will range from average to low complexity. Finally, rigid
objects represent low complexity settings.
4. Uncovered extent. Uncovered parts of objects might seriously hamper motion
estimation, due to the lack of region or points correspondence. This decreases
accuracy in optical flow based techniques as well as in the tracking mechanisms
involved in determining the temporal evolution of objects. Low complexity settings
must therefore avoid situations leading to object uncovering, which should be
included for higher complexity.

D5.3v1 EventVideo test sequences, ground-truth and evaluation methodology 11
5. Object size. This factor must be only considered in the general case of a moving
camera. In this case camera motion is normally derived from the frame dominant
motion, which implicitly assumes that objects are smaller than the background area.
Minimum object sizes are not a priori limited excepting the possible semantic
constraints to remove background artifacts. Therefore low complexity settings
would correspond to small objects and high complexity ones include those which
dimensions are fairly comparable to the background area.
Regarding relevant properties concerning objects groups, the following critical factors have
been identified:
1. Frame largest velocity difference. Large differences between the fastest and the
slowest object simultaneously appearing within a frame can hinder the setting of a
proper threshold to discriminate object motion when adaptive schemas are used.
These schemas work without human supervision relying on a preliminary analysis
on motion distribution. Normally it is assumed that bigger values of this distribution
correspond to real objects, and thus adaptive thresholds might cause small moving
objects to blend into the background. Hence, high complexity settings for this
critical factor should include objects with very different velocities interacting
together and low complexity settings must consider only objects with similar
velocities.
2. Object interactions. These might influence motion estimation, but they do especially
affect to the formation of individual objects within the foreground masks and to the
tracking accuracy (i.e. the object temporal evolution). Therefore, they may be
ignored when dealing with algorithms simply focused on extracting foreground
masks. We can consider:
a. Relative trajectories. When a number of objects have intersecting
trajectories, object overlapping hampers individual object separation and
objects can be lost after occlusion. Thereby intersecting objects must be
exclusively used in high-complexity settings.
b. Object split and merge. Object separation is hard to identify after two
different objects merge and remain overlapped for a certain time, thus
affecting object tracking. Additionally if individual object references are
lost, further splits will require the creation of additional spatio-temporal
objects, resulting in important degradations in objects being merged and
split a number of times (e.g., any object successively used by several

D5.3v1 EventVideo test sequences, ground-truth and evaluation methodology 12
people). Thus, split and merge processes must also be included only in high-
complexity settings.
Background critical factors
These factors mainly refer to background properties which might affect motion estimation:
1. Textural complexity. As aforementioned, temporal change can be derived with
higher reliability within textured areas. In fact, low textured background areas
remain apparently static under low camera motion, being thus very probably
misclassified as objects. Consequently, scenarios including an important amount of
uniform areas correspond to high-complexity, while entirely textured backgrounds
correspond to low-complexity situations.
2. Multimodality. This refers to the property of some backgrounds to undergo small
variations usually considered irrelevant from a semantic point of view (such as
twinkling water, swaying trees or glowing flames). These backgrounds significantly
hinder segmentation algorithms, thus defining high-complexity settings.
Camera motion critical factors
We here just consider the camera motion scheme. Camera motion influences the overall
sequence and thereby plays a decisive role in segmentation accuracy. Static cameras, the
simplest case, do not alter motion information, which results in low complexity sequences.
Uniform camera motion can be robustly estimated and advantageously used during
segmentation; we label these sequences as average complexity. Finally, high complexity
corresponds to fast jerky camera motions, due to hand-held or uncalibrated video-cameras. In
this case the small temporal duration of the involved patterns prevents from applying robust
estimation procedures and its velocity is very likely to mask object motion.

D5.3v1 EventVideo test sequences, ground-truth and evaluation methodology 13
Figure 3 – Sequence examples. Every row shows three random frames from a sequence.

D5.3v1 EventVideo test sequences, ground-truth and evaluation methodology 14
3.2. People modelling and detection
For video people modeling and detection, one dataset has been created by the VPULab
focused on the main problems that affect people detection in surveillance videos. Moreover, an
analysis of publicly available datasets is also provided in the appendix.
3.2.1. Person Detection dataset - PDds
The PDds corpus or dataset [15] consists of a set of video and associated ground-truth, for
the evaluation of people detection algorithms in surveillance video scenarios. Sequences from
scenes with different levels of complexity have been manually annotated. Each person present at
a scene has been labeled frame by frame, in order to automatically obtain a people detection
ground-truth for each sequence. Sequences have been classified into different complexity
categories depending on critical factors that typically affect the behavior of detection algorithms.
The resulting corpus exceeds other public pedestrian datasets in the amount of video sequences
and its complexity variability.
Table 3 summarizes the critical factors that have been considered in the video complexity
classification and Table 4 summarizes the video sequences and complexity. Since specific
settings for these factors can significantly increase (high complexity settings) or decrease (low
complexity settings) segmentation accuracy, they seem a convenient mechanism to regulate
sequence complexity, allowing the generation of multiple complexity scenarios (S1-S4
scenarios, 91 sequences). We next describe these factors including a brief discussion on their
influence on the overall sequence complexity.
Background Classification
Textural
complexity
Variability Appearance
variability
People/Object
interactions
Not
textu
red
Sli
ghtl
y t
extu
red
Tex
ture
d
Lig
hti
ng c
han
ges
Vie
w c
han
ges
Mult
imodal
Pose
var
iati
ons
Dif
fere
nt
cloth
es
Car
ry o
bje
cts
Obje
cts
Peo
ple
Obje
cts
& P
eople
Table 3 – Critical factors on people detection video corpus

D5.3v1 EventVideo test sequences, ground-truth and evaluation methodology 15
Background Classification
Sequence Category Scenario Textural
complexity
Variability Appearance
variability
People/Object
interactions
1-4 C1 S1 Low Low Low Low
5-6 C1 S1 Low Medium Low Low
7-8 C2 S1 Low Low Medium Low
9-10 C2 S1 Low Low Medium Medium
11-12 C2 S1 Low Medium Low Medium
13 C3 S2 Medium Medium Medium Low
14-16 C3 S2 Medium Medium Medium Medium
17-18 C4 S2 Low Low Medium High
19-20 C4 S2 Low Low High Medium
21 C4 S2 Low Low High High
22-24 C5 S2 Medium High Medium High
25 C5 S2 Medium High High Medium
26 C5 S3 High High Medium High
27-33 C5 S3 High High High Low
34-65 C5 S3 High High High Medium
66-90 C5 S3 High High High High
Table 4 –People detection video corpus
Background critical factors
We here define background complexity as the difficulty to detect in the scene the initial
objects candidate to be person, due to the presence of edges, multiple textures, lighting changes,
reflections, shadows and any kind of background variation. The following critical factors have
been identified:
1. Textural complexity. Scenarios including an important amount of textured areas can
make highly difficult the localization of initial object candidates. In fact, depending
on the algorithm used, highly textured background areas can be easily wrongly
detected as objects. Consequently, low textured background areas correspond to
lower complexity situations and vice versa.
2. Variability. This refers to the property of some backgrounds to undergo variations
usually produced by external factors (light and view point changes) or multimodal
backgrounds (such as twinkling water, swaying trees or glowing flames). Static
scenarios with less variations correspond with low complexity levels, while
scenarios with multiple variations correspond with more challenging situations.
People classification critical factors
We here define it as the difficulty to verify the object candidates to be person in the scene. It
is related to the number of objects, their velocity, partial occlusions, pose variations and
interactions between different people and/or objects. We have grouped these elements into two
fundamental critical factors:

D5.3v1 EventVideo test sequences, ground-truth and evaluation methodology 16
1. Appearance variability. People appearance exhibits very high variability since they
are non-rigid objects, they can change pose, they can also wear different clothes and
carry different objects, they have a considerable range of sizes and shapes mainly
due to the point of view and the relative situation with the camera. People with
limited appearance variability (no pose changes, no sizes variations, etc) entail low
complexity levels, while the cases with high appearance variability entail a more
complex classification.
2. People/Object interactions. People must be identified in real-life scenarios, that is
they must be detected in the context of the environment surrounding them. People
present interactions with objects and/or with other people. These interactions make
more difficult their identification and classification. In order to identify all persons
involved in these situations, it is necessary to deal with occlusions. Occlusions
resulting from objects, other persons or visibility of the camera limits the visible
appearance of the person occluded.
Figure 4 – Sequence examples. Every row shows three random frames from a sequence.

D5.3v1 EventVideo test sequences, ground-truth and evaluation methodology 17
3.3. Video Object tracking For video object tracking, one dataset has been created by the VPULab focused on the
main problems that affect video object tracking in surveillance videos. Moreover, an analysis
of publicly available datasets is also provided in the appendix.
3.3.1. Single Object Video Tracking dataset- SOVTds
The selection of the test scenarios is one of the most important steps when developing an
evaluation protocol. Each previously mentioned issue has to be represented in the dataset for
achieving a correct understanding of the capabilities of the tracking algorithm. Moreover,
different levels of complexity have to be covered in the test data. Hence, this dataset is designed
with four complexity levels including both real and synthetic sequences. The addressed
problems and the modeled situations are described as follows.
Selected tracking problems
Several problems have to be taken into account that corresponds to real-world situations. In
the proposed dataset, we have modeled the following tracking-related problems:
1. Complex (fast) motion: The target changes its trajectory unexpectedly or increases
its speed abruptly; the tracker might lose the target if it exceeds the search area.
2. Gradual (and global) illumination changes: In long sequences, the illumination
might change due to weather conditions, time passing, etc. In this case, the target
model might become outdated making harder the tracking task.
3. Abrupt (and local) illumination changes: As the target moves, it can enter in areas
with different illumination. Hence, the tracker might be confused and lose the target.
4. Noise: It appears as random variations over the values of the image pixels and can
significantly degrade the quality of the extracted features for the target model.
5. Occlusion: It is defined when an object moves between the camera and the target. It
can be partial or total if, respectively, a region or the whole target is not visible.
Complexity factors
In the following table, we describe the criteria for defining the complexity factors of the test
sequences

D5.3v1 EventVideo test sequences, ground-truth and evaluation methodology 18
Problem Criteria (factors)
Complex Movement The target changes its speed (pixels/frame) abruptly in consecutive frames
Gradual Illumination The average intensity of an area changes gradually with time until a
maximum intensity difference is reached
Abrupt Illumination The average intensity of an area changes abruptly with respect to its
surroundings (maximum intensity difference)
Noise It includes natural (snow) or white Gaussian noise which is manually added
with varying deviation value
Occlusion Objects in the scene occlude a percentage of the target
Scale Changes The target changes its size with a maximum relative change regarding its
original size.
Similar Objects An object with similar color to the target appears in the neighborhood of the
target
Table 5 –Complexity factors for the video tracking dataset
Modeled situations
As a tracker can operate in different conditions in which the same problem appears, we
propose to organize them into four situations ranging from completely controlled (e.g., synthetic
sequences) to uncontrolled (e.g., real-world sequences). Moreover, the complexity of the
tracking problems is estimated for each sequence of the situations. They are:
1. Synthetic sequences (S1): It is composed of synthetic sequences that provide
controlled testing conditions allowing to isolate each problem. They consist on a
moving ellipse in a black background that can contain squares of the same or
different color (acting as, respectively, similar or occlude objects). We have created
sequences to model all the selected problems with five degrees of complexity for
each one. In total, 35 sequences were generated with around 3500 frames. Sample
frames are shown in the first row of Figure 5.
2. Laboratory sequences (S2): It provides a natural extension of the S1 situation by
representing real test data in a laboratory setup under controlled conditions. An
object with a simple color pattern was used for generating such data. We have
recorded sequences to model all the selected problems with three complexity levels
for each one. For some problems (complex movement, occlusion, scale changes and
similar object problems), the sequences were recorded using the test object whereas
for the other ones (noise, gradual and abrupt illumination changes), a single
sequence was recorded without any problems and then, they were artificially
included. In total, 21 sequences were generated with around 6500 frames. Sample
frames are shown in the second row of Figure 5.

D5.3v1 EventVideo test sequences, ground-truth and evaluation methodology 19
3. Simple real sequences (S3): It includes data from previously existing datasets that
have been captured in noncontrolled conditions. We have extracted clips from the
original sequences that contain isolated tracking problems. As each target has
different characteristics [4], we have grouped the sequences into three target-
dependent categories: cars (from MIT Traffic [16] and Karlsruhe [17] datasets),
faces (from TRECVID2009 [18], CLEMSON[19] and VISOR [20] datasets) and
people (from TRECVID2009 [18], i-Lids [21], PETS2009 [22], PETS2000 [22]
and CAVIAR [23] datasets). For each target type and problem, three sequences with
varying complexity level were composed making a total of 53 sequences with
around 8500 frames. Sample frames are shown in the third row of Figure 5.
4. Complex real sequences (S4): The last situation contains the most complex
sequences, which are clips from other datasets that include several problems. Once
the algorithms are tested for each problem individually, it is a good idea to check the
performance in more realistic (and complex) situations. Similarly to the previous
situation, we also distinguish three problems have been estimated and classified
according the defined criteria. All these sequences were extracted from the MIT
Traffic [16] (for cars), CLEMSON [19] (for faces) and PETS2009 [22] (for people)
datasets. In total, 15 sequences were selected with around 4500 frames. Sample
frames are shown in the fourth row of Figure 5.
Figure 5 – Sample frames for the situations of the proposed dataset (from top row to bottom row):
synthetic (S1), laboratory (S2), Simple real (S3) and Complex real (S4). In addition, samples of
some tracking-related problems are also presented for each column (from left to right): abrupt
illumination change, noise, occlusion, scale change and (color-based) similar objects.

D5.3v1 EventVideo test sequences, ground-truth and evaluation methodology 20
3.4. Event detection
For event detection, two datasets have been created by the VPULab focused on the detection
of abandoned/stolen objects and human-object interactions in controlled environments. Both
datasets are described as follows:
3.4.1. Abandoned and Stolen Object Discrimination dataset - ASODds
The dataset [7] consists of two sets of annotations of the foreground binary masks of the
abandoned and stolen objects. The first one has been obtained by manually annotating the
objects of interest in the video sequence (annotated data). The second one represents real data
has been obtained by running [8] over the test sequences to get inaccurate masks (real data).
Figure 6 shows an example of such data.
Figure 6 – Sample frames for the ASODds dataset and annotations (automatic and manual) of the
object of interest
Then, we have grouped all the test sequences into three categories according to a subjective
estimation of the background complexity that consists on the presence of edges, multiple

D5.3v1 EventVideo test sequences, ground-truth and evaluation methodology 21
textures, lighting changes, reflections, shadows and objects belonging to the background.
Currently, three categories have been defined considering Low (C1), medium (C2) and High
(C3) background complexity. According to the criteria proposed in section 2.2, the categories
C1 and C2 present low complexity and few number of objects (situation S1) whereas the C3
covers low complex and crowded scenarios (situation S3). Sample frames of such categories are
shown in Figure 7 and a summary of the annotated events in the dataset and the associated
complexity of each category is available in Table 6.
Category 1 Category 2 Category 3
Figure 7 – Available categories in the ASODds dataset
Table 6 – ASODds dataset description
3.4.2. Event Detection dataset – EDds
Currently, the dataset [9] contains 17 sequences taken using a stationary camera at
resolution of 320x240 at 12 fps. The dataset is focused on two types of human-related
events: interactions and activities. In particular, two activities (Hand Up and Walking) and three
human-object interactions (Leave, Get and Use object) have been annotated.
We have grouped all the test sequences into three categories according to a subjective
estimation of the analysis complexity considering:
Foreground complexity (S1), defined as the complexity to extract the foreground
due to the presence of edges, multiple textures, lighting changes, reflections,
shadows and objects belonging to the background.

D5.3v1 EventVideo test sequences, ground-truth and evaluation methodology 22
Tracking complexity (S2), defined as the difficulty to track foreground blobs in the
sequence. It mainly differentiates crowded from less-populated sequences.
Feature complexity (S3), defined as the difficulty to classify moving and temporally
stationary foreground in a scenario in order to extract/analyze relevant features.
Event complexity (S4), defined as the difficulty to detect/recognize the annotated
events in a scenario. It is related with the velocity of the event execution, the
(partial) occlusion of the action performed and the variability in appearance of the
actor.
Sample frames of such categories are shown in the following images:
Category 1 Category 2 Category 3
Figure 8 – Available categories in the EDds dataset
A summary of the annotated events in the dataset and the associated complexity of each
category is available in the following table:
Table 7 – EDds dataset description
The complexity estimation codes are Low (L), Medium (M), High (H) and Very High (V).
The events are Leave-object (LEA), Get-object (GET), Use-object (USE), Hand Up (HUP) and
Walking (WLK).

D5.3v1 EventVideo test sequences, ground-truth and evaluation methodology 23
4. Evaluation methodology
According to [4], performance evaluation methodologies can be roughly divided into
analytical and empirical methods. The former describes approaches that evaluate trackers by by
considering their principles, their requirements and their complexity. Hence, it is not required to
implement the algorithm under evaluation. However, this evaluation is difficult as algorithms
may be complex composed of several stages. The latter reduce the complexity of the evaluation
task by inspecting the results of the algorithm and deciding which performance level they have.
Figure 9 – Performance evaluation methodologies [4].
In the EventVideo project, the empirical methods are used for evaluating the stages of the
video surveillance system. Among them, we distinguish between standalone and discrepancy
methods. Both are employed in the project and they are described as follows.
4.1. Based on ground-truth data
Common tracking performance evaluations use empirical discrepancy methods [4] that
compare off-line ground-truth data with the estimated target state. Ground-truth data are
expensive to produce and therefore usually cover only small temporal segments of test video
sequences and represent only a small percentage of data variability. This limitation makes it
difficult to extrapolate the performance evaluation results to (unlabeled) new sequences.
Moreover, the evaluation using ground truth is not feasible for on-line performance analysis [5].
4.1.1. Video object segmentation
The metrics most commonly used in literature are those based on ground-truth pixel level
evaluation:

D5.3v1 EventVideo test sequences, ground-truth and evaluation methodology 24
True positive (TP): The number of pixels correctly classified as foreground (pixel
value 1).
True negative (TN): The number of pixels correctly classified as background (pixel
value 0).
False positive (FP): The number of pixels incorrectly classified as foreground.
False negative (FN): The number of pixels incorrectly classified as background.
Let us define an experiment from P positive instances and N negative instances. The
four outcomes can be formulated in a 2×2 contingency table or confusion matrix, as follows:
Ground Truth
p n Total
Pre
dic
tion
p’ TP FP P’
n’ FN TN N’
Total P N
Table 8 – True positives, true negatives, false positives and false negatives
These measures are often combined in the state of the art object segmentation. These
measures are:
Precision: It is defined as the total number of pixels correctly classified as foreground/
background vs the total number of pixels correctly or incorrectly classified as
foreground/ background.
( _ _ _ 0) 0TN
pixels of value PTN FN
Precision (4.1)
( _ _ _1) 1TP
pixels of value PTP FP
Precision (4.2)
Recall: It is defined as the total number of pixels correctly classified as foreground/
background vs the total real (ground truth) number of pixels of foreground/ background.
( _ _ _ 0) 0TN
pixels of value RTN FP
Recall (4.3)
( _ _ _1) 1TP
pixels of value RTP FN
Recall (4.4)

D5.3v1 EventVideo test sequences, ground-truth and evaluation methodology 25
Fscore: A measure that combines precision and recall is the harmonic mean of precision
and recall, the traditional F-measure or balanced F-score.
2 0 0( _ _ _ 0) 0
0 0
P Rpixels of value FS
P R
Fscore (4.5)
2 1 1( _ _ _1) 1
1 1
P Rpixels of value FS
P R
Fscore (4.6)
In order to achieve the objective of evaluating and finding the optimal parameters of the
algorithms, it have been weighted equivalently the detection of foreground/background (ones
and zeros) merging the above measures through the sum (although it could have used any other
function). The optimal parameter selection and evaluation is performed by choosing the
maximum sum:
0 1SUM FS FS (4.7)
4.1.2. People modeling and detection
In order to evaluate different people detection approaches, we need to quantify the different
performance results. In the state of the art, performance can be evaluated at two levels: sequence
sub-unit (frame, window, etc) or global sequence. Sub-unit performance is usually measured in
terms of Detection Error Tradeoff (DET) [33][34] or Receiver Operating Characteristics (ROC)
[35][36] curves. Global sequence performance is usually measured in terms of Precision-Recall
(PR) curves [37][38][39]. The first level gives us information of the classification stage, while
the second one provides overall system performance information. In order to evaluate a video
surveillance system, it is more interesting to compare the overall performance. In both cases the
detectors output is a confidence score for each person detection, where larger values indicate
higher confidence. Both evaluation methods compute progressively the respective parameters
such as the number of false positives, Recall rate or Precision rate from the lowest possible
score to the highest possible score. Each score threshold iteration provides a point on the curve.
ROC curves represent the fraction of true positives out of the positives (true positive rate,
TPR, Recall or Sensitivity) vs. the fraction of false positives out of the negatives (false positive
rate, FPR or 1-Specificity). We aim to evaluate and compare the overall performance of
different detection systems, so we have chosen the second evaluation method. For each value of
the detection confidence, Precision-Recall curves compute Precision and Recall as follows:
#
# #
TruePositivePeopleDetections
TruePositivePeopleDetections FalsePositivePeopleDetections
Precision (4.8)
D5.3v1 EventVideo test sequences, ground-truth and evaluation methodology 26
#
# #
TruePositivePeopleDetections
TruePositivePeopleDetections FalseNegativePeopleDetections
Recall (4.9)
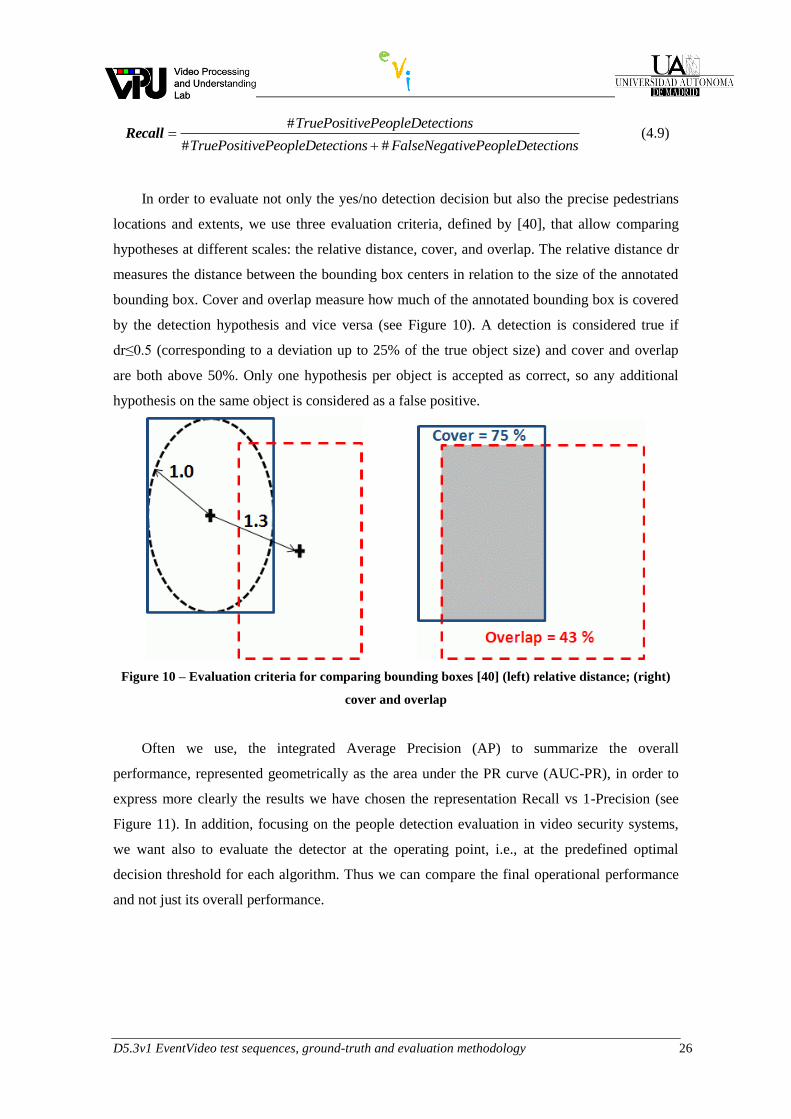
In order to evaluate not only the yes/no detection decision but also the precise pedestrians
locations and extents, we use three evaluation criteria, defined by [40], that allow comparing
hypotheses at different scales: the relative distance, cover, and overlap. The relative distance dr
measures the distance between the bounding box centers in relation to the size of the annotated
bounding box. Cover and overlap measure how much of the annotated bounding box is covered
by the detection hypothesis and vice versa (see Figure 10). A detection is considered true if
dr≤0.5 (corresponding to a deviation up to 25% of the true object size) and cover and overlap
are both above 50%. Only one hypothesis per object is accepted as correct, so any additional
hypothesis on the same object is considered as a false positive.
Figure 10 – Evaluation criteria for comparing bounding boxes [40] (left) relative distance; (right)
cover and overlap
Often we use, the integrated Average Precision (AP) to summarize the overall
performance, represented geometrically as the area under the PR curve (AUC-PR), in order to
express more clearly the results we have chosen the representation Recall vs 1-Precision (see
Figure 11). In addition, focusing on the people detection evaluation in video security systems,
we want also to evaluate the detector at the operating point, i.e., at the predefined optimal
decision threshold for each algorithm. Thus we can compare the final operational performance
and not just its overall performance.

D5.3v1 EventVideo test sequences, ground-truth and evaluation methodology 27
0 0.1 0.2 0.3 0.4 0.5 0.6 0.7 0.8 0.9 10
0.1
0.2
0.3
0.4
0.5
0.6
0.7
0.8
0.9
1
Recall
Pre
cis
ion
AUC=0.5
AUC<0.5
AUC>0.5
0 0.1 0.2 0.3 0.4 0.5 0.6 0.7 0.8 0.9 10
0.1
0.2
0.3
0.4
0.5
0.6
0.7
0.8
0.9
1
1-Precision
Re
ca
ll
AUC=0.5
AUC<0.5
AUC>0.5
Figure 11 – Precision-Recall curves and area under the curve. Equivalent representations:
Precision vs Recall representation and Recall vs 1-Precision representation.
4.1.3. Video object tracking
In order to evaluate the accuracy selected tracking algorithms, one metric was chosen:
SFDA (Sequence Frame Detection Accuracy) which calculates for each frame the spatial
overlap between the estimated target location and the ground-truth annotation.
1
1
( )
( )
frames
frames
N
t
N t t
GT Dt
FDA t
N OR N
SFDA (4.10)
( )
2
t t
GT D
OverlapRatioFDA t
N N
(4.11)
where t
GTN and t
GTN represent the number of ground-truth and target annotations
respectively in the th frame.
4.1.4. Event detection
For matching event annotations and detections, we have defined the following criteria:

D5.3v1 EventVideo test sequences, ground-truth and evaluation methodology 28
1
2
2 2
1
( , )2
0
D GT
start start
D GT
end endGT D
GT D
GT D
if score
T T
T TMatch E E
A A
A A
Otherwise
(4.12)
where GTE and
DE are the annotated and detected events; score is the probability of the
detected event; (D
startT ; D
endT ) and (GT
startT ; GT
endT ) are the frame intervals of the annotated (GT) and
detected (D) events;GTA and
DA represent the average area (in pixels) of each event;
GT DA A is their average spatial overlap (in pixels); , 1 , 2 and are positive thresholds
(heuristically set to the values 0.75 , 1 2 100 , and 0.5 ).
Then, we evaluate the recognition accuracy with the Precision (P) and Recall (R) measures.
Precision is the ratio between the correct and the total number of detections. Recall is the ratio
between the correct detections and the total number of annotations. They are defined as follows
TP
TP FN
Recall (4.13)
TP
TP FP
Precision (4.14)
where TP (True Positive) are the correct event detections, FN (False Negatives) are the
missed events and FP (False Positive) are the wrong event detections. For event annotation and
performance evaluation, the ViPER toolkit has been used [25].
4.2. Not based on ground-truth data
To extend the applicability of performance evaluation, empirical standalone methods for
track-quality estimation without ground-truth data have been defined for large unlabeled
datasets, self-tuning (automatic control via on-line analysis), algorithm comparative ranking and
fusion. In this section, we review the approaches of the EventVideo project to be used in the
video object segmentation and tracking stages.

D5.3v1 EventVideo test sequences, ground-truth and evaluation methodology 29
4.2.1. Video object segmentation
We have selected the region-based measures based on color proposed by [26] and perform
a slight modification for performance evaluation [27]. We have decided not to use measures
from the other two described categories (model and assisted) because the constraints introduced
(model of foreground regions and accuracy of the additional algorithm) are hard to satisfy. On
the contrary, the matching of object and color region boundaries is usually satisfied for the
video analysis domain. Consequently, the segmentation algorithms selected for the experiments
do not include any foreground modeling.
The �measure selected is the color contrast along the boundary [26]. It is based on
defining normal lines of length 2L + 1 for each boundary pixel and comparing the color
differences between the initial (PI) and ending (PO) points of each normal line. The
neighborhood of these pixels is also considered by using a window of size MxM. The scheme is
depicted in Figure 12 It proposes to estimate the segmentation quality of each boundary pixel
using the Boundary Spatial Color Contrast feature defined as follows:
(4.15)
where ( )i
OC t and ( )i
IC t are the mean colors calculated in the MxM neighborhood of the
points PI and PO (using the RGB color space quantified into 256 levels) for each i-th boundary
pixel of the foreground region at time t. This measure ranges from 0 to 1 depending if all pairs
of mean colors belong to, respectively, the same or different color regions.
Figure 12 – Boundary-based contrast scheme proposed by [26]. (a) Segmented
object, (b) its boundary with the normal lines and (c) a zoom on a boundary pixel location

D5.3v1 EventVideo test sequences, ground-truth and evaluation methodology 30
Then, it proposes to evaluate the foreground segmentation of each object, Oj, and to
combine the segmentation of multiple objects as follows:
(4.16)
where Kt is the total number of boundary pixels, BSCC is the spatial color contrast of the i-
th boundary pixel of the j-th foreground region being analyzed. Its value ranges from 0 (lowest
segmentation quality) to 1 (highest segmentation quality). Additionally, [26] used this measure
to detect incorrectly segmented boundary pixels if they are above a certain threshold, T1. Thus,
a second measure of segmentation quality could be derived by counting the correctly segmented
boundary pixels as follows.
(4.17)
The main advantages of these measures are their low complexity and their possibility to
detect failures at finer level (boundary pixel). These aspects make the measure useful for its use
to adapt or feedback real-time video segmentation algorithms to improve the segmentation
performed. The parameters (of this measure) to study are the normal line length L, the size M of
the window around PI=PO points and the threshold, T1, used in the DC2 measure. As it can be
observed the two measures based on color, DC1 and DC2, fall in the range [0; 1].
4.2.2. Video object tracking
For estimating tracking performance without ground-truth information, we use a state-of-
the-art approach [28] based on estimating the uncertainty of the tracker and then, analyzing its
values to decide whether the tracker is on the target or on background.
The uncertainty of the tracking filter (i.e., algorithm) can be used as indicator of unstable
periods of the output data (e.g., wrong target estimation) providing information about the
tracker condition. We measure the tracker uncertainty using the spatial uncertainty of the N

D5.3v1 EventVideo test sequences, ground-truth and evaluation methodology 31
particles (following the particle filter approach). This uncertainty can be estimated by analyzing
the eigenvalues of the covariance matrix [4]. Hence, we compute such uncertainty as follows:
(4.18)
where t is the covariance matrix of the posterior distribution of the tracking filter [4],
det(.) is the matrix determinant and d is the number of dimensions of the state space of the filter.
For identifying when the tracker is stable (i.e., following the target), we study the changes
of St within a time window of length . We compute two relative variations of uncertainty for
the change of tS with respect to St and vice-versa as defined in [28]. The former indicates
low-to-high uncertainty changes whereas the latter represents high-to-low uncertainty changes.
Two time window lengths are used for considering short-term and long-term changes ( 1
and 2 ). As a result, four signals are computed by combining the two relative variations and the
two window lengths. Then, they are thresholded for detecting the uncertainty transitions with
three thresholds ( 1 , 2 and 3 ) as proposed in [28]. Finally, these detections are combined by
means of a finite-state machine to decide the tracker condition: focused on the target, scanning
the video frame for the target or locking on the target after a tracking failure [28]. Figure 14
shows an example of such estimation of tracker condition.
Then, we use time-reversed analysis to check the tracker recovery when it focuses on an
object after unsuccessful operation as it might be on a distractor (background objects with
features similar to those of the target). This analysis is based on applying a tracker in reverse
direction from this recovery instant until a reference point (the last time instant when the tracker
was successful) [28]. Effective tracker recovery after failure is determined by thresholding (with
4 ) the spatial overlap between the tracker to be evaluated and the reverse tracker at the
reference point. Note that the time-reversed analysis is required as the uncertainty is only able to
determine if the tracker is following an object that might be the target or a distractor.
Figure 13 – Scheme of the performance evaluation approach without ground-truth data followed in
the EventVideo project [28]

D5.3v1 EventVideo test sequences, ground-truth and evaluation methodology 32
Figure 14 – Tracking results, tracker condition estimation and temporal segmentation for target H5
(occlusion_1 sequence; frames shown are 100, 140, 180 and 210). Tracking results and ground-truth
annotations are represented as green and red ellipses, respectively. (Green: successful tracking;
Red: unsuccessful tracking; Black: scanning; Cyan: locking in; Blue: locked on.)

D5.3v1 EventVideo test sequences, ground-truth and evaluation methodology 33
5. Conclusions In this document, we have presented the material to be used for performance evaluation
within the EventVideo project. In particular, we have selected some stages for evaluation: video
object segmentation, people modeling and detection, video object tracking and event detection.
Then, we have described the datasets used in section 3 (CVSG, PDds, SOVTds, ASODds y
EDds; all of them available at http://dymas.ii.uam.es/webvpu/en/recursos-publicos/datasets/)
and the methodologies for the evaluation of each stage in section 4. Moreover, a novel
methodology that does not follow the traditional approach based on ground-truth information
has been presented in section 4.2 for the video object segmentation and tracking stages.
Moreover, according to the scenario classification proposed in section 2.2 (with the
variables complexity and density), the datasets to be used in the EventVideo project can be
categorized as illustrated in the following figure.
Density
Low High
Complexity
Low
CVSG
PDds
SOVTds
ASODds
EDds
PDds (-)
ASODds (-)
High
CVSG
PDds (-)
SOVTds (-)
EDds (-)
Figure 15 – Classification of datasets according to criteria defined in section 2.2. The (-)
indicates that the dataset partially fulfills the requirements of such criterion.
As future work for this task of the EventVideo project, the selected datasets will be used
for comparing the most recent algorithms in order to evaluate the current status of the state-of-
the-art (and which of the criteria in Figure 15 could be considered as achieved). Moreover, we
will consider the extension of the datasets to cover the highest levels of the defined situations
and the inclusion of additional information to help visual analysis (such as depth and laser)

D5.3v1 EventVideo test sequences, ground-truth and evaluation methodology i
6. References [1] H. Dee and S.Velastin, “How close are we to solving the problem of automated visual
surveillance?”, Machine Vision and Applications, 19(5):329-343, May 2008
[2] B. Greoris, F. Bremond, M. Thonnat, “Real-time control of video surveillance systems with
program supervision techniques”, Machine Vision and Applications, 18(3):185-205, March
2007
[3] A. Baumann, M. Boltz, J. Ebling, M. Koenig, H. S. Loos, M. Merkel, W. Niem, J.
K.Warzelham, and J. Yu. “A review and comparison of measures for automatic video
surveillance systems”. EURASIP Journal on Image and Video Processing, 2008:1-30,
2008.
[4] E. Maggio and A. Cavallaro. Video tracking: theory and practice. Wiley, 2011.
[5] H.Wu, A. Sankaranarayanan, and R. Chellappa. “Online empirical evaluation of tracking
algorithms”. IEEE Trans. Pattern Anal. Mach. Intell., 32(8):1443–1458, Aug. 2010.
[6] J. C. SanMiguel, A. Cavallaro, J. M. Martinez “Evaluation of on-line quality estimators for
object tracking”, en Proc. of 2010 IEEE Int. Conf. on Image Processing, Hong Kong
(China), Septiembre 2010 , pp . 825-828
[7] L Caro Campos, J. C. SanMiguel y J. M. Martínez. “Discrimination of abandoned and
stolen object based on active contours “,en Proc. of 2011 IEEE Int. Conf. on Advanced
Video and Signal based Surveillance, Klagenfurt (Austria), Septiembre 2011 pp. 101-106,
[8] J.C. SanMiguel and J.M. Martínez, "Robust unattended and stolen object detection by
fusing simple algorithms", Proc. of IEEE Int. Conf. on Advanced Video and Signal based
Surveillance, AVSS2011, SantaFe (NM, USA), pp. 18-25.
[9] J. C. SanMiguel, M. Escudero-Viñolo, J. M. Martínez y J. Bescós, “Real-time single-view
video event recognition in controlled environments”, en Proc. of the 9th Int. Workshop on
Content-Based Multimedia Indexing, CBMI’2011, Madrid, España, Junio 2011, pp. 91-96.
[10] F. Tiburzi, M. Escudero, J. Bescós, J. M. Martinez: "A ground-truth for Motion-based
Video-object Segmentation", Proc. of 2008 IEEE International Conference on Image
Processing (ICIP), San Diego, (CA, U.S.A), pp. 17-20, 2008.
[11] http://imagelab.ing.unimore.it/vssn06/
[12] http://media.ee.ntu.edu.tw/Archer_contest/
[13] http://www.changedetection.net/
[14] Brutzer, Sebastian; Höferlin, Benjamin; Heidemann, Gunther: “Evaluation of Background
Subtraction Techniques for Video Surveillance”, Proc. of Computer Vision and Pattern
Recognition (CVPR), Colorado Springs (CO, USA), pp. 1937-1944, 2011.
[15] Alvaro García, Jose M. Martinez, Jesús Bescós: "A corpus for benchmarking of people
detection algorithms", Pattern Recognition Letters, 33 (2): pp. 152-156, January 2012,
ISSN 0167-8655
[16] “Mit traffic data set,” http://www.ee.cuhk.edu.hk/ xgwang/ MITtraffic.html, Last accessed,
24 May 2012.
[17] “Institut fur Algorithmen und Kognitive Systeme: Cars Dataset,”
http://i21www.ira.uka.de/image-sequences/, Last accessed, 24 May 2012
[18] “TRECVID 2009 Event Detection Dataset,” http://trecvid.nist.gov/trecvid.data.html, Last
accessed, 24 May 2012.
[19] S. Birchfield, “Elliptical Head Tracking Using Intensity Gradients and Color Histograms,”
http://www.ces.clemson.edu/ stb/research/headtracker/.

D5.3v1 EventVideo test sequences, ground-truth and evaluation methodology ii
[20] R. Vezzani and R. Cucchiara, “Video surveillance online repository (visor): an integrated
framework,” Multimedia Tools App., vol. 50, no. 2, pp. 359–380, nov 2010
[21] “SPEVI, surveillance performance evaluation initiative,” http://www.eecs.qmul.ac.uk/
andrea/spevi.html, Last accessed, 24 May 2012.
[22] PETS, “PETS, IEEE int. workshop perform. eval. track. surveill.,” Last accessed, 24 May
2012.
[23] “CAVIAR context aware vision using image-based active recognition,”
http://homepages.inf.ed.ac.uk/rbf/CAVIAR/, Last accessed, 24 May 2012.
[24] “I-LIDS dataset for avss 2007,” http://www.avss2007.org/, Last accessed, 24 May 2012.
[25] D. Doermann and D. Mihalcik. Tools and techniques for video performances evaluation. In
Proc. Of IEEE Int. Conf. on Pattern Recognition, pages 161-170, Cambrigde (UK), 23-26
Aug. 2000.
[26] C. Erdem, E. Sankur, and A. Tekalp. Performance measures for video object segmentation
and tracking. IEEE Trans. on Image Processing, 13(7):937-951, July 2004a
[27] Juan C. SanMiguel y José M. Martínez. “On the evaluation of background subtraction
algorithms without ground-truth“,en Proc. of 2010 IEEE Int. Conf. on Advanced Video and
Signal based Surveillance, Boston (USA), September 2010 pp. 180-187
[28] Juan C. SanMiguel, Andrea Cavallaro y José M. Martínez, “Adaptive online performance
evaluation of video trackers”, IEEE Transactions on Image Processing, 21(5): 2812-2823,
Mayo 2012
[29] Andriluka, M.; Roth, S.; Schiele, B.: "People-tracking-by-detection and people-detection-
by-tracking", Proc. of Computer Vision and Pattern Recognition (CVPR), Anchorage,
(Alaska, USA), pp. 1-8, 2008.
[30] Enzweiler, M.; Gavrila, D.M.: "Monocular Pedestrian Detection: Survey and Experiments"
IEEE Transactions on Pattern Analysis and Machine Intelligence, vol.31, no.12, pp.2179-
2195, Dec. 2009.
[31] Dollar, P.; Wojek, C.; Schiele, B.; Perona, P.: "Pedestrian detection: A benchmark", Proc.
of Computer Vision and Pattern Recognition (CVPR), Miami Beach (FL, USA), pp.304-
311, 2009.
[32] Ess, A.; Leibe, B.; Van Gool, L.; "Depth and Appearance for Mobile Scene Analysis",
Proc. of International Conference Computer Vision (ICCV), Rio de Janeiro (Brasil), pp.1-
8, 2007.
[33] N. Dalal and B. Triggs. Histograms of oriented gradients for human detection. In Proc. of
CVPR, pages 886-893, 2005.
[34] P. Dollár, C. Wojek, B. Schiele, and P. Perona. Pedestrian detection: An evaluation of the
state of the art. IEEE Transactions on Pattern Analysis and Machine Intelligence,
34(4):743-761, 2012.
[35] S. Munder and D. M. Gavrila. An experimental study on pedestrian classification. IEEE
Trans. on Pattern Analysis and Machine Intelligence, 28(11):1863-1868, 2006.
[36] M. Enzweiler and D. M. Gavrila. Monocular pedestrian detection: Survey and experiments.
IEEE Trans. on Pattern Analysis and Machine Intelligence, 31(12):2179-2195, 2009.
[37] M. Andriluka, S. Roth, and B. Schiele. People-tracking-by-detection and people-detection-
by-tracking. In Proc. of CVPR, pages 1�8, 2008.
[38] B. Leibe, A. Leonardis, and B. Schiele. Robust object detection with interleaved
categorization and segmentation. Int. Journal of Computer Vision, 77:259-289, 2008.
[39] C. Wojek, S. Walk, and B. Schiele. Multi-cue onboard pedestrian detection. In Proc. of
CVPR, pages 794-801, 2009.
[40] B. Leibe, E. Seemann, and B. Schiele. Pedestrian detection in crowded scenes. In Proc. of
CVPR, pages 878-885, 2005.

D5.3v1 EventVideo test sequences, ground-truth and evaluation methodology iii
Appendix
7. Additional datasets for evaluation In this appendix, we list additional datasets for the evaluation of the selected stages in the
EventVideo project.
7.1. Video object segmentation
7.1.1. VSSN2006
The VSSN Workshop 2006 [11] included a motion segmentation for surveillance
competition. The artificial data input sequences and corresponding ground-truth data were
provided in order to have a common framework for a fair comparison of the algorithms.
Description: Each test video will consist of a video consisting of some (maybe
dynamic) background and one or several foreground objects and a foreground mask
video (ground truth video) specifying each pixel belonging to a foreground object
(pixel values above 128; same pixel values belong to the same object, while
different values belong to different objects).
Number of sequences: 10 sequences with ground truth and 4 sequences without
ground truth.
Format: Color video of size 320x240 or 384x240 at 25 fps.
Segmentation ground-truth available: yes.
Estimated complexity: S1-S2.
7.1.2. IPPR06
The IPPR contest motion segmentation dataset [12] includes 3 different context of
walking persons.
Description: Simple dataset that includes 3 different context of walking persons and
the segmentation of person is provided.
Number of sequences: 3 sequences.
Format: Color video of size 320x240 at 5 or 15 fps.
Segmentation ground-truth available: yes.

D5.3v1 EventVideo test sequences, ground-truth and evaluation methodology iv
Estimated complexity: S1.
Figure 16 – Sample frames for the IPPR06 dataset
7.1.3. Change Detection 2012
The IEEE Workshop on Change Detection 2012 [13] aims to initiate a rigorous and
comprehensive academic benchmarking effort for testing and ranking existing and new
algorithms for change and motion detection much.
Description: It is representative of indoor and outdoor visual data captured today in
surveillance and smart environment scenarios. This dataset contains 6 video
categories with 4 to 6 videos sequences in each category.
Number of sequences: 31 sequences.
Format: Color video or thermal JPEG frames of multiple sizes.
Segmentation ground-truth available: yes.
Estimated complexity: S1-S2.
Figure 17 – Sample frames for the Change Detection dataset

D5.3v1 EventVideo test sequences, ground-truth and evaluation methodology v
7.1.4. SABS
The SABS (Stuttgart Artificial Background Subtraction) dataset [14] is an artificial dataset
for pixel-wise evaluation of background models. The use of artificial data enables to separably
judge the performance of background subtraction methods for each of the challenges
background subtraction has to cope with.
Description: The dataset consists of video sequences for nine different challenges of
background subtraction for video surveillance. These sequences are further split into
training and test data. For every frame of each test sequence ground-truth annotation
is provided as color-coded foreground masks.
Number of sequences: 9 sequences.
Format: Color video of size 800x600 at 30 fps.
Segmentation ground-truth available: yes.
Estimated complexity: S1-S2.
Figure 18 – Sample frames for the SABS dataset: Ground-truth annotation, frame of artificial
video footage and Shadow annotation
7.2. People modelling and detection
7.2.1. TUD-Pedestrians
The TUD Pedestrians dataset [29] from Micha Andriluka, Stefan Roth and Bernt Schiele
consists of training images and test sequences.
Description: The TUD pedestrian dataset consists of 250 images with 311 fully
visible people with significant variation in clothing and articulation and 2 video

D5.3v1 EventVideo test sequences, ground-truth and evaluation methodology vi
sequences with highly overlapping pedestrians with significant variation in clothing
and articulation.
Number of sequences: 2 sequences, 272 frames.
Format: Color video frames of size 640x480.
People detection ground-truth available: yes.
Estimated complexity scenario: S3.
Figure 19 – Sample frames for the TUD-Pedestrians dataset
7.2.2. DCII
Description: The Daimler Mono Pedestrian Detection Benchmark Data Set II [30]
consist of a large sequence captured from a moving vehicle in a 27-minute drive
through urban traffic.
Number of sequences: 1 sequences, 21791 frames.
Format: Color video frames of size 640x480.
People detection ground-truth available: yes.
Estimated complexity scenario: S3.

D5.3v1 EventVideo test sequences, ground-truth and evaluation methodology vii
Figure 20 – Sample frames for the DCII dataset
7.2.3. Caltech Pedestrian Dataset
The Caltech Pedestrian Dataset [31] consists of approximately 10 hours of 640x480 30Hz
video taken from a vehicle driving through regular traffic in an urban environment. About
250,000 frames (in 137 approximately minute long segments) with a total of 350,000 bounding
boxes and 2300 unique pedestrians were annotated. The annotation includes temporal
correspondence between bounding boxes and detailed occlusion labels.
Description: Approximately 10 hours of 640x480 30Hz video taken from a vehicle
driving through regular traffic in an urban environment.
Number of sequences: 1 sequences, 250000 frames.
Format: Color video frames of size 640x480.
People detection ground-truth available: yes.
Estimated complexity scenario: S3.
Figure 21 – Sample frames for the Caltech Pedestrian dataset

D5.3v1 EventVideo test sequences, ground-truth and evaluation methodology viii
7.2.4. ETHZ
Description: Data [32] was recorded using a pair of AVT Marlins mounted on a
chariot, with a resolution of 640 x 480 (bayered), and a framerate of 13-14 FPS. For
each dataset, it provides the unbayered images for both cameras, the camera
calibration, as well as the set of annotations. Depth maps were created based on this
data using the publicy available belief-propagation-based stereo algorithm of
Huttenlocher and Felzenszwalb.
Number of sequences: 4 sequences, 2293 frames.
Format: Stereo-color video frames of size 640x480.
Tracking ground-truth available: yes.
Estimated complexity scenario: S3.
Figure 22 – Sample frames for the ETHZ dataset
7.3. Video object tracking
7.3.1. SPEVI
The Surveillance Performance EValuation Initiative (SPEVI) [21] is a set of links of
publicly available datasets for researches. The videos can be used for testing and evaluating
video tracking algorithms for surveillance-related applications. Two datasets are especially
interesting regarding the tracking evaluation and they are described as follows.
Single Face Dataset
Description: this is a dataset for single person/face visual detection and tracking.
The sequences include different illumination conditions and resolutions.
Number of sequences: 5 sequences, 3018 frames.

D5.3v1 EventVideo test sequences, ground-truth and evaluation methodology ix
Format: individual JPEG images.
Tracking ground-truth available: yes
Estimated complexity scenario: S1
Multiple Face Dataset
Description: this is a dataset [21] for multiple people/faces visual detection and
tracking. The sequences (same scenario) contain 4 targets which repeatedly occlude
each other while appearing and disappearing from the field of view of the camera.
Number of sequences: 3 sequences, 2769 frames.
Format: individual JPEG images.
Tracking ground-truth available: yes.
Estimated complexity scenario: S1
Figure 23 – Sample frames for the SPEVI dataset (top: single object, down: multiple object)
7.3.2. ETISEO
ETISEO [35] is a video understanding evaluation project that contains the following data:

D5.3v1 EventVideo test sequences, ground-truth and evaluation methodology x
Description: it contains indoor and outdoor scenes, corridors, streets, building
entries, subway.... They also mix different types of sensors and complexity levels.
Number of sequences: 86 sequences.
Tracking ground-truth available: yes.
Estimated complexity scenario: S1-S3
Figure 24 – Sample frames for the ETISEO dataset
7.3.3. PETS
PETS [22] is the most extended database nowadays. A new database is released each year
since 2000, along with a different challenge proposed. With the algorithms provided researchers
can test or develop new algorithms. The best ones are presented in the conference held each
year.
Since the amount of data is extensive and cover real situations, these databases are by far the
most used and are almost considered a de facto standard. Despite this, it is important to say that
the PETS databases are not ideal. One of its disadvantages is the fact that since PETS became a
surveillance project, the challenges proposed are focused on high level applications of that field,
leaving aside the tracking approach. Therefore, some important issues (such as illumination or
target scale changes) are not considered.
PETS2000
Description: Outdoor people and vehicle tracking (single camera).
Number of sequences: 1 set of training and test sequence.
Training sequence: 3672 frames.
Test sequence: 1452 frames.
Formats: MJPEG movies and JPEG frames.

D5.3v1 EventVideo test sequences, ground-truth and evaluation methodology xi
Tracking ground-truth available: no.
Estimated complexity scenario: S1
PETS 2001
Description: Outdoor people and vehicle tracking (two synchronized views; includes
omnidirectional and moving camera). Challenging in terms of significant lighting
variation, occlusion, scene activity and use of multi-view data.
Number of sequences: 5 sets of training and test sequences
Training sequences: 1st) 3064 frames. 2nd) 2989 frames. 3rd) 5563 frames. 4th)
6789 frames. 5th) 2866 frames.
Test sequences: 1st) 2688 frames. 2nd) 2823 frames . 3rd) 5336 frames. 4th) 5010
frames. 5th) 2867 frames.
Formats (for each set): MJPEG movies and JPEG frames.
Tracking ground-truth available: no.
Estimated complexity: S1
PETS 2006
Description: Multicamera person and baggage detection in a train station. Scenarios
of increasing complexity, captured using multiple sensors.
Number of sequences: 7 sets with 4 cameras each.
Formats (for each set): MJPEG movies and JPEG frames.
Tracking ground-truth available: no.
Estimated complexity: S1-S3

D5.3v1 EventVideo test sequences, ground-truth and evaluation methodology xii
Figure 25 – Sample frames for the PETS2006 dataset
PETS 2007
Description: multicamera setup containing the following scenarios: loitering;
attended luggage removal (theft) and unattended luggage with increasing scene
complexity.
Number of sequences: 1 training set + 9 testing sets.
Formats (for each set): JPEG frames.
Tracking ground-truth available: no.
Estimated complexity: S1-S3
Figure 26 – Sample frames for the PETS2007 dataset
PETS 2010
Description: multicamera setup containing di_erent crowd activities (these datasets
are the same as used for PETS2009).

D5.3v1 EventVideo test sequences, ground-truth and evaluation methodology xiii
Number of sequences: 1 training set + 3 testing sets.
Estimated complexity: S1-S3
Figure 27 – Sample frames for the PETS2010 dataset
7.3.4. CAVIAR
The main objective of CAVIAR [23] is to address the scientific question: Can rich local
image descriptions from foveal and other image sensors, selected by a hierarchical visual
attention process and guided and processed using task, scene, function and object contextual
knowledge improve image-based recognition processes [REF]. Several methods were researched
in order to address this question, including different areas, and the results were integrated in a
closed-loop object and situation recognition system.
Description: this dataset includes sequences of people walking alone, meeting with
others, window shopping, entering and exiting shops, fighting and passing out and
leaving a package in a public place. All video clips were filmed with a wide angle
camera lens, and some scenarios were recorded with two different points of view
(synchronized frame by frame).
Number of sequences: INRIA (1st set): 6 sequences, Shopping Center in Portugal
(2nd
set): 11 sequences, 6 different scenarios.
Formats (for both sets): MJPEG movies, JPEG frames, XML ground-truth.
Tracking ground-truth available: yes.
Estimated complexity: S1

D5.3v1 EventVideo test sequences, ground-truth and evaluation methodology xiv
Figure 28 – Sample frames for the CAVIAR dataset
7.3.5. VISOR
The VIdeo Surveillance Online Repository is an extensive database containing a large set of
multimedia data and the corresponding annotations. The repository has been conceived as a
support tool for different research projects [20]. Some videos are available publicly; however,
most of them are restricted and can only be viewed after a registration. The videos in the
database cover a wide range of scenarios and situations, including (but not limited to) videos for
human action recognition, outdoor videos for face detection, indoor videos for people tracking
with occlusions, videos for human recognition, videos for vehicles detection and traffic
surveillance.
Description: this dataset includes several videos with a wide range of occlusions
caused by objects or people in the scene. All of them include base annotations and
some also include automatic annotations.
Number of sequences: 6 sequences.
Format: MJPEG movies.
Tracking ground-truth available: no.
Estimated complexity: S1

D5.3v1 EventVideo test sequences, ground-truth and evaluation methodology xv
Figure 29 – Sample frames for the VISOR dataset
7.3.6. iLids
The Imagery Library for Intelligent Detection Systems (i-Lids) bag and vehicle detection
challenge was included in the 2007 AVSS Conference [21].
Description: this dataset includes several sequences for two separate tasks: _rst, an
abandoned baggage scenario and second, a parked vehicle scenario.
Number of sequences: 7 sequences (3 for Task 1, 4 for Task 2)..
Format: JPEG images, 8-bit color MOV, XML for ground-truth.
Tracking ground-truth available: no.
Estimated complexity: S1-S2-S3
Figure 30 – Sample frames for the i-LIDS dataset

D5.3v1 EventVideo test sequences, ground-truth and evaluation methodology xvi
7.3.7. Clemson dataset
Included in an elliptical head tracking project by Stan Birchfield there is a series of videos
very interesting for head tracking. The sequences include issues such as occlusion, rotation,
translation, clutter in the scene, change in the target's size, etc. The tracker as well as the
sequences can be found at the web [19].
Description: this dataset includes several sequences for head tracking with di_erent
targets.
The videos include some of the most important issues for tracking algorithms.
Number of sequences: 16 short sequences (1350 frames in total).
Format: BMP images.
Ground-truth available: yes.
Estimated complexity: S1-S2
Figure 31 – Sample frames for the CLEMSON dataset
7.3.8. MIT Traffic Dataset
MIT traffic dataset is for research on activity analysis and crowded scenes. It includes a
traffic video sequence of 90 minutes long recorded by a stationary camera. The size of the scene
is 720 by 480. More information regarding this work can be found in [16].
Description: this dataset includes several clips regarding traffic. It contains a
representation of most of the issues previously described, making this a very
interesting dataset.

D5.3v1 EventVideo test sequences, ground-truth and evaluation methodology xvii
Number of sequences: 1 sequence, 165880 frames divided in 20 clips.
Estimated complexity: S1-S2
Figure 32 – Sample frames for the MIT traffic dataset
7.4. Event detection
In this section, we list the existing datasets for abandoned and stolen object detection task.
They are:
7.4.1. PETS 2006
URL: http://www.cvg.rdg.ac.uk/PETS2006/data.html
This dataset consists on different examples of left-luggage events, with increasing
scene complexity in terms of nearby people. A total of 6 left-luggage events in a
railway station are recorded by four cameras positioned at different angles (28
videos in total). Videos from this data set are between 1 and 2 minutes long, with
standard PAL resolution (768x576 pixels, 25fps).
7.4.2. PETS 2007
URL: http://www.cvg.rdg.ac.uk/PETS2007/data.html
This dataset contains 8 examples of abandoned luggage at an airport. Each event is
recorded by four different cameras. Additionally, a background training sequence is
provided. Complexity is defined with the following criteria: loitering, stolen luggage
and abandoned luggage. Video sequences have been recorded in a dense, crowded
scenario. Videos are between 2 and 3 minutes long, with standard PAL resolution
(768x576 pixels, 25fps).
7.4.3. AVSS 2007
URL: http://www.eecs.qmul.ac.uk/~andrea/avss2007_d.html

D5.3v1 EventVideo test sequences, ground-truth and evaluation methodology xviii
This dataset has 3 sequences containing abandoned object events at an underground
station, with 3 complexity levels: easy, medium, and hard, defined in terms of the
density of the crowd. Each sequence is about 3.5 minutes long, with PAL resolution.
7.4.4. CVSG
URL: http://www-vpu.eps.uam.es/CVSG/
In this dataset, different sequences have been recorded using chroma based
techniques for simple extraction of foreground masks. Then, these masks are
composed with different backgrounds. Provided sequences have varying degrees of
difficulty in terms of foreground segmentation complexity. Sequences contain
examples of abandoned objects and objects removed from the scene.
7.4.5. ViSOR
URL: http://www.openvisor.org/
This dataset is classified in different categories including outdoor and indoor events
(human actions, traffic monitoring, cast shadows. . . ). A total of 9 abandoned-object
sequences are included, recorded in an indoor setting. These are low-complexity
sequences. Videos are around 10 seconds long and are provided at 320x256@25fps
resolution.
7.4.6. CANDELA
URL: http://www.multitel.be/~va/candela/abandon.html
This dataset contains 16 examples of abandoned objects inside a building lobby,
with different interactions between object owners. Videos are around 30 seconds
long, provided at 352x288 resolution. Despite the simplicity of the scenario, the low
resolution and the relatively small size of objects present challenges for foreground
segmentation.
7.4.7. CANTATA
URL: http://www.multitel.be/~va/cantata/LeftObject/
Videos from these dataset contain examples of left objects. A total of 31 sequences
of 2 minutes have been recorded with two different cameras. Some videos include a
number of people leaving objects in the scene (abandoned objects) and other videos

D5.3v1 EventVideo test sequences, ground-truth and evaluation methodology xix
show people removing the same objects from the scene (stolen objects). Videos are
provided at standard PAL resolution, compressed using MPEG-4.
Figure 33 – Sample frames for available datasets of abandoned object detection