d5.3 report on validation of data quality management
TRANSCRIPT
ROad Safety ATTributes exchange infrastructure in Europe
ROSATTE is co-financed by the European Commission – DG INFSO Contract Number: 213467
D5.3 Report on validation of data
quality management concept and experiences from test sites
Version Number: 1.1 Produced by: University of Stuttgart Due Date: 31/10/2010
D5.3 Report on validation of data quality management conceptand experiences from test sites
Version 1.1 2 / 32 02/03/2011
Programme Name 7th Framework Programme – Specific Programme Cooperation – Theme 3 “Information and Communication Technologies”
Grant Agreement Number: 213467
Project acronym: ROSATTE
Project name: ROad Safety ATTributes exchange infrastructure in Europe
Project start and end: January 2008 – June 2010 (30 months)
EC Project Officer: Emilio Davila-Gonzalez
E-mail: [email protected]
Dissemination level1: PU
Title of document: Report on validation of data quality management concept and experiences from test sites
Work package: WP5
Author(s): <see document control sheet>
Project co-ordinator: Maxime Flament (ERTICO – ITS Europe)
Tel: +32 2 400 07 35, fax: +32 2 400 07 01
E-mail: [email protected] Abstract: This document describes the validation of the ROSATTE data quality management concept. Experiences from various test sites form an important part of the document and they are giving a better understanding of the occurring implications. The document concludes with the validation of the implemented QM concept and some reflections about possible improvements. Keyword list: Validation, Data quality, Quality management, Test sites
1 This is either: Public, restricted to other programme participants, restricted to a group specified by the consortium, confidential
D5.3 Report on validation of data quality management conceptand experiences from test sites
Version 1.1 3 / 32 02/03/2011
Document Control Sheet
Main author(s) or editor(s): Rainer Schützle, University of Stuttgart (editor) Jacek Frank, University of Stuttgart Camille Delorme, AREA (ASFA) Franck Petit, Cofiroute (ASFA) Per-Olof Svensk, Triona Lars Wikström, Triona Per Isaksson, STA Bert Boterbergh, Vlaamse Overheid Hamish Keith, Traffic For London Ulrich Haspel, OBB Work area: WP 5 - Quality, test and validation of the data chain Document title: Report on validation of data quality management concept
and experiences from test sites
Version history:
Version number
Date Main author Summary of changes
0.1 05/10/2010 R. Schützle, J. Frank
Initial draft document
1.0 28/01/2011 R. Schützle, J. Frank
final document
1.1 21/02/2011 R. Schützle Inclusion of Peer Review comments
Approval:
Name Date
Prepared Rainer Schützle (USTUTT) 21/02/2011
Reviewed Peer Reviewers 21/02/2011
Authorized Maxime Flament (ERTICO) 01/03/2011
Circulation:
Recipient Date of submission
ROSATTE Consortium 25/02/2011EC 02/03/2011

D5.3 Report on validation of data quality management conceptand experiences from test sites
Version 1.1 4 / 32 02/03/2011
Table of Contents
Executive summary 7
1 Introduction 8
1.1 ROSATTE Contractual References 8
1.2 Project Objectives 8
1.3 Key issues / Project scope 8
1.4 Purpose of the document 9
1.5 Structure of the document 9
2 Recall ROSATTE QM concept 11
3 Applied Quality Management concept 13
3.1 Application and concretization of the QM concept (DMADV) 13
3.2 Support of product / tool development 16 3.2.1 Support of data acquisition tool development in Bavaria 16 3.2.2 AGORA pre-testing 16
3.3 Test site coordination 17
4 Lessons learnt in field test sites 18
4.1 Lessons learnt from the Bavarian test site 18
4.2 Lessons learnt from London test site 20
4.3 Lessons learnt from the Flanders test site 23
4.4 Lessons learnt from the ASFA test site 24
4.5 Lessons learnt from the Swedish/Norwegian test site 26 4.5.1 Establishing a data store 26 4.5.2 Data exchange methods 26 4.5.3 Result of integration at Map Providers 26 4.5.4 Feedback 27
5 Validation of implemented QM concept 28
6 Conclusions and prospects 32
D5.3 Report on validation of data quality management conceptand experiences from test sites
Version 1.1 5 / 32 02/03/2011
Index of Tables
Table 1: Different Functional Road Class definitions .............................................. 22 Table 2: Critical reflection of the project realization ............................................ 28 Table 3: Recapitulation of requirements which are combined with validation indicators and evaluation methods as described in report D5.1 [7]. ........................................ 30 Index of Figures
Figure 1: The scope of ROSATTE ....................................................................... 9 Figure 2: General process flow ....................................................................... 15 Figure 3: ZEB database example ...................................................................... 18 Figure 4: Web-based editor for the Bavarian testsite ............................................. 19 Figure 5: Attribute correctness vs. effort for initial supply (from the EuroRoadS project) . 19 Figure 6: HMI created for ROSATTE to facilitate acces to the static speed limit database .. 25 List of Abbreviations
CTQ Critical to Quality DfSS Design for Six Sigma DMADV Define Measure Analyse Design Verify DMAIC Define Measure Analyse Improve Control/Check DPMO Defect per Million Opportunities FMEA Failure Mode and Effects Analysis LA Local Authorities MP Map Provider PDCA Plan Do Check Act QFD Quality Function Deployment QM Quality management QMS Quality management system RPN Risk Priority Number SAT Stand Alone Tool SIPOC Supplier Input Process Output Customers STREP Specific Targeted Research Project TQM Total Quality Management VOC Voice of Customer ZEB Zustandserfassung und –bewertung
(engl: Condition assessment and evaluation)
D5.3 Report on validation of data quality management conceptand experiences from test sites
Version 1.1 6 / 32 02/03/2011
References
1. ROSATTE, Annex I – Description of Work
2. ROSATTE, deliverable D1.1 State of the Art, 2008. Available from: http://www.ertico.com/publications/
3. ROSATTE, deliverable D1.2 Requirements and Overall Architecture, 2008. Available from: http://www.ertico.com/publications/
4. ROSATTE, deliverable D2.1 Conceptual specification of how to establish a data store, 2010. Available from: http://www.ertico.com/publications/
5. ROSATTE, deliverable D3.1 Specification of data exchange methods, 2009. Available from: http://www.ertico.com/publications/
6. ROSATTE, deliverable D4.1 Description of applicable and viable data integration methods, 2010. Available from: http://www.ertico.com/publications/
7. ROSATTE, deliverable D5.1 Test and validation plan, 2010. Available from: http://www.ertico.com/publications/
8. ROSATTE, deliverable D5.2 Report on data quality management concept, 2010. Available from: http://www.ertico.com/publications/
9. DIN EN ISO 9000:2005 Quality management systems
10. DIN EN ISO 9001:2007 Quality management systems: requirements
D5.3 Report on validation of data quality management conceptand experiences from test sites
Version 1.1 7 / 32 02/03/2011
Executive summary This document gives a description of the final validation of ROSATTE's own data quality management concept and an overview about experiences made at the different test sites during the course of the project. The key points of the ROSATTE QM concept are presented again in a summarized form. This recap provides the necessary introduction to the steps of validation. The application and in a few cases the concretization of the QM concept are discussed and described in more details. As next, experiences from different test sites are presented and the lessons learnt are shown in specific details. Finally a closer look is made to the validation method itself.
D5.3 Report on validation of data quality management conceptand experiences from test sites
Version 1.1 8 / 32 02/03/2011
1 Introduction
1.1 ROSATTE Contractual References ROSATTE is a STREP submitted for the call FP7-ICT-2007-1. It stands for ROad SAfety ATTributes exchange infrastructure in Europe. The Grant Agreement number is 213467 and project duration is 30 months, effective from 01 January 2008 until June 2010. It is a contract with the European Commission, DG INFSO. The EC Project Officer is:
Emilio Davila-Gonzalez EUROPEAN COMMISSION DG INFSO.G.4 - ICT for Transport Office BU31 4/50 B-1049 Brussels Tel: +32 2 296 21 88 E-mail: [email protected]
1.2 Project Objectives The ROSATTE project intends to develop the enabling infrastructure and supporting tools that will ensure European access to road safety attributes including incremental updates. This infrastructure will facilitate administrative internal functions as well as supply of data to third parties e.g. for safety relevant services. The overall objectives of the project are to:
1. Facilitate access to, exchange and maintain European-wide core road safety spatial data from national/regional/local sources by standard procedures
2. Enable multi-level aggregation and update of European-wide safety map data 3. Assess the technical and organizational feasibility of this infrastructure
1.3 Key issues / Project scope Accurate and up-to-date safety related road network attributes are particularly important for efficient road operation and administration, and for safe driving along the European road network. For data users, the reality today is however a rather complex landscape of multiple data providers, multiple formats, varying availability and quality of data and long delays between data updates. Road authorities and infrastructure operators are usually at the beginning of the information chain, being responsible for the physical implementation, equipment and maintenance of roads. The major problem is how to ensure timely and easy access to road information owned and maintained by thousands of road authorities. In addition mechanisms are needed to enhance the quality of the available data in terms of accuracy, correctness and up-to-datedness, and to enable multi-level (local/national/European) aggregation of the data. With respect to a future continuous delivery and integration of updates of road attribute data, road authorities that provide such updates will be responsible for the timeliness delivery (within an agreed time period after the change of the attribute on the road), and for the correctness and positional accuracy of the data. Data integrators on their side will be responsible for correct interpretation of the received data, and correct inclusion in their digital map databases. For certain safety critical attributes, an independent

D5.3 Report on validation of data quality management conceptand experiences from test sites
Version 1.1 9 / 32 02/03/2011
certification body may be created that will be responsible for surveillance of the methods and procedures used.
Figure 1: The scope of ROSATTE
1.4 Purpose of the document This document provides the description of the validation concept of the data quality management. In the previous document D5.2, the data QM concept adapted to the needs of the ROSATTE project was presented. Very often theoretical assumptions can differ from the actual realization in the field and if necessary the concept has to be adjusted accordingly afterwards. Validation assures that the concept complies with predefined specifications and every step of the project is feasible. This document at first shows the application and concretization of the previously discussed ROSATTE QM concept. Then experiences from all participating test sites are included. By virtue of these experiences and delivered data sets the compliance with the planning or any discrepancies are identified effectively. The final validation will underline the weaknesses and possible improvements. A critical consideration will show if the conceptual framework meets the requirements. Validation is an important measure, without that an assessment of work that previously was carried out wouldn't be possible. Apart from the validation process, the document shows also smaller measures that are indispensable to carry out an adapted QM concept.
1.5 Structure of the document Not taking into account the introduction section the document consists of the following chapters: Chapter 2 - Recall ROSATTE QM concept The most important key points of the ROSATTE QM concept are described here again to allow a better understanding of the conceptual foundation which leads up to the practical implementation in the further chapters.
D5.3 Report on validation of data quality management conceptand experiences from test sites
Version 1.1 10 / 32 02/03/2011
Chapter 3 - Applied Quality Management concept This chapter compiles all phases of the quality management concept developed in a previous document D5.2 [8]. Particular attention is paid to application and concretization of the QM concept in the predefined DMADV cycle. Additional remarks about support, tool development and test site coordination are completing the chapter. Chapter 4 - Lessons learnt in field test sites In this chapter the experiences and observations can be found from different test sites all made during the course of the ROSATTE project especially with respect to data quality issues. Details may differ from test site to test site, but as a whole the experiences are providing an excellent overview of the practical applications of the designed QMS. Chapter 5 - Validation of implemented QM concept Validation ensures that the arranged and prepared QM concept fulfils all the necessary specifications. The chapter deals with the critical examination of the project realization and contains recommendations for possible improvements. Chapter 6 - Final conclusions and prospects In the final chapter conclusions are summed up and an outlook is given about the future development possibilities and improvements which could be realized or further researched.
D5.3 Report on validation of data quality management conceptand experiences from test sites
Version 1.1 11 / 32 02/03/2011
2 Recall ROSATTE QM concept The concept of a QM for ROSATTE has been described already in deliverable D5.2 “Report on data quality management concept” [8]. Only with a formulated concept the next step to estimate, improve and control quality can be taken by applying the theory into practice. The realization of the corresponding procedure is known as validation and the main focus of this report. For better understanding a short summary of the QM concept will be given first. A standard QM concept was chosen and applied at the beginning of the project. Throughout duration of the ROSATTE project the QM has been trimmed/ adapted to the specific problems which occurred. As a result it became possible to react appropriately to individual characteristics and requirements. From the very beginning the main objective as such was not the usage of a ready application for QM during the development phase but rather the (further) development of existing QM concepts regarding concrete ROSATTE conditions/requirements and towards a fully developed QM approach for the use in coming ROSATTE implementations. The ROSATTE project concentrates on the development of exchange infrastructure for quality assured road safety attributes. A quality management system is therefore a necessity, which has been developed and implemented according to the particular project related environment. The quality management concept relies on the worldwide recognised ISO standards and includes important requirements on data quality ([9] and [10]). In D5.2, the quality management fundamentals have been described as well as the most common, and for purpose of this project, relevant concepts, which are the cornerstone of a successful realization of such an undertaking. As conclusion of the D5.2 document the Six Sigma concept has been chosen for the ROSATTE QMS. The nature of Six Sigma allows at the same time to develop or realize an ideal data processing chain with different methods and tools but also it can be used for process improvement (for a detailed description of Six Sigma see [8]). The reason for Six Sigma`s success lies in its ability for adaptation in changing environments – in other words it`s not a continuous process. It`s being applied only if necessary and it ends after the improvement. Such approach is least intruding and in result sufficient and very efficient. The proposed ROSATTE concept is composed of two parts, the QM for quality assured project development and QM for process improvement. The first part helps to develop methods and tools for the exchange of road safety features that fulfill the user requirements and it ensures the right proceedings for a continuous monitoring of data quality for future implementations. The second part provides on the other hand a methodology for improving processes in case of adapted user requirements or because of error detections. The QM methods for quality assured project development as well as the QM methods for process improvement are based on the six sigma methodology design. The first QM concept consists of the five phases define, measure, analyse, design and verify (DMADV). The latter one consists of the phases define, measure, analyse, improve and check/control (DMAIC). All of the phases are described in report D5.2 in detail. The use of these mechanisms allows not only to develop a project but also to find individual solutions for problems concerning location referencing, communication, data format and many others.
D5.3 Report on validation of data quality management conceptand experiences from test sites
Version 1.1 12 / 32 02/03/2011
Under the section “Quality Management Tools” two categories were described more detailed the “QM tools for quality assured project development” and the “QM tools for process improvement”. Furthermore some item will be described more closely. Feedbacks from users are being used as Voices of Customers (VOS) and transformed into so-called “Critical to Quality” parameters (CTQ). More precisely the most important CTQs called Ys are implemented by using the Kano-model. Further an approximated project flow is fixed and “Suppliers Inputs Process Outputs Customers analysis” (SIPOC) has to be performed to find the single project steps. In the measure phase corresponding parameters are looked for using Quality Function Deployment (QFD). As an additional method Brainstorming is conducted by the project team. Some of the chosen parameters are representing several CTQs and are more likely to be meaningful to the conducted measurements which can be identified with the formula presented in the respective paragraph. The analyze phase serves the purpose of finding out the origins of an occurred problem. Brainstorming and the use of Ishikawa diagram are the proposed tools to conduct a thorough examination step by step. Simulations, tests of significance and testing for any correlations can help to track down the cause of failure. The improve phase results in the final elimination of the cause or causes of failure within the real process. The approach for the solutions is once more conducted by brainstorming and the results integrated in the process flow. Failure mode and effects analysis (FMEA) allows minimize or avoid any risks for the process. At the end the control phase is being applied to verify the findings. At this stage all partners involved in the project should be informed about the implemented improvements. At the end of the report several practical recommendations were given how to ensure quality assured implementations of methods and tools developed during the project. The data acquisition tool has been divided in three groups. The first one is particularly concerned about prevention of erroneous data input. Already the design of the tool’s user interface can have an important impact on the data quality. For example avoiding entries of free text has shown itself already beneficial, input opportunities should be provided in a logical order and the interface should be able to change its appearance according to prior decisions made by the user. Automated checks for completeness and consistency are the second relevant group. According to this point new entries should immediately be checked against the ROSATTE data specifications and if necessary rejected because of inconsistency. Because data formally correct could be still wrong plausibility checks are proposed and recommended which is the third group of the data acquisition tool. Another quality assurance measure is location referencing encoding and decoding. In case of location referencing encoding guidelines for AGORA location referencing are publicly available. However it was observed that these guidelines allow different interpretations. As a conclusion a suggestion to find a common understanding of the guidelines/rules and to further improve them. In summary, a common understanding about the necessary requirements between the project participants is of highest importance, e.g. in case of location referencing. Implementation rules developed within ROSATTE should be always taken into account.
D5.3 Report on validation of data quality management conceptand experiences from test sites
Version 1.1 13 / 32 02/03/2011
3 Applied Quality Management concept
3.1 Application and concretization of the QM concept (DMADV) The quality management concept developed in D5.2 [8] was applied to all development tasks within ROSATTE. The major importance of the quality was internalized by all partners involved. So the major concern throughout the complete design and development phase was to have a working data exchange infrastructure with proved and reliable results at the end. The individual phases of the applied DMADV concept were followed by the partners. The practical workflow and the involved partners or roles will be described in the following. Special focus will be put on the processes for exchange and analysis of test data between different local authorities and map providers. Due to the number of involved partners and also some IPR issues, it was necessary to have an independent validation body in the project. This was the central institution, where all intermediate and final results were gathered and analysed. 1. Define All organizational issues necessary to set-up the project were documented in the ROSATTE Annex I – Description of work (Annex I) [1]. In this document, the problems that the projects aim to solve together with the goals that are to be reached were formulated. These project objectives are based on the needs of possible applications and/or users that could make use of the resulting ROSATTE data. The project partners are also named and a detailed description of tasks and corresponding project milestones are given. The Annex I therefore clearly is the basis for all the work performed within this project. 2. Measure The purpose of this phase is to identify possible customers or applications that may use the results developed within ROSATTE. The detailed project requirements are then to be derived from these customers. Finally, these requirements are further processed to get measurable parameters with which it is possible to assess the quality of the results with respect to the defined requirements. The first part of identifying customers and defining requirements was done within Work Package 1 - Requirements and overall architecture (WP 1). Deliverable D1.1 State of the art [2] contains the results of a survey within 23 countries. It gives a detailed overview of the different levels of development concerning road safety attributes in road databases of the countries that participated in the survey. The document was very helpful by describing the current situation in different countries and laying the ground for the ROSATTE developments. The second WP 1 deliverable D1.2 – Requirements and overall architecture [3] was structured in four viewpoints, functionality, processes, information and components. The users, roles and entities relevant for the project and especially their requirements were derived in that document. The user requirements were collected with the help of a questionnaire based survey among road authorities and map providers. These user requirements were then detailed in the so-called system requirements. In the end, these requirements were a very good first draft of the processes and functionality of the ROSATTE data exchange infrastructure. 3. Analyse The system requirements were then further detailed leading to specifications for data storage and maintenance at the road authorities (D2.1 [4]), the data exchange format

D5.3 Report on validation of data quality management conceptand experiences from test sites
Version 1.1 14 / 32 02/03/2011
(D3.1 [5]) and the data integration methods at the map providers (D4.1 [6]). Fortunately, the partners contributed with a big variety of experiences in all these three topics. Different possible methods were worked out and compared in order to get the best possible solution in the end. The specifications were derived from the partners’ knowledge and experiences as well as on experiences from other relevant projects. Big discussions took place for instance for
• Data service specification • Data content specification
o Location referencing method o Definition and modeling of safety features
4. Design However, up to this point nothing was implemented at the test sites. So the partners then took the specifications and applied them to their individual test site environments. Although it was planned to develop and implement common methods tools in the test sites, it soon turned out that from a practical point of view this would not be feasible. This is mainly because the test sites differ significantly in several major aspects. The data acquisition workflow and internal organization at the local road authorities is quite heterogeneous across Europe. They are all responsible for the road maintenance in general. However, the detailed duties of the authorities differ slightly and therefore also the road information is stored for different purposes. This leads to significant differences in the structure of the used road databases. And finally all participating authorities use different database management systems, and especially important, different digital road maps. So in the end, every test site had to develop and implement an individual solution adapted to the concrete situation at the test site. However, all these different implementations have to meet the same requirements and deliver data with the same quality in the end. Therefore the available knowledge and experiences was shared among the partners to achieve best possible and (most important) harmonized results. 5. Verify The last step of the DMADV methodology, the developed methods and tools are to be verified, whether they fulfill the requirements defined at the beginning. This step was one of the most important and most difficult. In ROSATTE, many different partners at the different test sites contributed with developments that in the end should work and fit together quite smoothly. Therefore it was very important to check the interactivity on a regular basis. For this purpose, road safety feature data needed to be exchanged and processed along the exchange infrastructure to be developed. According to the status of development, the data was evaluated at different processing levels. As the goal of producing high-quality data in ROSATTE is taken very seriously, this verification was not done by the implementing partners. It was conducted by the University of Stuttgart (USTUTT) as an independent partner and assessment institution. For the verification itself, it was very helpful to have an independent view on the data and the data production processes. This eases or sometimes even allows the detection of errors or the derivation of alternative ideas or solutions.
D5.3 Report on validation of data quality management conceptand experiences from test sites
Version 1.1 15 / 32 02/03/2011
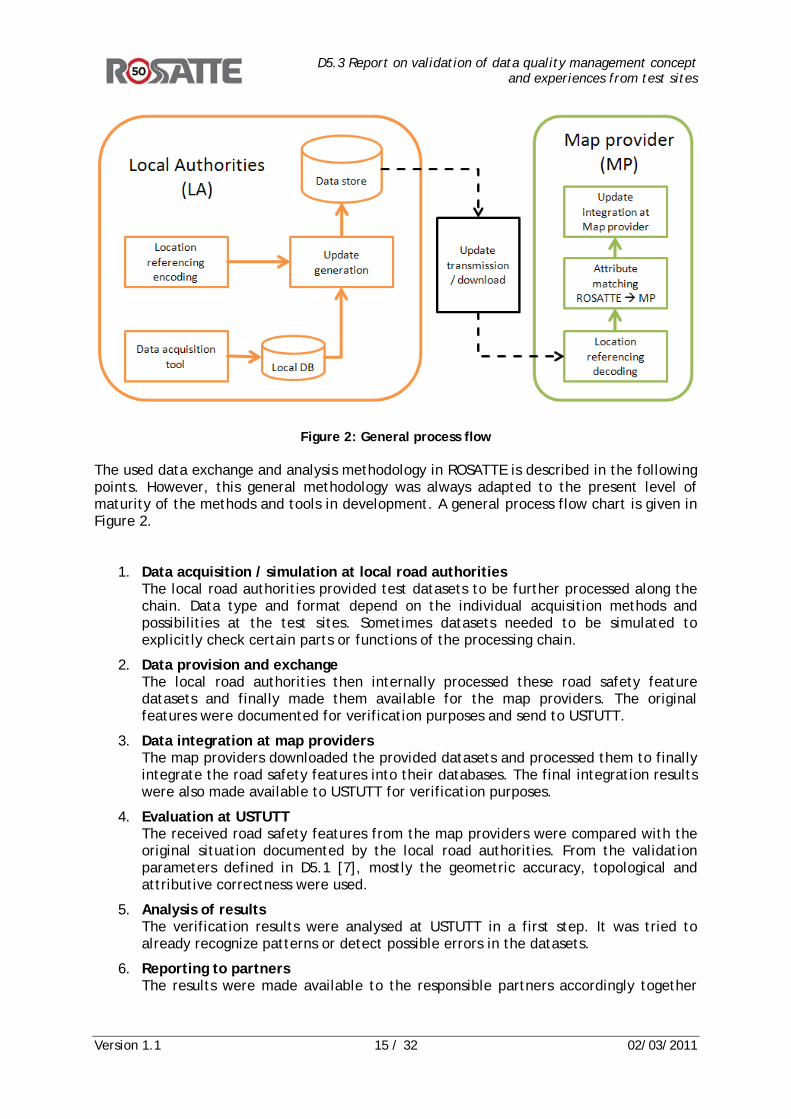
Figure 2: General process flow The used data exchange and analysis methodology in ROSATTE is described in the following points. However, this general methodology was always adapted to the present level of maturity of the methods and tools in development. A general process flow chart is given in Figure 2.
1. Data acquisition / simulation at local road authorities The local road authorities provided test datasets to be further processed along the chain. Data type and format depend on the individual acquisition methods and possibilities at the test sites. Sometimes datasets needed to be simulated to explicitly check certain parts or functions of the processing chain.
2. Data provision and exchange The local road authorities then internally processed these road safety feature datasets and finally made them available for the map providers. The original features were documented for verification purposes and send to USTUTT.
3. Data integration at map providers The map providers downloaded the provided datasets and processed them to finally integrate the road safety features into their databases. The final integration results were also made available to USTUTT for verification purposes.
4. Evaluation at USTUTT The received road safety features from the map providers were compared with the original situation documented by the local road authorities. From the validation parameters defined in D5.1 [7], mostly the geometric accuracy, topological and attributive correctness were used.
5. Analysis of results The verification results were analysed at USTUTT in a first step. It was tried to already recognize patterns or detect possible errors in the datasets.
6. Reporting to partners The results were made available to the responsible partners accordingly together
D5.3 Report on validation of data quality management conceptand experiences from test sites
Version 1.1 16 / 32 02/03/2011
with a detailed description of the analysis and, where possible, already with suggestions of improvement.
7. Improvement of implementations The partners responsible for the respective tools continued to find the detailed sources of error and improved the implementations accordingly. Sometimes it was also necessary to adjust the specifications. Although they were derived with the highest level of accurateness, in some cases the practical or prototypical implementation is necessary to prove their feasibility.
8. Restart of QM cycle, if necessary After changes or improvements in the processes or data formats, the QM cycle needed to be started again in order to finally come to a solution that fulfills the defined requirements and therewith delivers road safety features with a very high level of quality and reliability.
The following sections show some practical examples, how and where the quality management helped to support the partners with their development tasks. The quality management methodology also helped to coordinate the work between the partners.
3.2 Support of product / tool development This section presents some detailed examples, where the quality management concept was applied not only by the implementing partners, but where USTUTT supported important project developments with respect to data quality issues.
3.2.1 Support of data acquisition tool development in Bavaria
USTUTT has supported the data acquisition tool development in Bavaria from the beginning. In the conceptual phase the necessary requirements regarding error robustness, and error avoidance were defined. The preliminary work also included the identification of potential sources of error. The foundation had to be laid prior to the actual development. For the data entry itself design recommendations were given to minimize or even avoid any errors and delay elements. The identification of control possibilities to find erroneous data at a very early stage is also an excellent sign of the quality of response capability and necessary to provide an undisturbed process chain in the further improvement of the essential tools. As a result advice was given to pay special attention to control possibilities. Another point of high importance to an undisturbed process is the derivation of test possibilities to identify possible quality lacks. Providing suggestion and ideas for test possibilities was as well part of the support efforts.
3.2.2 AGORA pre-testing
USTUTT was quite active during the AGORA pre-testing phase in the project. Already in the design phase, the location referencing was identified as to have major influence on the project results and success on the one hand. On the other hand, only very little practical and for purposes of ROSATTE relevant experiences were available about the implementation and the reliability of these location referencing methods. Therefore, the implementation at the test sites was accompanied with intensive tests especially of the location referencing processes. The testing included location referencing encoding of test location datasets at the test sites and decoding at the two map providers. All possible test

D5.3 Report on validation of data quality management conceptand experiences from test sites
Version 1.1 17 / 32 02/03/2011
site – map provider combinations had to be tested at first to get an overview of the current status. From that, some test sites and the map providers started to improve their implementations, other test sites decided to change the used location referencing encoder or used encoders made available by the map providers. The test results were always analyzed carefully to identify the sources of error and already derive possibilities of improvement. By that methodology, partners were enabled to directly continue their software development with the latest test status in order to achieve an improved and properly working software status as soon as possible.
3.3 Test site coordination USTUTT also served as a central information exchange and coordination platform for the test sites. As such support could be offered in different sensitive sectors as communication or establishing a common point of view regarding data quality evaluation and validation. USTUTT provided the exchange of current experiences during the development between partners. The distribution of intermediate results was an important part of such an exchange. Corrections could be introduced more quickly this way. Identification of problems was relevant for all partners involved in the project, that is why a special emphasis was put on communication. Another main goal which never should be ignored was the achievement of a common point of view regarding the project and the individual tasks. Division of work and work towards a common goal are very important to achieve the project scope. The definition of common interfaces between partners was another main target during the course of the project. Usually common tools for data acquisition and maintenance considerably facilitate the workflow, e.g. an identical location referencing approach (AGORA or OpenLR). The development of common tools for ROSATTE has been investigated. However, the partners came to the conclusion that such common tools would not be developed in ROSATTE. This was because the public authorities at the test sites already had very different map databases and maintenance tools implemented and in use. In such cases, it would not be possible to incorporate a common tool in an existing workflow without considerable implementation efforts.
D5.3 Report on validation of data quality management conceptand experiences from test sites
Version 1.1 18 / 32 02/03/2011
4 Lessons learnt in field test sites This chapter presents contributions from the different test sites stating their ROSATTE experiences with respect to data quality.
4.1 Lessons learnt from the Bavarian test site In the test site Bavaria the quality tasks can be divided into three measures:
• Quality assurance within the internal data acquisition • Measures to ensure quality for the data entry using the editor • Quality measuring through a field survey
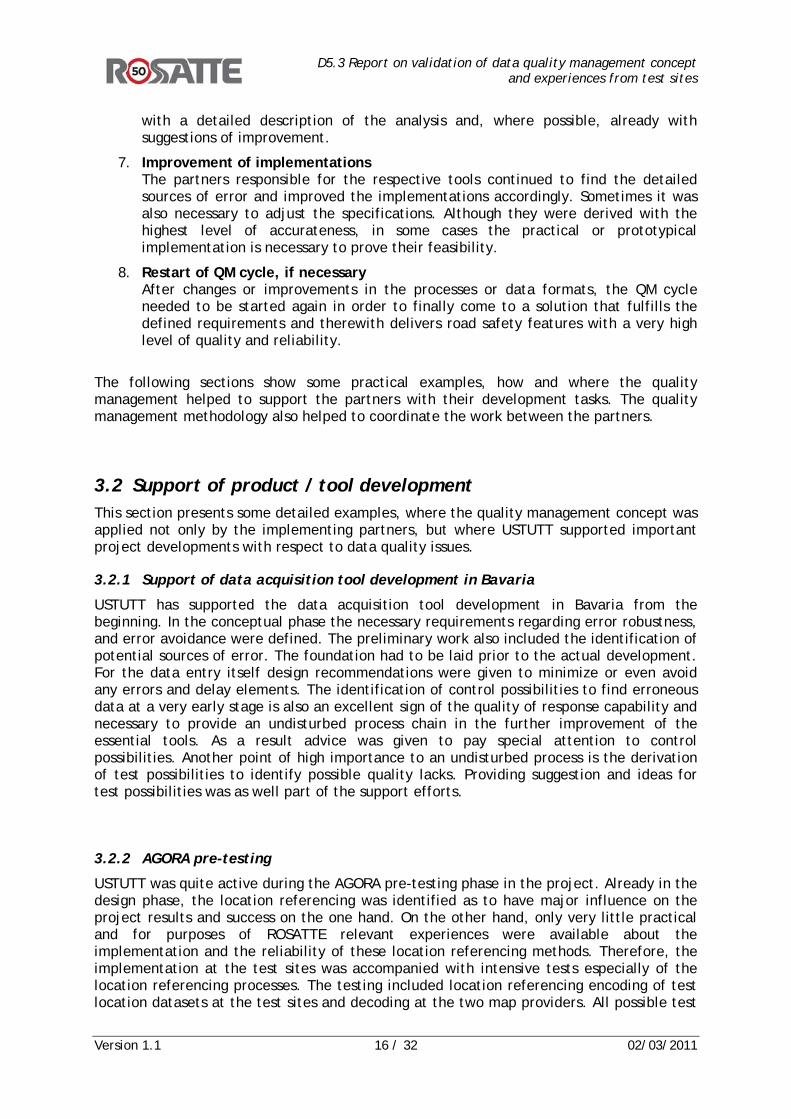
Several data sources were used to acquire speed limit data for the Bavarian test site. The most important is the ZEB picture database. In this database you can find a picture every 20 meters of any road stretch of the major road network (Autobahn, Federal Road, State Road and major District Roads) in Bavaria. This database can be used to extract road signs locations manually or also automatically using image processing. For the generation of these data the requirements are that all pictures have to contain a GPS coordinate and the exact mileage position. This ensures high data quality, but only for the roads covered.
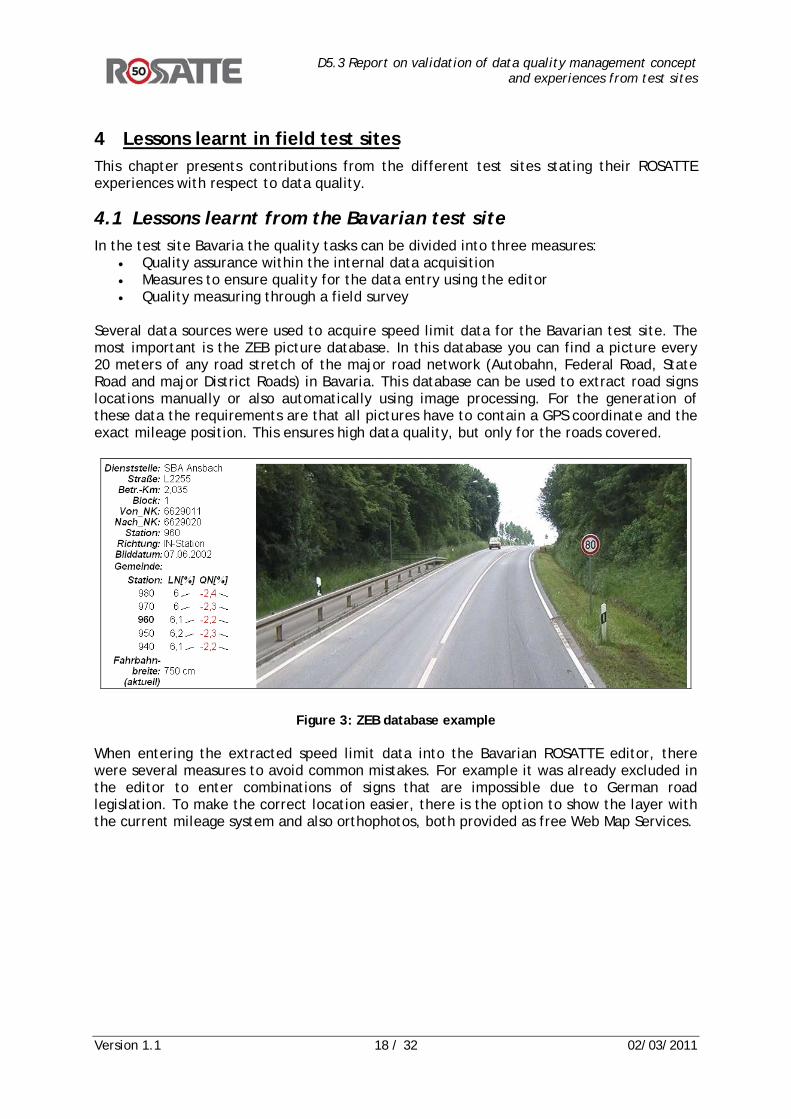
Figure 3: ZEB database example When entering the extracted speed limit data into the Bavarian ROSATTE editor, there were several measures to avoid common mistakes. For example it was already excluded in the editor to enter combinations of signs that are impossible due to German road legislation. To make the correct location easier, there is the option to show the layer with the current mileage system and also orthophotos, both provided as free Web Map Services.
D5.3 Report on validation of data quality management conceptand experiences from test sites
Version 1.1 19 / 32 02/03/2011
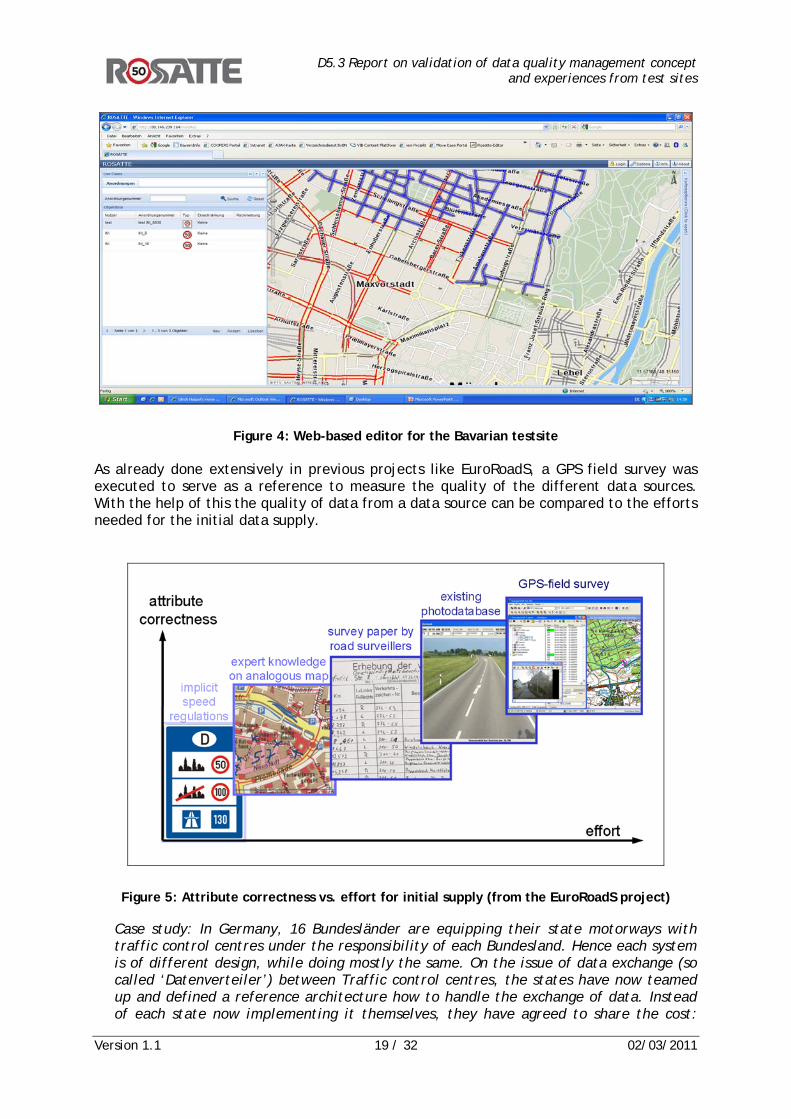
Figure 4: Web-based editor for the Bavarian testsite As already done extensively in previous projects like EuroRoadS, a GPS field survey was executed to serve as a reference to measure the quality of the different data sources. With the help of this the quality of data from a data source can be compared to the efforts needed for the initial data supply.
Figure 5: Attribute correctness vs. effort for initial supply (from the EuroRoadS project)
Case study: In Germany, 16 Bundesländer are equipping their state motorways with traffic control centres under the responsibility of each Bundesland. Hence each system is of different design, while doing mostly the same. On the issue of data exchange (so called ‘Datenverteiler’) between Traffic control centres, the states have now teamed up and defined a reference architecture how to handle the exchange of data. Instead of each state now implementing it themselves, they have agreed to share the cost:

D5.3 Report on validation of data quality management conceptand experiences from test sites
Version 1.1 20 / 32 02/03/2011
Each state commissions different parts of the Datenverteiler system and requires the solution provider to make the solution available to the other states. Translated into ROSATTE and on a European level, we face a similar problem: Each country implements its own data maintenance system and is now facing the problem of HARMONISED data exchange to third parties. A similar sharing and commissioning of components could be a way of moving forward, at least at the edges and partly. This could focus in particular on the exchange needed, but it could also go further upstream in the data maintenance systems, in particular for those countries which now start implementing such components. If the developments were shared amongst each other, or even better, if they were commissioned to the solution providers to become open source, a certain level of re-use of components would be feasible, depending on the similarity of the data maintenance systems. The most blatant example is AGORA (vs- OpenLR): Without considering the quality of the on-the-fly referencing in both methods, OpenLR lowers the threshold of using it significantly, by making source code openly available. The integration of the source code (which encapsulates all algorithmic issues) is left to each user, the development of the encoding/decoding is done only once. With AGORA, we have as many Encoders/Decoders as Solution providers, where each one operates differently... What other components starting from the ROSATTE xsd going upstream to the data maintenance, could be singled out and shared in their development.
4.2 Lessons learnt from London test site From the start of the ROSATTE project it was recognised that being a research project the idea was not only to find solutions according to the ROSATTE documentation, but also about learning and discovery. Initially it was envisaged that the AGORA-C location referencing method would be used to share road safety attribute data with all/any map providers. In the London Test site this is possibly where we had the most difficulty. Also, as the London Digital Speed Limit map is based on the Ordnance Survey Integrated Transport Network (OS ITN2) layer, there were/are proprietary issues associated with sharing the data. With this in mind the most important lessons learned were to do with sharing information with map providers and providing an accurate method of dynamic location referencing. From the beginning of the ROSATTE project, the AGORA-C location referencing method was recommended as the most suitable way forward for sharing information between different maps based on different coordinate systems. Initially the London Test Site set out to develop an AGORA-C encoder to be used to encode locations from our Ordnance Survey based speed limit map, and then to send these codes via a ROSATTE XML to the map providers for decoding. It was soon found that there were many issues surrounding the procurement of an AGORA-C encoder. These issues included:
D5.3 Report on validation of data quality management conceptand experiences from test sites
Version 1.1 21 / 32 02/03/2011
i. Due to their being few developers with skills/knowledge to develop an AGORA-C encoder, especially for Ordnance Survey mapping, finding someone to do the development proved difficult and expensive.
ii. AGORA-C was developed by the Panasonic Corporation, Robert Bosch GmbH, Siemens Aktiengesellschaft and Tele Atlas BV. Together they pooled their essential patents under a single joint patent license agreement. Nevertheless, the IPR issues surrounding AGORA-C and the fact that this technology might not be free (i.e. The patent pool is free to decide upon license costs) poses further issues for developing and using the technology.
iii. Although procuring an AGORA-C license does not necessarily in itself constitute a problem, adoption of AGORA-C by industry and Governments is by no means certain, andthus any purchase of a license carry’s more risk.
In the end the London Test Site chose rather to adopt an open source location referencing technology, and a relatively new entrant to the market, OpenLR. www.openlr.org “OpenLR™ is an open source software project launched by TomTom International B.V. in September 2009. This project provides a royalty-free dynamic location referencing method which enables reliable data exchange and cross-referencing using digital maps of different vendors and versions. OpenLR™ will help to enhance existing applications and will generate opportunities for new services.” The locations of links are generated in the encoder, and then subsequently downloaded using a decoder on the map providers’ side. TfL’s OpenLR encoder was developed by a partner, Farina Consulting, and can produce location reference codes for any area of TfL’s Greater London Digital Speed Limit Map. One limiting factor, however, is that Navteq does not have an OpenLR decoder. Thus although data can be shared with Tele Atlas, this does not meet one of the ROSATTE projects aims of the data being available to both map providers. As a ‘second best’ option, GML of the speed limit map will be used to exchange data with the other map provider partner, Navteq. Using OpenLR however did not end all issues associated with location referencing. Although the encoder works, the success rate for encoding and successful decoding was found to be just over 90%. There were a number of reasons for this, primarily:
1. Currently the OpenLR en/decoder web-service only allows to en/decode publicly accessible roads. This is not because of any particular limitations of OpenLR. In some cases roads that are called ‘private’ in Ordnance Survey, are in fact public access roads in TeleAtlas, and vice versa. Even though we assign these roads a speed limit, they do not get encoded/decoded properly. The map data the TeleAtlas web-service can access has been limited to only publicly accessible roads. Technically however it wouldn't be a problem to also include private roads.
D5.3 Report on validation of data quality management conceptand experiences from test sites
Version 1.1 22 / 32 02/03/2011
e.g. "Rowstock Gardens" (London Borough of Islington) is shown as publicly accessible on the Ordnance Survey data, but as a private road in the TA map, so it will be extracted and always fail to decode
2. Discrepancies between the maps (OS and TA) mean that some roads in Ordnance
Survey do not exist in Tele Atlas, and vice versa. 3. The London Digital Speed Limit map initially did not specify the difference between
one-way and two-way roads. As part of OpenLR, the en/decoder needs to know which roads are one-way roads, and what the direction of flow is. We have subsequently included an ‘orientation’ field in our map which stipulates the direction of flow of one-way roads through either a ‘+’ or ‘-‘ sign. Already included in the attribute data is ‘start node’ and ‘end node’. The ‘orientation’ field determines whether direction of flow is from start to end node (i.e. +) or from the end to start node (i.e. -).
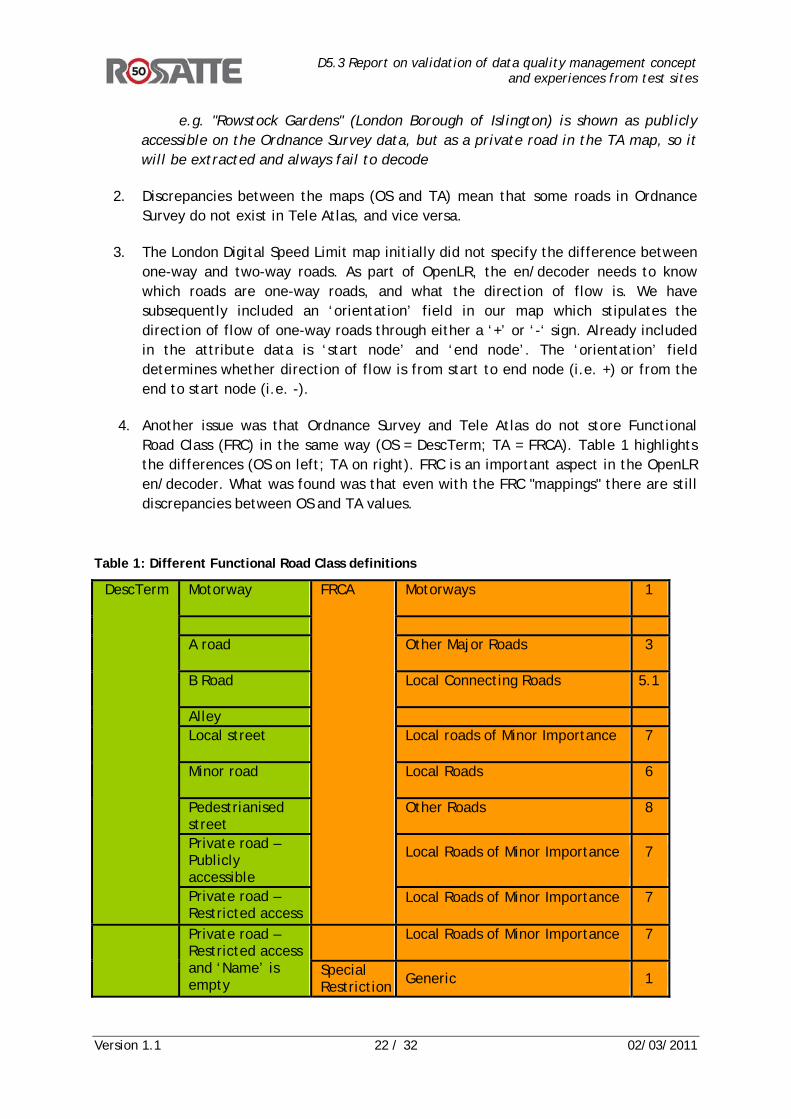
4. Another issue was that Ordnance Survey and Tele Atlas do not store Functional Road Class (FRC) in the same way (OS = DescTerm; TA = FRCA). Table 1 highlights the differences (OS on left; TA on right). FRC is an important aspect in the OpenLR en/decoder. What was found was that even with the FRC "mappings" there are still discrepancies between OS and TA values.
Table 1: Different Functional Road Class definitions
DescTerm Motorway FRCA
Motorways
1
A road Other Major Roads
3
B Road Local Connecting Roads
5.1
Alley Local street Local roads of Minor Importance
7
Minor road Local Roads
6
Pedestrianised street
Other Roads
8
Private road – Publicly accessible
Local Roads of Minor Importance
7
Private road – Restricted access
Local Roads of Minor Importance
7
Private road – Restricted access and ‘Name’ is empty
Local Roads of Minor Importance
7
Special Restriction Generic 1
D5.3 Report on validation of data quality management conceptand experiences from test sites
Version 1.1 23 / 32 02/03/2011
Finally, one other important consideration and limitation in the London Test Site, was the use of Ordnance Survey mapping. Ordnance Survey currently has very strict and limiting derived data rules on their map products. As the London Digital Speed Limit map is based on the Ordnance Survey ITN2 layer, it considered derived data, and hence OS essentially own the map. This means TfL cannot provide the data to anyone who would use it for commercial gain, and anyone with whom the data is shared, would need to be a contractor of TfL or would need to procure an Ordnance Survey licence. This, naturally, seriously constrains the ability to share and make publicly available the speed limit data from the London Test Site. For the purposes of ROSATTE the data will be assessed, but not used. Thus, although given current Ordnance Survey IPR laws the actual sharing of TfL’s data is not possible, we can still test the theory behind it. There are hints that OS might relax their derived data laws, so hopefully in the future this problem may fall away.
4.3 Lessons learnt from the Flanders test site The mobile mapping technology was used to make an inventory of all traffic sings in Flanders. Based on the mobile mapping images, several software programs were used to come to the traffic sign database. 1. VsDesign: VsDesign is being used for designing traffic signs that are not yet available in the existing standard traffic sign libraries. This drawing is a vector. 2. SIMaD: SIMaD users put together traffic signs using the traffic sign libraries of VsDesign or the standard traffic sign library. Attributes such as basic dimensions, type, shape, text, year of production, producer, information about poles and fittings, can be added to each traffic sign. SIMaD is an extension that is compatible with SignInvent and ArcGIS. 3. SignInvent: This application is developed for updating the inventory of traffic signs. The inventory is stored in an Access database. SignInvent users can make reports of the inventory, build queries, etc.. 4. ArcGIS: ArcGIS is used for the updating and representing of the inventory of traffic signs. The SIMaD extension of ArcGIS is necessary. So it is possible to update and change the traffic sign database in ArcGIS. The traffic signs can be visualised on a map. Therefore, the drawing of a traffic sign is converted to polygons in shapefile, or in a file geodatabase. The combination of an MsAccess database with a shapefile or filegeodatabse is called a SIMaD dataset. Most problems in the Flanders testsite were encountered when making the xml extraction: - The implemented extraction tool uses a filter, so that only the safety attributes
considered within the ROSATTE project are incorporated in the xml extraction file. The traffic sign database of Flanders really contains all traffic signs in Flanders (also direction signs, tourist signs, cycle route signs, …). In the beginning some relevant traffic signs did not pass the filter. Some optimisations have been performed.
D5.3 Report on validation of data quality management conceptand experiences from test sites
Version 1.1 24 / 32 02/03/2011
- When the traffic sign database was updated, some updates did not appear in the xml extraction file:
o When traffic signs of the type F1 and F3 were deleted, this could not be found in the extraction file
o Textual changes in certain types of traffic signs were not detected: when e.g. a speed limit sign of 70km/h was changed in 90km/h, this modification was not included in the ROSATTE xml
o Changes in subsigns were not detected: when the text of a subsign was changed, this modification was not included in the ROSATTE xml
o When traffic signs of the type A3/A5 or C21-C27-C29 were inserted in the traffic sign database, they were not included in the ROSATTE xml.
- When the ROSATTE xml file is created, conditions are missing All these encountered problems gave us input for optimizing our extraction tool Following problems were also encountered (related to the ROSATTE specification): - Zone road signs of the type ZCxx (zones with a prohibition xxx) are for the moment not
described in the ROSATTE specification (except the speed limit zone signs). - The ROSATTE specification does not allow the use of sign C46 to indicate the end of a
speed limit (since the ROSATTE specification demands the specification of the speed value, which is not know in case of a C46)
- For traffic signs with lane conditions (e.g. F17/F18, F89/F91), it is sometimes not possible to derive for which lane a condition needs to be applied. This can not be derived from the data stored in the traffic sign database.
- For traffic signs with time conditions (e.g. F103), it is not possible to derive the type and duration of the time condition from the data stored in the traffic sign database.
- In the ROSATTE specification, no condition is defined for subsigns that express a limitation of a prohibition or an order.
- Some conditions that appear in the Belgian traffic regulation are not foreseen in the ROSATTE specification.
- For the traffic signs C21, C22, C23, C24, C25, C27 and C29 the distance to the location where the prohibition is really valid is often indicated using a subsign. The ROSATTE specification does however not foresee the possibility to send this as a property with a ROSATTE safety feature.
In order to solve all the above mentioned problems, a modification (mainly extension) of the ROSATTE specification is needed and the traffic sign database of Flanders needs some modifications. The Flanders testsite also experienced a lot of problems when implementing the Navteq encoding service. The main cause of these problems was that the traffic sign database of Flanders used a different version of Navstreets as the version used in the Navteq encoding service. The Navteq encoding service is always based on the Q2 or Q4 version of Navstreets. Within the Flemish government, the Q3 version of Navstreets is always used. In order to solve this incompatibility, Flanders implemented the Q4 version of Navstreets for the testsite area.
4.4 Lessons learnt from the ASFA test site ASFA test site was organised around four main ideas:
• Contribution from 2 motorway companies (COFIROUTE and AREA, among 14 private companies gathered in the ASFA association)
• Contribution of a service provider (Autoroutes Trafic) • Using of existing database “la carte des vitesses” (static speed limits map) as a
base for ROSATTE test site
D5.3 Report on validation of data quality management conceptand experiences from test sites
Version 1.1 25 / 32 02/03/2011
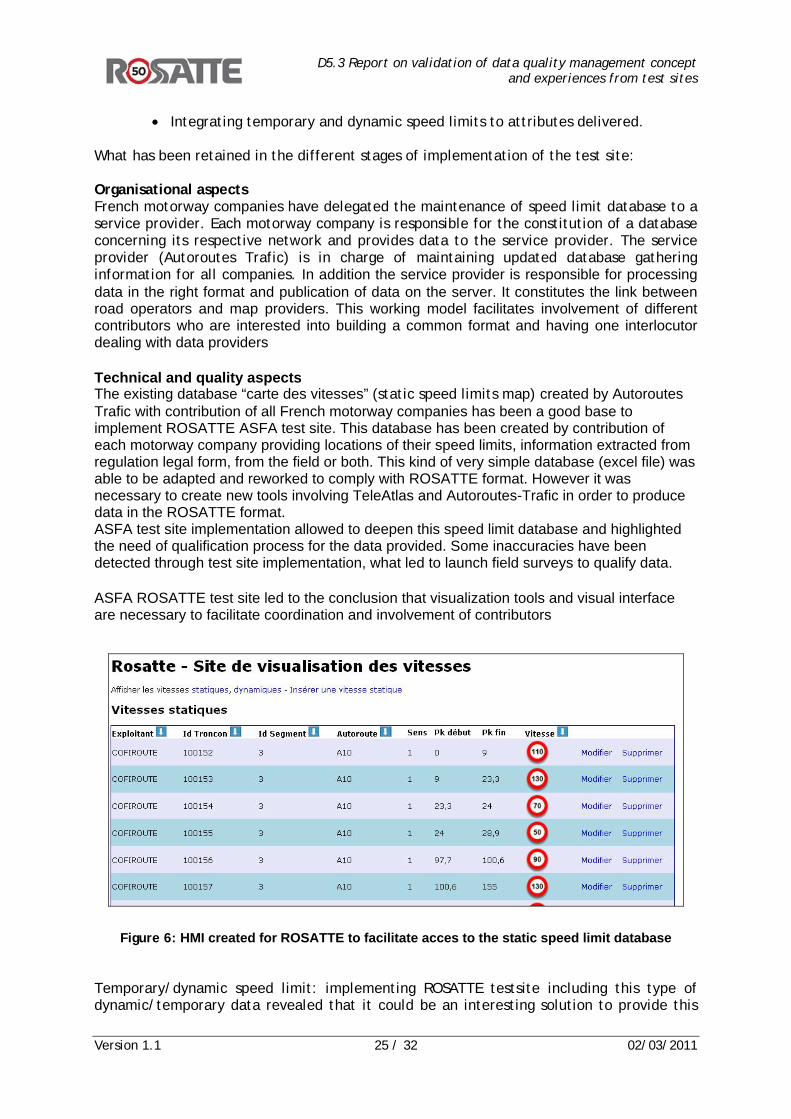
• Integrating temporary and dynamic speed limits to attributes delivered. What has been retained in the different stages of implementation of the test site: Organisational aspects French motorway companies have delegated the maintenance of speed limit database to a service provider. Each motorway company is responsible for the constitution of a database concerning its respective network and provides data to the service provider. The service provider (Autoroutes Trafic) is in charge of maintaining updated database gathering information for all companies. In addition the service provider is responsible for processing data in the right format and publication of data on the server. It constitutes the link between road operators and map providers. This working model facilitates involvement of different contributors who are interested into building a common format and having one interlocutor dealing with data providers Technical and quality aspects The existing database “carte des vitesses” (static speed limits map) created by Autoroutes Trafic with contribution of all French motorway companies has been a good base to implement ROSATTE ASFA test site. This database has been created by contribution of each motorway company providing locations of their speed limits, information extracted from regulation legal form, from the field or both. This kind of very simple database (excel file) was able to be adapted and reworked to comply with ROSATTE format. However it was necessary to create new tools involving TeleAtlas and Autoroutes-Trafic in order to produce data in the ROSATTE format. ASFA test site implementation allowed to deepen this speed limit database and highlighted the need of qualification process for the data provided. Some inaccuracies have been detected through test site implementation, what led to launch field surveys to qualify data. ASFA ROSATTE test site led to the conclusion that visualization tools and visual interface are necessary to facilitate coordination and involvement of contributors
Figure 6: HMI created for ROSATTE to facilitate acces to the static speed limit database Temporary/dynamic speed limit: implementing ROSATTE testsite including this type of dynamic/temporary data revealed that it could be an interesting solution to provide this
D5.3 Report on validation of data quality management conceptand experiences from test sites
Version 1.1 26 / 32 02/03/2011
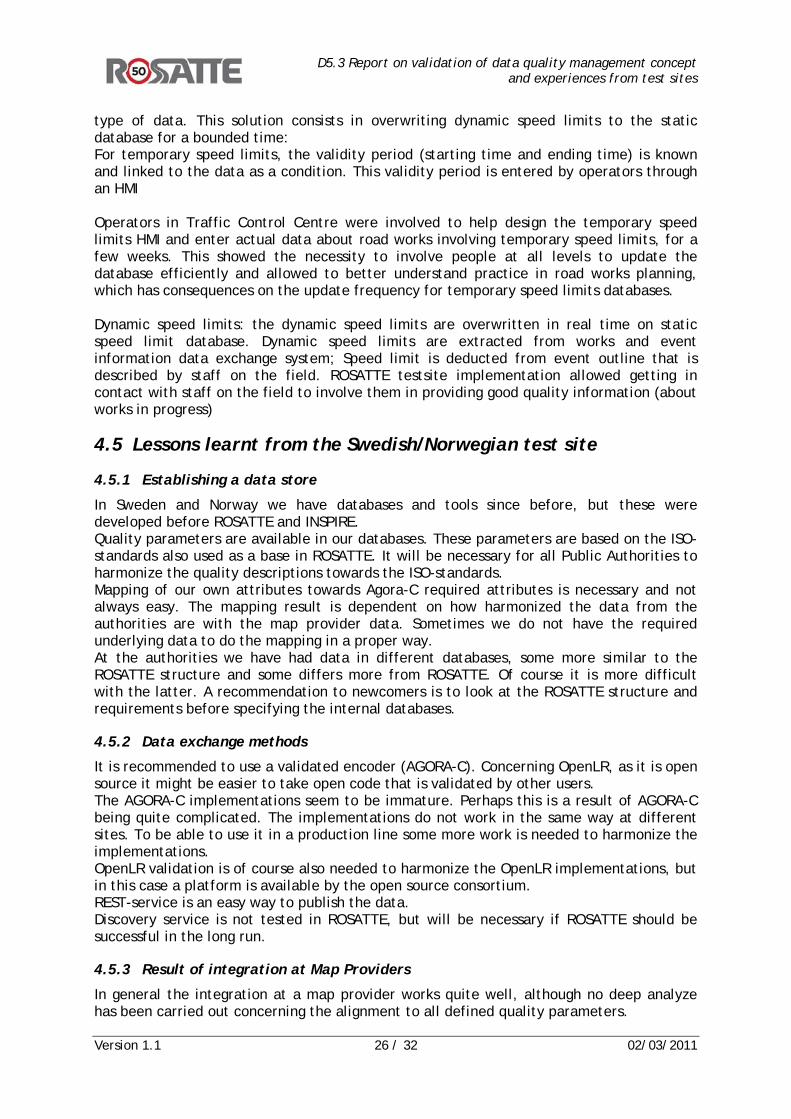
type of data. This solution consists in overwriting dynamic speed limits to the static database for a bounded time: For temporary speed limits, the validity period (starting time and ending time) is known and linked to the data as a condition. This validity period is entered by operators through an HMI Operators in Traffic Control Centre were involved to help design the temporary speed limits HMI and enter actual data about road works involving temporary speed limits, for a few weeks. This showed the necessity to involve people at all levels to update the database efficiently and allowed to better understand practice in road works planning, which has consequences on the update frequency for temporary speed limits databases. Dynamic speed limits: the dynamic speed limits are overwritten in real time on static speed limit database. Dynamic speed limits are extracted from works and event information data exchange system; Speed limit is deducted from event outline that is described by staff on the field. ROSATTE testsite implementation allowed getting in contact with staff on the field to involve them in providing good quality information (about works in progress)
4.5 Lessons learnt from the Swedish/Norwegian test site
4.5.1 Establishing a data store
In Sweden and Norway we have databases and tools since before, but these were developed before ROSATTE and INSPIRE. Quality parameters are available in our databases. These parameters are based on the ISO-standards also used as a base in ROSATTE. It will be necessary for all Public Authorities to harmonize the quality descriptions towards the ISO-standards. Mapping of our own attributes towards Agora-C required attributes is necessary and not always easy. The mapping result is dependent on how harmonized the data from the authorities are with the map provider data. Sometimes we do not have the required underlying data to do the mapping in a proper way. At the authorities we have had data in different databases, some more similar to the ROSATTE structure and some differs more from ROSATTE. Of course it is more difficult with the latter. A recommendation to newcomers is to look at the ROSATTE structure and requirements before specifying the internal databases.
4.5.2 Data exchange methods
It is recommended to use a validated encoder (AGORA-C). Concerning OpenLR, as it is open source it might be easier to take open code that is validated by other users. The AGORA-C implementations seem to be immature. Perhaps this is a result of AGORA-C being quite complicated. The implementations do not work in the same way at different sites. To be able to use it in a production line some more work is needed to harmonize the implementations. OpenLR validation is of course also needed to harmonize the OpenLR implementations, but in this case a platform is available by the open source consortium. REST-service is an easy way to publish the data. Discovery service is not tested in ROSATTE, but will be necessary if ROSATTE should be successful in the long run.
4.5.3 Result of integration at Map Providers
In general the integration at a map provider works quite well, although no deep analyze has been carried out concerning the alignment to all defined quality parameters.
D5.3 Report on validation of data quality management conceptand experiences from test sites
Version 1.1 27 / 32 02/03/2011
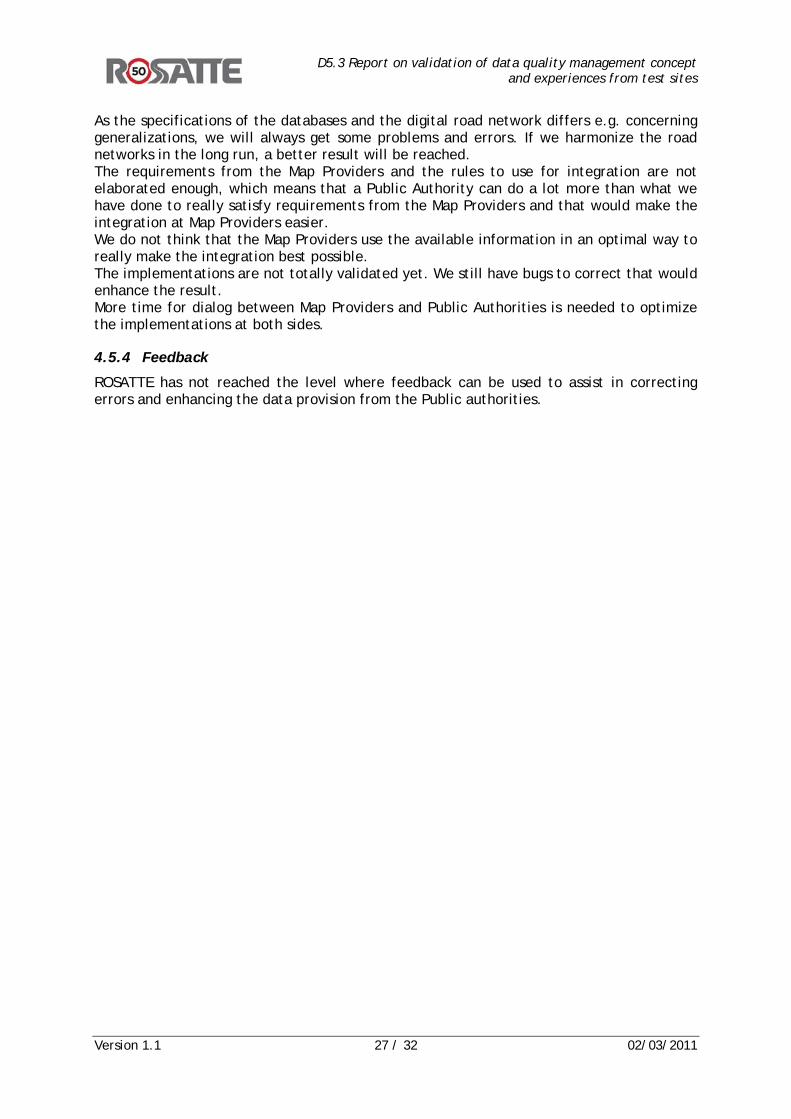
As the specifications of the databases and the digital road network differs e.g. concerning generalizations, we will always get some problems and errors. If we harmonize the road networks in the long run, a better result will be reached. The requirements from the Map Providers and the rules to use for integration are not elaborated enough, which means that a Public Authority can do a lot more than what we have done to really satisfy requirements from the Map Providers and that would make the integration at Map Providers easier. We do not think that the Map Providers use the available information in an optimal way to really make the integration best possible. The implementations are not totally validated yet. We still have bugs to correct that would enhance the result. More time for dialog between Map Providers and Public Authorities is needed to optimize the implementations at both sides.
4.5.4 Feedback
ROSATTE has not reached the level where feedback can be used to assist in correcting errors and enhancing the data provision from the Public authorities.
D5.3 Report on validation of data quality management conceptand experiences from test sites
Version 1.1 28 / 32 02/03/2011
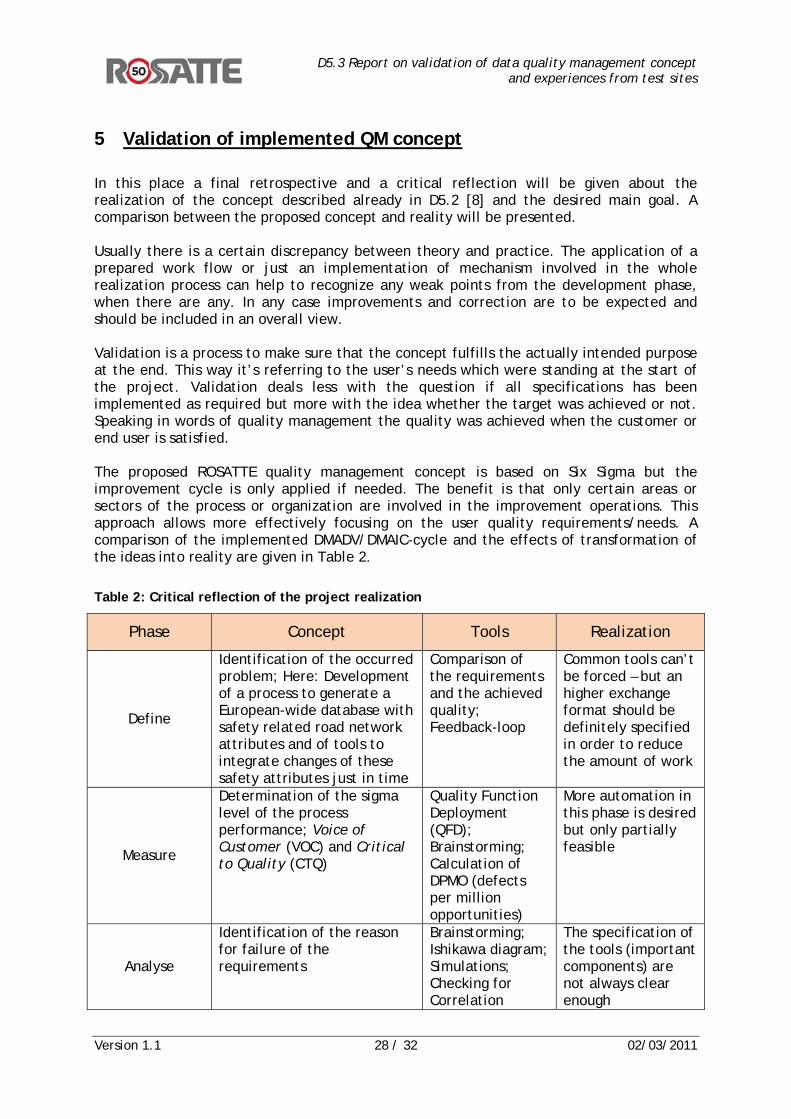
5 Validation of implemented QM concept In this place a final retrospective and a critical reflection will be given about the realization of the concept described already in D5.2 [8] and the desired main goal. A comparison between the proposed concept and reality will be presented. Usually there is a certain discrepancy between theory and practice. The application of a prepared work flow or just an implementation of mechanism involved in the whole realization process can help to recognize any weak points from the development phase, when there are any. In any case improvements and correction are to be expected and should be included in an overall view. Validation is a process to make sure that the concept fulfills the actually intended purpose at the end. This way it’s referring to the user’s needs which were standing at the start of the project. Validation deals less with the question if all specifications has been implemented as required but more with the idea whether the target was achieved or not. Speaking in words of quality management the quality was achieved when the customer or end user is satisfied. The proposed ROSATTE quality management concept is based on Six Sigma but the improvement cycle is only applied if needed. The benefit is that only certain areas or sectors of the process or organization are involved in the improvement operations. This approach allows more effectively focusing on the user quality requirements/needs. A comparison of the implemented DMADV/DMAIC-cycle and the effects of transformation of the ideas into reality are given in Table 2.
Table 2: Critical reflection of the project realization
Phase Concept Tools Realization
Define
Identification of the occurred problem; Here: Development of a process to generate a European-wide database with safety related road network attributes and of tools to integrate changes of these safety attributes just in time
Comparison of the requirements and the achieved quality; Feedback-loop
Common tools can’t be forced – but an higher exchange format should be definitely specified in order to reduce the amount of work
Measure
Determination of the sigma level of the process performance; Voice of Customer (VOC) and Critical to Quality (CTQ)
Quality Function Deployment (QFD); Brainstorming; Calculation of DPMO (defects per million opportunities)
More automation in this phase is desired but only partially feasible
Analyse
Identification of the reason for failure of the requirements
Brainstorming; Ishikawa diagram; Simulations; Checking for Correlation
The specification of the tools (important components) are not always clear enough
D5.3 Report on validation of data quality management conceptand experiences from test sites
Version 1.1 29 / 32 02/03/2011
Phase Concept Tools Realization
Design/Improve
Selection and first implementation of the most promising solutions; optimization
Brainstorming; Failure Mode and Effects Analysis (FMEA)
Use of individual methodology; developed routines should be shared
Verify/Control
Solution is integrated in the standard process
Assessment procedure; examination of significant loss of quality
Comparison of data coming in and finally coming out as result; Files with test data should be examined with the necessary caution for relevance of the content
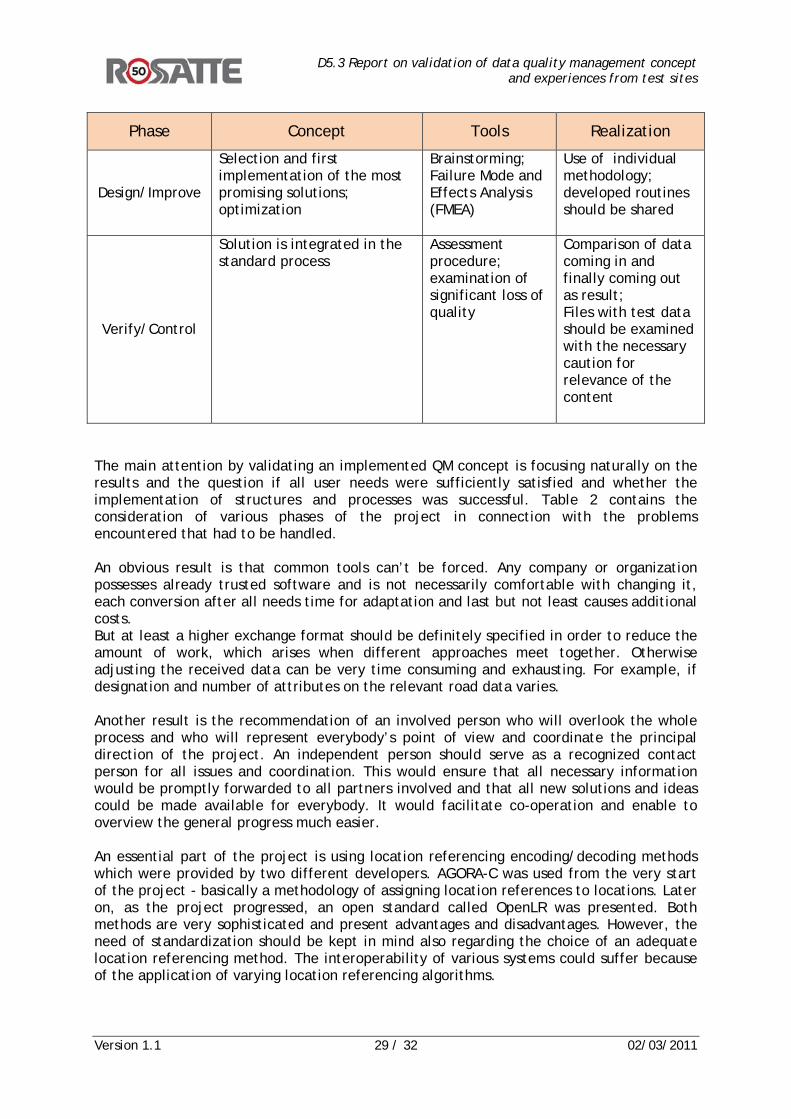
The main attention by validating an implemented QM concept is focusing naturally on the results and the question if all user needs were sufficiently satisfied and whether the implementation of structures and processes was successful. Table 2 contains the consideration of various phases of the project in connection with the problems encountered that had to be handled. An obvious result is that common tools can’t be forced. Any company or organization possesses already trusted software and is not necessarily comfortable with changing it, each conversion after all needs time for adaptation and last but not least causes additional costs. But at least a higher exchange format should be definitely specified in order to reduce the amount of work, which arises when different approaches meet together. Otherwise adjusting the received data can be very time consuming and exhausting. For example, if designation and number of attributes on the relevant road data varies. Another result is the recommendation of an involved person who will overlook the whole process and who will represent everybody’s point of view and coordinate the principal direction of the project. An independent person should serve as a recognized contact person for all issues and coordination. This would ensure that all necessary information would be promptly forwarded to all partners involved and that all new solutions and ideas could be made available for everybody. It would facilitate co-operation and enable to overview the general progress much easier. An essential part of the project is using location referencing encoding/decoding methods which were provided by two different developers. AGORA-C was used from the very start of the project - basically a methodology of assigning location references to locations. Later on, as the project progressed, an open standard called OpenLR was presented. Both methods are very sophisticated and present advantages and disadvantages. However, the need of standardization should be kept in mind also regarding the choice of an adequate location referencing method. The interoperability of various systems could suffer because of the application of varying location referencing algorithms.

D5.3 Report on validation of data quality management conceptand experiences from test sites
Version 1.1 30 / 32 02/03/2011
Points to improve in the future are: • providing/sharing developed routines, individual solutions • introduce contingency tables/cross tabulations for control issues • immediate feedback when an error has been detected (PDCA-cycle) • faster information exchange • development of more automation regarding control of the results • clear definition or specification which characteristics and components the local
referencing tools have to deliver • standardization of formats for data sharing purposes (e.g. conclusive IDs) • establishing/strengthening the position of a mediator between all partners
Table 3: Recapitulation of requirements which are combined with validation indicators and evaluation methods as described in report D5.1 [7].
Requirements reflected in validation indicators and methods
Road authorities Map providers
• data store initiation • initial supply/data import • integration of attribute supply
to the work flow of regulations
• data presentation and maintenance
• data publishing • user feedback • INSPIRE conformance • existing work and standards • quality management
• data discovery• data subscription • unified access • data updates • location referencing • quality • update delays
The initial situation was the desire for establishing accurate and up-to-date safety related road network attributes. For such an undertaking particular mechanisms are needed. But there are also two responsible parties one has to differentiate between, each taking care of its own sector as listed in Table 3. The road authorities are taking charge of the timely delivery of data and the map providers or data integrators are responsible for correct interpretation including inclusion of the same data. The most interesting task at the start was to find measurable parameters to define the data quality. Because at the end individual solutions and different implementations have to meet the same requirements and the same quality for a quality ensured data supply chain. The final verification of the data regarding its accuracy has been done by the University of Stuttgart. During the evaluation a very important and essential distinction was made between topological and geometrical correctness. One of the results was that topological correctness should dominate much more over geometrical accuracy when attributes are integrated. Among the most frequent errors like wrong offset, missing parts or wrong link matches, the topological correctness has the most profound impact to ensure a smoothly flow of relevant attribute data from the road authorities to data users.
D5.3 Report on validation of data quality management conceptand experiences from test sites
Version 1.1 31 / 32 02/03/2011
It can be summarized that the applied QM worked as intended. Most important experiences, related to the implementation of the data and adaption to specific problems by QM adjustment, are described in chapter 4: “Lessons learnt in field test sites”. All problems which occurred have been solved or handled accordingly. Particularly advantageous was that all project associated partners brought a variety of experiences into the project. The data evaluation was performed at different processing levels and culminated in the detection of errors and creation of alternative ideas how to handle diverse evaluation scenarios. Sometimes the integration was topologically not correct, but with high positional accuracy. Some other time only poor positional accuracy was observed. The original road safety feature datasets were documented by the road authorities for verification purposes and send to the map providers and to USTUTT. The map providers integrated them into their own databases and sent the final integration results also to USTUTT. Both received versions were compared with previously defined validation parameters in D5.1 [7]. Especially topology and geometrical correctness were analyzed. The results and any suggestion of improvement were forwarded to the responsible partners. The implementations were improved, eventually specification changed or tool adjusted. The DMADV-cycle started then again allowing improving the quality of the data gradually. Disregarding the different level of development of the road safety features and databases in the participating countries, the results are very satisfactory and proving that cooperation between public road authorities and map providers for the provision and maintenance of road safety attributes is not only possible but highly efficient. In the future the main focus should be on advancing the topological correctness, more use of uniform methodology and establishing more consistent specifications of the delivered data. Attention should be paid also to further development of flexible and interoperable tools for data exchange and integration.
D5.3 Report on validation of data quality management conceptand experiences from test sites
Version 1.1 32 / 32 02/03/2011
6 Conclusions and prospects At the beginning of the project, the major concerns were how to handle the technical and the organizational aspects of the data access, exchange and maintenance. Many questions could be answered satisfactorily in the course of the work. Some solutions were predefined, others required individual realizations, e.g. the adaptation of own DMADV routines by the partners. Concretization of ideas was important but even more was the information exchange, coordination of continuous development and improvement of the mechanisms behind. Goals that have been achieved owe the success especially to the very effective cooperation between various road authorities and different map providers. Aspects like data availability, timeliness delivery of data, accessibility, data quality, organizational issues, correct interpretation and inclusion of data have been handled with great caution and a desirable outcome. The validation and verification of the data proofed that data coming in and finally coming out of the analysis is fitting well together. During the validation process errors has been corrected iteratively and if necessary design recommendations or solution proposals forwarded. Some of the future prospects were already mentioned in the previous chapter 5. Especially to deal with the challenge in terms of maintenance two points should be highlighted: the standardization of formats for data sharing and the establishing of the position of a coordinator between all partners. Both measures would improve coordination sustainable. In addition, the use of a single local referencing tool should be considered or existing interfaces extended to allow parallel application of different providers like AGORA -C, OpenLR and probably others.