d8.3 report on the validation and evaluation results (revised...
TRANSCRIPT

D8.3 Report on the Validation and Evaluation Results (revised final version)
Project: ROADIDEA 215455 Document Number and Title: D8.3 Final Validation and Evaluation Results
(revised final version) Work-Package: WP8 Deliverable Type: Report Contractual Date of Delivery: 31 August 2010, revised 23 January 2011 Actual Date of Delivery: 22 January 2011 Author/Responsible(s): Jörg Dubbert (POY)
Stephanie Müller (POY) Contributors: Andrea Rossa (ARPAV)
Armi Vilkmann (VTT) Auli Keskinen (FORC) Djurdjica Markovic (METI) Francesco Domenichini (ARPAV) Franco Zardini (ARPAV) Igor Grabec (AMA) Ilkka Juga (FMI) Iris Karvonen (VTT) Janko Domokos (RODS) Jussi Kiuru (DEST) Lars Hübner (POY) Marcus Wigan (DEMIS) Marjo Hippi (FMI) Pekka Leviäkangas (VTT) Pertti Nurmi (FMI) Peter Hollo (RODS) Pirkko Saarikivi (FORC) Poul Grashoff (DEMIS) Raine Hautala (VTT) Risto Öörni (VTT) Saara Manninen (DEST)
Approval of this report: TCC co-ordinator Summary of this report: Documentation of the validation and evaluation results
concerning the ideas, the pilots, the platform as well as the innovation process
Keyword List: Evaluation, validation, pilots, platform, ideas, innovation, WP8
Dissemination level: Public (PU)

ROADIDEA 215455
2/141
Distribution list European Commission Emilio Davila Gonzalez
Wolfgang Höfs
ROADIDEA partners E-mail list www.roadidea.eu

ROADIDEA 215455
3/141
Executive summary This deliverable D8.3 presents the validation and evaluation results in the ROADIDEA project. Several project outputs are subject to validation and evaluation. As determined in the Final Validation and Evaluation Plan (Deliverable D8.2), the following outputs have been evaluated: the service ideas concerning their service concept and the defined innovation aspects, the innovation process at the innovation seminars, the ROADIDEA service platform and the ROADIDEA pilots. The initial validation and evaluation results were reported November 2009 in the deliverable version D8.3a. This document was followed by the Version D8.3b, which included all final evaluation results of the ROADIDEA pilots. The recommendations from the Final Review in October 2010 suggested that more conclusions on the overall project methodology and results as well as more information on experience made and major steps ahead should be provided. This has been added in this deliverable version D8.3, which represents the final version of the validation and evaluation results in ROADIDEA. Idea Assessment: The evaluation and validation of the service ideas has been carried out in two aspects: the degree of innovation and the service concept. Two questionnaire surveys have taken place. The ROADIDEA participants have discussed and assessed the ideas proposed at the Prague innovation seminar. The evaluation of the innovation aspects was aiming at assessing in which respect the proposed service ideas contain new elements. The evaluation of the service concept had the character of a brief ex-ante self-evaluation of the service idea by the idea teams. The feedback from both surveys has been analysed. The results are a qualitative assessment of the ideas. For this version of the deliverable the evaluation of the ideas from the second innovation seminar was done by the evaluation team. Assessment of the Innovation Process: Furthermore, the innovation process at the innovation seminars has been evaluated aiming at obtaining information on how the seminar participants assessed the innovation procedure as such. The seminar participants took part in a questionnaire survey. The results are presented in this deliverable. Additionally, the external evaluator at the second Innovation Seminar, Pekka Kumpula, gave his personal evaluation report which is also included here. Evaluation of the ROADIDEA Platform: The ROADIDEA Platform is one of the main technical achievements in ROADIDEA. D8.3 presents the evaluation results concerning the functionality, the implementation, the information content and data quality, the interoperability and the access to data as well as the business model for the platform. Pilot Evaluation: The four ROADIDEA pilots (Pulp Friction, Fog Warning, Traffic Forecast in Gothenburg, Port of Hamburg) have been evaluated. The first step was a self-evaluation of the pilots for which the ‘pilot owners’ have filled AINO evaluation sheets, which guided them through the process of the evaluation of the service concept.

ROADIDEA 215455
4/141
In the next step the pilot evaluation team evaluated the service concept more deeply based on the programme for each pilot determined in deliverable D8.2 (Final validation and evaluation plan). Several indicators have been set up for pilot evaluation (e.g. user needs, data quality, technical implementation, organisational aspects and business model, innovation aspects). The indicators vary due to the different natures of the pilots. The main purpose of the pilot evaluation in ROADIDEA was to support the development of the concepts with an ex-ante evaluation. For each pilot, the next steps forward after the end of ROADIDEA have been described. Overall Conclusions and Recommendations: The final chapter of this deliverable provides some concluding remarks and a retrospect analysis on the ROADIDEA project methodology, especially conclusions on the use of innovation methods for the further development of ideas and for the future development of ITS in the European context. The concept for a European ITS Innovation Taskforce is strongly endorsed which supports a problem-oriented innovation process involving experts form all relevant ITS domains in order to promote the research and development in the field of ITS. The experience made in ROADIDEA is summarised and recommendations for the future work are provided.

ROADIDEA 215455
5/141
Table of contents
1. Introduction........................................................................................................ 7 1.1. THE ROADIDEA PROJECT.................................................................................................................. 7 1.2. THE EVALUATION PROCESS .................................................................................................................. 7
2. Results of the idea evaluation .............................................................................. 9 2.1. INTRODUCTION TO THE IDEAS/OVERVIEW............................................................................................ 9 2.2. THE EVALUATION OF IDEAS FROM THE FIRST INNOVATION SEMINAR (PRAGUE 2008) ........................ 11
2.2.1. The innovation aspects ....................................................................................................... 11 2.2.2. The service concepts........................................................................................................... 13
2.3. THE EVALUATION OF IDEAS FROM THE SECOND INNOVATION SEMINAR (DUBROVNIK 2009)............... 21 3. Results of the innovation process evaluation........................................................26
3.1. INTRODUCTION TO THE PROCESS OF GENERATING INNOVATIONS ....................................................... 26 3.2. THE EXPERT’S REPORT ....................................................................................................................... 27 3.3. THE PROCESS EVALUATION QUESTIONNAIRE ...................................................................................... 28
3.3.1. The participants ................................................................................................................... 28 3.3.2. The process of idea generation......................................................................................... 30 3.3.3. The idea ranking .................................................................................................................. 31 3.3.4. The idea development after the seminar ........................................................................ 32
4. Results of the platform evaluation .......................................................................34 4.1. INTRODUCTION ................................................................................................................................. 34 4.2. OBJECTIVES ...................................................................................................................................... 34 4.3. METHODS.......................................................................................................................................... 34 4.4. EVALUATION RESULTS........................................................................................................................ 35 4.5. REALISED FUNCTIONALITY AND IMPLEMENTATION OF ROADIDEA TRAFFIC INFORMATION PLATFORM 36 4.6. INFORMATION CONTENT AND DATA QUALITY...................................................................................... 38 4.7. INTEROPERABILITY AND ACCESS TO DATA .......................................................................................... 39 4.8. BUSINESS MODEL .............................................................................................................................. 40 4.9. DISCUSSION AND ANALYSIS ............................................................................................................... 40 4.10. CONCLUSIONS ................................................................................................................................... 42
5. Results of the pilots’ evaluation...........................................................................44 5.1. SELF-EVALUATION OF THE PILOTS...................................................................................................... 44 5.2. PULP FRICTION PILOT........................................................................................................................ 44
5.2.1. Introduction .......................................................................................................................... 44 5.2.2. Literature review on road surface friction ....................................................................... 45 5.2.3. General objectives and scope of the validation and evaluation .................................. 47 5.2.4. Organizing and scheduling the validation and evaluation............................................ 47 5.2.5. Methodology of the validation and evaluation ............................................................... 48
5.2.5.1. Scenario with indicators ................................................................................................................. 49 5.2.5.2. Success indicators based on defined targets ............................................................................. 49 5.2.5.3. End-user tests.................................................................................................................................. 53 5.2.5.4. Business model assessment .......................................................................................................... 54
5.2.6. Discussion ............................................................................................................................. 55 5.2.7. Major steps forward ............................................................................................................ 56 5.2.8. Summary ............................................................................................................................... 56
5.3. GOTHENBURG PILOT .......................................................................................................................... 57 5.3.1. Overview and purpose of the pilot ................................................................................... 57 5.3.2. Baseline scenario ................................................................................................................. 59 5.3.3. User needs ............................................................................................................................ 60 5.3.4. Technical assessment of the concept .............................................................................. 60

ROADIDEA 215455
6/141
5.3.5. Targets and success indicators for the real-time solution............................................ 62 5.3.6. Proposal for an alternative use case ................................................................................ 63 5.3.7. Conclusions ........................................................................................................................... 65 5.3.8. Major Steps Forward ........................................................................................................... 65
5.4. FOG WARNING PILOT ......................................................................................................................... 67 5.4.1. Overview and purpose of the pilot ................................................................................... 67 5.4.2. Evaluation.............................................................................................................................. 68
5.4.2.1. User needs ....................................................................................................................................... 69 5.4.2.2. Data quality ...................................................................................................................................... 72 5.4.2.3. Technical functioning ..................................................................................................................... 81 5.4.2.4. Technical implementation.............................................................................................................. 82 5.4.2.5. Organizational aspects and business model............................................................................... 88 5.4.2.6. Costs and socio-economic impacts .............................................................................................. 90 5.4.2.7. Degree of innovation ...................................................................................................................... 96
5.4.3. Evaluation summary and future perspectives ................................................................ 98 5.4.4. Major Steps Forward ......................................................................................................... 100
5.5. HAMBURG PORT PILOT .................................................................................................................... 102 5.5.1. Overview and purpose of the pilot ................................................................................. 102 5.5.2. User needs .......................................................................................................................... 103 5.5.3. Baseline scenario ............................................................................................................... 105 5.5.4. Global principle and problem solving ............................................................................. 105 5.5.5. Data availability and data quality.................................................................................... 110 5.5.6. Cost estimate...................................................................................................................... 111 5.5.7. Organisational aspects ...................................................................................................... 111 5.5.8. Added value and business opportunities ....................................................................... 111 5.5.9. Degree of innovation......................................................................................................... 112 5.5.10. Problems.............................................................................................................................. 112 5.5.11. Major Steps Forward ......................................................................................................... 113
5.6. TRIP RAINFALL FORECAST PILOT ...................................................................................................... 114 5.6.1. Overview and purpose of the pilot ................................................................................. 114 5.6.2. Introduction of evaluation................................................................................................ 116 5.6.3. Baseline scenario ............................................................................................................... 117 5.6.4. User needs .......................................................................................................................... 119 5.6.5. Data quality......................................................................................................................... 122 5.6.6. Functionality and technical implementation.................................................................. 123 5.6.7. Organizational aspects and business model ................................................................. 126 5.6.8. Costs and socioeconomic impacts .................................................................................. 128 5.6.9. Degree of innovation......................................................................................................... 129 5.6.10. Discussion and conclusions.............................................................................................. 129 5.6.11. Major Steps Forward ......................................................................................................... 129
6. General Conclusions and Recommendations ......................................................131 6.1 THE OVERALL ROADIDEA PROJECT METHODOLOGY...................................................................... 131
6.1.1. Assessment ......................................................................................................................... 131 6.1.2. Conclusions and Recommendations ............................................................................... 133
6.2 RETROSPECT ANALYSIS OF THE INNOVATION PROCESS.................................................................... 134 Figure 6.1: Positioning of the ROADIDEA Innovation Work............................................................ 134
6.3 OPPORTUNITIES FOR FUTURE DEVELOPMENT .................................................................................. 137 References .............................................................................................................139 Annexes .................................................................................................................141

ROADIDEA 215455
7/141
1. Introduction
1.1. The ROADIDEA project The ROADIDEA project looks into the development of road traffic – related ITS mobility services for the public and private sector. One significant aim is to consider the long-term perspectives in the road-related ITS development introducing innovation as a key driver of the process. Creating new service ideas by combining existing and new data sources is the decisive element in these considerations. Thus, ROADIDEA studies the innovation potential of the European ITS sector by analysing available data sources, revealing existing problems and bottlenecks for data utilisation and service build-up. ROADIDEA also makes an effort to develop better methods and models to be utilised in different service platforms. ROADIDEA’s objective is to produce ideas for ITS services and applications in the field of road traffic and transport which are innovative and which bring about an added value to the current state-of-the-art. These ideas should arise from considerations about using different data sources, merging data and data modelling. For this reason, the project comprised a number of elements: a data platform (cf. chapter 4), two innovation seminars where participants generated ideas (cf. chapter 2), some of which have been further developed into pilots (cf. chapter 5)and eventually, the process itself which was subject to evaluation (cf. chapter 3).
1.2. The evaluation process The entire evaluation plan as well as the methodologies and tools employed have been described in D8.2. A preliminary version of D8.3 (a) comprised the validation and evaluation results available by the end of November 2009. The report at hand (D8.3) is now the extended final version of D8.3. It does not only cover the evaluation of the ideas, the innovation process, the ROADIDEA platform and the self-evaluation of the pilots, but also the final evaluation results of the pilots. After the submission of the a-version, during winter 2009/10, the evaluation of the pilots continued because some pilots (e.g. the Friction Pilot) could be better evaluated under real winter conditions. For this reason, the deliverable D8.3 was first divided into two versions: D8.3a and D8.3b. They are not to be understood as complementary, but rather the latter being the further development and extended version of the first. D8.3a is an integral part of D8.3b. The final version after the Final Review is now called D8.3. The evaluation process comprises the above mentioned elements. There were two innovation seminars, one in May 2008 in Prague and another one in May 2009 in Dubrovnik. The invited attendees of these workshops were mainly ITS and road weather experts from Europe. Each workshop lasted two days during which the group has undergone a process of idea development organised, facilitated and monitored by Work Package 5. The participants had been divided into smaller innovation teams and developed their ideas which they later presented to the plenum.

ROADIDEA 215455
8/141
The evaluation process began at the seminars, when participants were asked to rank ideas and to fill in questionnaires. Ideas were assessed at two levels, with regard to their innovativeness and with regard to the service concept. Moreover, the process of how the ideas were generated was also subject to evaluation by a questionnaire. Some of the ideas from the first seminar have been taken further and were developed into pilots. As a result, there are three conceptual pilots and one application pilot. The pilots received higher attention and have been looked at in more detail. In a first step, the self-evaluation of the pilots has been done with a tool from the Finnish Research Institute VTT who developed an evaluation platform in a previous project (EVASERVE). The tool is a worksheet (AINO) for self-evaluation (ex ante) that helped the pilot representatives to become clear of what their pilot was about. The filled AINO worksheets are annexed to this report (Annex 1). In addition to the self-evaluation, more detailed evaluation concepts for the pilots were elaborated for a deeper evaluation. The predecessor report, ROADIDEA deliverable D8.2 (Final Validation and Evaluation Plan), described the subject matter, i.e. what is going to be validated and evaluated, and the methodology, i.e. how this was going to be done. This final deliverable of WP8 does now compile the results of the evaluation process, i.e. the assessment and validation of its elements, namely the platform, the seminars, the ideas and the pilots. The ROADIDEA data platform was subject to a specific evaluation concept. The results are presented in chapter 4.
ROADIDEA 215455
9/141
2. Results of the idea evaluation
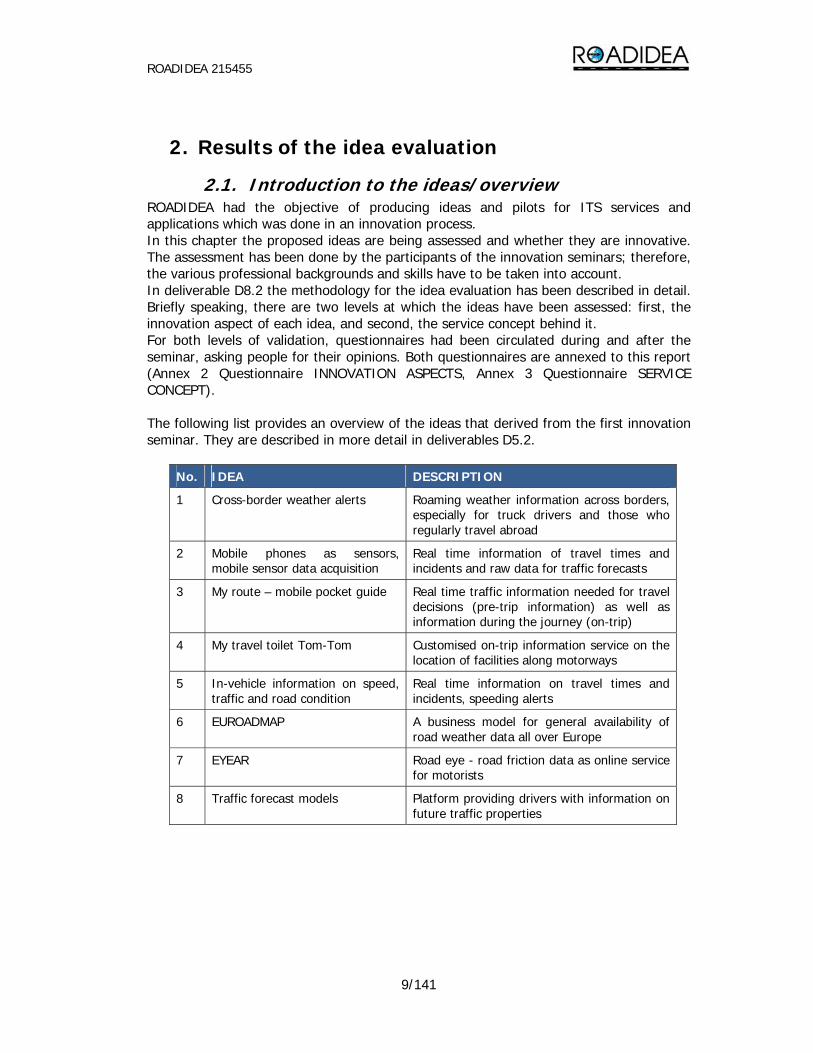
2.1. Introduction to the ideas/overview ROADIDEA had the objective of producing ideas and pilots for ITS services and applications which was done in an innovation process. In this chapter the proposed ideas are being assessed and whether they are innovative. The assessment has been done by the participants of the innovation seminars; therefore, the various professional backgrounds and skills have to be taken into account. In deliverable D8.2 the methodology for the idea evaluation has been described in detail. Briefly speaking, there are two levels at which the ideas have been assessed: first, the innovation aspect of each idea, and second, the service concept behind it. For both levels of validation, questionnaires had been circulated during and after the seminar, asking people for their opinions. Both questionnaires are annexed to this report (Annex 2 Questionnaire INNOVATION ASPECTS, Annex 3 Questionnaire SERVICE CONCEPT). The following list provides an overview of the ideas that derived from the first innovation seminar. They are described in more detail in deliverables D5.2.
No. IDEA DESCRIPTION
1 Cross-border weather alerts Roaming weather information across borders, especially for truck drivers and those who regularly travel abroad
2 Mobile phones as sensors, mobile sensor data acquisition
Real time information of travel times and incidents and raw data for traffic forecasts
3 My route – mobile pocket guide Real time traffic information needed for travel decisions (pre-trip information) as well as information during the journey (on-trip)
4 My travel toilet Tom-Tom Customised on-trip information service on the location of facilities along motorways
5 In-vehicle information on speed, traffic and road condition
Real time information on travel times and incidents, speeding alerts
6 EUROADMAP A business model for general availability of road weather data all over Europe
7 EYEAR Road eye - road friction data as online service for motorists
8 Traffic forecast models Platform providing drivers with information on future traffic properties

ROADIDEA 215455
10/141
9 Free data The availability and accessibility of environmental data in Europe is poor. Some data can be accessed with well specified rules (e.g. weather information from public sources) but the price may be intolerable for small service providers. Some other data may not be accessible at all or be very difficult to get (e.g. road weather information in some countries). The situation is very inhomogeneous in Europe, depending on the data policy applied by the authorities.
10 RTFM “Read That Fine Manual” – Better user interfaces with regard to text, image and audio, taking into account personal requirements of users such as language, disabilities, age, health and other personal needs
11 STAYHOME Better means to work at home in order to reduce traffic
The ideas of the 2008 seminar have been assessed in two different aspects: first, the innovativeness (cf. 2.2.1) and second the service concept behind the idea (cf. 2.2.2). In the second innovation seminar the ideas of the first seminar where validated with regard to whether they had been developed further since the Prague workshop and it was decided upon which were to be short-listed. In addition, the futures workshop of the second seminar used brainstorming in three groups and two evaluation cycles to find five best ideas for 2030. Thirteen ideas were short-listed and ranked by the participants in the course of the seminar. These are the top five (in order of preference):
No. IDEA DESCRIPTION
1 Semi-public transport Service production & support systems of advanced private & public transport services
2 DYNAMOBI Cooperative dynamic navigation, multimodal and scalable
3 No-man driving Autonomous driving
4 Waste to energy Bio-waste used as energy for cars
5 TRAWORK Travelling on offices - working on transport
The ideas of the second innovation seminar as well as the seminar itself are described in more detail in D5.3 including an evaluation of the workshop’s procedure. An assessment of the second round of ideas has been done by the evaluation experts of WP8 of the ROADIDEA project (cf. 2.3)

ROADIDEA 215455
11/141
2.2. The evaluation of ideas from the first innovation seminar (Prague 2008)
2.2.1. The innovation aspects ROADIDEA is about generating radical new ideas for transport, so the innovation aspect is a core issue. In deliverable D8.2, chapter 3.2.1 the meaning of “new” and hence the definition of “innovation” has been discussed. An idea or service is not necessarily new, but can still bring added value to the current state-of-the-art, e.g. with a new element. The added value is an improvement and in this case ROADIDEA defines it as innovation. The innovation aspect of an idea has been assessed with a questionnaire (Annex 2 Questionnaire INNOVATION ASPECTS). The following Table 1 is a matrix showing the scores that each evaluating expert has given to the idea that he/she assessed. Below is the explanation of the scores. It has to be pointed out that the numbers do not reflect a continuous ranking, in some cases they are codes for different aspects, allowing for a qualitative assessment only. This is the reason for not putting the results in a quantitative validation. However, the numbers still provide a clue of how good an idea is in certain aspects of innovation. Idea no. 7 (EYEAR) has been validated by two experts separately and it is interesting how both gave slightly varying scores. Especially the last question, asking for the public interest in this idea, has been judged differently, probably due to their different backgrounds. Altogether the results can be summarised as follows: Most ideas have been judged as only little innovative or radical, because they already exist on the market, but apart from the Toilet-Tom-Tom all ideas have still been admitted at least some added value. Furthermore, the majority of ideas have been seen as small-scale innovations, but to have a large impact. Idea no. 9 (FREEDATA) was judged by the evaluator as a large-scale innovation with large impact. Regarding the potential of an idea for multiple uses the Toilet-Tom-Tom received the verdict of not solving any known problem. The relevance of most ideas to global policy objectives is rated average with usual impact. FREEDATA and STAYHOME have been seen as clear strong contribution to sustainable development with a strong impact whereas the Toilet-Tom-Tom and EYEAR were thought to be a minor contribution to global policy objectives at a low level. The evaluators judged most ideas as feasible, i.e. able to be implemented with an average effort and risk. Only three ideas, namely CROSS BORDER WEATHER ALERTS, EUROADMAP and FREEDATA are hard to be implemented in the short run. TRAFFIC FORECAST MODELS are judged to be easy to implement. The assessment of the relevance for business generation has been very heterogeneous. EUROADMAP, EYEAR and FREEDATA are seen as clear business cases with a large market. All other ideas are either unclear business wise, but may have some potential in the future or clear cases from today’s viewpoint, but only addressing a small market. The picture that is drawn by the evaluators for the public interest in the ideas is clear and has a business case. Public interest, but without a business case, is stated for CROSS BORDER WEATHER ALERTS. FREEDATA, RTFM and STAYHOME are of only some public interest.

ROADIDEA 215455
12/141
EVALUATION OF INNOVATION ASPECTS OF IDEAS FROM THE 1st INNOVATION SEMINAR 1 2 3 4 5 6 7 8 9 10 11
Innovation Aspects
CROSS‐BORDER WEATHER ALERTS
MOBILE PHONES AS SENSORS,
MOBILE SENSOR DATA
ACQUISITION
MY ROUTE MOBILE POCKET GUIDE
MY TRAVEL TOILET TOM‐TOM
IN‐VEHICLE INFORMATION ON SPEED,
TRAFFIC AND ROAD CONDITION
EUROADMAP EYEAR TRAFFIC FORECAST MODELS
FREEDATA RTFM STAYHOME
New or innovative 1 1 1 0 1 2 1 2 0 0 0
Relation to the state‐of‐the‐art 3 3 3 1 3 3 2/3 2 3 3 3
Scale and potential impact of the idea
2 2 2 1 2 1 3/2 2 4 1 2
Potential for multiple use 3 3 2 0 3 2 3 3 3 3 3
Relevance to global policy objectives
2 2 2 1 2 2 1/2 2 3 2 3
Feasibility of the concept 1 2 2 2 2 1 1/2 3 1 2 2
Relevance for business generation
1 2 2 2 2 3 2/3 2 3 1 2
Public interest 2 3 3 3 3 3 1/3 ‐ 1 1 1
Comments difficult to analyse in detail
difficult to analyse in detail
Evaluator Armi Vilkman
Armi Vilkman Djurdjica Markovic
Djurdjica Markovic
Armi Vilkman Rene Kelpin J. Dubbert, P. Nurmi
Igor Grabec L. Hyvätti, P. Saarikivi
L. Hyvätti, P. Saarikivi
L. Hyvätti, P. Saarikivi
Table 1: Matrix of the innovation aspects’ assessments

ROADIDEA 215455
13/141
New or innovative: 0=the idea exists and is on the market already, 1= similar services on the market but idea has some new aspects, 2= completely new idea not known to be implemented, 3= completely new idea not known to be developed anywhere, 4= revolutionary and radical new idea Relation to the state-of-the-art: 0=no added value, 1= unclear added value, 2=minor added value, 3=large added value, 4=revolutionary Scale and potential impact of the idea: 0=no foreseen impact, 1=small scale innovation, small impact, 2=small scale innovation, large impact, 3=large scale innovation, small impact, 4=large scale innovation, large impact Potential for multiple use: 0= does not solve known problems, 1=solutions for a single problem, 2=solutions for a few deployment cases, 3=solutions for many similar deployment cases, 4= revolutionary new solution with multitude of potential deployment sectors Relevance to global policy objectives: 0=no clear contribution or idea politically not accepted, 1=low contribution, 2=average contribution with usual impact, 3=clear strong contribution to sustainable development, strong impact, 4= revolutionary new concept solving key problems in society Feasibility of the concept: 0=idea hard to implement in general, 1=idea hard to implement in the short run, 2=idea can be implemented with an average effort and risk, 3=idea easy to implement, 4=industry will compete on this idea for quick implementation Relevance for business generation: 0=no business opportunity foreseen, 1=unclear business case, some potential maybe in the future, 2=clear business case today, but small market, 3= clear business case, large market, 4=killer application, large market Public interest: 0=no public interest in the idea, 1= some public interest, 2=clear public interest, but no business case, 3= clear public interest with business case, 4= public will go wild with this idea
2.2.2. The service concepts The ideas from the first innovation seminar (2008 in Prague) have been assessed with regard to the service concept. A questionnaire (Annex 3 Questionnaire SERVICE CONCEPT) has been developed by METI and Pöyry based on the AINO worksheet and was handed out to representatives of the idea teams of each individual idea in order to evaluate it. The goal was to support a self-evaluation by the idea teams within a limited scope. The AINO worksheet, which is being employed for the evaluation of the pilots, would have been too complex and detailed for the ideas. The expected depth of the defined service concept for pilots is more developed than the one of the ideas. This concise version of the questionnaire for the ideas consists of twelve questions about such issues as user needs, data availability, technical implementation etc. Different to the evaluation of the innovation aspects, the assessment of the service concept is not being translated into numbers, i.e. it is a qualitative analysis that assesses each idea individually. Further to the description of each idea, it was not intended to compare the ideas in a ranking, but rather learn about barriers that have to be overcome for a possible implementation of the service. The approach is therefore descriptive, drawing conclusions from what the evaluators have written and identify systemic obstacles.

ROADIDEA 215455
14/141
At the end of each summary of the evaluator’s answers the core evaluation team provides, as the case may be, additional information and/or a conclusion regarding general relevance of the service and how far the concept has advanced. The literal questions of the questionnaire were these:
1. Are you aware of what kind of data is needed for the idea and are they available?
2. What is the problem to be solved by the idea?
3. Are you aware of what is need to be done for technical implementation of
the idea?
4. Who are the primary costumers/users of the idea?
5. What is the user need behind the idea?
6. Via which channels can users access the idea/services?
7. Is there a potential for wider exploitation of the idea (business opportunities)?
8. Are there similar products on the market?
9. Is there a potential for wider commercial exploitation of the idea?
10. What are the most important benefits for the user? (the added value)
11. Is the idea something completely new or does it represent the
development of an existing service?
12. Are you aware of the socio-economic impacts of the idea? The following is a summary of the evaluators’ statements given to each of the ideas: 1 CROSS-BORDER WEATHER ALERTS
Evaluator: Armi Vilkman This idea is about roaming weather information across borders, especially for truck drivers, but also for those crossing borders when travelling. Prerequisite for the service is the availability of weather forecasts connected to roads, routes and areas, its standardisation across national borders, a common architecture and a service platform. The primary users and potential customers are mainly hauliers and truck drivers, but also anyone who crosses a country border as tourist or on business travel. The users’ need behind the idea is to get relevant real time alerts of bad weather through the internet, the radio or the hauliers’ proprietary services; its benefits are awareness of disturbance in transportation. The idea is considered as having possible potential for a wider exploitation. There is a similar service on the market: www.truckinfo.ch.

ROADIDEA 215455
15/141
Addendum from the evaluation team Some research into cross-border weather information has been done in the framework of the Euro-regional CENTRICO project for the Benelux countries. The new aspect of this idea would be a Europe-wide coverage of data and service availability through various devices (incl. mobile) rather than the technological elements. Conclusion from the evaluation team The idea is relevant and builds on existing elements. Users have been identified. The general concept is clear, but would need some further substantiation. Problems to be solved are mainly in the domain of providing international services, data platforms and clarifying the organisational and legal issues behind the idea. 2 MOBILE PHONES AS SENSORS, MOBILE SENSOR DATA ACQUISITION
Evaluator: Armi Vilkman Mobile phones are located on the roads and could be used to calculate travel time between known points and thus provide real time information. The raw data could also be used for traffic forecasts. In order to implement such a service agreements with mobile phone operators and users have to be sought. Moreover, a data platform would be used for data collection, modelling and service providing). Primary customers/users would be all traffic related services for which real time information is highly relevant. The information could be spread via the internet, the radio, navigation systems (TMC) and mobile phone services, it would make drivers aware of the traffic situation (before and on-trip). According to the evaluator there is possible potential for a wider exploitation even though there are already similar products on the market. The idea is not completely new. Several field tests have been carried out in different European countries. Due to unresolved organisational and legal aspects the realisation of such a service is still pending. Conclusion from the evaluation team The service idea is very good and mature, but not very new. However, as the evaluator says, the key barriers for a wider implementation are organisational and legal aspects – in this respect innovation is needed. 3 MY ROUTE MOBILE POCKET GUIDE
Evaluator: Djurdjica Markovic My Route Mobile Pocket Guide is a system for providing travel information and updates over a mobile network. For precise travel decisions it is important to get real time traffic information (pre-trip information as well as on-trip). A full realisation of this idea mostly depends on the combination of current and forecast traffic and weather data. There is a need for both, temporal and spatial data coverage. Existing raw data cannot be used directly – data fusion or integration is necessary as well as aggregation to add value. Data is available but not affordable in the quantities needed for the service. For a technical implementation the data would have to be standardised across country borders and have a common architecture. Moreover, a platform is needed to provide the service. The primary customers/users would be ITS-service providers, road authorities and drivers, and they would be offered relevant real time and forecasted traffic related

ROADIDEA 215455
16/141
information for pre-/on-trip planning via mobile phones, PNDs, navigation systems (TMC or GPRS) or mobile internet. The application is suitable as much for private drivers as for businesses (transportation and consultants dealing with mobility issues) and it could supply traffic information to (local) governments such as public authorities dealing with traffic flows (urban planning and economics, policymakers). There are similar products on the market, but they are not “ready”, they do not connect weather and traffic data in a proper way, the information the traveller gets is usually already out of date and that is often irrelevant to travellers’ personal route, it only covers parts of the highway network and delays are given in kilometres instead of minutes. The idea is not completely new, but connecting weather and traffic data in one service; it needs further development of some existing ideas. With regard to the difference between invention and innovation (cf. 2.2.1) this denotes an innovation. Overall benefits of the service are the reduction of incidents and emissions from vehicles, thus increased safety and lower environmental impact from transport. Conclusion from the evaluation team This idea is asking for a dynamic Europe-wide mobile traffic and weather information service; it is very ambitious because it requires international cooperation in the fields of traffic information and weather information. 4 MY TRAVEL TOILET TOM-TOM
Evaluator: Djurdjica Markovic The idea is to provide information on the location of facilities along the motorway through the navigation system, i.e. on-trip information. There is a need for spatial data coverage for the application. The database should consist of facilities categorised by position, purpose, size, opening time. Known raw data could be used directly, but has to be updated regularly. The technical implementation could be realised through some other navigation and location-based service (LBS) applications. Distribution of the information could happen through mobile phones, PNDs, navigation systems (via TMC or GPRS) or mobile internet. Potential primary customers/users are drivers, ITS-service providers and consultants dealing with mobility issues. The service would provide the users with relevant on-trip information. There is clear potential for a wider exploitation, e.g. as part of some other Tom-Tom service, even though similar ideas already exist on the market. The most important benefit is a gain in information and better service for drivers and passengers. The idea is an upgrade of existing services with location-based information, thus an innovation rather than an invention. The service covers needs of disabled persons and mothers with small children. Conclusion from the evaluation team The service might be a good and original add-on to existing services. The concept as such will certainly contribute to more convenience, but the benefit is limited.

ROADIDEA 215455
17/141
5 IN-VEHICLE INFORMATION ON SPEED, TRAFFIC AND ROAD CONDITION Evaluator: Armi Vilkman
This idea is about providing real time information of travel times and incidents as well as alerts of speeding if the case may be. The data needed are localised (georeferenced) information on speed limits (per road sector) and real time data of traffic and road conditions. For technical implementation a data platform is needed (data collection, modelling and providing) and technical devices to receive the information (PNDs, mobile phones, fixed car devices etc.). The service is for all road users who seek real time information and alerts. The most important benefit is probably improved awareness of the traffic situation (before and on-trip) and a reduced risk of speeding. It is expected that there is potential for a wider exploitation of this idea. However, similar products are already on the market. Conclusion from the evaluation team The idea concept would need more detailing in order to highlight the innovative aspects. The functions described are either already existing or subject to further research. The key problem to be solved is to provide such a service Europe-wide for everyone. 6 EUROADMAP
Evaluator: Rene Kelpin The idea is a business model for trading generalised availability of road weather data all over Europe. Data is partly available. Beyond the planned scope (data visualisation) it is not fully clear what is needed for the implementation. Primary users are clearly ITS-service providers, road authorities, fleet dispatchers, content providers, newspapers etc. One “European clearing house” for road weather data as a central trading platform with a lot of related information. With the given idea description it was planned to establish a data visualisation portal. Hence, information is to be accessed via the internet. There is potential for wider exploitation. The business model is sketched in the idea wiki (http://www.roadidea.eu/community/wikis/Innovations/EUROADMAP.aspx). It is planned to provide and trade different steps of aggregation of road weather data from raw data from coloured maps (colour changes with weather state) to road weather maps for print journals, web sites and other content providers. No such service exists so far. A similar approach has been considered with the EU research project Track&Trade, which was ended in October 2008. The focus of Track&Trade was on floating car data (FCD) and its utilisation for business models. However, no implementation activities were performed during the project. Once a general overview of availability of road weather data sources has been obtained and potential business partners have been identified, a wider commercial exploitation could be started. The most important added value is to include road weather related expert knowledge into proprietary applications, services, websites and print materials. As mentioned earlier, neither the idea nor the business model is completely new, but, on the field of road weather data it is new and challenging in terms of a Europe wide consideration and implementation of all existing data sources. This has to be considered as a major step towards road weather data standardisation, which has been requested by the EU.

ROADIDEA 215455
18/141
No particular socio-economic impact can be pointed out now; it might be generalised as a further step towards improved monitoring of road conditions and hence towards better traveller information and road safety. Conclusion from the evaluation team This idea has been described and validated sufficiently by the evaluator. 7 EYEAR
Evaluators: Jörg Dubbert and Pertti Nurmi The idea is centred on friction data collection and transmission. It is supposed to improve the detection of road friction data by introducing measurements based on floating vehicles. In this sense, EYEAR is a form of an extended floating car data detection technology. The vehicle is used to carry optical friction sensors and brakes sensors which detect the degree of the local friction on the road. At the end stands an online service for motorists. The detection of friction data is subject to current research of the automobile industry. The current state of research is that the data should be available. The problem is to create the critical mass of data for the operation of this application. The technical implementation could be realised through networking cars by mobile radio, connecting a larger number of cars, generating a GIS database with friction values for the road network, sending warning messages to cars as a service. Motorists or any other users of navigation systems are the potential users of this service which provides them with timely and accurate warnings of slippery roads via navigation systems, driver assistance systems. The application is a functional extension of driver assistance systems and has thus potential for wider exploitation. It will achieve a wider impact when ADAS (Advanced Driver Assistance Systems) are common car equipment. The application might become compulsory in countries where slippery roads are an issue (e.g. in Northern Europe). It may well be that the idea has already been considered by the research departments of the automobile industry. ADAS form already a good basis for this application, which could be a useful extension of driver assistance systems. The telecom industry might develop further services and an opportunity to get traffic information onto mobile phone networks. The most important benefit for users is online warning of slippery roads. The idea is not completely new; approaches to combine friction detection and to extend FCD have been considered before. However, it is not known to be on the market already. The idea would contribute to the development of the service society. Moreover, it will contribute to the competitiveness of the car and telecom industries. Conclusion from the evaluation team The individual modules needed for this service are either already available or subject to current research. However, the combination into one service would be an innovation. The development of a viable business case including feasible solutions for the service operation as well as legal aspects would be a challenge though.

ROADIDEA 215455
19/141
8 TRAFFIC FORECAST MODELS Evaluator: Igor Grabec
The idea is to develop a platform offering drivers information on future traffic properties. Potential customers of the service are all traffic participants, but also institutions and services. Users need a PC or a mobile phone. Apparently, there are no similar products on the market so far and therefore potential for a wider exploitation. The most important benefit of the application would be an aid for trip planning which is a completely new service. According to the evaluator, there are no socio-economic impacts. Conclusion from the evaluation team Traffic forecast models are certainly a benefit for road users and there is still need for better forecasts which are available online. In this regards, the topic of this idea is relevant and covers aspects that need further development (e.g. extending the forecast horizon and merging data, such as weather and traffic data). The idea does not so much describe a particular application or service, but rather shows the field for further research potential. Therefore, the questionnaire was only partly applicable to this idea, which remains very general. 9 FREEDATA
Evaluator: Pirkko Saarikivi The problem to be solved with this idea is the poor availability and accessibility of environmental data in Europe. Some data can be accessed with well-specified rules (e.g. weather information from public sources) but the price may be intolerable for small service providers. Some other data may not be accessible at all or very difficult to get (e.g. road weather information in some countries). The situation is very inhomogeneous in Europe, depending on the data policy applied by the authorities. So the idea does not deal with an application or service, it is rather a data policy matter and concerns all environmental data. For a technical implementation the best solution would be to establish public data servers where users could download the data they need. This should be either completely free or charging an appropriate service fee. The primary users/customers would be the European service providers for weather, transport and other environmental services. The good accessibility of information is a prerequisite in developing knowledge-based services. The present situation is very bad in some parts of Europe and for some data in particular. Compared to the entirely open data policy in the USA, this gives them a competitive advantage over Europe. The channel through which data should be provided is most likely the internet (via ftp or other fetch). Free data policy is accelerating the development and use of information services. To compare: in the US there are about 10 times more businesses in this sector than in Europe, though the markets and target audience are about the same size. Exploitation of freely available data would be mainly commercial. Some applications would be public services, thus a free data policy helps developing public services too. Problems are however mainly related to private service provision. With free data users will get more and cheaper services, since service providers are able to develop new services with better access to data. This is not a new idea. Work towards more open data policy in Europe has been going on actively for more than 10 years. More and better services would results in larger

ROADIDEA 215455
20/141
impacts. For transport services this would mean e.g. an increase in traffic safety, saving human lives and property, reducing congestion and emissions and generally improving quality of life. Conclusion from the evaluation team As the evaluator correctly explains FREEDATA is not about an application as such but rather an idea of how data policy should change in Europe. Unfortunately, the idea does not say anything about the way to influence data policy or existing barriers. 10 RTFM (“Read The Fine Manual”)
Evaluators: Lulu Hyvätti, Pirkko Saarikivi It is very common that a good service idea is destroyed by the poor design or otherwise difficult user interface. So this idea is about better and tailored user interfaces with regard to text, image and audio, considering personal characteristics of users such as language, disabilities, age, health and other personal needs. The availability of data is not an issue. Product developers should be aware of this problem and what needs to be done in order to improve user interfaces. There is no particular user group for this idea; it concerns all users of all products and services. In order to achieve a popular and sustainable transport service, the user interface must be easily comprehensible. The idea is general and concerns all services, not only those for transport; and it is not bound to any particular channels of distribution; but applies to all kinds of media. With regard to exploitation potential, better user interfaces automatically mean better and more sustainable business. The benefit for users is that they are finally able to use the services without too much trouble during the learning period. The idea is not new, difficult user interfaces have always been a common problem. Better user interfaces would mean wider use of services. Thus all resulting impacts (increased safety, positive environmental impacts etc.) would be larger as well. Conclusion from the evaluation team As idea no. 9, FREEDATA, this one too is about an approach rather than a concrete service or application. It still qualifies for an innovation, because what it describes would have added value for the service to which it is being applied. Since it is a rather conceptual idea it is difficult to evaluate. 11 STAYHOME
Evaluators: Lulu Hyvätti, Pirkko Saarikivi The idea is to develop better means to work at home in order to reduce transport. This is a general idea and not connected to any specific data. However, for more home office and better virtual services to be used at home, more data might be necessary. Beneficiaries of this idea are people who work at home; especially those dealing with information of any kind. There is urgent need to reduce total transport volumes. Working in general should be more flexible, and not only be performed in company offices. Virtual office services are mainly accessed through the internet. Possibilities to work at home should be a major

ROADIDEA 215455
21/141
trend in our society, thus leading to related business opportunities (e.g. software), so there is in fact a large potential for wider exploitation of this idea. Some solutions for e.g. web-conferencing already exist. However, more product development is needed to make these fully functional and flawless, having all the main advantages of working physically in the company office. Users would save a lot of time (and money) by not having to drive to work everyday. Working from home is an old idea and much investigated, but there are still a lot of unexplored possibilities. Socio-economic impacts would be very large (e.g. smaller carbon footprints) due to reduced traffic volumes. Conclusion from the evaluation team Here again, we have a conceptual idea like the two ideas before this and not related to any specific data, as the evaluator points out, and does not describe an application which is why an evaluation is difficult. An overall evaluation of the quality of service concepts in the context of innovation ideas is difficult for a number of reasons: in some aspects the ideas show similarities, but in others they differ a lot, e.g. the development stage, and not all ideas deal with concrete service applications, but rather concepts or directions in which data policy in Europe should go. What can be concluded from the evaluators’ remarks are some systemic barriers, which have either directly or indirectly been noticed. First, data availability across national borders as well as compatibility of data formats between systems, and second, open-mindedness of stakeholders of different professional fields to cooperate.
2.3. The evaluation of ideas from the second innovation seminar (Dubrovnik 2009)
Introduction The service ideas that evolved from the second innovation seminar held in Dubrovnik in 2009 have been assessed and ranked during the same seminar by all the participants. There is an issue about having the selection being done by the same people who generated the content. The risk of a bias is relatively high compared to an independent evaluator. This is especially true if the assessment is being done openly in the group rather than afterwards and anonymously. On the other hand does the evaluation require expert knowledge and it would have been difficult to find and employ other experts than those who had participated in the workshop in the first place. For this reason the evaluation has been done by the WP8 team that consists of evaluation experts from various fields, but mainly ITS related. The assessment covers the ideas as well as conclusions on the workshop methodology. A description of the ideas has been done in the framework of WP6 (cf. D6.4). The workshop has been described and assessed in WP5 (cf. D5.3).

ROADIDEA 215455
22/141
1 SEMI-PUBLIC TRANSPORT This idea is about public car-pooling using electric vehicles. There are several new service aspects such as tracking, on-board entertainment, inter-modality, service levels, booking convenience etc. Some of the major issues that need to be addressed when further developing this idea into a possible service concept are listed in D6.4, e.g.:
Legal barriers (different from country to country) Tax reduction to prioritise car pooling vis-à-vis private cars Safety and responsibility issues Ownership and service provider The role of railways
Another issue that has not been mentioned is the geographic aspect, i.e. issues related to whether the car pooling is used in big cities, small and medium cities or in rural areas. We believe that the concept is only feasible in cities where the transport demand reaches a certain level and users would not be limited in their individual and spontaneous mobility due to a large number of participants. In rural areas there might not be enough people in the pool whose mobility behaviour is either complementary or congruent, so as to make the concept feasible, and other than in cities the private car might be the only alternative to the shared car, due to a lack of public transport (railway, busses) and to long distances for walking or cycling. As this is a qualitative assessment, we suggest that the idea of this new service concept should be analysed quantitatively in order to be able to better define the critical number of participants needed to make the service work – logistically as well as economically. Soft factors like user acceptance have not been taken into account either, although in our view this is a crucial matter. The best technology and the best service concept can fail if you do not have a reasonable user acceptance. Attitude and behaviour of people play an important role in transport and mobility, and experience has shown that flexibility and readiness to change one’s habits are not necessarily strong characteristics of most people. Therefore, we argue that a service idea needs to pay a due amount of attention to how it is supposed to involve the (potential!) users. A very much up-to-date aspect in this context is that of data privacy protection. It was suggested to enable the tracking not only of vehicles, but also of passengers. Even if the service provider can guarantee that this will only be done with the explicit approval of the individual passenger, this will stir up a debate. Regarding on-board services that might be offered to users of the car pool, we see a good chance for such a service to be realised in the near future, but rather in taxis or on busses, underground and commuter trains than in shared cars (when they are chauffeur-driven they are effectively taxis). This part of the idea links to idea no. 5 TRAWORK. Some aspects of the idea and the related service concept are to be clarified, e.g. the 3-dimensional taxi traffic navigation. The flying taxis which are mentioned in the description add some futuristic zest, but the technological development needed seems less relevant in the context of ITS.

ROADIDEA 215455
23/141
2 DYNAMOBI This service concept is very much focussed on ITS and it sounds like a mobility utopia. The idea even recognises the need for a change in mobility behaviour for the sake of the environment. The user acceptance of this service, which is a prerequisite as said for idea no. 1 SEMI-PUBLIC TRANSPORT, is considered as higher, for the level of service is aimed at a high standard. A limiting factor for this concept are the general market forces. Commercial interests will lead to competition between the different transport service providers or the stakeholders of individual modes of transport (e.g. the automotive industry). This might cause an imbalance and put a barrier to an independent multimodal navigation service. It can be questioned whether market regulation would solve this problem. The weakest point of this idea is that it is not clearly innovative. A lot of research and financial as well as political support is targeted at developing multimodal transport networks including navigation and other user support. 3 NO-MAN DRIVING This is certainly the most ITS related service idea of all. However, regardless of the technical implementation, into the development of which is being put a lot of effort and money already, the liability and assurance issue needs to be addressed too. This can only be done in relation to the reliability of the technology and will be a long-term process. It should also raise a discussion about any (positive and negative) side effects of the liberation of responsibility when not self-driving. One of the topics mentioned in the idea descriptions is the need for vehicle-to-infrastructure, vehicle-to-vehicle as well as infrastructure-to-vehicle technology. Nothing has been said about interaction with cyclist or pedestrians. 4 WASTE-TO-ENERGY This cradle-to-cradle idea of using waste to fuel the cars is good, provided the production is going to be environmentally sound and sustainable. In addition to this the idea should take into account any indirect effects of new technologies, i.e. how much waste is needed and what happens if there is a shortage? How would the market react? Allowing tax refunds for the production of biogas or bio waste bears a risk of the industry producing more waste again. Regardless of these questions, that need to be addressed, the idea lacks a connection to ITS services, although it might be conceivable that specific ITS is needed to support this application (e.g. for fuelling).

ROADIDEA 215455
24/141
5 TRAWORK The service concept of this idea is not so much related to ITS than to offering on-board services specifically targeted at white collar workers whose working equipment consists of a computer and a telephone alone. A prerequisite for such a service is the paperless office that is being practised increasingly, but is still new to most staffs. There surely is a potential for a number of services related to working while travelling. The two major restrictions to this concept are perhaps that a lot of people are not working at a computer and that the services will probably only be used on journeys with a certain minimum duration. Considering this, multimodality is contra productive in this respect: my working will be interrupted every time I change the means of transport. The second part of the idea is a logical consequence of the first: if I lose time (and create costs, economic as well as environmental) by travelling then the goal should be to reduce the need for travel, e.g. by using telecommunication services (e.g. web conferencing). To provide the necessary infrastructure for office work (hardware that not everyone has at home such as printers, plotters, scanners) in localised communal offices seems to be simple but effective and certainly feasible to some extent. The effect of improving social interacting is to be rated very high, especially in view of home offices leading to more isolation. Another positive aspect of working together in the same place with people from other professions or fields of activity could be that it offers opportunities for interdisciplinary learning. As mentioned in the idea description, both ideas are already widely studied in practice. So the innovative aspects have not really been demonstrated or need to be elaborated. The concept is primarily not about new ITS services although ITS functionalities could be conceived which support these mobility patterns. 6 LEGO BRICK TRANSPORT To have modular means of transport seems very futuristic and therefore a little difficult to imagine, especially the idea of having tubes as infrastructure instead of roads. The transition from one type of infrastructure to another one is going to be difficult: will the tubes be up on stilts, on the roads or underground? To build lightweight vehicles seems a very good idea though, but it is not innovative. The safety issue has been left out altogether. If a new industry will be created for the technology of modular cars, then there is sure to be a market with its own forces too. It is very unlikely to have different manufacturers who build fully interoperable modules. There is likely to be a tendency to have proprietary systems, incompatible with those of other manufacturers. Taking into account the transport needs of different user groups is to be rated high and should play a role when thinking about new ITS services (mobility for an aging society).

ROADIDEA 215455
25/141
RECOMMENDETIONS FOR THE SEMINAR METHODOLOGY When evaluating the results of the innovation seminar one has to take into account the circumstances, i.e. the working environment, the methodology etc. under which the ideas have come into being. The external factors have an influence on the results. Workshops of this kind should be carried out and supervised by senior ITS experts who provide guidance and advice during the workshop and who can deliver an independent evaluation afterwards and who can guide the direction of the discussions during the seminar. It is vitally important that the expert has ITS background to prevent the innovation process from wandering from the subject. The knowledge of ITS policy enables the identification of barriers and drivers as well as of the needs for policy amendments. When asking the seminar participants to evaluate their own ideas within the plenum one should bear in mind that regardless of the scientific background of the evaluator, and whether he or she is an expert or not it is likely (and only natural) to favour those ideas which are a) well explained and b) well illustrated and catchy. This implies a risk of those ideas being ranked higher the owner of which is a good presenter and can sell his/her idea to the participants. However, this might not necessarily be the most relevant idea regarding the need for new technological developments. And on the other hand, an idea might be considered mediocre even though it might actually be very relevant, only because it is not well presented or is not very appealing. Given the time available at the event of the workshop, the introduction of different social development scenarios should be considered carefully with regard to the costs (time), the risk of distracting from the actual topic at hand (here: ITS) and the benefits for the innovation process (to aid creativity). In order to make the most of the ideas generated in the workshop, allocations should be made with regard to time and money to ensure a systematic follow-up and further development of the results. A clear plan should provide a structure and a schedule, and a steering committee could have the task to support the idea teams and prevent them from loosing track and to monitor the process.

ROADIDEA 215455
26/141
3. Results of the innovation process evaluation
3.1. Introduction to the process of generating innovations
The innovation process has been organised in two innovation seminars. The purpose of these seminars has been to create an atmosphere and invite stakeholders to a joint brainstorming, which leads to the development of ideas that could then be taken further. In the context of evaluation one needs to make a clear distinction between the assessment of the ideas that developed as a result of the process, the innovation aspect and service concept of which are being dealt with in chapter 2.2.1 and 2.2.2, and the process and its organisation as such. The results of the innovation seminars are explained together with detailed conduct in deliverables 5.2 and 5.3 respectively. Since the aim of the two innovation seminars was the production of ideas, the process evaluation is somehow one on a meta-level, since it does not assess the ideas, but rather the applied workshop methodology and how well and in which way it has led to the intended production of innovations. This process has to be carefully organised in order to get a maximum output; and there are certainly effective ways to go about and less effective ways. Moreover, the group dynamics play a vital role in this process too and have to be taken into account when preparing the workshop and inviting the people. The evaluation of the innovation process has been done in two ways: by an external expert and through the participants’ self-evaluation. In addition to this, a survey had been conducted right after the seminar. The main results are as follows: From the 18 respondents 6 thought that the method could have been simpler, but 12 thought it was good. Comments indicated that even more introductory guidance and moderating could have been useful. The main tasks were rated on the scale 1 bad to 5 excellent. The brainstorming got grade 3.8, grouping of ideas 3.6, basketing 3.3, walking seminar 3.2 and pub seminar 2.8. The comments indicated mainly problems with timing and guidance. All participants were satisfied that their own ideas were appreciated. 12 of the 18 said that they saw new ideas coming up, but 14 of 18 thought that the ideas were not especially radical. 12 people saw that the overall results were as they had expected. The comments focused on the difficulty of grouping of the various ideas that were on the same issue but from a different angle. In summary, the seminar survey results (50% responded from 36 participants) indicate that the seminar was well received. The majority of participants were of the opinion that no truly radical ideas were created; however, they could name the most radical ideas from their point of view. The overall problem was that the concept “radical” was varyingly understood and no consensus prevailed. Also, what was radical to one person was not so to another. The results are explained in detail in deliverable D5.2: Results of the First Innovation Seminar.

ROADIDEA 215455
27/141
3.2. The expert’s report The expert Mr. Pekka Kumpula had been invited to the second seminar and provided his analysis in form of an evaluation report (Annex 4 Evaluation report from Pekka Kumpula) that will be summarised here. To begin with, Pekka Kumpula explains his professional background that underlies his evaluation of the innovation seminar. He has worked in product development, as industrial designer and researcher in both, business and academic fields. The focus of his research is user-centred design and pre-design research on one hand, and on the other the development of conceptual and hands-on means to identify, create and realise strategic innovations. Pekka is familiar with a variety of different innovation methods and techniques, but, as he points out, neither an expert in weather services nor in ITS. Thus, he was able to focus exclusively on the process of developing innovations. His understanding of this process is that of having all the necessary pieces of the puzzle in the right place at the right time, “innovations don’t just happen”. They are produced through very specific processes. The focus of ROADIDEA’s innovation activities is to come up with radically new ideas, and in his opinion “the Dubrovnik seminar was conducted on a very high professional level”. Therefore, the evaluation of Pekka Kumpula concentrates on those parts of the seminar that he would have looked more into. He compares a few topics on an ideal innovation process to what he experienced in the second innovation seminar in order to provide suggestions for further enhancement of the innovation process used in ROADIDEA. Since innovation practices are information intensive activities, a vast amount of information has to be brought together in a controlled manner when searching for radically new ideas. In his opinion this aspect had been taken into account for the Dubrovnik seminar. However, it not only requires knowledge of the subject matter, but also of the innovation process itself. Although the organisers had prepared the seminar well the participants’ inexperience with innovation activities had a decelerating effect. Future scenarios are a very effective tool for concept design and future studies according to Pekka Kumpula who praises the future scenarios as one of the best he has ever seen. Well-prepared scenarios give the working teams the ability to experience life in the aimed future. With regard to the innovation teams, Pekka Kumpula explains that these should ideally be relatively small (e.g. three) and cross-disciplinary teams of subject matter experts with prior knowledge in innovation activities. He admits that it is almost impossible to find persons who know it all, which is why teams often have to be larger in order to cover the needed expertise. However, according to his experience, bigger teams are usually less effective, efficient and motivated. The reason for this being time consuming decision making or finding of the same “level”. So putting the teams together becomes a compromise between expertise in subject matter and efficiency. In addition to the team size, the group dynamics play an important role in the innovation process. The team members need to be committed to work together for a common goal. This is only likely to be the case if everybody gets along well and if the team members are capable to bring out their knowledge to the use of the team and to produce and process material of and for the group. Any free riders within the team would reduce

ROADIDEA 215455
28/141
motivation of all members. However, large teams need a strong, experienced leader who guides the team in their task without any friction between group members. According to Pekka Kumpula the team sizes in the seminar were generally too large. He acknowledges that there had probably been good reasons but strongly recommends reducing the team sizes in possible future sessions for the sake of efficient teamwork. Moreover, he suggests to carefully selecting the members for each team, not only taking into account their field of knowledge but also looking at personalities. Regarding the presentation of ideas, the innovation expert comments on the visual appearance and the effect this has on the general perception, understanding and acceptance of the ideas, and as a consequence, on the selection. Pekka Kumpula points out that even though their background explains that most participants in the workshop did not have extensive abilities with visual communication such as 3D modelling, computer rendering and animations, the use of some methods would greatly enhance the way ideas can be communicated in these types of situations: 1) Hand-made sketches: participants should be encouraged to use this fast and easy way to communicate their ideas. 2) Quick-and-dirty prototypes: using cardboard, paper, tape and glue are a valid option for those who cannot draw to get their ideas across. 3) Body-storming: this type of activity, including plays, can help to experience ideas. Together with verbal communication these methods will improve the innovations teams’ ability to communicate their ideas not only in presentations, but also within the teams while working.
3.3. The process evaluation questionnaire In addition to the expert’s evaluation a participants’ self-evaluation has been carried out in the form of a questionnaire. This questionnaire has been developed by Jörg Dubbert (Pöyry Infra Traffic) and Marcus Wigan (Demis) (Annex 5 Questionnaire PROCESS EVALUATION). This questionnaire covers impressions of the participants, the process of idea generation and their ranking and further development after the seminar. It was sent to all participants of the second innovation seminar in September 2009. Their replies have been collected and summarised. 13 questionnaires have been returned and taken into account. However, numbers do not always sum up to 13, for in some cases the answers showed a misunderstanding of the question and have therefore not been assessed.
3.3.1. The participants 1. Had the participants enough ITS and road traffic background in order to
propose relevant ideas (R&D projects, EU guidelines, ITS action plan, relevant unresolved problems etc.)?

ROADIDEA 215455
29/141
Most participants said that the level of expertise was varying between them. Some said that the background was sufficient. One person answered that some sectors had not been covered by the experts present. Another one argued that the “specialised background sets of skills and experiences of each attendee” have not been exploited and that the group dynamics have caused some difficulties in coming up with new ideas. To begin with, people were reluctant to express what they thought was a radical idea, because they probably feared to be criticised by others. It took some time during the workshop until confidence between the attendees had grown to a level were everyone freely expressed what he/she thought. In conclusion, people with largely varying levels of expertise were present,
only part of them had a “universal” ITS background with regard to technology development and policy,
there was a mix of junior and experienced participants, people with clear specialisations were present (e.g. in the field of road weather
information), The communication of a more detailed experience grid of the participants prior to the workshop would have had a positive effect on the results, i.e. mutual awareness of professional background would have encouraged engagement in a fruitful discussion, and finally, the professional background of the participants was less important for the results than the general workshop process methodology.
2. Were the participants generally motivated and well prepared with pre-prepared ideas?
The answers to this question showed some heterogeneity: Five participants said that they felt that the attendees were prepared and motivated. Three of them had a mixed opinion. Four have found people generally motivated but not prepared. This leads to the conclusion that the answers are clearly based on subjective single perceptions. As a rule, participants were motivated to take part in the process. The workshops were thoroughly prepared by the organisers, and everybody had been given the opportunity to get prepared beforehand using the material that had been sent to everyone in advance.
3. Is there enough awareness of the state-of-the-art, the state-of-research and unresolved burning problems?
Apparently, this question was difficult to answer; one person explicitly stated this. Five participants thought there was enough awareness, opposed to three people who did not think there was. Two persons replied that the awareness was varying and two others said that each one was aware of the problems in his/her field of expertise, but not as a group. Apparently, the awareness of the state-of-the-art and state-of-research varied considerably from participant to participant; there were some focal fields of expertise where knowledge was concentrated (e.g. road weather applications, traffic databases). Due to this fact, it was likely that innovative ideas mostly came from these focal fields.
4. How big is the risk that the discussion goes in a certain direction due to the bias in the expertise of participants?
Again, opposing impressions have been given here: seven people found the risk high whereas five thought it was low. One person gave a detailed analysis of the group dynamics that “lead to some tracking down a specific path with no fresh inputs…” due to

ROADIDEA 215455
30/141
the fact that “various contributors [provided] specific and convincing support for ideas – and trying to avoid demotivating contributions”. In conclusion, the risk of the discussion going in a certain direction does clearly exist; dominant contributors can significantly influence the direction of the discussion.
3.3.2. The process of idea generation
1. Can the process of idea generation be open or must there be set traffic-related topics in order to get more relevant results?
The majority of participants favour a mixture of both (6), only two wanted an open process and five voted for a process with more technical guidance by set ITS topics. The choices do not seem to have been influenced, as one might think, by the seniority of the participants. An entirely open process can be difficult in that the focus can be lost and no useful innovations will be produced. In conclusion, it would have been desirable to have a number of set ITS topics (preferably cutting-edge research) provided by senior experts for inspiration.
2. Was the process of idea generation competently guided and monitored by suitable experts?
Competence and guidance of the workshop was valued by nine participants, only one thought that the process was driven in a well-defined way, but remarked that the explanation of the process structure to the attendees was difficult. Three contributors felt that the process of idea generation was partly guided and monitored in a competent way and by suitable experts, “perhaps some more transport system and services pre-thinking would have helped/supported the process”. In conclusion, the majority was satisfied with how the workshop has been monitored.
3. Are the participants free of interests concerning the decision on which idea to propose and to deepen?
Here the distribution of answers given is divided into five “yes” and seven “no”. It is indeed likely that the idea generation was – in some cases – influenced by the field of expertise or interest which had been brought in by the participants, though the audience remains unclear about it. However, this is no deficiency since the effect is counterbalanced by the mixture of different fields of expertise.
4. Were there incentives for a competition to provide the best idea? The majority of eleven participants felt that there was no particular incentive for a competition. Only one person recalled the “innovation cap” from the first seminar that had been given to the most popular idea. An incentive scheme for more competition would have been a good idea to include in the workshop.

ROADIDEA 215455
31/141
5. Were the challenges of a changing world (until 2030) taken into account? Of thirteen participants eleven thought that the challenges were taken into account. The participants were well aware of the challenges of a changing world. This allows to conclude, as Pekka Kumpula has already mentioned in his evaluation report, that the scenarios had been well prepared and put the attendees in the position of being able to imagine future needs and developments. However, a connection between social development scenarios and concrete technological ITS ideas could have received more emphasis.
3.3.3. The idea ranking
1. Are the ideas sufficiently described and presented so that evaluating persons can understand the ideas?
Most people (9) found the description and presentation sufficient, at least for the existing status of the idea development. Four members of the group considered it less sufficient. So apparently, the descriptions were good enough for an evaluation and ranking of the ideas.
2. How objective is the process of giving hearts to ideas? a. What are the criteria, the background and the interests of persons
distributing hearts? This is asking two things at the same time, consequently, the answers are somewhat diffuse: four participants found the process of giving hearts was not objective, three said that people have used different criteria, according to their professional background. One person explained criteria from his/her own understanding: improvement of traffic level and services on high level, reduction in energy consumption. And another one favoured that there were no presumptions (e.g. exploitability), “thus giving more room for radical innovations which may not be quite there yet to be exploitable.” One of the participants of the workshop gave a rather detailed analysis: there was no framing check of the participants’ perspectives or backgrounds; therefore, the process of allocating hearts was affected by some self-censorship barriers which have successfully been reduced by the facilitator. In conclusion, the process of giving hearts to ideas had subjective elements like professional background of the participants personal interests of the participants. The selection criteria have not been defined clearly enough and were thus depending on personal preferences of the participants. A round of reasoning for giving hearts would have been a good addition to the process. Moreover, a possibility would have been to define a specific criterion and allow a complete reallocation of hearts.

ROADIDEA 215455
32/141
b. How large is the risk that good ideas are not highlighted? The feeling for this risk is assessed differently by the participants: five considered it as high, six as low and one as medium. Two persons went into more detailed analysis and explained that the risk varies, dependent on the mutual understanding. However, they left open whether they thought this understanding was good or not. To summarise, there was no unanimous attitude in this respect amongst the participants, the risk has been recognised by some partners.
3. Is the basketing done or supervised by knowledgeable traffic and ITS expert?
Nine participants agreed that this was indeed the case, another one found that this was partly so. Two persons admitted that they were not in the position to judge the level of expertise of the basketing staff.
3.3.4. The idea development after the seminar
1. Who is responsible for idea development after the seminar? Was this clearly determined?
In general, the responsibility had been clearly given to the idea teams and idea team leaders. In some cases there seems to have been confusion in which way the idea should be taken further after the seminar. The process of leading the idea development was handed to a small group, and the mechanisms for further focussed discussion were limited.
2. Has this organisation enough resources to push it forward? Answers to this question are varying: three people believe the responsible organisation to have enough resources and five denying this; and surely, the answers reflect the different understanding of who is responsible. Another answer was the following:
“The project has limited resources to take care of all ideas. Thus, in some cases, demonstration of what can be made has been developed. These demonstrations can for example be short programs that are using different kind of data together. On the other hand, more technical advanced ideas such as flying cars or driving on waste can not be put forward by ROADIDEA project.”
In conclusion, the idea development after the seminar was not a strong element of the ROADIDEA project, but mainly so because responsibility and budget allocation for this task was not clear. The generation of innovations is almost always time-consuming and does not necessarily lead to the expected results. The analysis of the process evaluation questionnaires is difficult for a number of reasons; one of them being the fact that the group of experts was very diverse, in terms of fields of expertise as well as level of expertise, and thus the answers have to be seen in different lights. An attendee with little expertise, or maybe just less in relation to the

ROADIDEA 215455
33/141
others, will certainly testify to the high level compilation of experts in the seminar. On the other hand, a person with profound and insight knowledge of the topic and with many years of experience will probably be more critical towards the process or the composition of the group. As a consequence, no matter how well the process of producing innovative ideas has been organised and is being carried out, the mixture of attendees has its own dynamic and can never be fully planned or predicted.

ROADIDEA 215455
34/141
4. Results of the platform evaluation
4.1. Introduction One of the main results of the ROADIDEA project is the ROADIDEA traffic information platform. The role of and functions of the platform have been defined in the ROADIDEA project proposal and the platform has been extensively documented in the various deliverables of the project. Because the implementation of the platform is a part of ROADIDEA, it will be evaluated as a part of the work package WP8 of ROADIDEA.
4.2. Objectives The objective of the evaluation is to evaluate the ROADIDEA traffic information platform in terms of functionality and its technical implementation, information content and data quality, interoperability and access to data and business aspects. The overall objective of evaluation is to support the development of the platform and to provide recommendations for further development and improvements. The evaluation includes the following viewpoints
- Functionality of the platform and its technical implementation - Information content and data quality - Interoperability and access to data - Business model
4.3. Methods The functionality of the platform will be evaluated by comparing the actual implementation to the planned functionality and by benchmarking the platform to similar systems or initiatives. The systems included in the benchmarking have been chosen on the basis of information collected in the ROADIDEA project and the information collected in the short literature review. The information content of the platform is described as a table on the basis of the specifications of ROADIDEA pilots and interviews made with the operators of the platform. Only data types provided by ROADIDEA pilots to the platform have been included which means that data types available before the project via the Destia Traffic traffic information platform have been left out. The procedures used to manage the quality of data are described briefly on the basis of interviews made with the developers and operators of the platform. The interoperability of the platform and procedures needed access to data will be evaluated on the basis of information collected in expert interviews. Both technical and business aspects will be included in the analysis. The focus of the analysis is finding barriers to access and use the data and assessing factors causing transaction costs to the operator of the platform and a potential data consumer. The present business model of the platform has described on the basis of expert interviews. The evaluation has been carried out by analysing the position of the platform owner as a part of the service network and the market of information services.

ROADIDEA 215455
35/141
The information needed to carry out the evaluation has been collected with expert interviews and a brief literature search.
4.4. Evaluation results Description of the ROADIDEA traffic information platform Overview of the needed functionality for the ROADIDEA traffic information platform has been described in Figure 1 (Lindqvist et al. 2009)
Figure 1: ROADIDEA process – from idea to service
The concept of the ROADIDEA platform has been defined in the ROADIDEA proposal. The main objective of the ROADIDEA platform was to support service developers by allowing easier access to refined and raw data (Figure 2). In the beginning of ROADIDEA, the idea was to collect information about different available or potentially available raw data types and to create innovative services on the basis of available data sources. The role of the ROADIDEA platform would be then to integrate the needed data types into a common platform to allow processing them and providing new innovative services
Pilot ideas emergeduring theinnovation processof the project
Each pilot has a pilotowner – a responsible organisation that willdevelop the idea further
Data feeds are gathered to ROADIDEA platform
Data is forwarded to Logica’s server
Final service can be used via mobile phone or internet

ROADIDEA 215455
36/141
Figure 2: The ROADIDEA process – from idea to service (Lindqvist et al 2009)
4.5. Realised functionality and implementation of ROADIDEA traffic information platform
The ROADIDEA traffic information platform has been implemented as a hardware and software extension to the Destia traffic information platform that existed before the ROADIDEA project. The ROADIDEA traffic information platform was implemented as an extension to the existing Destia TIP for two reasons. At first, some raw data types potentially needed by ROADIDEA pilots were already available on the Destia TIP. Secondly, some information dissemination channels potentially to be used to implement services had already been integrated to the Destia TIP either directly such as RDS-TMC or via Logica Mobilog gateway such as Logica smart phone application. The ROADIDEA front-end server puts data received from the ROADIDEA pilots into a common format and processes it further (Figure 3). The Destia TIP receives only data from the Gothenburg pilot because it has a ready-made interface for the data supplied by the server of the Gothenburg pilot. A separate physical server for ROADIDEA was needed because making significant changes to the production environment (Destia Traffic TIP) was considered not possible or at least too risky. The ROADIDEA front-end server and the Destia TIP have a XML interface between them. The existing Destia TIP provides the interfaces to the existing service provision channels such as RDS-TMC, Logica smart phone application and traffic information web site and some raw data sources which had earlier been integrated to Destia TIP.

ROADIDEA 215455
37/141
The partners responsible for the implementation of the ROADIDEA traffic information platform were Destia and Logica. The structure of the ROADIDEA traffic information platform has been presented in Figure 3. The figure is not a complete description because the Destia Traffic TIP has also a Datex I output for real-time traffic information
Figure 3: Structure of the ROADIDEA technical platform
The implementation of the platform has been described in a more detailed way in deliverable D6.1. The information types exchanged with the ROADIDEA pilots have been listed in the table below (Table 2) (Lindqvist et al 2009).
No. Responsible partner Data type Data provider
Data format
Transfer protocol
Frequency of data provision
1 Finland: FMI (Pulp Friction) friction FMI ASCII FTP 1 hour
2 Sweden: Destia (Gothenburg) traffic flow, road weather Vägverket XML HTTP
SOAP 5-10 min
3 Germany: Pöyry (Hamburg port)
Service concept development
4 Italy: ARPAV (Venice fog modelling)
Table 2: Summary of the ROADIDEA pilot sites’ data related issues
At present, XML coded real-time traffic information is available from the ROADIDEA traffic information platform via two HTTP interfaces. The first of them is a HTTP “pull” interface used by Logica’s Mobilog server to fetch traffic information from Destia’s server. There is also a HTTP “push” interface which uses the HTTP POST method to push XML

ROADIDEA 215455
38/141
coded real-time traffic data from Destia’s server to Logica’s Mobilog server. Both interfaces are currently based on the same XML schema. The ROADIDEA frontend in figure3 has been implemented with Microsoft SQL server 2008. Other parts of the ROADIDEA TIP have been implemented with Windows servers running Microsoft SQL server 2003. The web service interfaces between various parts of the ROADIDEA TIP (including the Destia TIP) have been implemented using the Microsoft .NET framework. The objective in ROADIDEA was to realise a platform which would be suitable to sharing and processing traffic and weather related data in an efficient way. This functionality has mostly been realised with the platform described above but some limitations to the possible data processing to be performed by the platform exist. One of the limitations is that the platform is only able to run models that produce one refined data type from one raw data type. The second significant limitation is that the platform has not been designed to run models that are computationally heavy, e.g. weather forecast models using refined data types as inputs. However, the computing power available on the platform can be increased by upgrading hardware and by adding more server machines to the platform. Because the platform has been implemented as a group of server machines exchanging information via web services making changes to the platform is relatively easy. The platform can be scaled to meet the requirements set by growing volumes of data, increasing numbers of users and data sources or increased geographical coverage. The platform can be adapted to handle increased data volumes by adding a separate database server to the platform. Increased number of data sources or users of raw data can be handled by adding more server machines to the platform and implementing web services to connect data sources and users to the platform. When new data types are introduced, they can either be included in the existing XML schema used by the platform or a new XML schema for the new data type can be defined. A new SQL database table or a new database is also needed when a new data types is integrated to the platform. Distributing real-time traffic information provided by the ROADIDEA platform is currently possible in Finland and Sweden, and Destia has contracts with relevant stakeholders for distributing traffic information via RDS-TMC in those countries. Increasing the TMC (traffic message channel) coverage would require the installation of new TMC location point tables to the various elements in the ROADIDEA TIP and Destia TIP and a contract with an actor capable to send RDS-TMC data with FM broadcasts.
4.6. Information content and data quality The data types available via ROADIDEA TIP have been described in detail in ROADIDEA deliverable D6.1. The geographical coverage of existing data types in Destia TIP is best in Finland and Sweden. Until November 2009, only Swedish and Finnish ROADIDEA pilots had provided any data to the ROADIDEA TIP. Information about the data quality of various data sources integrated into ROADIDEA traffic information platform and Destia traffic information platform was requested from Destia Ltd in an interview. Quality of data types being part of the Destia traffic

ROADIDEA 215455
39/141
information platform was considered to be classified business information. Because the quality of data types provided to the platform by ROADIDEA pilot sites had not been evaluated in the evaluations on individual pilots, no conclusions could be made at the time of evaluation of the ROADIDEA traffic information platform. The availability of information about data quality and other metadata related to data types was found to be limited. Destia provides its own customers information about the sources of various raw data types as well as the frequencies with which they are updated. However, obtaining this information requires signing a non-disclosure agreement. Without signing a NDA a potential service developer can obtain only very general information about the available data types.
4.7. Interoperability and access to data The Destia Traffic TIP being part of the ROADIDEA TIP has implemented interfaces to Finnish and Swedish ROADIDEA pilot systems and other data sources currently in production use in Destia Traffic TIP. Currently supported transfer protocols are HTTP, SOAP and FTP. According to the operators of the ROADIDEA TIP, new data types can be integrated into the platform easily when a suitable interface such as (FTP or HTTP and XML) is available from the provider of raw data. Integration of a new data type requires only establishing an interface to the new data source, possibly creating new database and either matching the data type to the existing XML output traffic feed or by creating a new XML schema and a web service for the new data type. In its present form ROADIDEA TIP can be integrated to many systems by creating a web service using the http protocol and documenting the interface as a XML schema. The system used to implement ROADIDEA TIP has adapters to at least http, ftp, smtp, pop3 and soap protocols, and support for SQL and web services implemented with SOAP (simple object access protocol) and WSDL (web service description language). Obtaining access to raw or refined data types provided by the platform is only possible after case-by-case negotiations between the platform operator and the service developer. The platform operator has also to check whether the licensing conditions for the data type in question allow the use specified by the service developer. After the negotiations between the platform operator and the service provider have been completed and the licensing conditions of the data in question have been checked, the interface providing the data in question can be opened to the customer. In most cases, obtaining detailed information about the data types available or their quality requires signing a non-disclosure agreement. At present, pricing and licensing conditions for raw and refined data types are determined on case-by-case basis. In practise, two pricing models are used: a lump sum for a data type or pricing based on the number of users of a service. The price of raw or refined data is generally set on the basis of the business potential of the service the data will be used in as well as the expected number of end-users

ROADIDEA 215455
40/141
4.8. Business model The ROADIDEA TIP is operated by Destia Ltd. A significant part of the ROADIDEA TIP is the Destia’s Destia Traffic TIP that is the current production environment for Destia’s traffic information services. On the other hand, Mobilog gateway server is a mobile communication server solution offered by Logica. The operator of the ROADIDEA TIP (Destia) sees itself as an information service provider that aggregates data from several data sources to produce information services to business users. The present business model with the Destia TIP is to provide traffic information services to media companies and equipment manufacturers. The revenue received by Destia is realised from sales of information services to business customers instead of services offered directly to the consumers. Logica’s role was to provide the Mobilog mobile gateway and a smart phone application and to integrate them with the ROADIDEA platform. At present, Destia is not selling raw data to other service providers because issues related to service level agreements (SLA) and contract architecture have not been discussed. Co-operation between Destia and other stakeholders exists for example within Forum Virium in Helsinki, but no case providing benefits for all stakeholders has been realised yet. Destia has also a contract with the Swedish road administration (Vägverket) that gives the right to refine and use the data commercially. One of the strengths of the Destia’s present business model was seen to be the availability of information from a large geographical area via a single source. In the long run, international expansion of geographic coverage or consolidation with other service providers was seen necessary for a platform like Destia is now operating. It is also possible that other service providers operating with the same business model will appear over time even though creating a platform offering similar functionality, geographical coverage and data types will be challenging to small companies. In future, the large companies working with traffic information and traffic data will probably strengthen their positions in the market. There are also other business models that can facilitate the sharing of traffic data. One of them is the marketplace model in which a private company organises a market place for traffic data and traffic information. In this the model the company operating the marketplace does not collect data or provide any traffic information services itself. An example of this is ITS Exchange web site launched by a Swedish company Info24 AB (Info24 AB 2009, Sabel & Peterson 2009).
4.9. Discussion and analysis The ROADIDEA TIP has been implemented as a modular and extendable system on the basis of the principles of SOA. Though the system has been implemented using software produced a single software company, the system is able to interact with any applications on any software platform supporting SOAP or simple http-based web services. The strong points and weaknesses of service-oriented architecture (SOA) have been outlined in a paper published recently (Wang & Liao 2009). SOA based implementation supports re-use of existing components and allows changes to be made when the components of the system, organisational structures or services to be provided to the end-user change over time. On the other hand, the most common implementations of

ROADIDEA 215455
41/141
SOA like web services implemented with HTTP and SOAP (simple object access protocol) used to transmit XML coded information usually increases the volume of data to be transmitted and the complexity of the system. The ROADIDEA TIP has some limitations in its ability to process information. For example, producing a processed data type on the basis of several raw data types is not possible. The platform is also not suitable for running models causing heavy computation load to the server such as meteorological forecasting models. In present situation, the operator of the ROADIDEA TIP is also an information service provider selling its services on the b2b market. At the same time, ROADIDEA TIP has been supposed to be at tool that can be used to share information and facilitate access to raw refined data types for developers or new innovative services. A question can be raised whether the operator of the platform is in a position with a conflict of interests. However, the operator of the platform does not see the production of its own information services as a barrier to sharing or selling raw data to other service providers. In case of this business model, the platform is a part of the service business of its operator and no public funding to establish and operate the platform is needed. The present operating practises of the platform do not support the utilization of raw data already integrated into the ROADIDEA TIP. Information about the available data types is only available at a very general level and obtaining more accurate information about the available data types or their data quality requires signing a non-disclosure agreement. After signing the NDA and obtaining information about the data type or data types in question the potential data consumer has to go through case-by-case negotiations concerning the data types in question before a contract concerning the use of the data can be signed and needed web service interface opened. The process causes heavy transaction costs both to buyer and seller. One of the possible business models for a platform like ROADIDEA TIP is the marketplace model in which the operator of the platform acts a the owner of the marketplace on which data and information related to traffic can be sold and bought. However, before a market can develop for traffic data and information, the licensing conditions of various data types have to be made clear enough and the roles of the various actors in the deployment of ITS have to be clearly defined. If processing of information takes place on the ROADIDEA TIP and service is delivered to the end-user via Logica’s Mobilog mobile gateway, only the operator of the platform or Logica can change the algorithms that are used to process information or the operation of the platform. This arrangement may not be the best for services that are still being developed or need frequent modifications in their algorithms and operating logic. In most cases, developers of new information services want to control the platform on which the information is processed and choose themselves the tools they use for software development or implementation of their service. A critical factor contributing to the successfulness of an information service is the user experience. The “look and feel” of a service will affect the user’s decision whether he or she will try the service again or not. The ROADIDEA TIP includes Logica’s Mobilog gateway, web sites and mobile applications that can be used as a basis for new information services without a need to start developing the user interface from scratch. On the other hand, Logica and the operator of the platform will decide, what a new

ROADIDEA 215455
42/141
service will actually look like and what kind of operating logic and user interface it will have. Collecting raw data from several sources into a single platform provides some significant advantages. At first, the service developers can obtain information about the available data types and their characteristics more easily. Secondly, changes in the interfaces the raw data sources provide their data do not propagate to changes in the interfaces between the platform and individual services using data types available via the platform. The question whether the socio-economic benefits of implementing a ROADIDEA-like platform exceed costs is outside the scope of this evaluation. One of the risks with the platform is a situation in which the platform operator is not willing to sell data available via the platform to other service providers or in which the platform operator and a potential data consumer do not reach an agreement on the price and terms and conditions for the use of the data. In those situations, the platform provides no benefits except to its operator. In practise, this would lead to a situation in which the most important raw data producers have to build their own systems to distribute their data to various service providers and other data consumers An interesting question is why only the Finnish and Swedish ROADIDEA pilots provided any data to the ROADIDEA TIP. The German pilot in Hamburg included only design of the service concept and service was actually implemented. On the other hand, the Italian pilot (fog warning service in Veneto region) was located in a geographical region in which the ROADIDEA TIP had no data types available which meant that no benefits from using data types already integrated in the platform could be realised. A platform like ROAIDEA TIP can also be used for cross-border sharing of traffic data and information. However, the discussion about the role of public and private stakeholders in provision of cross-border traffic information services is still going on. EASYWAY and the EC have been promoting the development and adoption of Datex I and Datex II standards (Dölger 2009) to support the sharing of information across national borders. There have also been opinions that public efforts should be focused on supporting the establishment of data warehouses and information brokers instead of development and design of standardized and harmonised interfaces close to the data sources or the end-user (Sundberg 2009)
4.10. Conclusions The ROADIDEA TIP has mostly implemented the planned functionality of being a tool to share and process traffic and weather related data. However, the operative and business models that support sharing of traffic data and information between various actors are still under development. Questions related to regulatory issues such as licensing conditions of various raw data types and most suitable business models need further research to be answered. If a platform like ROADIDEA TIP is expected to facilitate the access to raw data, the operator of the platform must have the incentives to collect traffic and weather related raw data, maintain adequate level of metadata for the different data types and to share the collected and documented data with present and potential service developers. The producer of the raw data must also have incentives to cooperate with the platform operator. For example, by cooperating with the platform operator and making its data

ROADIDEA 215455
43/141
available via the platform the raw data producer does not have to negotiate with all organisations requesting data or maintain interfaces to data consumers. At present, the operator of the ROADIDEA TIP gets most of its revenue from its own traffic information services it sells to business customers like media companies. When the project started the operator of the ROADIDEA TIP was not very well aware of the business opportunities related distributing traffic data to other service providers or acting as a data and information broker. At present, the operator of the platform is still trying to find a business model that will support the sharing of information and raw and refined data types to other service developers. The future will show whether it will succeed or not. The ROADIDEA TIP was used differently than expected in the project. This was partly due to the decision to not implement an actual service in the German and Swedish pilots. However, the Italian pilot provided no data to ROADIDEA TIP at all during the project. The most probable reasons for that are the late completion of the fog warning service and the limited benefits to be obtained by integrating the pilot to a platform with no other data types or users on the same geographical region. The ROADIDEA TIP has its own limitations in processing information. This underlines that the platform has to be flexible enough and establishing interfaces to different kinds of interfaces to various systems either providing raw data or consuming raw and refined data types should be possible with ease. Still, geographical region is important in several ways in collecting and processing traffic related data. At first, synergies can be realised if several data types from the same geographical region are available via the same platform. Secondly, obtaining access to raw data requires knowledge of the transport system and the operating environment in the country to be covered. Controlling the quality of the raw data is also easier if the operator of the platform has some knowledge about the transport system the data has been collected in being then able to spot obviously false or otherwise poor quality data. However, these arguments do not imply that the platform must be located in the same country where the data is collected

ROADIDEA 215455
44/141
5. Results of the pilots’ evaluation
5.1. Self-evaluation of the pilots In a first evaluation step the pilot owners have carried out a self-evaluation of the pilot idea. The underlying purpose was to guide the pilot owners into the development of an ITS service concept. In a previous evaluation project (EVASERVE) the Finnish Research Institute VTT has developed an evaluation platform with several tools for evaluation. One of them is the AINO worksheet (for ex ante evaluation), which has been used for the initial self-evaluation of the ROADIDEA pilots. For this purpose, the AINO worksheets from the EVASERVE tool were used. The pilot owners filled in the sheets. In this process they became aware of the aspects, which need to be covered in service development. The filled AINO sheets are attached to this document in Annex 1. The self-evaluation had to be closed at a certain point in time in order to carry on with the pilot evaluation concept. Once the development of the concept had been started a self-evaluation did not add value. The self-evaluation for the fog-warning pilot had been skipped and the pilot owners started with the accomplishment of the detailed evaluation concept from D8.2. The same applies for the rainfall pilot. Both concepts were already elaborated to an extent beyond the self-evaluation stage. The evaluation process continued according to the pilot evaluation concept laid out in D8.2 (Final Validation and Evaluation Plan).
5.2. Pulp Friction pilot
5.2.1. Introduction Traffic accidents can be twice as frequent under winter road conditions compared to normal conditions. We are, therefore, dealing with a significant road safety issue. Active wintertime road maintenance actions like salting and snow ploughing and removal reduce the number of accidents effectively, hence increasing safety. There is a close correlation between observed road surface friction and accident risk. Precipitation, especially in the form of snow is the major cause for deteriorating road surface friction leading to slippery conditions, but also heavy rainfall may decrease friction to some extent. Icy and slippery conditions associated with low friction values emanate when a wet road surface reaches below freezing temperatures. Salting is typically used to remove or reduce ice from the surface, but normal salting is not very efficient under temperatures of below -5 degrees centigrade. Adequate observing means of the prevailing weather together with skilful weather forecasting applications and tools for predicting adverse weather events will facilitate the road maintenance authorities to schedule and optimize their activities. By default, improvements in the quality of weather forecasts imply improved road maintenance actions. It is, therefore, of utmost importance to know and understand the properties and characteristics of the available, operational, road weather observations, as well as apprehend the quality of the applied weather forecasting applications and models. The evaluation of forecast quality, or, forecast verification is *not* a trivial task.

ROADIDEA 215455
45/141
A detailed description of the extensive road weather modelling research and development work performed within ROADIDEA was reported as Deliverable D3.4b (Road Weather Model Development). The derived forecasting models were, consequently, tested and piloted in a real-time weather forecasting environment, under wintry conditions, as the Pulp Friction Pilot during winter 2009-10. Detailed specifications of the Pilot can be found in Deliverable D6.1 (Pilot Specifications). Deliverable D8.2 (Final Validation and Evaluation Plan) specified the means and methods to evaluate the ROADIDEA platform as a whole, including the Pilots. The present Deliverable reports on the final validation and evaluation results of the Pulp Friction Pilot, complementing the earlier Deliverable D8.3a (Validation and Evaluation Results). The current Deliverable, D8.3b, was considered a necessity as the Pulp Friction Pilot covered the full cold season period 2009/2010 in Finland and ran until April 2010, i.e. towards the end of the whole ROADIDEA project. Chapter 5.2.5.3 reports on the results of the end-user survey performed during the pilot phase.
5.2.2. Literature review on road surface friction Friction coefficient is a unique quantity describing the grip between road surface and car tires. Figure 4 gives information about road surface friction during different road conditions. The physic behind road surface friction has been presented in several studies, e.g. Wallman & Åström (2001) and Haavasoja & Pilli-Sihvola (2010). Reduced friction increases traffic incident risk, and wintertime car accidents related to road conditions are studied for example in articles by Andreescu & Frost (1998) and Sihvola et al. (2008). Table 3 presents the correlation between friction and accident rate as studied by Wallman & Åström (2001).

ROADIDEA 215455
46/141
Figure 4: Road surface friction during different road conditions, COST (2008).
Friction interval Accident rate < 0.15 0.80 0.15-0.24 0.55 0.25-0.34 0.25 0.35-0.44 0.20
Table 3: Accident rates (personal injuries per million vehicle kilometers) at different friction intervals (source Wallman et al. 2001)
There are several different methods and devices to measure road surface friction nowadays. Friction measurement devices used in Finland are presented by Finnish Road

ROADIDEA 215455
47/141
Administration, Tiehallinto (2008). Traditionally friction has been measured mechanically based on braking distance and/or deceleration (for example Ctrip and Gripman). Traction Watcher One (TWO) provides continuous friction measurements based on wheel sliding. Vaisala DSC111 sensor is making an estimation of prevailing friction optically. Friction measurement devices in use in Sweden are presented by Wallman & Åström (2001).
5.2.3. General objectives and scope of the validation and evaluation
Road surface friction is far from being a trivial property to measure, because several different properties need to be taken into account. Road conditions (state of the road) have the most important effect on friction, so it is important to know whether the road surface is dry or covered by water, snow or ice. The texture of the road surface and the condition of car tires are not tackled in this study. There are various friction measuring techniques available. Furthermore, it is especially challenging to forecast friction both in time and in space. Friction measurement results based on various international investigations are not necessarily directly comparable. Optical devices are a new means for measuring friction facilitating continuous, real-time observation data. The Pulp Friction pilot utilized friction data from several representative road weather observation stations in Finland having on-site installations of Vaisala’s DSC111 optical devices. The data from the winter periods (November – March) 2007/08 and 2008/09 were used to develop a regression-based statistical prediction model for road surface friction. This regression model was validated and further developed and tuned using an independent data set from the follow-up winter 2009/10. The derived model was then linked to the operational numerical road weather forecasting model of the Finnish Meteorological Institute (FMI) using that model’s meteorological parameters as input data to produce explicit surface friction forecasts in a real-time forecasting environment (for further details, see Deliverable D3.4b). The friction model underwent a scientific, objective, state-of-the-art meteorological validation / verification procedure using applicable verification measures. A subjective end-user evaluation by FMI’s duty meteorologists and Destia’s road monitoring personnel (during winter 2009/10) supported this activity. This comprehensive evaluation and validation process was considered of utmost relevance, because it was realized early on during the project to set as a goal a friction prediction method, or model, to be operationally used as guidance for adverse road weather warning and road maintenance activities. Forecasting slipperiness by means of a surface friction model is a totally new concept in operational meteorology. A new method always requires detailed analysis and investigation before introduced into operations. This is one reason why the user survey, in the form of a questionnaire, was only addressed to professional end-users (FMI meteorologists, Destia maintenance personnel). The end-user viewpoint is an essential and indispensable ingredient in all product and service evaluation.
5.2.4. Organizing and scheduling the validation and evaluation
An initial, “beta”, version of the road surface friction prediction scheme was available and under pre-operational testing at FMI already during the summer of 2009. Data originating from the system were delivered on-line to ROADIDEA partner Destia for further processing and transmission, following the project plan, that Destia would communicate and dispatch available information further in the production chain of the eventual pilot. However, rational and realistic real-time slipperiness (i.e. surface friction)

ROADIDEA 215455
48/141
forecasting and testing was doable only under icy and snowy wintertime weather conditions. This was accomplished, consequently, during winter 2009/10. The outcome, becoming available in spring 2010, is reported in the present ROADIDEA Deliverable. The operational duty meteorologists at the weather warning service of FMI and, likewise, Destia’s road monitoring authorities had the friction (i.e. slipperiness) information as produced by the forecasting scheme at their disposal throughout the winter period 2009/10. These data served as totally new guidance information to assist them in their real-time operational work. FMI boasts an online verification tool as a dedicated in-house intranet application. Model developers and shift meteorologists have access to this tool with which they can check, visually in real-time, the quality of the most recent friction forecasts. An example is shown as Figure 5 showing a case where the model (green lines) predicted the decrease of friction relatively well, especially at the Kristiina station (lower part of figure). However, it is also noticeable how the predicted friction typically remains at low values even after the observed friction (red curves) has increased. This is a very common feature of the model and is most probably due to the road maintenance operations, which our model does cannot take into account, because these data are not operationally available.
Figure 5: Time-series of modelled vs. observed friction at two road weather stations.
5.2.5. Methodology of the validation and evaluation A scientific evaluation, validation and verification procedure should always be adopted when one is confronted with a new meteorological forecast method, model or product or when taking into use new observation sources in a validation process. The verification process should follow a general meteorological forecast verification framework as defined e.g. in Jolliffe & Stephenson (2003), Nurmi (2003) and Wilks (2006). The characteristics of all potentially new forecast methods (here: surface friction) and/or observation means (here: optical measurements) must be thoroughly investigated to understand their principles and behaviour. Only after this exercise can one decide upon the selection of appropriate forecast verification measures and statistics.

ROADIDEA 215455
49/141
It is essential to understand the needs and requirements of weather forecast verification, who is the receiver of the eventual forecasts (i.e. who is the user) as well as who specifically requires the feedback on forecast quality. In the case of Pulp Friction, the users are definitely professional end-users in their own field, who would pose their own requirements both for the forecast products and also for the kind of verification metrics they can grasp and appreciate. Hence the verification methodology need be defined to serve both the purpose of verification per se and the comprehension of the target audience. Slippery conditions are definitely to be considered as adverse weather events in all of Europe. However, in Finland they are also very common wintertime events. Therefore, the verification methods selected for the Pulp Friction pilot, relevant for Finland, would not necessarily be applicable in other climates, where low road surface friction would be more like an extreme or rare weather event. This is a very important issue to consider regarding forecast verification – i.e. the nature and frequency of occurrence of the event under consideration. The choice of proper and most appropriate verification metrics is a golden key issue to a successful forecast or product quality assessment. More profound background considerations on the fundamental principles of weather forecast verification were provided in the Validation and Evaluation Plan, Deliverable D8.2.
5.2.5.1. Scenario with indicators FMI has operated a dedicated road weather forecast model in operations since spring 2000. The model produces as output forecasts of e.g. the road surface temperature and various indices depicting the road condition. These products are used both by operational shift meteorologists and road maintenance authorities in their everyday work during the cold season (October to April). Road surface friction is a totally new forecast parameter developed by FMI during the ROADIDEA project as an explicit outcome of the innovation cycle. It was, consequently, tested during the Pulp Friction pilot. The friction forecasts are using as input “feeder” forecast data from the operational road weather forecast model as explained in the earlier documentation of ROADIDEA (D4.3b). Surface friction is a highly important and also a relatively straightforward guidance quantity in road condition assessment. The Finnish Transport Agency (FTA) is using direct on-site friction measurements as one guideline to supervise the maintenance activities of their contractors. To reinforce this activity they have extended their RWIS (Road Weather Information System) network to cover a number of optical DSC111 friction measurement devices along the major highways. In support of this real-time activity, the new, innovative, friction forecasts are aimed at providing advance information of potentially adverse (i.e. slippery) road conditions. This will facilitate the FTA to initiate their maintenance activities in a timelier manner than until now. Given that FMI’s new friction forecast model proves to be skillful enough, it will provide added value in predicting and monitoring wintertime road conditions. The next chapter will shed light on the quality of the new forecast product.
5.2.5.2. Success indicators based on defined targets As outlined earlier in this chapter, the output from the newly developed friction forecast model was linked with FMI’s operational road weather forecasting system and then piloted as the Pulp Friction activity during the four winter months, December 2009 - March 2010. The friction model was validated exclusively against friction measurements

ROADIDEA 215455
50/141
using an independent dataset (of the one that was used in model development), following explicitly the success indicator definitions as set out in the ROADIDEA Validation and Evaluation Plan (Deliverable D8.2). The following four (1-4) target success indicator criteria were defined as success indicators to be used in this testing of the potential skill of the statistical friction model (cf. D8.2): 1) The correlation between observed vs. modeled friction should be above 0.8, on
average, under icy/snowy road conditions 2) The correlation between observed vs. modeled friction should be above 0.9, on
average, under wet road conditions 3) The so-called Symmetric Extreme Dependency Score (SEDS) (for details, see
Hogan et al., 2009) should be above the value 0.75, on average, under bad road weather conditions, i.e. when surface friction falls below 0.30 (friction, by definition, as measured by the DSC111 instrument, varies between 0.10-0.82)
4) The so-called Symmetric Extreme Dependency Score (SEDS) should be above the value 0.70, on average, under very bad road weather conditions, i.e. when surface friction falls below 0.15 (friction, by definition, varies between 0.10-0.82)
Locations of the road weather stations used in the Pulp Friction pilot are shown in Figure 6.
Figure 6: Locations of the 10 road weather stations with optical Vaisala DSC111 sensors used in the validation of the statistical friction equations. The four red markers indicate the locations of stations used in the formulation of the original equations.
Target criteria Utti Anjala Orivesi Kuopio average
(1) F1 r > 0.8 0.85 0.87 0.82 0.53 0.77
(2) FW r > 0.9 0.98 0.98 0.97 0.96 0.97 Table 4: (Pearson) Correlation coefficients (r) for modelled friction, validated against an independent dataset from winter 2009/10 at four road weather stations: Utti, Anjala,

ROADIDEA 215455
51/141
Orivesi and Kuopio. The two rows show the validation results for F1: Icy/snowy road conditions (1) and FW: Wet road conditions (2).
A reproduced subset of Table 1 of D3.4b (Road weather model development), Table 4 shows how the target indicator criteria were met using a dataset independent of the data which was used in the definition of the regression model. There is a very strong statistical relationship apparent for both model versions (F1 and FW) and all stations except for the icy/snowy conditions at station Kuopio. During winter 2009/10, the average thickness of ice on the road at Kuopio station was only 10% when compared to winters 2007/08 and 2008/09. On the other hand, the average thickness of snow was almost double. This raises a high doubt about the reliability and quality of Kuopio station observations during winter 2009/10, especially because Kuopio appeared as a clear “outlier” compared with the three other stations. Winter 2009/10 was extremely cold particularly in eastern and northern Finland, including Kuopio, and hence there may have been numerous occasions with loose or drifting snow rather than ice formation on the road surface. Another explanation for the observed low ice amounts may be malfunctions or wrong positioning of the optical DSC111 instrument. It may have been pointed in a slightly different angle than during the preceding winters and thus making measurements from a somewhat different road surface location (e.g. not from the wheel track). Other than that, the correlation targets for icy/snowy ( r > 0.8 ) and wet conditions ( r > 0.9 ), respectively, are clearly surpassed by our regression model. These validation results are examined in more detail under Deliverable D3.4b, but one can conclude here that the success indicators (1) and (2) are satisfied (except at one single suspect road weather station under icy/snowy conditions)
Target criteria Utti Anjala Orivesi Kuopio average
(3) f < 0.15 SEDS > 0.70 0.79 0.81 0.72 0.75 0.77
(4) f < 0.30 SEDS > 0.75 0.62 0.81 0.72 0.88 0.76 Table 5: Symmetric Extreme Dependency Scores (SEDS) for modelled friction, validated against an independent dataset from winter 2009/10 at four road weather stations: Utti, Anjala, Orivesi and Kuopio. The two rows show the validation results under very bad (3) and bad (4) road weather conditions, respectively.
Based on Table 5, the statistical friction model would seem to be able to distinguish the very bad or bad road weather conditions (based on friction thresholds of 0.15 and 0.30, respectively) relatively well. At least if the SEDS measure is considered as a representative and sound measure to do the validation. SEDS is a very new verification measure and only introduced in the verification literature last year (Hogan et al., 2009). However, it appears to possess very attractive properties, being equitable, difficult to “hedge” and independent of the frequency of occurrence of a non-Gaussian quantity being verified, like here. Therefore we wanted to try out this promising new verification metrics. The target SEDS scores of 0.70 (very bad road weather conditions, aka friction < 0.15) and 0.75 (bad road weather conditions, aka friction < 0.30) are reached, on average. At two of the stations they are definitely exceeded, and only at station Utti the sterner target is not reached (0.62 against 0.75). The fluctuations in SEDS at two of the stations, Utti and Kuopio, may be due to the differences in winter conditions, i.e. during the

ROADIDEA 215455
52/141
winter when the statistical equations were formulated compared to the winter during which they were validated. As emphasized many times, road surface friction is a totally new forecast quantity and service product. The defined validation and verification measures and their specified target values are hence, in the first place, meant to be indicative and for providing insight and guidance for further development and re-tuning of the statistical friction equations and their regression parameters. To complement and finish off our friction model validation/verification activities, the produced short-range road surface friction forecasts were exclusively verified against respective friction measurements at ten (10) pre-selected, climatologically representative road weather stations (RWIS), as proposed in the Pulp Friction Evaluation Plan (D8.2). Results of these verification statistics are presented as Table 6 and Table 7.
Station name ME_618 ME_628 MAE_618 MAE_628 RMSE_618 RMSE_628
Vaskisalmi -0.24 -0.20 0.26 0.21 0.36 0.31
Anjala -0.22 -0.14 0.26 0.20 0.38 0.30Utti -0.27 -0.18 0.29 0.22 0.39 0.31
Orivesi -0.25 -0.16 0.29 0.21 0.40 0.31Kuopio -0.23 -0.15 0.26 0.20 0.38 0.31
Jakomäki -0.29 -0.21 0.31 0.23 0.41 0.32Lempäälä -0.26 -0.15 0.29 0.20 0.39 0.30
Lahti -0.25 -0.17 0.27 0.20 0.39 0.31Kontinkangas -0.14 -0.10 0.20 0.18 0.30 0.27Santa Claus -0.27 -0.22 0.29 0.26 0.42 0.38
average -0.24 -0.17 0.27 0.21 0.38 0.31 Table 6: Verification statistics of the friction forecasts, as a continuous quantity, using two versions of the statistical friction model, “618” and “628”, during winter 2009/10 at ten road weather stations. The lowermost row provides the average over the ten stations. Abbreviations: ME = Mean Error (bias), MAE = Mean Absolute Error, RMSE = Root Mean Square Error.
Table 6 provides some basic summary verification statistics of the surface friction forecasts by assessing them as continuous variables. Two regression model versions were developed during the course of the ROADIDEA research. They are quoted with their internal version numbers as “618” and “628”. The earlier one, “618”, can be taken as a “beta” version which was further tuned, becoming version “628”. It is satisfactory to note that all verification results have improved at all road weather stations for the later model version! Looking at the ten-station average (lowermost row in Table 6) one can see that the bias (or systematic error) has improved from -0.24 to –0.17, the mean absolute error from 0.27 to 0.21, and the root mean square error from 0.38 to 0.31 (NB: Lower scores are better because we are dealing with the magnitude of errors). What is quite unfortunate is the profound systematic error (bias) in the forecasting system resulting in too low friction values. This may be, at least partly, due to the inherent bias in the driving numerical road weather model and this feature needs thorough further research. This is also a feature that needs to be solved before the whole friction forecasting chain (i.e. numerical weather forecast model driving the statistical model) can be adopted in real operational public use.

ROADIDEA 215455
53/141
Station name KSS_618 KSS_628 ETS_618 ETS_628 HSS_618 HSS_628
Vaskisalmi 0.61 0.68 0.09 0.12 0.17 0.22
Anjala 0.48 0.44 0.17 0.20 0.29 0.34Utti 0.44 0.43 0.10 0.13 0.18 0.23
Orivesi 0.34 0.44 0.09 0.17 0.16 0.28Kuopio 0.44 0.44 0.12 0.17 0.22 0.29
Jakomäki 0.53 0.67 0.08 0.14 0.15 0.25Lempäälä 0.42 0.42 0.11 0.16 0.20 0.28
Lahti 0.47 0.59 0.10 0.18 0.18 0.30Kontinkangas 0.49 0.50 0.22 0.25 0.36 0.40Santa Claus 0.36 0.37 0.07 0.09 0.13 0.16
average 0.46 0.50 0.12 0.16 0.20 0.28 Table 7: Verification statistics of the friction forecasts, as a categorical quantity, using two versions of the statistical friction model, “618” and “628”, during winter 2009/10 at ten road weather stations. The category applied in verification was friction below 0.30, representing bad road weather conditions. The lowermost row provides the average over the ten stations. Abbreviations: KSS = Hanssen-Kuipers Skill Score, ETS = Equitable Threat Score, HSS = Heidke Skill Score (for definitions, see Nurmi, 2003)
Table 7 gives various basic summary verification statistics of the surface friction forecasts by assessing them as categorical quantities, i.e. we have adopted categorical verification statistics here. The message is, as expected, quite similar to Table 6 for friction as a continuous quantity, i.e. we see relatively big improvements in the model version “628” when compared with the initial “618” version. (NB: Here higher values are better as we are using scores depicting the skill of the forecasts) Looking at the numbers per se, one cannot make too definite conclusions on forecast quality, because there are no common rules or definitions on what would make “a good forecast” based on the traditional skill scores being used here. However, what is a strong result is, again, that we have managed to improve our friction model during the development phase of ROADIDEA and our piloting activities. Model development is a continuing process.
5.2.5.3. End-user tests An end user survey was carried out during March-April 2010. The survey was addressed exclusively to professional end users, i.e. FMI's duty forecasters and Destia's road maintenance personnel. The questionnaire covered mostly issues related to friction observations and forecasts. Different friction threshold values relevant for various traffic condition categories were also covered by the survey. The questionnaires were sent out to 18 individuals, and 8 replies were received. The sample is relatively small and hence the results are mostly indicative. The main feedback of the results is presented here. Friction forecasts are not the only road weather forecasts that the operational meteorologists and road maintenance personnel are using. Plenty of other information is available, like e.g. real-time road weather station observations, roadside camera photos, weather radar and satellite images and other weather observations measured over Finland. Also, different weather and road condition forecasts are available, including output of several numerical weather prediction and road weather models. Seven of the answers were received from duty meteorologists and only one from the road maintenance side. Two of the meteorologists had not used friction observations or friction forecasts at all during the pilot, so they had not filled the questionnaire, but the

ROADIDEA 215455
54/141
other of them warmly welcomed all new improvements and model applications. One of the replies from the meteorologists concentrated only on the google.maps implementation and provided suggestions for improvements. Most of the meteorologists had used friction observations when producing road weather warning forecasts, but friction forecasts per se had not been used that much. One meteorologist highlighted that friction is not the only factor leading to bad or very bad driving condition, but also light drifting snow and poor visibility can lead to worsening driving condition. There were complaints of friction forecasts producing too low friction values and this was considered the primary reason for not using the friction forecasting facility. This was an expected result as it is a realized problem of the present fiction model. Development work for an improved model version is going on. The single reply from the road maintenance side pointed out clearly that good friction forecasts would help in the scheduling of road maintenance actions and operations and in the monitoring of forecasted weather. The respondent indicated that friction observations were very useful and that these data had been used in various different ways; scheduling road maintenance actions, producing road weather warnings and checking the slipperiness conditions along the road network. He did not give any feedback on the friction forecasts due to lack of use of the service. Observed and forecasted friction appears to be more important for the road maintenance personnel than for meteorologists. However, this view is based on one single response, only. The meteorologists have their own customary ways to make road weather warning forecasts resulting from several years of experience. Adopting new guidance products into operations is not a trivial procedure and would necessitate specific training about the products.
5.2.5.4. Business model assessment The application has to be considered in relation to two versions:
1. Internet-user-interface solution
A scientific internet-based solution with FMI as the exclusive user – the application is targeted at professional users of FMI. It is an FMI-internal tool. The user interface is not part of the business model assessment of the Pulp Friction pilot.
2. Mobile solution – end user case
The mobile solution for a wider community of external users – a precondition of this service is that the measured friction data is produced by FMI for the Internet user interface solution under 1. The mobile solution will build on an available internet-based application. Assessment: Implementation costs This type of costs is considered marginal if the basic FMI application exists and the data were to be obtained free of charge.

ROADIDEA 215455
55/141
The pricing of raw data The pricing of raw data still needs to be determined by FMI based on public authority pricing principles. Mobile gateway and versioning costs A rough calculation has been provided in D7.2. It seems to be realistic, but the data pricing for friction data must be confirmed later on. This requires estimation of costs relating to technical delivery, surveillance and quality control on 365/7/24 operational basis. Willingness to pay The willingness to pay for the information is estimated to be very low amongst potential end users. Sustainability of the mobile service business model DESTIA estimates that the business model can only be sustainable if the information is provided by additional channels (e.g. TMC). Roles of stakeholders in the business concept The roles of stakeholders were described in the D7.2. At the moment no commitments and contracts could be achieved because data pricing has not been done and regional data coverage cannot yet be guaranteed. At the moment, there is not yet a discussion on full-scale implementation because of this.
5.2.6. Discussion Salt have a very effective influence on road surface when existing ice layer is removed by salt or other chemicals. Salting is carried out during weather situations when there is ice on the surface and temperature is between 0 and -6 degrees. In colder temperatures salting is not that effective, and the salting operation is not carried out especially in Finland. Pre-salting can be done before freezing when wet or damp road surface is expected to cool down below zero degrees. Figure 7 presents a case study of road surface friction and temperature. Circumstances, road surface temperature and road condition, can vary dramatically within short distances and slipperiness can be quickly improved or get worsen. This example was measured during ROADIDEA project when optical DSC111 sensor was installed into the roof of the car and mobile measurements were carried out. The lines are presenting observations of mobile measurements along 12 kilometers long road stretch in Kouvola region and observations of road surface friction (upper curves) and road surface temperature (lower curves) are shown. The same road stretch was driven and measured three times within 90 minutes and before the first measurement case (red line) the road was not salted yet and the road condition was icy and very slippery as can be seen in the figure. On the second drive (green line) after 40 minutes later the friction was improved because of salting. The third measurement case (blue line) after 15 minutes later presents that friction was still improved. Temperature was quite stable during all measurement cases. This example accentuates the grave effects of salting on the road surface and the reason why road weather modelling is so challenging if and when information on road maintenance operations is not available.

ROADIDEA 215455
56/141
Figure 7: An example of mobile measurements carried out during ROADIDEA project.
5.2.7. Major steps forward Friction data pricing by FMI: The data must be given a price according to public authority principles as a basis for use of the data for the mobile service and other potential users. Improvement of regional coverage: The regional coverage of the service needs to be improved by building and integrating new measurement points on the Finnish road network.
5.2.8. Summary The evaluation, validation and verification results presented in the previous chapter clearly prove that the statistical surface friction model is a very promising new road weather forecast application. The regression equations developed could even be improved during the course of the Pulp Friction proof-of-concept testing. The refined version of the friction model, which was applied during the Pulp Friction Pilot produced better overall scores than the earlier one. All target success indicators as set in the Evaluation and Validation Plan were fulfilled based on the applied statistical verification measures. Adoption of new products into operational use will always take some time. This was a clear outcome of the end user survey. Dedicated training of the specifications and properties of new products is hence prerequisite. A critical issue affecting the friction model development was found to be the influence of salting and other road maintenance operations along the highways and roads, and how to take these effects into account. Such information is presently not available in real-time. The influence of lacking information about salting operations could be estimated in case studies and ways to include salting information in the model will be further studied. It is strongly proposed to find ways, together with the road maintenance authorities, of making online real-time information of road maintenance operations generally available in real-time.

ROADIDEA 215455
57/141
5.3. Gothenburg pilot
5.3.1. Overview and purpose of the pilot The capacity of the roads in many cities has not grown as rapidly as the traffic flow has increased, and this requires big efforts to meet the traffic needs now and in the near future. Gothenburg’s traffic situation is quite specific since the city is separated by a river and there are only three connections over the river close the city, the last one built forty years ago. Since then, more roads have been built in Gothenburg but no more connections over the river. This causes a lot of traffic problems and might be typical for other cities with growing transport needs as well. The aim of ROADIDEA in this context is to look into the relation between the road traffic situation and the weather situation. It cannot be argued that weather has an influence on the traffic situation. For example, speeds are different when snow falls or when black ice is on the streets. Even rainfall has an influence on the flow of traffic. ROADIDEA WP3 has deeply considered this interrelationship. The main purposes of the pilot are to:
Create a traffic flow/travel time prediction model from the end user point of view
Study the data in a research perspective
Investigate what kinds of algorithms are possible to use for this specific pilot
Investigate the key factors that might be of value and have an impact on the Gothenburg pilot.
The key research question of the Gothenburg pilot is whether and how the representation of the real-time traffic situation for traffic information services can be improved by historical data, which describe the correlation between the traffic on the road network depending road weather information. A part of the pilot idea is the models developed in WP3. ROADIDEA WP3 gave an in-depth description of scientific models, which describe the relation between the weather situation and the traffic situation. It was the goal to use the scientific MATHLAB model for the Gothenburg area to generate traffic estimation and prediction for the road network and to determine whether and how the model can be used for the generation of more developed traffic volume/ congestion estimations depending on the weather situation. There was the intention to develop a concept for end user services in the area of traffic information, which provide information on the real-time traffic flow and on the predictive traffic flow as pre-trip information. The following figure illustrates the initial technical idea: The model considered in WP3 (green box in the picture) provides a correlation of historic weather data and historic traffic data for the city. Weather prognosis data can be used in order to predict the development of traffic flows. These predicted traffic flow will be used by the traffic management system to provide improved traffic prognoses to the end user.

ROADIDEA 215455
58/141
The road traffic management system itself (yellow box in the picture) has its own real-time traffic data detection, a database of historical traffic data and an incident database. Based on this, the road traffic management system is able to generate a traffic situation overview in real-time and a prognosis for 1-2 hours in advance. At present, a prognosis can be made by the traffic management system on the basis of the traffic patterns and travel times. Travel time and traffic flow is used to give drivers information for travel planning. The key questions here are, a) whether it is possible to improve the prediction of the traffic situation for the end user based on the input of traffic flow prognoses coming from traffic/weather correlation model, and b) does it offer added value to real time traffic flow data (speed, density, travel time between links). The traffic flow prognoses would need to be entered into the historical database of the traffic management to improve near-real time traffic predictions (red arrow). On the other hand, measure traffic data could flow into the traffic/weather correlation model in order to improve the historical database (red arrow).
Figure 8: The initial technical idea
The end product of the service is targeted to a traveller who his informed on the internet and on his mobile device on the traffic situation with a short-term prognosis as pre-trip information. The prognosis includes information on the current weather situation.
Historical RoadWeather Data
Historical RoadTraffic Data
Online RoadTraffic Data
Historical RoadTraffic Data
TrafficIncidentData Online Traffic
Prognosis
1-2 hours in advance
Near realtime Pre-trip travel planning servive
Measured traffic data
Correlation
Weather prognosis
Road Traffic Management System
Traffic/ Weather Correlation (Offline, Mathlab)
Time x

ROADIDEA 215455
59/141
The user scenario was described by DESTIA as follows (D6.1): Vision: Before the journey the end user checks the traffic flow prediction via a mobile phone browser from the internet and sees that the peak is estimated to be in 15 min., but over after 30 min. Because of the predictive information the end user postpones his departure by 15 min. and will arrive at the destination almost at the same time as with a 15-min earlier departure.
Vision: User gets the flow prediction to his TMC enabled or connected PND and is able to use dynamic routing based on traffic flow prediction.
Figure 9: The vision of the real-time traffic information service
5.3.2. Baseline scenario The City of Gothenburg already has a well developed traffic management centre operated by the SNA (Swedish National Road Administration) where the road traffic situation based on traffic measurements (FCD) can be displayed. The added value of the pilot service would be the introduction of a functionality that predicts the road traffic situation depending on road weather forecasts. Up to now, only the scientific off-line MATHLAB model from Klimator is available to depict the correlation between road weather and the road traffic situation. A respective service to the road users does not yet exist.

ROADIDEA 215455
60/141
A viable concept for a service is expected to be an added value to the current situation. Currently, this model is a general regression, i.e. a basic statistical tool. A service exits that provides:
- real-time traffic flow information, but no prediction
- changes in traffic flow if accidents/road works occur A viable concept for a service is expected to give added value to the existing service. The question is, if weather prognoses can be used for RTTI generation. Does it offer added value and enough standalone value?
5.3.3. User needs The main user needs in relation to the pilot are:
The system shall provide a pre-trip traffic information service to travellers.
The system shall provide the information on the internet and on mobile devices.
The system shall provide information on capacity restrictions and incidents in the road network.
The system shall cover the urban road network of Gothenburg.
The system shall use measured real-time data from different sources (detectors, FCD), incidents and historical traffic data.
The system shall use historical weather data as added value in comparison to baseline systems.
The quality of the service must be high in terms of availability (up-time) and reliability).
5.3.4. Technical assessment of the concept The real-time data flow was integrated and tested in the Platform in the DESTIA environment. The concept for the Gothenburg pilot has been discussed and evaluated internally by the team of experts from DESTIA and LOGICA. User tests with external users have not yet taken place due to the results of the initial technical assessment. Both are potential service providers for real-time traffic information services and have critically analysed the feasibility of the service concept. The following assessment has been done based on:
MATHLAB regression model from ROADIDEA WP3
the Platform implementation explored in WP6.

ROADIDEA 215455
61/141
Technical assessment by DESTIA and LOGICA: DESTIA and LOGICA did an in-depth feasibility analysis of the application’s added value. The basis for the discussion was the service concept as described above, i.e. mainly with the following requirements:
creation of a real-time traffic information service which provides pre-trip traffic information to the end user
use of the MATHLAB regression model for the provision of traffic volumes which are calculated in relation to the weather situation
creation of viable service concept by DESTIA and LOGICA DESTIA and LOGICA have come to the following conclusions:
The correlation between phenomena in road traffic and weather certainly exists. The MATHLAB model shows this correlation and the modelling is plausible.
The MATHLAB model can predict traffic volumes and travel times for a certain day depending on the weather prognosis.
However, DESTIA and LOGICA argue that the online traffic data presently available, measured by roadside sensors (e.g. loop detectors, traffic cameras and floating-car data), implicitly contain information on road weather as data is being collected continuously and this is influenced by the current weather situation.
The team concludes that a prediction model based on historical time series of travel times and volumes from traffic sensors is more reliable. Therefore, the use of weather data as stand alone model in real-time traffic information services does not provide an added value.
Furthermore, weather prediction models do not take into account incidents, accident, roadworks and other events in the road network.
Final conclusion: For real-time traffic information services that provide the user with information on the current traffic situation and possibly a prognosis for 1 or 2 hours ahead, it represents no added value to feed in extra weather information because weather phenomena influence already measured traffic data. DESTIA and LOGICA as potential service providers therefore do not see a sustainable business case for the model itself to be used in an RTTI application. Based on this assessment, the development of the theoretical pilot has been stopped in the course of ROADIDEA.

ROADIDEA 215455
62/141
5.3.5. Targets and success indicators for the real-time solution
Evaluation viewpoint Assessment User needs If the goal is a real-time traffic information service, which
includes additional weather data, it must be said that no added value can be expected.
Data quality If the goal is a real-time traffic information service, the existing MATHLAB data bring no added value although data quality as such is very good and could even be improved by feeding back measured traffic data.
Technical implementation The development of the real-time service concept has not been continued because of a lack of added value.
Technical functioning The concept was only partly developed. With the prospect of no added value, the service concept was not developed to the stage that the chances for technical functioning could be assessed.
Organisational aspects The relevant stakeholders have been identified, although a stronger co-operation with SNA would possibly have been advantageous. As the added value could not be demonstrated, the interest of the users and potential service providers was limited. The organisational concept was not set up finally.
Business model The business model described in D7.2 is generally applicable for a service of this type. However, due to the fact that the added value cannot be generated, it will not be possible to implement it for a real-time traffic information service.
Costs According to the estimation in D7.2 Planning and Specs: EUR 10.000,- Maintenance: EUR 5.000,- Operation Cost: EUR 12.000/ year These seem to be realistic figures.
Socio-economic impact Cost-benefit ratio would be negative as there are no benefits.
Degree of innovation Due to the fact that there is no added value, there is also little innovation. The idea as such was worth investigating. However, the service is not interesting for real-time service providers.

ROADIDEA 215455
63/141
5.3.6. Proposal for an alternative use case The Gothenburg pilot was discussed as real-time traffic information service for traffic information service providers like DESTIA and LOGICA, which are specialised in the provision of this type of online service. In the final stages of ROADIDEA, an alternative service concept came out of the innovation discussions. Due to the fact that it had come up late, it could not be elaborated further, but it might be worth pursuing it in other project contexts. Especially, the business environment with local stakeholders was not strong enough, thus the concept has not yet become mature. Concept: If we assume that the service is not real-time but semi-static and mid-term, an added value could possibly be produced. Assuming the user requirements are the following:
The service shall provide travellers with a traffic prognosis for the city using historical traffic data, planned events and predicted road weather conditions.
The generated traffic prognosis shall follow the weather prognosis and provide a prediction of the situation in the road network (incl. road conditions, i.e. rainfall, snow etc.) for half a day up to one week in advance. The prognosis shall be updated hourly.
The prognosis shall use measured traffic data, but only to fill the historical database with traffic data and to improve the basis for the prognosis.
The measured traffic data shall be recorded with a time stamp and georeference. The application will also establish a relation between the traffic dataset and a description of the weather conditions at the moment of the measurement. This means a referencing of the measurements with weather indicators and locations.
Conditions:
This is a semi-static service, which is only based on historic traffic data, semi-static (i.e. planned) traffic events and weather prognoses. Events, which pop up spontaneously at short notice are not taken into account.
The service can only be given in advance (e.g. half a day) following the weather prognoses for the city. There is a remaining risk that the weather changes at short notice. The reliability (true/false and precision) of the predictions needs to be analysed.
The service is only valuable as a prognosis. Under real-time conditions, the measured traffic data will be more realistic then the mid-term prognosis.
The added value would be a prediction of road conditions for the end user prior to the real-time situation. This might especially be valuable in cases when extreme weather conditions like heavy snowfall or rainfall as well as black ice threaten to influence the

ROADIDEA 215455
64/141
traffic situation. If this risk is known in advance, travel plans could be re-arranged and even traffic managers could take preparatory measures. The service could be built using the following architecture:
Figure 10: Alternative technical idea
The service would then use the MATHLAB model. It would obtain online traffic data to continuously improve the database. The end users would obtain a service, which provides a weather-based traffic prognosis (semi-static and pre-trip). The success indicators are the following: Evaluation viewpoint Assessment User needs The road users obtain a weather-based traffic prognosis
on capacity restrictions for half a day up to one week in advance. The likelihood of a correct prognosis is 90%. Dynamic events are excluded from the prognosis.
Data quality The existing MATHLAB is a good basis for service development. The traffic management system will provide measured data for continuous improvement of the database.
Technical implementation For the technical implementation, the described idea needs further detailing.
Technical functioning Could not be assessed, but there are good chances that such an application is technically feasible.
Historical RoadWeather Data
Historical RoadTraffic Data
Online RoadTraffic Data
Historical RoadTraffic Data
TrafficIncidentData Online Traffic
Prognosis
1-2 hours in advance
Near realtime Pre-trip travel planning servive
Measured traffic data
Correlation
Weather prognosis
Road Traffic Management System
Traffic/ Weather Correlation (Offline, Mathlab)
Time xSemi-staticMid-term Traffic Prognosis
Following the weather prognosis1-4 days in advancehour-wise
Semi-staticPrep-tripPlanning Service

ROADIDEA 215455
65/141
Organisational aspects A new organisational concepts needs to be set up after
ROADIDEA. A co-operation with the Gothenburg traffic centre is needed; they will be facilitator and user at the same time. A service provider is needed who provides the prognoses to the end users.
Business model The business model described in D7.2 is generally still applicable for a service of this type. The added value exists because the weather-related traffic warnings will be possible in advance in better accuracy. It will support traffic management and improve traffic information services.
Costs According to the estimation in D7.2 Planning and Specs: EUR 10.000,- Maintenance: EUR 5.000,- Operation Cost: EUR 12.000/ year These seem to be realistic figures.
Socio-economic impact The cost-benefit ratio is likely to be positive. It is expected that the quality of traffic information services on the internet and on mobile phones will improve.
Degree of innovation The service idea is innovative as there is not known to be a traffic prediction, which includes weather data yet.
5.3.7. Conclusions The Gothenburg pilot was seen as a real-time application by the pilot development team throughout the runtime of the project, and serious discussions have taken place whether there is an added value or not. The added value of the idea has been argued and doubted until the end of ROADIDEA. Only in the very final stages of the project, the idea of the semi-static prognosis has come up. It might be worthwhile continuing the innovation process outside ROADIDEA in a further iteration, possibly also involving further stakeholders.
5.3.8. Major Steps Forward All the considerations about major steps ahead must be built on the assumption that Destia do not see an added valued for their real-time traffic information service portfolio. Therefore, these considerations must be based on the described alternative use case. This would also mean that the service must run on a separate service platform of a different operator. The primary user could be the Gothenburg Traffic Management Centre for traffic management purposes. Secondary use could be a web-based prediction tool for the general public.

ROADIDEA 215455
66/141
Research Needs: The following new research steps would need to be done:
• specification, development and test of a software which produces weather-dependent link travel time predictions as well as congestion and road weather warnings for the Gothenburg road network using the Mathlab model.
• specification, development and test of a software, which provides a graphical, map representation for the predicted weather-dependent traffic situation.
• specification of a web-based distribution channel for the service and determination of the service provider.
• specification of a business case. Involving the Potential Users: Discussion/ Proof-of-Concept:
• negotiations between the Swedish Transport Administration (Western Region) and Klimator, Gothenburg Traffic Management Centre as the potential main user of the application.

ROADIDEA 215455
67/141
5.4. Fog warning pilot
5.4.1. Overview and purpose of the pilot Fog is a relatively frequent phenomenon in the Po Valley and constitutes a major issue for all modes of transport, but especially for road traffic. Fog monitoring is particularly difficult because the phenomenon exhibits large horizontal variability and is measured at only very few sites as such sensors are not part of the standard equipment of the principal meteorological surface monitoring network. Satellite observations can partially contribute to observing fog and low visibility but they need to be appropriately combined with surface observations. The aim of this draft pilot is to:
Install specific sensors for visibility measurement and/or estimation;
Identify and collect data related to fog and low visibility conditions;
Combine the identified data in an optimal way and accounting for their relative quality;
Generate visibility products suitable for various categories of end users;
Test the dissemination of visibility products through various channels to various categories of users;
Obtain selected feedback from users on reliability and usefulness of the visibility products.
A large part of the pilot efforts in ROADIDEA have been concentrated on the installation of visibility sensors and the optimal combination of the various visibility-related data, as well as the product generation. The distribution of visibility service products will be investigated and tested in an experimental way since the pilot’s final operational configuration is still open. The main objective of this so-called fog pilot is to provide a set of information on the present visibility to the general public, media, road management, travellers, transport agencies, infrastructure managers and companies and other authorities. The information is expected to contribute to travel, trip and operational planning of the aforementioned users. For the purpose of a draft pilot the system is structured in three distinct parts (Figure 11), i.e.:
1. Production layer 2. Dissemination layer 3. End user layer

ROADIDEA 215455
68/141
Figure 11: Principle of the fog warning system. (ROADIDEA D6.1 2009)
The Agenzia Regionale per la Prevenzione e Protezione Ambientale del Veneto (ARPAV) evaluates the prospective fog warning products and their impacts. The objective is to produce maps of fog probability to be distributed via the internet as the first choice distribution channel. A further step to be investigated could be to provide numerical information on areas or on grid points too. The safety of road users can be improved by warning them of reduced visibility caused by fog. The warnings can be distributed to the drivers via mass media such as radio and TV, traffic information services such as web sites or RDS-TMC or roadside variable message signs (VMS). Visibility information can also be used as a basis for traffic control measures. If a road section has variable speed limits the speed limit value can be lowered when visibility drops below a specific threshold value.
5.4.2. Evaluation The evaluation of the fog-warning pilot has been done from the following viewpoints:
User needs
Data quality
Functionality and technical implementation
Organizational aspects and business model
Costs and socio-economic impacts
Degree of innovation.

ROADIDEA 215455
69/141
5.4.2.1. User needs Methods Information about the needs of potential users and various stakeholders has been collected by doing a literature review and a user seminar organised in July 2009. At the end of the user seminar, the participants have answered a questionnaire. Results 1st User meeting In order to present and promote the pilot, several potential end users have been contacted by telephone and invited to the 1st user meeting. A brief description of ARPAV’s fog pilot and a questionnaire aimed to identify specific interests and needs was sent before the meeting to the end users who expressed interest in the initiative, in order to prepare them for the meeting. The 1st user meeting was held on the 2 July 2009 in the Meteorological Centre of Teolo (PD). As reported hereafter in detail, fifteen participants representative of different institutions such as regional civil protection, highways and other roads management and maintenance concessionaires were present at the meeting (Table 8). INSTITUTION DELEGATES USER GROUP U.P. Protezione Civile – Regione Veneto
2 Regional civil protection authority
ANAS S.p.A. 1 National motorway company and general manager of the road network (road authority)
Autostrade per l’Italia 1 Road concession company Autovie Venete 1 Road concession company Veneto Strade S.p.A. 1 Road concession company Autostrada BS-PD 1 Road concession company Provincia di Venezia 2 Regional administration Provincia di Treviso 1 Regional administration Provincia di Vicenza (Vi-abilità SpA VI)
2 Regional administration
Provincia di Rovigo 2 Regional administration Rete Ferroviaria Italiana 1 Railway infrastructure manager TOTAL 15
Table 8: List of participants of the 1st user meeting
During the meeting a brief description of the ROADIDEA project and of the ARPAV activities in the framework of the project was provided to the participants. Then the introduction proceeded to the problems and the potential advantages related to the fog monitoring and the fog detection method proposed by ARPAV, the technical products and operational distribution aspects of the fog pilot and options for applications. The next step was a discussion with the participants on the topics previously listed. Questionnaire and discussion at the 1st user meeting At the end of the meetings the participants answered the questionnaire, which is reported at the end of this section. Their answers were collected and analyzed.

ROADIDEA 215455
70/141
The main points which emerged from the discussion and the questionnaire can be summarised as follows:
The main impacts of low visibility conditions on the participants’ activities are the disablement and difficulties in maintenance and other activities, risk of accidents, slower traffic flow, possible traffic congestion with the consequent road user discomfort. A very dangerous situation occurs when there are both low visibility conditions and low temperature (ice formation). For the majority of the road management concessionaires the impact of fog is relevant during all of the day, whereas for the public transport and maintenance concessionaries the impact of fog is more relevant during the rush hour. Most of the users point out to suffer economic losses due to the discomforts derived from the low visibility conditions.
In low visibility conditions, half of the institutions use some procedures like road signage improvements in critical points and in work zones. In particular, with visibility less than 50 meters, one of the institutions (Autostrade BS-PD) activates an emergency plan that provides for the disposal of vehicles and field staff in the critical areas. The other half declares the lack of whatever activities variation procedure in that such activities are set in advance and cannot be modified even if information of reduced visibility conditions are available: in this case the knowledge of fog’s spatial distribution is not particularly useful.
All the road network management concessionaires consider useful the knowledge of the spatial distribution of reduced visibility conditions on the regional road network mainly to inform the end users. In particular, for the public transport concessionary of Rovigo Province it is useful to give warning to the schools about the possibly delays of the students morning travel. For some institutions it should be useful to organize the maintenance activities. For the Province of Venice and the National Rail Network it is not so useful to know it.
A system of SMS alert and internet are considered the most useful distribution way for a fog warning service.
Concerning the willingness-to-pay for making the fog alert system operative, about half of the participants declared that they need the consent of the relative institution top managers and/or of the administrative committees. One institution (Autostrade per l’Italia) favours to pay on the basis of reliability guarantee and spatial distribution of the service. Two institutions (Province of Venice and Province of Rovigo) are not in favour of paying. The first one because of the scarce resources available and the second one because of the private nature of the company that provides the public transportation of Rovigo Province.
Some participants highlight the need of well-timed information in order to give warning to the users. Someone else underlined that besides real time monitoring of fog, a forecast of fog occurrence would be very useful, in order to properly schedule the maintenance activities on the roads. Two institutions (Viabilità- Vicenza Province and National Rail Network) are very interested in information about ice formation.

ROADIDEA 215455
71/141
Interviews In addition to the user meeting, some stakeholders not present in the user meeting were contacted directly. The results of those discussions have been summarised below. The different user groups have different requirements for the geographical coverage of the visibility information service. For example, freight transport companies or radio broadcast networks may operate on a geographical area larger than one region. Therefore, they would be more interested to use visibility information, if it was available for a larger geographical area, for example the whole of Northern Italy. One of the large goods transport companies was contacted, but it showed no interest in the service at this stage. Summary of the user needs A summary of the user needs is presented in Table 9. User groups Main user needs
Road users (on-trip) Visibility information should support the choice of speed, choice of headways and focusing alertness
Road users (pre-trip) Visibility information should support route choice, choice of transport mode, estimation of travel time to destination and suitable timing for departure
Police Visibility information should support operational planning
Rescue operations Visibility information should support operational planning
Motorway operators Motorway operator should be able to warn road users in case of poor visibility and possibly also lower the speed limit if variable speed limits are used on the road link
Freight transport companies
Visibility information should support estimation of travel times from origin to destination and aid in fleet management
Passenger transport companies
Visibility information should support estimation of travel times from origin to destination and aid in fleet management
Table 9: Summary of the user needs
Discussion and conclusions The 1st user meeting was held in July 2009 before the first version of the visibility information service implemented in the fog pilot was available. This means that the participants of the user meeting had not had an opportunity to test the service. Among other things such as the quality of information and its relevance to the user, the number of users of an information service is also affected by the user experience the service provides. Among the different stakeholders, some of them were more interested in utilizing visibility information in their operations. In the future, development of fog forecasts into a product should be considered because some stakeholder groups expressed their interest for that information. The timeliness of visibility information was also considered important, if the information is used to provide warning services, for example to road users.

ROADIDEA 215455
72/141
Future work on user needs To collect feedback to the realised prototype service and more information about the needs of different stakeholders, a second user meeting will be held (most likely after the end of RODAIDEA), when the potential users and other stakeholders have had an opportunity to experience the product.
5.4.2.2. Data quality Objectives The objective of the evaluation was to assess an overview-quality of visibility data produced by the fog pilot. Information on the achieved data quality will support other viewpoints of the evaluation and further development of the visibility information. First, knowing the achieved data quality helps to provide recommendations for further development and improvements to the pilot. Secondly, information about the quality of service output will most probably be useful when discussing the possible uses of visibility information provided by the system and its value to potential users. Methods A data quality evaluation framework was developed for the evaluation of the quality of visibility information produced by the fog pilot. The framework was built on the basis of the first results of the QUANTIS project (Quality assessment and assurance methodology for traffic information services) (QUANTIS 2010) and a related ISO technical report published in 2008. Until recently, there has not been any common definition for data and service quality within ITS (Intelligent Transport System) framework. In 2008, an ISO technical report defined data quality in ITS systems on the basis of nine data quality objects: service completeness, service availability, service grade, veracity, precision, timeliness, location measurement, measurement source and ownership (ISO/TR 21707) (ISO 2008). The definition used by the QUANTIS project is mostly similar, but different in some points. Both ISO/TR 21707 and QUANTIS define the data quality on the basis of quality elements, which have one or more quality attributes. However, QUANTIS has a smaller set of quality elements for data quality (completeness, veracity, precision, timeliness and availability. The concept of service quality was defined in the European QUANTIS project on the basis of earlier work on evaluating data quality and service quality in the context of ITS systems (Öörni et al 2009). In addition to quality elements present in the definition of data quality, service quality has two other quality elements – consistency and relevance. The evaluation framework for data quality is presented in Table 10. The table describes the quality elements and parameters chosen for evaluation, their definitions in the pilot context and the evaluation methods.

ROADIDEA 215455
73/141
ROADIDEA Fog Warning Pilot – Evaluation Framework for Data QualityElement (ISO/PDTR 21707) Parameter Definition in the pilot context Evaluation method
CompletenessGeographical coverage
The percentage of the Veneto region covered by the service.
Interviews of the system administrators and demonstration of the service.
Availability Up time
The percentage uptime which has been reached a defined availability period
Interviews of the system administrators. The uptime of the system is divided by the length of the observation period
Veracity Mean error
Comparison of the estimated probability of fog against realised probability of Fog. Probability of Fog detection is also provided as a function of false detection.
Cross-verification of the service output (probability of fog) against visibility data produced by visibilimeters. Fog situation is defined as a situation in which visibility is below 500 m.
Precision
Number of significant figures
Number of the significant figures of fog probability Demonstration of the service output
Consistency - Not applicable -
Timeliness Data latency
The time between a detected change in visibility and update in the service output (fog probability).
Define the update intervals of various data types of the system. Perform ”worst case” analysis of possible delays
Table 10: Evaluation framework for data quality
Because the output of the fog pilot was an inherently probabilistic variable, the quality attributes for veracity in the QUANTIS framework or ISO technical report were not directly applicable. Instead of quality parameters initially designed for physical measurements, standard methods used in verifying probabilistic forecasts were used even though the data in this case was an analysis of present phenomena. The evaluation period in the evaluation of data quality started on 6 June 2009 and ended 18 November 2009 lasting about 150 days. For this period, the realised probability of fog was plotted as a function of the probability range of fog provided by the service. Results Completeness: geographic coverage According to the developers of the pilot, the visibility information service implemented in the pilot covers the whole Veneto region except for the mountainous area in the north with less serious problems with fog (Figure 12). The Veneto region consists of seven provinces: Belluno (3,678 km2), Padua (2141 km2), Rovigo (1789 km2), Treviso (2477 km2), Venice (2463 km2), Verona (3121 km2) and Vicenza (2722 km2). A rough estimate for the geographical coverage can be calculated if the Belluno province and a third of the Vicenza province are assumed to be outside service coverage. With this assumption, the geographical coverage in the Veneto region can be estimated to be about 75%.

ROADIDEA 215455
74/141
Figure 12: Locations of visibilimeters in the Veneto region
Availability: up time Service up time was defined as a share of observation period when the visibility information service was functional and its output was available. Observations of service availability were made during the second half of 2009, and the observation period lasted two months. According to ARPAV’s own records, the service availability during the trial period was about 90-92%. In practice, this corresponds to four or five days of downtime during two months. The downtime during the trial period was mainly caused by the lack of external cloud observation data, which affected the operation of the meteorological interpolation model (CALMET) used in the pilot. Veracity The output of the visibility information service developed in the fog pilot is an estimate for the probability of reduced visibility in Veneto region. Because the service output to be evaluated was of probabilistic rather than deterministic nature, the methods used for evaluating data produced with physical measurements had to be adapted to the case. In fact, not one of the quality attributes used to measure veracity mentioned in the ISO technical report or QUANTIS deliverable D1 was directly applicable. The veracity of the visibility data produced by the system was assessed by comparing the actual frequency of fog against the probability of fog estimated by the system. The output of the visibility information service was compared against visibility values measured with a visibilimeter not providing visibility data to the system. The visibility values provided by visibilimeters were assumed to be reliable and correct when making the evaluation.

ROADIDEA 215455
75/141
The visibility values measured by visibilimeters have been compared against the first observations of visibility made by human users. The human observations in the field, recorded until now, confirm in general the reports obtained from visibilimeters. The reports are at the moment mainly qualitative, but a network of observers is becoming available on the territory, ready to be asked in case of interesting events. The data collection started in September 2009 and lasted during autumn 2009 and winter 2010. The frequency of fog occurrence as a function of the probability of fog estimated by the visibility information service has been presented in the figure below (Figure 13). The frequency of fog occurrence is presented for ten probability ranges provided by the service.
Figure 13: Reliability curve for the output of the visibility information service
A scatter plot of the probability of reduced visibility estimated by the service as a function of the measured values of visibility is shown in a figure below (Figure 14).

ROADIDEA 215455
76/141
Figure 14: Estimated probabilities of fog as a function of actual visibility conditions measured by visibilimeters
The scatter plot provides several important pieces of information. First, most measured visibility values (v) are located in an area where the measured visibility has been more than 750 meters and the estimated probability of fog (p) has been less than 20%. This is in line with expectations. When looking at cases where the probability of fog has been equal or more than 80%, one can see that these probabilities have been estimated mostly in cases where visibility has been more than 75 m but less than about 200 m and in cases where the measured visibility has been more than 7500 m. When looking at the scatter plot, one can see that the number of points within area v =< 500 and p >= 80% is larger than the number of points within area v > 500 m and p >= 0,8. If the service was operating perfectly, the number of points in the are where p >= 80% and v <= 500m should be at least four times as large as the number of points within region p>=80% and v > 500 m. The probability of fog detection as a function of the probability of false fog detection has been presented in Figure 15.

ROADIDEA 215455
77/141
Figure 15: Probability of fog detection as a function of false detection
With the data collected during the evaluation, the probabilities of detection above about 60% cannot be achieved unless the probability of false detection is allowed to rise above 10%. With probability of false detection (POFD) of about 15%, the probability of detection (POD) reaches 70%. If the POD between the two last points in the right is approximated with a straight line between the points, one can see that the POD improves quite slowly after the point where POFD is about 30%. Precision The output of the visibility information service produced in the fog pilot is available on a web site that presents the real-time products of the fog pilot (http://85.42.129.76/ROADIDEA/; ARPAV 2010). The visibility information service implemented in the pilot provides the user a map of the probability of reduced visibility at present. The probability of reduced visibility is presented as colours referring to ten different probability ranges between 0% and 100%. Timeliness The timeliness of the service was assessed on the basis of data latency. In this case, data latency was defined as a time between measured change in visibility or other meteorological conditions affecting visibility and a corresponding change in the service output. Because of the complexity of the service to be evaluated, no separate analysis of timeliness was performed for all raw data types of the visibility information service and all possible situations in which the service may operate. Instead of analysing all data types and all possible situations, a worst-case scenario for the timeliness of visibility information provided by the service was constructed and analysed. At present, most raw data types used to implement the visibility information service are updated once in an hour. No specific synchronization between the various data sources can be assumed because the different data types are provided by systems operated by different parties. Some raw data types are measured by the meteorological observation stations operated by ARPAV while other data types are provided by external service providers such as EUMETSAT. For example, data types measured by the network of ARPAV meteorological observation stations are updated once in an hour.

ROADIDEA 215455
78/141
According to the service operators, the data processing and visualisation takes about half an hour after an update from some data source has been received. Therefore, the time between measured change in environmental conditions and a change in the service output can be estimated to be about 1 hour and 30 minutes at most. Discussion and analysis The data quality provided by the visibility information service has been analysed in terms of service availability, completeness, veracity, precision and timeliness. The service is in the proof-of-concept stage which has to be taken into account when interpreting the evaluation results and making the conclusions. The threshold values for the quality parameters values set in the evaluation plan (D8.2) have been described in the table below (Table 11).
Quality element Quality parameter Threshold value
completeness geographical coverage equal or more than 75%
availability up time equal or more than 85%
timeliness data latency equal or less than 1 h 30 min
Table 11: Threshold values for the most important quality parameters
ARPAV has also plans to continue the development and evaluation of the visibility information service tested in the pilot. The next step in the evaluation of the service output will be a more systematic use of human observers to obtain a reference against which to compare the service output. The first observers have already been contacted and they have provided their first visibility reports, which have mostly been qualitative. The most of the contacted observers can give reports about the visibility along the path between home and work. 4-5 important stretches in the Veneto plain are well monitored by human observers; therefore the visibility over a total of around 20-30 pixels (4x4 km) can be directly verified by this way. In the future, especially during the winter seasons, human reports will be archived to produce a direct verification campaign together with the continuous crossed verification action. Completeness In its present state, the visibility information service implemented in the pilot covers about 75% of the whole Veneto region. The remaining 25%, which is not covered by the service is located in the northern mountainous part of the Veneto region with less population and problems with fog than other areas in Veneto. A geographical coverage of 75% can be considered to be fairly good for a service in the proof-of-concept stage. It also meets the threshold value set in the evaluation plan.

ROADIDEA 215455
79/141
Extending the geographic coverage of the service to the northern parts of the Veneto region is possible but it would require installation of four of five additional visibilimeters. No other changes to the system would be needed. Completeness in terms of detected or undetected fog events was not analysed because it is partially covered by the evaluation of the veracity of service output. Availability The service reached the up time of about 90% during the two months long observation period, and most of the unplanned downtime was caused by unavailability of external data sources such as cloud observation data. The achieved 90% of up time during the observation period is obviously a better than the threshold value of 85% set as a target in the evaluation plan. Improving the up time of external data sources may be problematic because their availability is affected by the operations of external service providers and the reliability of data communication links. Veracity The output of the visibility information service implemented in the pilot was probabilistic rather than deterministic. Therefore, evaluation techniques originally designed for probabilistic weather forecasts had to be applied in the case. In the longer term, developing guidelines for evaluating probabilistic service output in the context of ITS services has to be considered. The veracity of the service output was not perfect but still much better than results obtained by the single components of the model (see the same analysis for fog probability information produced solely on the basis of variables measured by observation stations or satellite, Appendix 1). In practise, no single cause behind limitations in the veracity of the visibility information can be pointed out. First, fog is a quite complex as phenomena. While the general theory behind the formation and disappearing of fog is known relatively well in meteorology, there are still variables whose effect on visibility is not very well known or for which there is only limited quantitative data available. For example, microclimate has a large effect on the formation and movements of fog. In case of Veneto region, another significant challenge is the varying height from the sea level, which makes the whole visibility problem more three-dimensional in its nature. Secondly, it is very probable that there is still room for improvement in modelling visibility as a meteorological variable. Precision The probability of reduced visibility (<500 m) is presented to the end-user with ten probability intervals. This level of precision can be considered appropriate in the development and proof-of-concept stage when the veracity of the information provided by the service is limited. Presenting the estimated probability with just two significant numbers gives the user correct impression about the accuracy of the presented information. Alternatively, verbal probability classification could be considered (e.g. high, medium, low). The precision with which the information is presented to the end-user can be changed by modifying the data visualisation algorithm. In other words, the precision of the

ROADIDEA 215455
80/141
information presented to the end-user can be changed without major modifications to the system. The precision with which the information is presented should be looked again when more information is available about the needs of the various groups of end-users. Timeliness The timeliness of the service is limited by the data update intervals of external and ARPAV’s own data sources (mostly 60 min) as well as the 30 minutes of delay related to data processing and visualisation. It is possible to shorten the delay and data update intervals but it would probably require investments in data communication links and other supporting hardware and software. The threshold value of 1 min 30 minutes has been set in the evaluation plan for the data latency. The service realised in the pilot fulfils this requirement. At present, the parameters measured by ARPAV meteorological ground stations are updated to the central system once in an hour. The reason behind the 60 minutes data update interval is the limited capacity of the radio network used for communication between meteorological ground stations and the central system. The network of meteorological ground stations operated by ARPAV has originally been designed on the basis of the needs of agro-meteorology, which has less stringent requirements for the timeliness of service. Among other things, the capacity of the radio network used by ARPAV is limited by the availability of suitable frequencies, topology of the network and the communication technologies the network is based on. Detailed analysis on such improvement needs and possible data communication solutions is out of the scope of this report. Conclusions The data quality of the visibility information service was evaluated in terms of availability, completeness, precision, timeliness and veracity. All quality elements included in the analysis were found to be on a level acceptable to a service in the proof-of-concept stage. Before the service can be launched and marketed as a commercial product to most user groups, improvements to the quality of the visibility information provided by the service are needed. However, there is no problem with providing a beta version of the service to relevant stakeholders for testing and evaluation purposes with the present level of data quality. Possibilities for improvement were also found for all analysed quality parameters. This means that improving the quality of information provided by the service is possible. Some of the measures improving service quality require investments in data collection and communication links while others are related to the development of the visibility estimation models and the user interface of the service.

ROADIDEA 215455
81/141
5.4.2.3. Technical functioning Planned functionality of the fog pilot According to the description of the pilot, the objectives for the pilot were to:
Install specific sensors suitable for visibility measurement and/or estimation;
Identify and collect data related to fog and low visibility conditions;
Combine the identified data in an optimal way accounting for their relative quality;
Generate visibility products suitable for various categories of end users;
Test the dissemination of visibility products through various channels to various categories of end users;
Obtain selected feedback from end users on reliability and usefulness of the visibility products.
Of the objectives mentioned above, all but the last one are related to the functionality the pilot is expected to realise. Realised functionality and service output of the fog pilot The main goal of the fog pilot is to provide a set of information on the present visibility to the general public, information’s benchmarks (media), road management, travel and transport agencies. At the present ARPAV is designing the possible warning product and estimating the potential impacts of the service. Production of maps describing the fog probability and distributing them mainly via internet has been considered to be the best choice. A further step to be investigated could be to provide also numerical information on areas or on grid points The detail of the maps is a grid of squares of 4x4 km of extension. This geographical definition shows big fog patches (extension of tenth of kilometres), but don’t allow to report the presence of small patches. Since the purpose is a large scale fog mapping, such information should give a positive impact on route choice or time planning, for both private and business travels. The maps are produced once in an hour with a delay of around 20 minutes, and are suddenly available via Internet to the general public. As the first step, ARPAV has started the production of Fog probability map, i.e. a probability of visibility reduction under the 500 meters at the ground level (Figure 16). A publication of second type of map, Dense Fog probability map, is planned to start during the winter. At present, ARPAV is evaluating the best threshold of visibility for a “Dense Fog Presence” alert. The best choice will be a threshold that shows a good chance of detection and a good impact in the planning of human activities; possible choices to be evaluated could be 100, 150 or 200 meters.

ROADIDEA 215455
82/141
Figure 16: Map of probability of visibility reduction under 500 meters over Veneto Plain. The map is sensible, and a selected set of meteorological data appears pointing the mouse on the points (stations)
Conclusions The fog pilot has successfully produced visibility information in form of a probability map for fog on the basis of planned inputs such as point-based visibility measurements, observations from meteorological ground stations and satellite images and demonstrated the service as a web site. The essential parts of the functionality described in the pilot definition has been implemented even if the Fog warning service is available only via web site instead of multiple dissemination channels.
5.4.2.4. Technical implementation Technical architecture of the fog pilot The entire fog pilot system is composed by three principal sub systems:
data acquisition system
data elaboration and merging

ROADIDEA 215455
83/141
products generation and dissemination. The data acquisition system consists of the following three data sources:
SAFNWC output, i.e. satellite information on cloud presence;
Ground data of visibility;
Ground meteorological data, with statistical treatment of meteorological parameters at the ground;
and as an option to be explored:
Visibility data coming from human observers (at the present used for product verification only).
The specifics of each source are described in the document D3.4. The fog pilot ‘core’ is run on a server housed at the Meteorological Centre of Teolo, and it is substantially a merging and mapping system implemented with PHP scripting. The steps of ‘Core’ application are:
Data acquisition and control;
Translation of available dataset in terms of probability and weight of information;
Merging of different information types;
Production of maps and other issues for the public and for technical verification of reliability.
The following figures (Figure 17 and Figure 18) describe the functioning of the various parts of the system providing a description of the different software and data sources used.

ROADIDEA 215455
84/141
Figure 17: Data processing in the fog warning pilot – part 1
Figure 18: Data processing in the fog warning pilot – part 2

ROADIDEA 215455
85/141
Note: the dotted lines refer to products or activities which have not already been started or which exist only at the concept level except the Internet user interface, which has been implemented. An overview on the software tools used to implement the fog-warning pilot is provided in figure below (Figure 19 and Figure 20).
Figure 19: Overview of software tools used to implement the fog-warning pilot

ROADIDEA 215455
86/141
Figure 20: Overview of the software used to realise the fog-warning pilot
Observations and problems encountered: The production chain is following the schema that ARPAV planned at the Project presentation. When evaluating the practical realisation of the fog pilot, a couple of points must be highlighted:
The installed visibility ground network, consisting of 10 visibilimeters, shows low coverage on the eastern plain, in the area including the town of Padua, to the Venetian lagoon. This problem will be addressed within the near future, and the best solution seems to be the installation of one or two additional visibilimeters.
The results of the statistical analysis of fog events recorded in the winter 2008-2009 evidence the difficulty of ground meteorological data to give a good correlation with visibility reduction. As direct consequence of that, our optimized CART-derived probability field discriminates well between medium-low or very low fog probabilities, but does not recognise well cases of high fog probability.
Requirements for interoperability with other systems The fog pilot is composed of 2 different sections, the fog pilot core and the data acquisition system.

ROADIDEA 215455
87/141
The first is easily transferable to other similar data processing environments, and it is developed with a free scripting language: PHP. This ensures a large portability and the possibility to access the source code to maintain and develop the software. Commonly available tools and access to the source code are important features because the tuning of the system’s parameters does not seem to be the only way to adapt the system to different climatic environments. In some cases, a reconfiguration of the merging procedure of single elements may be also necessary. It is also possible to implement a same kind of software in a programming language more suitable for heavy numerical calculations such as C or Fortran, in order to upgrade the performance. The data acquisition system is totally customized and integrated in the ARPAV databases and information system. In that sense, the fog pilot software must be adapted to the data processing environments in other institutes or agencies. A data provision system must also be prepared, in accordance with the databases and formats available. It must be highlighted that the policy about the distribution of some data (ECMWF model, Satellite Data) restricts the availability of some data types to official meteorological institutes, but some of these products are available with fee also for private users. At present, the service output is available only in graphical format. In future, other interfaces will be needed to integrate visibility information to systems operated by other service providers. This requires building a suitable web services based interface to the system running the fog pilot as well as producing adequate metadata and other documentation about the interface and visibility information available. Dissemination methods ARPAV is preparing or evaluating the following direct distribution methods:
Maps on internet website (implemented in December 2009);
Maps on WAP website (planned);
SMS automatic and on demand (concept);
Automatic e-mail warning system (concept). Possible further forms of distribution are also (indirect distribution):
Radio and TV broadcasting of information;
Roadside variable message signs. Conclusions on technical aspects and data quality The pilot has produced relevant information about the strengths and limitations of the various data sources and data types, which can be used to produce visibility information, and the pilot has successfully demonstrated the provision of area-based visibility information on the basis of a combination of different data sources. However, detailed analysis of the quality of the various data types used as inputs of the services has not been performed, and it has been considered to be out of the scope of the pilot and this evaluation. Even though the development of algorithms used to combine information from various sources will most probably continue after the pilot.

ROADIDEA 215455
88/141
The visibility information service implemented in the fog pilot is now available on a specific web site provided by ARPAV (http://85.42.129.76/ROADIDEA/) and linked on the ROADIDEA web site. The visibility information is presented as a probability map of fog. The mobile information services planned earlier are not available yet, but the operator of the fog pilot is working with prospective users of the visibility information to gather information about the needs of various user groups. Even if the visibility information is currently available only as a web site, the fog pilot has implemented a service, which has potential to benefit several user groups. The interoperability requirements have been analysed for both incoming raw data and visibility information to be provided to users and other service providers as well as for integrating the fog pilot to data processing platforms commonly operated by meteorological institutes and other meteorological service providers. Therefore, the main requirements for interoperability with other systems have been identified in the pilot. The technical implementation of the service allows increasing the geographical coverage of the service at least to most regions in Northern Italy. While no major changes to the processing of information would be needed, increasing the geographical coverage would require installation of additional visibilimeters and cooperation with other meteorological services. For all regions covered by the service, meteorological ground observations and visibilimeter data would be needed.
5.4.2.5. Organizational aspects and business model Organisation of ARPAV and the pilot service The principle of the preliminary service model is shown in Figure 21. The dotted lines indicate subjects or activities not already started or theoretical (quoted for completeness)

ROADIDEA 215455
89/141
Figure 21: Principle of the Fog Warning service model (preliminary)
The service is provided by ARPAV (Agenzia Regionale per la Prevenzione e Protezione Ambientale del Veneto), which is an independent public organisation on regional level. The organisation of ARPAV consists of Directorate General (DG) and regional departments, provincial departments and joint regional departments. The development and operation of the fog-warning pilot takes place in Teolo Meteorological Centre that is part of joint regional department for territory. In present situation, the operations of ARPAV and the investments it makes are funded mostly by public sector. In other words, the revenue from services provided on commercial basis is only a small fraction of the total funding of ARPAV. Because ARPAV has a status of a public organisation, it does not have to pay for the licences needed to use some meteorological models and data types provided by ECMWF (European Centre for Medium-Range Weather Forecasts) and EUMETSAT, if not used for commercial purposes. Extending service provision on a commercial basis might require changes in the licensing of data provided by ECMWF and EUMETSAT to ARPAV. It is possible that the revenue from the visibility information service would not cover the licensing costs at least in the beginning after launching the service. Another potential obstacle to service provision on commercial basis would be the administrative structure in which the Teolo Meteorological Centre may end up paying the licensing costs of models and data types needed for service provision without getting allocated the corresponding income within ARPAV. Because of the uncertainty related to licensing costs and to receiving revenue from the service within ARPAV, launching a

ROADIDEA 215455
90/141
visibility information service as a commercial product is not an attractive option to the developers and operators of the fog pilot in present situation. At present, ARPAV is evaluating the possible warning product and impact, such as the best way of distribution. The most potential option at present is to produce maps of fog probability and distribute them mainly via Internet. A further step to be investigated could be to provide also numerical information on areas or on grid points. Traditionally, ARPAV has provided public meteorological services and had only few contacts with the mass media such as radio and television. The service implemented in the fog pilot covers only the Veneto region. However, some private stakeholders such as trucking companies would be interested in the service only in case it would cover a larger geographical area. According to the expert interviews, their willingness to pay for the service is closely linked to seeing and experiencing the benefits of the services for their businesses. Conclusions At least at present, the commercialisation of the fog warning service is prevented by administrative difficulties. The management of licensing fees to be paid to various external organisations would increase the amount of administrative work to be carried out, and the costs related to management of licenses and the actual licensing fees would be relatively high if the revenue from services provided on commercial basis was small. Because of the administrative difficulties related to service provision on commercial basis, the position of ARPAV as a public organisation, synergies between a fog warning service and other meteorological services and the safety aspect related to visibility information, providing a fog warning service as publicly funded service by ARPAV can be justified at least in the near future. In case of major changes in the operating environment or the needs of relevant stakeholders, a new analysis should be performed. In Finland, radio broadcasts have been found to be effective in disseminating weather-related information and warnings. At present, radio broadcasts and roadside variable message signs are the only means to reach car drivers during their trips. Therefore, cooperation with the mass media such as radio and television broadcasters should be considered to achieve effective dissemination of fog warnings to road users.
5.4.2.6. Costs and socio-economic impacts Costs The cost estimate for the entire fog warning pilot system, that is envisioned to be fully operational by the year 2011, is based on the following subsystem cost estimates and assumptions:
all procurement and other marginal costs are valued at today’s (2009) prices, whether they have accrued previously or will accrue in the future
the discounting rate for future costs is 5%, which represents the required return on investment of ARPAV; note that other stakeholders could have other discounting rates they are obliged to use when they assess the benefits of the fog pilot
the subsystems of the pilot system are: o visibility detectors, ’visibilimeters’

ROADIDEA 215455
91/141
o detectors’ instalment costs and yearly operating and maintenance costs o costs of data transfer from detectors to ARPAV server/office o procurement cost of additional IT equipment and infrastructure o IT equipment and infrastructure annual operating and maintenance cost o additional staff effort, if any, that is needed to host and operate the fog
warning service at ARPAV o other additional costs, e.g. additional overhead, licences, etc.
These costs are estimated below and the explanations and justifications are given at the same time. Cost-benefit assessment System investment and operating cost Additional met-observation stations are not necessarily needed in order to set up the fog pilot. The final fog warning service is another story and might well require new stations in critical points to ensure sufficient geographical coverage and to operate reliably even if some stations are out of order. By the end of 2009, ARPAV had installed 10 visibilitymeters in connection to existing standard meteorological observation stations. Hence there are no met-station procurement needs in the vicinity of Pilot. However, ARPAV has the preference to allocate a part of the procurement cost of the met-stations to the fog pilot. It was approximated by ARPAV that about 5% of the total procurement cost of these met-stations should be regarded as the ‘investment cost’ for Pilot. One met-station costs about 10 000 €, and the aforementioned set of 10 stations would then mean an investment of 10 pcs ×10 000 €/pc ×0.05 = 5 000 € The installation cost is to be added to procurement cost and this was estimated to be again a 5% fraction of the total installation cost 10 work days/pcs × 150 €/work day × 10 pcs × 0.05 = 750 € The visibilitymeters supplied by Vaisala Ltd represent a direct purchase and investment cost. One visibilitymeter costs 5 000 € and its full instalment to make it operational about 2 working days: 10 pcs ×5 000 €/pc = 50 000 € 2 work days × 150 €/work day ×10 = 3 000 € The database modifications and set-up required to make the fog pilot operational is a minor effort performed by internal IT experts: 5 work days × 170 €/work day = 850 € Satellite data acquisition is not a marginal cost, but for investment calculation and managerial / administrative purposes to justify the fog pilot a share of 20% of satellite data acquisition costs is allocated for Pilot: 35 000 € × 20% = 7 000 € Then the cost for implementation of the SAFNWC software must be added:

ROADIDEA 215455
92/141
20 work days × 180 €/work day = 3 600 € The largest investment lump comes from expert work associated with model development, the result being a meta-model, that combines various other models and the data these produce: Calmet model implementation: 6 work months ×3 200 €/work month = 19 200 € Statistical models: 6 work months ×3 200 €/work month = 19 200 € Core model: 10 work months ×3 200 €/work month = 32 000 € Model verification process: 2 work months ×3 200 €/work month = 6 400 € Model tuning process: 6 work months ×3 200 €/work month = 19 200 € Finally, there are some system hardware costs, which do not exclusively serve the fog pilot, and this fraction of 5% yields to: 5 000 € × 5% = 250 € and the internet site development, disseminating the fog pilot’s outputs, capitalised as one lump sum: 15 months × 170 €/month = 2 550 € Then the annual operating and maintenance costs have been estimated as follows: first, the fraction of met-stations’ maintenance and operating cost, estimated to be 10% of the total maintenance and operating cost, incurring each year, and allocated as the fog pilot’s costs: 10 pcs × 3 600 €/year × 10% = 3 600 €/year The visibilitymeters’ yearly operating and maintenance costs were approximated to be: 10 pcs × 2 work days/year × 150 €/work day = 3 000 €/year A fraction of the annual fees of satellite receiver system maintenance is also allocated to the fog pilot: 2 500 €/year × 40% = 1 000 €/year There are further tasks related to IT system maintenance, data quality control, system control and the fog pilot service product processing. It must be noted, that the fog pilot’s models need to be constantly developed and updated as any other models that are used for continuous service processes. These efforts are vital to maintain the quality of service outputs. These efforts are estimated to be as the following: Database maint. and product visualisation: 8 work days/year × 180 €/work day = 1 440 €/year SAF Nowcasting software: 12 work days/year × 180 €/work day = 2 160 €/year Calmet model runs (fraction for Pilot): 12 work days/year × 180 €/work day × 10% = 216 €/year Core model runs and checks: 12 work days/year × 180 €/work day = 2 160 €/year

ROADIDEA 215455
93/141
Model verification (continuous): 12 work days/year × 180 €/work day = 2 160 €/year Model tuning (continuous): 12 work days/year × 180 €/work day = 2 160 €/year Internet site maintenance: 4 work day/year ×180 €/work day = 720 €/year The summary investment and operating cost budget can be drafted now based on the above estimates. The base year is 2009 and for calculation purposes, all investments and procurement is assumed to take place in 2009 (in reality, 2009-2010). All costs are in 2009 prices. The annual operating and maintenance is expected to start in 2010 and the horizon for analysis is until 2020, i.e. 12 years altogether:
Year Investments, procurements
1 000 € Maintenance and operating, day-to-day or annual efforts
1 000 €/year
2009 169,0 0
2010-2020 0 18,6
Table 12: 12-year costs of the for warning system (investment and operation)
Benefits = impacts The benefits from the fog warning system come from the accident cost savings, i.e. the reduced number of accidents in foggy road traffic conditions. This is the only significant benefit that is assessed. Based on other studies on similar systems there is a reduction in traffic accidents, although truly empirical studies are scarce. Caltrans (California Dept. of Transportation) reports 70% cut in accident numbers in foggy conditions on highway 120 (Hollo 2009). Dutch fog warning system using variable message signs yielded to a 20% reduction of accidents in foggy conditions (eSafety Forum 2009). M25 fog warning system in London reduced driving speeds by 3 km/h when fog warnings were issued (eSafety Forum 2009). The speed reduction alone has an impact on safety, but an adverse impact on time costs, which are disregarded in this analysis. Automobile Club d’Italia (ACI) has estimated that in 2005 the total socio-economic losses of accidents resulted either directly or indirectly total for 34733 million € per year. Of this total figure, ca. 12158 million € was the loss of production in present value terms, 5050 million the value of personal injuries, 702 million the direct cost of medical care, 11224 million direct material losses, 5484 million administrative costs and 114 million legal process costs (source: http://www.up.aci.it/pesaro/IMG/pdf/Costi_sociali_incidenti_stradali_anno_2005.pdf). Alternatively, it could have been possible to use e.g. value of statistical life adopted in other EU studies, such as eIMPACT (2008), but the abovementioned estimate was regarded sufficient and is furthermore based on Italian assessments and statistics. The Veneto Region represents about 10% of Italy’s accident figures, but the region is more exposed to fog formation than most other parts of the country (Domenichini 2009 and Statistical Reports of Regione Veneto 2009). Looking at Italy’s national statistics and Veneto Region’s corresponding figures, it seems that about 1% of all accidents occur in foggy conditions. The gravest uncertainty concerns the actual impact in accident reduction. If we look at point-specific or road stretch specific fog warning systems, like M25, we could further assume that the fog pilot in its fully operational form could reduce 20% of the accidents

ROADIDEA 215455
94/141
in foggy conditions. However, the system is regional and does not provide exact location-based warnings but general info on reduced visibility when considering the Veneto region whole road network. 20% reduction could be a serious overestimate. Furthermore, the present Pilot does not cover whole Veneto region, but only about 75% of the region. Typically, weather –related warning systems reduce accidents by 1%-2%, according to available literature (see e.g. Hautala & Leviäkangas 2007 for review). We shall use the smaller reduction factor: 1%. The savings which are hypothesized here come from an estimation of the order of magnitude based on the conservative assumption that the fog warning would reduce total social costs of fog-related accident by 1%. The reduction was not discussed, but it seems plausible to assume that people obtaining information on reduced visibility will (i) decide whether or not to go on the trip, or (ii) plan with longer trip times and inform business or private partners accordingly and thus avoid getting stressed while on the road. The potential of interfacing the fog pilot with the traffic management is another aspect which can generate benefits. Such an interface could allow adjusting the speed limits depending on weather conditions. On the highways, where such infrastructure is present, this is already being done to some extent. On the rest of the road network major investments in signalling infrastructure would be needed to provide an adequate dynamic speed limit management. Cost-benefit calculation The ex ante benefit-cost ratio of the full-scale system would then be in 2009 price level:
( )∑=
=⎥⎦
⎤⎢⎣
⎡
+×
+++××n
tts
tst
et
et
t
ostscofvaluepresentbenefitsofvaluepresent
rOpeInvOpeInvmpIegRAcc
0 11
where
Acct = aggregate accident costs of fog-related accidents in years 2010-2020, 10% of the national figure and 1% fog’s share of all accidents = 35 000 000 K€/year × 0.1 × 0.01 = 35 000 K€ / year Reg = regional coverage 75% × = 0.75 Imp = conservative reduction factor of warning systems based on literature review = 0.01 Invet = investments in detection and observation equipment in year 2009 = 70.2 K€ Invst = investments in model development in year 2009 = 98.8 K€ Opeet = operating costs of detection and observation system between 2010-2020 = 7.6 K€/a Opest = operating costs of other service systems and model updates and maintenance between 2010-2020 = 11.0 K€/a r = chosen discounting rate 5% t = time index in years, t runs from 2009 to 2020.
The outcome of the calculation shows clearly that the investment is very profitable and worth making, and even more so, because many of the benefit assumptions are on the safe side. However, we have to recall that the time cost savings due to reduced speeds

ROADIDEA 215455
95/141
is definitely negative and disregarded here. But on the other hand, including time losses in this context is somewhat doubtful even if theoretically correct. The benefit cost ratio is above 9 and the net present value shows 1.6 million €. Internal rate of return for nominal flows (i.e. non-discounted) is 77%. All indicators show the signs for extremely good investment. The longer time horizon is adopted, the more beneficial becomes the calculation result.
Figure 22: Profitability calculation results for the fog pilot
The sensitivity analysis shows were the risks may lie when assessing the goodness of the investment decision. Table 13 shows this. The most severe risk is focused on benefit assessment. This is logical as these items dictate the investment outcome in the long run. If benefits are overestimated, the profitability of the investment is quickly very questionable. In the preceding analysis the reduction factor for fog-related accidents was 1%, which according to the literature review was most conservative estimate. As to the other assumptions regarding investments and operating costs, the outcome is more robust: even with considerable estimate errors the investment in the fog pilot remains profitable.
Benefits and costs (present values, r = 5%)
-200
-150
-100
-50
0
50
100
150
200
250
2009 2010 2011 2012 2013 2014 2015 2016 2017 2018 2019 2020
1 00
0 E
UR
Initial investments in 2009
Only operating costs, no benefits in 2010
Accident cost savings from 2011 onw ards
Benefit-cost ratio = 9,4Net present value = 1576 K€IRR = 77%

ROADIDEA 215455
96/141
-50 % 0 % +50%2 % 5,3 11,4 17,65 % 4,4 9,4 14,58 % 3,6 7,8 12,0
-50 % 0 % +50%2 % 20,8 11,4 7,85 % 17,3 9,4 6,58 % 14,3 7,8 5,4
-50 % 0 % +50%2 % 12,5 11,4 10,55 % 10,3 9,4 8,78 % 8,5 7,8 7,2
Investment
BenefitsRate
Rate
RateOperating and maintenance p.a.
Table 13: Sensitivity of cost-benefit ratio with alternative discounting rates (2%, 5%, 8%) and different cost or benefit estimate errors.
Our analysis does not include other potential benefits, such as those resulting in from re-routing and avoiding parts of road network with reduced visibility and lower than expected speeds. Also the availability of fog information could be well used for the benefit of other modes of transport; air traffic and rail transport in particular, perhaps the waterborne transport too to some extent. All these modes are very important in Veneto Region. We can further sum at least the following potential factors that either present a risk or prospective additional benefit for our robust cost-benefit analysis: Potential risks reducing profitability (other than already discussed):
development of in-vehicle technologies so that centralised processing of visibility warnings become redundant or at least less useful; however, this is a long-range risk not realising very likely within the near future and it does not apply to ex ante information given to drivers, operators and travellers
changes in driving behaviour and culture; this is a very small risk
reduction in traffic volumes so that accident benefits are over-estimated
changes in local climate reducing the occurrence of fog. Potential additional benefits:
changes in local climate increasing the occurrence in fog
increase in traffic volumes so that accident risk based on visibility reduction is increased; in fact, this risk grows not only in pace with traffic growth but faster as traffic density increases and safe distances between vehicles are reduced.
It is fairly safe to conclude that the fog pilot is a profitable investment with likely positive impacts on road safety and with prospects to serve also other modes of transport.
5.4.2.7. Degree of innovation The evaluation of degree of innovation of the fog pilot is based on ROADIDEA’s “innovation table” and here the evaluation is done subjectively by VTT and ARPAV. The justification and argumentation is done after the table.

ROADIDEA 215455
97/141
The strongest innovation aspect comes from fog warning product generation, where visibility information is combined with satellite and other meteorological information. The innovation is a typical case of merging different data sources and creating a new product. The innovation is path-breaking in the sense that no similar effort was known to the evaluators. Similar fog warning systems are mostly point-specific and there is no wide covering visibility measurement as there is in the fog pilot’s case. The market potential exists, but perhaps first as a public service to drivers, authorities and road companies mostly. However, this is not very far from the vision of national fog warning
Name of Idea Innovation Aspects
Factor Value
New or innovative/existence of a new element 0=the idea exists and is on the market already, 1= similar services on the market but idea has some new aspects, 2= completely new idea not known to be implemented, 3= completely new idea not known to be developed anywhere, 4= revolutionary and radical new idea
0 1 2 3 4
Relation to the state-of-the-art 0=no added value, 1= unclear added value, 2=minor added value, 3=large added value, 4=revolutionary
0 1 2 3 4
Scale and potential impact of the idea 0=no foreseen impact, 1=small scale innovation, small impact, 2=small scale innovation, large impact, 3=large scale innovation, small impact, 4=large scale innovation, large impact
0 1 2 3 4
Potential for multiple use 0= does not solve known problems, 1=solutions for a single problem, 2=solutions for a few deployment cases, 3=solutions for many similar deployment cases, 4= revolutionary new solution with multitude of potential deployment sectors
0 1 2 3 4
Relevance to global policy objectives 0=no clear contribution or idea politically not accepted, 1=low contribution, 2=average contribution with usual impact, 3=clear strong contribution to sustainable development, strong impact, 4= revolutionary new concept solving key problems in society
0 1 2 3 4
Feasibility of the concept/obstacle to implementation 0=idea hard to implement in general, 1=idea hard to implement in the short run, 2=idea can be implemented with an average effort and risk, 3=idea easy to implement, 4=industry will compete on this idea for quick implementation
0 1 2 3 4
Relevance for business generation 0=no business opportunity foreseen, 1=unclear business case, some potential maybe in the future, 2=clear business case today, but small market, 3= clear business case, large market, 4=killer application, large market
0 1 2 3 4
Public interest 0=no public interest in the idea, 1= some public interest, 2=clear public interest, but no business case, 3= clear public interest with business case, 4= public will go wild with this idea
0 1 2 3 4
Comments

ROADIDEA 215455
98/141
service or even commercial service supply provided that administrational and data policy issues are solved.
5.4.3. Evaluation summary and future perspectives According to the pilot description, the objectives of the pilot were to:
Install specific sensors suitable for visibility measurement and/or estimation;
Identify and collect data related to fog and low visibility conditions;
Combine the identified data in an optimal way accounting for their relative quality;
Generate visibility products suitable for various categories of end users;
Test the dissemination of visibility products through various channels to various categories of end users;
Obtain selected feedback from end users on reliability and usefulness of the visibility products.
The pilot system provides fog information as a real-time probability map on the basis of visibility measured on the ground, meteorological variables measured by ground stations and satellite images. Therefore, the two first objectives have clearly been achieved. The pilot has produced relevant information about the strengths and limitations of the various data sources and data types, which can be used to produce visibility information, and the pilot has successfully demonstrated the provision of area-based visibility information on the basis of a combination of different data sources. However, detailed analysis of the quality of the various data types used as inputs of the services has not been performed, and it has been considered to be out of the scope of the pilot and this evaluation. Even though the development of algorithms used to combine information from various sources will most probably continue after the pilot, the third objective has most probably been achieved in general. The visibility information service implemented in the fog pilot is now available on ARPAV and ROADIDEA web sites. The visibility information is presented as a probability map of fog. The mobile information services planned earlier are not available yet, but the operator of the fog pilot is working with prospective users of the visibility information to gather information about the needs of various user groups. Even if the visibility information is currently available only as a web site, the fog pilot has implemented a service, which has potential to benefit several user groups. The fog pilot can be considered to have generally achieved the fourth and fifth objective. The interoperability requirements have been analysed for both incoming raw data and visibility information to be provided to users and other service providers as well as for integrating the fog pilot to data processing platforms commonly operated by meteorological institutes and other meteorological service providers. Therefore, the main requirements for interoperability with other systems have been identified in the pilot. The technical implementation of the service allows increasing the geographical coverage of the service at least to most regions in Northern Italy. While no major changes to the processing of information would be needed, increasing the geographical coverage would require installation of additional visibilimeters and cooperation with other meteorological

ROADIDEA 215455
99/141
services. For all regions covered by the service, meteorological ground observations and visibilimeter data would be needed. The cost-benefit assessment was based on very detailed and accurate, recorded cost data. Hence uncertainties related to these items are in fact non-significant. Most uncertainties relate to exogenous trends such as regional / local climate changes, traffic growth patterns and evolution of vehicle technologies that may have a great impact on benefit-cost ratio. However, these types of uncertainties are always present and in fact managerial decision making problems after cost-benefit assessment. The cost-benefit assessment, even in its very robust form, indicated clearly that the fog pilot can be a socio-economically profitable investment. Actually the risks and uncertainties related to the profitability, and further taking into account the moderate magnitude of the investment, are quite limited. The degree of innovation is very satisfactory and follows the “level” that could be expected in a project like ROADIDEA. The table below summarises the evaluation outcomes. We have put the evaluation outcomes also in the context of the project and taking into account the resources allocated for one single pilot. In this respect, we consider the end result very good. Evaluation viewpoint or objective
Outcome / conclusion
Notes
Install specific sensors suitable for visibility measurement and/or estimation
OK Instalments done as planned
Identify and collect data related to fog and low visibility conditions
OK Very good, extensive statistical analysis taking into account the scope and resources
Combine the identified data in an optimal way accounting for their relative quality
ok Optimality not particularly well addressed, but tentatively discussed
Generate visibility products suitable for various categories of users
OK First products, the probability-based visibility maps produced
Test the dissemination of visibility products through various channels to various categories of users
ok Only internet dissemination tested
Obtain selected feedback from users on reliability and usefulness of the visibility products
OK Well-attended user seminar supplemented with interviews
Organisational aspects and business model
OK A conceptual service model was drafted and different options for finance were considered
Cost-benefit assessment OK CBA was based on very detailed and accurate cost information; most uncertainties related to CBA were exogenous to the pilot
Degree of innovation OK In some respects, first of its kind in

ROADIDEA 215455
100/141
the world
Table 14: Summary and conclusion of evaluation; OK = evaluation carried out as planned and pilot’s objectives met; ok = evaluation carried out, pilot’s objectives partly met; X = not evaluated or objectives not met
5.4.4. Major Steps Forward The future prospects of the fog pilot are at least as follows:
technical improvements of the visibility products and accuracy: The value of having precise humidity measurements in the near-saturation range could be raised as a worthwhile applied research topic. The humidity sensors are just not accurate enough and, on top of that, seem to have a drift on the time scale of many months or year, making statistical modelling difficult.
expanding the observation network, perhaps to cover neighbouring regions in order to make it more usable to wider set of users, such as freight companies
Setting up visibility sensors on a broad scale and data exchange are relevant further issues. The most innovative aspect in this regard is to learn how to obtain the visibility information from the widely available web cam networks and how to integrate human reports.
improvements of data merging techniques and models
merging other data sources, such as webcams and direct human observations
marketing the products for users
combining the information with existing products, such as Google maps
exploring possibilities for mass media distribution
exploring the commercial prospects.

ROADIDEA 215455
101/141
Appendix 1: Questionnaire targeted to the potential users of visibility information service QUESTIONNAIRE “ROADIDEA” PROJECT ARPAV - DRST, Centro Meteorologico di Teolo,
1) What are the impacts of low visibility conditions on your activities? 2) Are there times of the day during which the impact of fog is more relevant for
your activities (night, day, early morning, evening, …)? 3) Do you have any economical loss due to low visibility conditions (for example,
as a consequence of a slower traffic motion or a traffic congestion, etc…)? If so, how do you estimate it?
4) Do you have any procedures for rearranging your activities in low visibility conditions? - If so, which? - If no, could it be useful to have them?
5) Is the knowledge of the spatial distribution of reduced visibility conditions on the regional road network useful for your business / operations? - If so, how? - If no, why?
6) What are your needs relating to the Fog warning service (content, distribution –internet, mobile phones WAP sites, SMS alert, user interface, etc…)?
7) Would you pay for such a service?

ROADIDEA 215455
102/141
5.5. Hamburg Port pilot
5.5.1. Overview and purpose of the pilot The pilot in the Port of Hamburg follows the assumption that there is a correlation between the arrivals and departures of container vessels at the container transhipment terminals and the generated road container traffic situation. This relationship is certainly not a straightforward one. Between the loading and unloading process at the berths and the moment when a container appears on the road, there are complex transhipment and container handling processes. Nevertheless, it turned out that it is very interesting for road capacity planning and traffic management to know how the road traffic situation develops taking into account the ship notifications for a certain defined period of time. This becomes more and more relevant as the container volumes are likely to increase. Before the start of the economic crisis in 2008, it was predicted that container volumes are likely to double by 2015 reaching a number of 18 Mio TEU. If this prediction comes true, the road network is likely to reach capacity limits, which will in turn do damage to the capacity and competitiveness of the entire port. The economic crisis in 2009/10 might delay this process, but it is still likely that growth will take hold again. So, the topic of this pilot is highly relevant for research. On the other hand, the first investigations have already revealed that the topic is very complex, and that within ROADIDEA the investigation can only be pursued theoretically to a certain extent. The Port of Hamburg is one of the largest container ports in Europe. It has four major container terminals, which at the same time load and unload the containers from and to the ships. The terminals are intermodal hubs with connections to hinterland transport. Road transport is the most important means of hinterland transport. The pilot idea argues that there is a correlation between the pattern of container ship arrivals and the intensity of road container traffic. If this is true, this could be the basis for a model, which predicts road container traffic taking into account information on forthcoming ship arrivals. This information is useful for the road traffic planning processes of the Hamburg Port Authority and – if this can be calculated dynamically – also as input for future road traffic management systems. The pilot has two distinct parts, which require further investigation and analysis:
1. the description of logistics processes on the terminals from the notification of the ships further on to the transhipment process and the decision process on hinterland transports and necessary logistics services for both import and export containers. This part ends with the prediction of the road container traffic demand generated by the terminals in a certain short time period.
2. the description of the distribution of the generated road container traffic on the
road network and the mix with general road traffic.

ROADIDEA 215455
103/141
5.5.2. User needs Research methods:
Interviews with representatives of the Hamburg Authority (HPA) and DAKOSY Datenkommunikationssystem AG (Port IT Service Provider)
Literature study on related ongoing study, especially BIT-Business Integrated Truck and IMP-Import Platform
User needs:
The main user of the application will be HPA. The motivation for the application is input to the road traffic planning and traffic management process. In the first deployment stage, the service shall be used regularly (but not continuously) by the road traffic planners of HPA. In the long-term perspective, the application could become a functionality of a new Traffic Management System of the port.
The service shall deliver a prognosis to the truck traffic on the defined port road network depending on the know ship arrivals/departures at the four major container terminals.
The service shall cover the road network of the Port of Hamburg and the main connections with the hinterland. The Hinterland connection of the port is made sure by a few roads. The Motorway A7 to the west and the motorways A255 and A1 to the east. The main route through the port is depending on these motorway connections. The main route made up by the following streets: Am Saalehafen, Veddeler Damm, Reiherdamm, Köhlbrandbrücke and Finkenwerder Straße.
Figure 23: The foreseen site – Port of Hamburg road network
The service shall make the prognosis offline first and in a longer perspective also online based on measured data. The basis is the arrival/departure situation at the four most important container terminals of the Port of Hamburg: Alterwerder, Burchardkai, Eurokai and Tollerort.

ROADIDEA 215455
104/141
The service shall produce the prognosis based on a snapshot of container ship arrivals and departures at the moment x. The prognosis shall take into account the container handling processes at the terminals, customs offices, the packing stations, the veterinary office and the container depots. Based on statistical calculations, number of container trips by truck shall be determined at the moment y when the containers leave the terminals and appear on the roads.
= x = x + y
road network
transport to another terminal
customs
packing stations
veterinary
container depot
= x + y = x
Figure 24: The principle of the prognosis
The service shall merge traffic volumes of container trucks with the traffic volumes of general road traffic.
The service shall display the results on a digital road map and in tables. Statistical analyses shall be possible.
Assessment of user needs: The pilot idea touched a very relevant topic. There is really the strong need of the HPA
to improve the data basis of the road traffic situation in the port in general and especially related to the movement of container trucks
to inter-relate the truck movements with the activities on the container terminals in order to make the traffic situation more predictable
to overcome the information gap between the private and the public data providers in the port
to build up a road traffic management for the Port of Hamburg

ROADIDEA 215455
105/141
It can be said that ROADIDEA realistically assess the situation and the needs for the users. The idea was discussed and developed in around 10 meetings with the core user group of Hamburg Port Authority throughout the project, but it was soon felt that the idea would require the involvement further stakeholder groups which would most likely go beyond the capacities of ROADIDEA.
5.5.3. Baseline scenario Traffic situation In the current situation, the Hamburg Port Authority has on statistical records of the road traffic situation available. These records are offline and contain traffic counts from selected strategic intersections in the port area, which are done once a year on one day. Thus historical traffic data concerning the road network from all periods in the past is not available. It can be said that complete traffic situation in the past cannot be depicted. Specific data on container truck moves is not available. Terminal logistics situation
5.5.4. Global principle and problem solving The problem consists of two parts:
the determination of a correlation between ship arrivals/departures and road traffic generated by the container terminals
the distribution of the generated road container traffic on the road network as well as overlaying road container traffic with the general traffic in the port area.
Both parts must have a clear interface.

ROADIDEA 215455
106/141
Figure 25: Short overview of the process
There are two levels of pilot consideration. A first and simpler problem is to consider a model for traffic planning. This model would then predict the road HGV traffic volumes based on planned ship arrivals/departures and based on statistical data on road traffic. The second and more complex problem would be to make the process dynamic based in real ship arrivals and the online traffic situation based on measured road traffic data. This approach would more support traffic management purposes. The processes to be considered can be described as follows:
A) The container logistics process The container logistics process covers the flow of containers from the ship (import) and to the ship (export) in dependence on the ship arrival/ departure. Input data would be:
Ship arrival/ departure times
Number of containers picked up/ delivered by each ship
Origin and destination of each container in the hinterland
Mode use for hinterland transport per container
Container Vessel
Container Vessel
Container Vessel
Container Vessel
Terminal 1
Terminal 2
Terminal 3
Terminal 4
Feeder
Rail
Inl. Nav.
Feeder
Rail
Inl. Nav.
Feeder
Rail
Inl. Nav.
GeneralRoad Traffic
perhaps:• customs control• investigations
perhaps:• customs control• investigations
perhaps:• customs control• investigations
perhaps:• customs control• investigations
Feeder
Rail
Inl. Nav.
Container Vessel
Container Vessel
Container Vessel
Container Vessel
Terminal 1
Terminal 2
Terminal 3
Terminal 4
Feeder
Rail
Inl. Nav.
Feeder
Rail
Inl. Nav.
Feeder
Rail
Inl. Nav.
Feeder
Rail
Inl. Nav.
Feeder
Rail
Inl. Nav.
Feeder
Rail
Inl. Nav.
GeneralRoad Traffic
perhaps:• customs control• investigations
perhaps:• customs control• investigations
perhaps:• customs control• investigations
perhaps:• customs control• investigations
Feeder
Rail
Inl. Nav.
Feeder
Rail
Inl. Nav.

ROADIDEA 215455
107/141
Output data would be:
Number of generated road trips per time interval and terminal
Handling delay on terminal/ start time of the trip
Intermediate steps of a road trip (customs, veterinary office, packing station): • Number of intermediate steps per trip • Delay at every step • Location of intermediate step
Final origin/destination of container The process must consider the modal split at every terminal, and the processes at the four individual terminals must be overlaid. Furthermore, it must be investigated how many empty container moves and container transfer between terminals are generated.
B) The road traffic process The road traffic process covers the flow of container trucks in the port-related road network. This requires an overview of all trips (import, export, transfer, empty) generated by all four terminals in a certain time interval. Input data would be the output data process A) for all four terminals. Output would be the number and location container truck moves on the road sections in the port-related network in a certain time interval with relation to the ship arrival. Furthermore, these container truck moves need to be put in relation to the general road traffic on the sections of the port-related road network at a certain time period. Approaches to modelling In order to understand the global process of generating trips of container trucks pilot team elaborated the following process model for the import process at one terminal. With a certain delay after the ship arrival, the truck will appear in the road network carrying out a trip to a certain destination. The process is determined by
the final destination of the container
the delay of the container on the terminal
the need for the truck to bring a container to an intermediate station (customs, packing station, veterinary office, other container terminals)
the likelihood of interventions by the authorities
the delay of the truck at the different intermediate stations.

ROADIDEA 215455
108/141
Terminal Approx. 200 per hour leave the terminal area
Customs station
HighwayPacking station Other roads to thesurrounding area
Highway Other roads to thesurrounding area
Highway Other roads to thesurrounding area
20 / h66 / h
8 / h2 / h
85 / h 10 / h 65 / h 30 / h
Approx. 1 truck is not allowed to import his goods, 2 trucks have to be aerated and vented
Veterinary
5 / h
4 / h
Approx. 1 truck is not allowed to import his goods
Aerating and venting
Highway Other roads to thesurrounding area
2 / h
1 / h 1 / h
Transport to another terminal
5 / h
Figure 26: Modelling approach container import process at one terminal
All these processes would need to be statistically described in order to obtain a value for the above-mentioned indicators. At the end it needs to be statistically calculated when a trip is generated by a terminal and where it will go (i.e. how the container will leave the port). This requires an statistical analysis which is quite complex an will comprise an in-depth investigation of the real processes, analysing files and papers of forwarding agents, the customs, the terminals, transport companies etc. This analysis will go beyond the possibilities of ROADIDEA. The figure below models the export process for one container terminal. The process is determined by
the origin of the container
the determined arrival time
the need for the truck to bring a container to an intermediate station (customs)
the likelihood of interventions by the authorities (customs)
the delay of the truck intermediate stations.

ROADIDEA 215455
109/141
Approx. 180 trucks per hour drive to the terminal
Highway Other roads to thesurrounding areaHighway Other roads to the
surrounding area
10 / h90 / h 60 / h 20 / h
99 / h
Customs station
Terminal
Approx. 1 truck is not allowed to export his goods
Figure 27: Modelling approach container export process at on terminal
Again, these processes would need to be statistically described in order to obtain a value for the above-mentioned indicators. At the end it needs to be statistically calculated when a trip is generated by a terminal and where it will go (i.e. how the container will enter the port). The next figure illustrates all so far identified input data for the modelling process.
Data pool basic data
statistical model
port of hamburg
Data pool ExportData
poo
l Im
port
Trips of empty containers
Basic load on the roadnetwork withoutcontainer trucks
Ships per dayUnloaded containers
per dayModal SplitNeeded time on
the terminalClearances per hourNumber of containers
for veterinaryNeeded time by
the veterinaryNumber of prohibitions
of further transportNumber of containers
or customsNeeded time at the
customs stationsNumber of prohibitions
of further transport
Number of trucks
for the export
Distribution of on
highways and on
other roads
Number of transports
to a customs station
Needed time at th
e
customs stations
Number of prohibitions
of further tra
nsport
Chosen terminal
Needed time at the
packing stationsDistribution on packing
stations, highways
and other roads
Number of transports of containers from
one terminal to another
Figure 28: Modelling approach overall process

ROADIDEA 215455
110/141
Assessment of global principle and problem solving: The global principle to solve the problem seems to be correct as far as the development of the pilot idea has gone. However, the development could not be brought to an end for the following reasons:
The solution of the general modelling problem needs a more comprehensive process and data analysis before a model can be planned in detail. The mere analysis of the problem is already too ambitious for the frame of ROADIDEA.
The current traffic data availability at HPA is insufficient. Online data detection is not available (although HPA is now considering an online detection system.)
The stakeholder community must considerably be extended in order to make the solution more concrete.
Furthermore, the analysis of processes at the terminals, at the customs, a packing stations and transport companies must be deepened, which goes beyond the capacities of ROADIDEA.
There are significant problems related to data protection of commercial data, which could not be resolved within the project.
There are significant uncertainties about data availability in the private sector, which would require a complex in-depth information and data research at several transport und terminal companies in the port business.
The HPA was approached with a questionnaire survey with the aim of making the service concept more concrete. In connection to this ROADIDEA lost the support of the HPA on the grounds that much more work is expected to resolve the problem, which could not be invested by HPA as an external user group.
5.5.5. Data availability and data quality The needed data has to be collected from several operators and authorities. These are:
Customs stations
Terminal operators
Veterinary office
HPA
Packing stations
Hauliers
DAKOSY (the IT service provider for the port) The investigation into data availability is a complex task, and the full picture about data availability cannot be established in ROADIDEA for several reasons. Logistics Data Data about the logistics processes on the container terminals are partly available, also electronically. The electronically available data were analysed. This is already a challenge because the service provider does not deliver the data without permission of the data

ROADIDEA 215455
111/141
owners (companies in port business). Thus, there is a significant obstacle to data analysis. It is likely that necessary information is not measured at all, and that additional data would need to be created. Road traffic data The road traffic data basis is currently too weak. There is no online measure traffic data available. Even the available statistical data from selected major intersections is – according to the preliminary assessment by Amanova – not sufficient to model the traffic situation in the current state. The pilot can only define minimum requirements on traffic data measurements, which then need to be fulfilled by the Hamburg Port Authority (HPA). The HPA plans the installation of online traffic data detection.
5.5.6. Cost estimate A realistic cost estimate is hard to obtain at the currents stage. Especially unclear positions are still:
Costs for data detection
Cost for data procurement
Costs for the analysis of still existing information gaps in the logistics processes and for specific counting and surveys.
5.5.7. Organisational aspects The evaluation goal is to confirm a first organisation and hosting plan. The plan for the operation and hosting has still significant gaps and can only be seriously drawn up if the technical concept has resolved the problems stated under “Global Principle and Problem Solving”. The operation of such an application would require the co-operation of several different stakeholders from the public and the private sector. The stakeholder groups were mentioned under 5.5.5. The idea is that the HPA operates and hosts the application. An alternative would be DAKOSY, the port information service provider.
5.5.8. Added value and business opportunities The first service concept could finally be confirmed. The technical case would still need significant research outside ROADIDEA. The added valued for the HPA still expected in a prognosis of the truck movements depending on the situation on the container terminals. The will be useful for infrastructure planning and for traffic management.

ROADIDEA 215455
112/141
5.5.9. Degree of innovation Using the questionnaire “Evaluation of innovation aspects”, the results are: New/innovative; existence of a new element: 3 – Completely new idea, not know to be implemented anywhere Relation to the state-of-the-art: 3 – Large added value Scale and impact of the idea: 3 – Large-scale innovation, small impact Potential for multiple uses: 2 – Solutions for a few deployment cases Relevance to global policy objectives: 2 – Average contribution with usual Impact Feasibility of the concept/obstacle to implementation: 1 – hard to implement in the short run Relevance for business generation: 1 – unclear business case, some potential maybe in the future Public interest: 2 – clear public interest, but no business case It can be concluded that the Pilot would bring added value mainly to the Hamburg Port Authority. The application is very complex, and there is no basic system on which the pilot could be built. It is likely that the detailed solution can only be used in the Port of Hamburg, although the general idea could be transferred to ports with similar conditions. The commercial business case is weak. It is more likely an application for the public administration in traffic management.
5.5.10. Problems Major problem encountered are:
The scope of the pilot development is clearly too wide for ROADIDEA. So even to develop a concept is a challenge.
The approach needs the involvement of a wide range of stakeholder groups from the port business, which are not ROADIDEA partners.
It turned out that making processes transparent is already a challenge, which cannot completely be resolved in ROADIDEA.
Commercial interests of service providers withhold available data.
Commercial companies are reluctant to make business processes transparent.
A wider range of data is not available because it is not measured. Further in-depth analyses would be necessary into data availability and the need for investigations.

ROADIDEA 215455
113/141
5.5.11. Major Steps Forward The continuation of this subject would be an issue of a new research project outside ROADIDEA. Currently, the Hamburg Port Authority as well as the City of Hamburg are setting up wider-scale plans and implementations for the traffic management for the whole city including the port. This comprises the massive modernisation of the ITS systems for road traffic in the port area as a precondition for more modern traffic management measures in the port area according to the new Masterplan for Traffic Management in the port. A part of these activities will also be:
• the implementation of a traffic data detection and monitoring network on the road network of the Port of Hamburg
• the development of more advanced modelling tools for the road traffic situation. • a co-operation between the terminals and the port and road authorities in order
to guide trucks to the terminals including a pre-gate facility. Some of these actions may already have been inspired by the discussions in the ROADIDEA user group with the HPA representatives. The HPA is currently creating a much better basis for the application, which was conceived in ROADIDEA as a “theoretical pilot” (e.g. the road traffic database will be online, and the data availability will be much better and the road traffic modelling will much more advanced in the coming years). So, the preconditions for the implementation of the ROADIDEA pilot idea will become better within foreseeable time (the next five years). In order to implement the pilot idea it would be necessary to open up the user group and to permanently involve the stakeholder groups mentioned under 5.5.5. It would be necessary to define a research project which verifies the details (and maybe modifies) of the pilot concept together with all stakeholders and which implements the pilot service in the light of the improved preconditions which are currently created by the HPA. Especially the partners from the logistics sector (terminal operators, forwarders) would need to be permanently involved in the project. This requires that the stakeholders are part of the project and that they obtain funding for concept developments, implementations, tests and demonstrations. Without being involved in ROADIDEA, their motivation to support such a complex idea was limited so far. This also requires that the available data and models are made available to such a project. So, it is also advisable the have DAKOSY as the established service provider in the project. This approach can finally lead to co-modal ITS application, which is a part of a larger port-related traffic management system. It would probably be an interesting research topic for one of the upcoming R&D calls. Similar situations may be relevant for dissemination to other European port cities as well.

ROADIDEA 215455
114/141
5.6. Trip rainfall forecast pilot
Can I avoid the rain?
This section describes the evaluation of the pilot for rainfall forecast along a planned route or for a point. The pilot shows how for the Netherlands users can select a route in an on-line trip planner and a departure time / speed and then get a forecast of rainfall along the planned route. There is also an internet based demonstration “Will I get wet?” of the rainfall forecast at the (approximate) location of the connecting device (PC or mobile phone).
Figure 29: Screen shots of both demonstrations
5.6.1. Overview and purpose of the pilot Way finding is a key aspect of travel of all kinds, but the cost of inaccurate information is highest for human powered transport (bicycles and pedestrians). One idea that followed from the innovation seminars is to add a real-time link for rainfall forecasts to on-line trip planners. This can help users in deciding if postponing or advancing a trip departure helps in avoiding the incoming rain. To study this idea a real time link to the Dutch weather service (KNMI, see www.knmi.nl) was investigated as a potential additional service for on-line trip planning systems. The KNMI made real time weather data available for free for duration of the ROADIDEA project. The data feed provided by KNMI

ROADIDEA 215455
115/141
is the two-hour forecast for rainfall in the Netherlands on a one by one kilometre grid in five-minute intervals. To see these forecasts one can look at the www.buienradar.nl web site. The service idea is linked to several ROADIDEA Ideas from the innovation seminars:
1. MyRoute, Mobile Pocket Guidebook: My Route Mobile Pocket Guide is a system for providing travel information and updates over a mobile network. It gives the traveller / driver comprehensive real time traffic information needed for well-informed travel decisions (pre-trip information) as well as information during the journey (on-trip). As a demonstration of the kind of pre-trip service discussed in this ROADIDEA idea, there now is an operational ROADIDEA web site for a Trip Rainfall Forecast in Holland. It uses rainfall prediction 1 by 1 km grid data up to two hours ahead to prediction the amount of rainfall given a certain departure time. This kind of prediction is important for road exposed to the weather, such as bicyclists, motorcyclists, scooter drivers and pedestrians.
2. MyTravel, TOILET-TOMTOM: My Travel Toilet Tom-Tom service is offered to all
drivers and travellers. It gives a driver / traveller the possibility to find information on availability of toilets along a planned route, with particular impact on places for disabled persons and mothers with small children. It could also give the driver / traveller possibility to check the other resting possibilities at chosen place. Although My Travel Toilet Tom-Tom idea could seem a little bit frivolous, the service will have impact on the state of mind of the driver, and thus reduce driver’s nervousness, inattentiveness, uneasiness, and so reduce the risk of incidents. My Travel Toilet Tom-Tom could be integrated in some other Tom- Tom applications regarding travel planning. As a demonstration of this kind of service there is now an operational ROADIDEA web site for a point rainfall prediction in Holland. It uses rainfall prediction 1 by 1 km grid data up to two hours ahead to predict the amount of rainfall on the location of the device that connects with the Internet. The device can be a mobile phone, or laptop, or any other device that has a web browser that supports the GeoLocation API (see http://en.wikipedia.org/wiki/W3C_Geolocation_API ). For more information on this see http://www.roadidea.eu/pilots/pages/pilot6.aspx .
3. Mobile Phones as Sensor: This idea concerns the use of mobile phones as
sensors. One condition for that is that the position needs to be known. The point rainfall prediction demo shows how to use the GeoLocation API to provide a rainfall prediction for the location of the device calling the service.
4. FREEDATA: This ROADIDEA idea is not suggesting a new service as such, but a
new general data policy that would affect many present and coming transport services in Europe. In principle, Free Data indicates that key data sources for transport services - i.e. weather observations and models, road weather observations and models, traffic volume data, car measurements and other geospatial data - should be accessible and available free of charge (or with minimum copying costs) and in a convenient manner for any service provider for further utilisation. The Trip Rainfall Forecast pilot shows how to use rider input on a continuing basis to collect free (bicycle) path & road network data. The original source of the network data is www.openstreetmap.org . This network data is provided free for by this organisation and is also based on input from volunteers. Crowd sourcing has become a major method for network data collection

ROADIDEA 215455
116/141
worldwide. The weather data is provided as a 1 by 1 km grid up to two hours ahead by the Royal Dutch Weather Service KNMI per 5 minute interval. As part of this research project the data is provided for free!
The investigation of the route rainfall forecast idea resulted in a ROADIDEA Trip Rainfall Forecast Planner demonstration that is publicly available at http://www.roadidea.eu/pilots/pages/pilot5.aspx. The ROADIDEA demonstration is based on a combination of the rainfall forecasts in Holland with routes generated by the Demis trip planner for Holland made operational specifically for ROADIDEA. The result is that as a road user (cyclist, motorcyclist, pedestrian, etc.) you can better decide when to leave so as to miss the rain that is coming in. To illustrate the value of crowd-sourcing in free network data collection, the demonstration also includes an Online-GIS network editor InterNetter that allows users to add their own network data. The on-line GIS network editor is publicly accessible at http://rain.roadidea.eu/route/editor.aspx (please enter as username test and as password test). The demonstration also includes a link to a slide show in PowerPoint and a link to a survey (in Dutch!) on the need for rainfall forecast in on-line trip planners. The objectives of the pilot were:
1. To provide users with a route rainfall forecast as part of their pre-trip planning. Target is that users can decide whether or not to change the departure time for their trip, so as to avoid heavy rain.
2. Test this service in an existing trip planning system 3. Get feedback from end users via an on-line survey
5.6.2. Introduction of evaluation Evaluation of the route / point rainfall prediction demonstrations has been made from the following viewpoints:
Baseline scenario
User needs
Data quality
Functionality and technical implementation
Organizational aspects and business model
Costs and socioeconomic impacts
Degree of innovation

ROADIDEA 215455
117/141
Figure 30: Screen shot of the stand-alone test application used to validate the service
The targets and corresponding success indicators can be defined as follows: The target of a route rainfall prediction system is to provide road users such as bicyclists, pedestrians and motorcyclists with a location and time specific rainfall prediction along their planned route or for a certain point. This allows users to make better informed decisions on their departure time or transport mode for a trip (or other kinds of outdoor activity), e.g.:
Should I leave early with my bicycle to go home (just yesterday I left an hour early to arrive dry at my home)
To decide to take the car if it will rain too much to take the bicycle
To decide to take public transport instead of walking half an hour to a restaurant
Whether or not to play another nine holes of golf In order to be able to tell whether this target has been reached or not, the following success indicators have been defined:
1. The system provides sufficiently accurate rainfall prediction along a route or for a point.
2. Users find the route rainfall prediction beneficial and will use it in practice 3. The system is sustainable in financial terms
5.6.3. Baseline scenario Without a route rainfall prediction road users have to rely on existing sources of information, such as rainfall predictions in animated maps or general weather forecasts (in Holland there are general weather forecasts for bicyclists and pedestrians). This works fine if it rains everywhere for a long period. However, if the rainfall varies strongly

ROADIDEA 215455
118/141
in place and time the drawback of all the existing systems is that they do not easily provide the rainfall information for a specific location and time. This means that as a road user you have to guess and therefore you run the risk of getting wet more often. In Holland with predominant westerly winds road users often simply look out of their window to the sky to see the rain clouds coming and then decide when to go on their trip based on that. However the visible part of the sky usually only helps predict for the next few minutes as clouds move fairly fast. So for a longer trip the risk of getting wet is still there. The proposed route rainfall prediction however allows users to look ahead as far as two to three hours with fairly accurate location and time specific rainfall predictions. Sometimes it pays to wait 40 minutes before riding a bicycle, because 5 mm/hour rainfall will really make you wet.
Figure 31: Example from the route rainfall service

ROADIDEA 215455
119/141
An overview of the evaluation methods and results is given in the table below. Evaluation viewpoint
Focus of evaluation
Indicators Methods Results
User needs Is the service useful from the end user perspective
Have end users ever thought of the central question: postpone a trip to avoid the rain?
End user survey 90% of respondents do wonder how to avoid the incoming rain, and 48% like the service idea very much, with another 43% saying ‘perhaps’.
Global/ Principle Problem Solving
Demon-stration
Demonstrate the idea as a live service to allow user-feedback
Based on existing trip planner a simple algorithm is used to add route rainfall forecast
Service idea is fully operational and has been used in the end user survey. See the links at rain.roadidea.eu/route and at rain.roadidea.eu/point
Data quality Is rainfall forecast data good enough?
Rainfall forecast accuracy
Study report from data source
Numerical Weather Prediction is under continuous improvement. Accuracy is satisfactory.
Data Availability
Rainfall forecast
Live FTP service and % availability
Test availability The service has been available for more than 98% of the time during ROADIDEA
Cost estimate Willingness to pay & Business model
End users seem not willing to pay and that has strong impact on business model
Test willingness to pay via end user survey and base business model on that result
The end user survey has been very clear: almost nobody wants to pay for this service!
Organisational Aspects
Client In this case the target client is the Dutch Cyclist Union
Are they interested – organise meeting
A meeting with the Dutch Cyclist Union and KNMI has been organised. They are planning to explore implementation of this idea in the second half of 2010.
Added Value and Business Opportunities
User need End user indicate they are interested in the service
End user survey End users are interested but not willing to pay. Only through public funding can a free service be realised.
Degree of innovation
Has it been done before?
Check literature Free trip forecast services already exist on several web sites in the US for car trips (e.g. www.wunderground.com/roadtrip). But the service idea is new for pedestrians or bicyclists according to current on-line literature.
5.6.4. User needs The user needs were tested via an on-line end user survey. The survey (in Dutch) was announced on several bicycle rider web sites. No further active promotion of the end survey was done. An overview of the questions and the 40 responses is given below. It should be noted that the number of responses is not bad, given the low publicity approach. However a similar end user survey a couple of years ago on the need for an

ROADIDEA 215455
120/141
on-line bicycle trip planner yielded more than 1000 responses. This probably shows that the need for a bicycle trip planner was much bigger than for an extension of the trip planner with a Trip Rainfall Forecast. End user survey
1) Do you know the existing bicycle trip planners on the web by the Fietsersbond (Dutch Cyclist Union) at www.fietsersbond.nl ?
Reply Nr of respondents % of respondents
Yes 35 88% No 5 13%
2) Have you ever wondered whether you might avoid coming rain by
departing earlier or later?
Reply Nr of respondents % of respondents
Yes 36 90% No 4 10%
3) Have ever wondered whether you might avoid rainfall by changing your route?
Reply Nr of respondents % of respondents
Yes 24 60%
No 16 40%
4) Have you ever wondered if it will rain at your present location?
Reply Nr of respondents % of respondents
Yes 34 85%
No 6 15%
5) Suppose you could get a trip rainfall forecast via one the existing trip planners on the internet, how would you appreciate this service?
Reply Nr of respondents % of respondents
Like it very much 19 48% Perhaps 17 43%
Not interested 4 10%
6) How much are you willing to pay for this service (in Euro) ?
Reply Nr of respondents % of respondents
€ 1.00 0 0% € 0.50 1 3% € 0.25 1 3%
€ ‐ 38 95%

ROADIDEA 215455
121/141
7) If you have a mobile with a web browser you can install the so called geolocation
API (see http://rain.roadidea.eu/point for instructions). If your mobile has that API then you can get a rainfall prediction specific for your current position. How would you appreciate such a service?
Reply Nr of respondents % of respondents
Like it very much 8 20% Perhaps 15 38%
Not interested 17 43%
8) How much are you willing to pay for this service (in Euro) ?
Reply Nr of respondents % of respondents
€ 1.00 0 0% € 0.50 0 0% € 0.25 5 13%
€ ‐ 35 88%
9) Finally: On the website of ROADIDEA you can find a demonstration of how you can plan a trip and get a rainfall prediction for the trip. See the link at http://rain.roadidea.eu/route to try it. If you have any suggestions please fill this in below.
15 out of 40 respondents provided one or more suggestions / comments in response to question 9, half of those were positive with regard to the service and half were negative. Conclusion on user needs
1. The central question of the service is how to avoid the incoming rain by postponing or advancing your trip departure. 90% of the users are familiar with this question. So there is a user need to answer this central question.
2. Changing the planned route is considered by only 60% of the respondents, so this has a lower potential as a service
3. The service idea was well liked by 48% of respondents and ‘perhaps’ by 43%. Unfortunately it is unclear whether all respondents have actually looked at the pilot service.
4. There is almost no willingness (6%) to pay for a trip rainfall forecast service on the internet.
5. Only 20% of the respondents like the idea of a point rainfall forecast, with another 38% who like it ‘perhaps’. This low potential as a service idea could have something to do with the bicyclist audience. Interesting is that the willingness to pay was 13% for this service.
6. Overall this service idea seems to be in the category ‘nice-to-have’ and not essential. But it can of course enrich the content of a trip planning system and make it more attractive. In view of the lack of willingness to pay the service must be designed as an add-on to an existing service in order to be viable.

ROADIDEA 215455
122/141
5.6.5. Data quality The information needed to realise the service idea are:
1. Network data: As a basis for the network the free National Road Data file is used. This is provided for free by the Ministry of Public Works. For a bicycle network this dataset is incomplete. It needs a lot of editing by volunteers to add proper bicycle path information. This is currently organised by the Dutch Cyclist Union. Demis has provided InterNetter, an on-line GIS network editor. To check the completeness and accuracy of the network data there are built-in quality control procedures in InterNetter as well as active peer review by specialists from the Dutch Cyclist Union. The resulting network data quality is very high and has been tested by the Dutch Statistics Bureau as the best bicycle network data available.
2. Weather data: The rainfall forecast data are provided on a 1 by 1 km grid up to
two hours ahead by the Royal Dutch Weather Service KNMI. The KNMI operates two Doppler Radars built by Gematronik , one in De Bilt and one in Den Helder, which are used for measurement of precipitation over The Netherlands and the surrounding area. There is a fixed range-independent relation between the reflectivity value Z and the rainfall intensity R [mm/h]. The reflectivity is measured at a large distance from the Radar site (0-320 km) and at moderate altitude (0.8-3 km) above surface of the earth, and therefore discrepancies can occur between the precipitation rates as determined using the Radar and those determined by the on-ground observers. This can be caused by, for instance, evaporation or generation of precipitation just above the earth surface or by anomalous propagation of the Radar beam. From results of the radar verification, however it can be concluded that up to a distance of 150 km the KNMI Radars produce a rather good quantitative view of the precipitation above The Netherlands (http://www.knmi.nl/publications/fulltexts/holleman_ma_2007.pdf) . Further developments include using 9 foreign radar stations to allow more accuracy and the production of longer three hour forecasts as well as using Doppler radar techniques to improve the wind field used for advection in the rainfall forecast. A special radar mounted 213 meters above the earth surface is now used to measure drizzle in addition to the normal rainfall.
Figure 32: Drizzle radar in Cabauw, the Netherlands

ROADIDEA 215455
123/141
5.6.6. Functionality and technical implementation Functionality The service idea for the trip rainfall forecast has the following functionality:
1. The trip rainfall forecast will become an add-on for the existing Dutch Cyclist Union bicycle trip planner application.
2. The user plans the trip in the normal way to get a planned route. 3. For this route the user can then select a departure time and an average speed. 4. Based on this input the trip total rainfall, average and maximum rainfall intensity
is given as well as rainfall symbols / colouring for each route segment both on the topographic map and the route description.
5. By changing the departure time (and speed) the user can find the optimal departure time (this step could also be automated to suggest a departure time).
Figure 33: The pilot trip planner works similar to existing bicycle trip planners

ROADIDEA 215455
124/141
Figure 34: User can change departure time and speed to get rainfall forecast
Figure 35: Example result with rainfall, see umbrella’s and colored route segments
By implementing the service idea as part of an existing on-line trip planner the costs of providing the service idea are quite low and there is an automatic existing user base (the existing planners handle in total between 4000 and 8000 route requests per day). Technical implementation The technical implementation follows the existing Demis trip planner client server architecture.

ROADIDEA 215455
125/141
Figure 36: Trip rainfall forecast architecture
The trip rainfall forecast architecture consists of a Flash web client; an FTP site for collecting rainfall forecasts from KNMI; the Demis Open GIS Web Map Server and the InterNetter server. The InterNetter Server consists of a knowledge layer for storing and manipulating multimodal network vector and scalar data, a user manager, and a Dijkstra routing algorithm for route finding. The InterNetter Server was developed in VB.NET and ASP.NET. The Macromedia Flash 8 development environment was chosen for building the web client application user interface. When the Web browser requests the Flash file (in SWF format) via the HyperText Transfer Protocol (HTTP), it will be played on the Flash client application by the Flash player. The second step is to set up a persistent two-way communication between server and the Flash client application using the Flash Real-Time Message Protocol (RTMP). This allows an uninterrupted two-way data stream to flow between client and server. This data flow is used to send the route request information from the web client to the InterNetter. The resulting route information is send back from the InterNetter server to the web client. The addition to architecture consists of collecting the rainfall forecast data every 5 minutes from the KNMI FTP site. The InterNetter server uses the provided departure time and speed to add a route rainfall forecast to the route data sent to the web client. As can be seen in the figure above, the background topographical maps are retrieved using the OpenGIS protocol through the Demis Web Map Server (WMS). The Demis WMS is an OpenGIS certified WMS. Of course any other certified WMS can be used instead. The client-server architecture in the pilot uses the ROADIDEA website windows 2003 server. Once the pilot goes into real production the windows server(s) of the Dutch Cyclist Union will be used instead.

ROADIDEA 215455
126/141
Figure 37: The ROADIDEA on-line GIS network editor showing road type as a thematic map
5.6.7. Organizational aspects and business model The organisational aspects and business model of the trip rainfall forecast service idea builds upon the existing organisation for bicycle trip planners at the Dutch Cyclist Union (“Fietsersbond”). The Fietsersbond is the Dutch Cyclists' Union that campaigns for better cycling conditions in the Netherlands. The Fietsersbond has 33,000 members. With 130 local branches and over twenty employees at the National Office they work towards:
• well maintained, smooth and direct cycling routes • more and improved parking spaces for bikes • action against bicycle theft • more safety in traffic for cyclists
Some years ago in a member questionnaire the most important item to work on for the Dutch Cyclist Union turned out to be a good bicycle trip planner. Ever since they have been expanding their range of planners province by province and now they cover 8 out of 12 provinces. The planners are separate in name only as in reality they form one large integrated network for the Netherlands, based on the client-server trip planning software made by Demis. This integrated network allows trip planning between provinces. The main funding comes from the provincial authorities who consider this to be an important service as part of their mobility management. In Holland half of all trips of less than 5 km are made with bicycles!

ROADIDEA 215455
127/141
Private companies
Private companies
Dutch Bicyclist Union DBU Service Network
Demis D.B.U.
NWB road network
Province & stateFunding
Instruments
Top 10Topo map
KNMIRainfall
Alterra data
Money FlowData / Info Flow
DBU Web site Traveller / Road User
1
2
3
4
6 7
A
5
BDemis D.B.U. DBU Web site
Figure 38: Overview of the Dutch Cyclist Union service network
Description of principal data and information flows in the figure is as follows Data & Information Flows Number Description
1 Road network data provide by the ministry of Public Works 2 Alterra data provide network link attributes for land-use, attractivity and landscape. 3 KNMI provides real-time rainfall data and rainfall predictions 4 A topographic background map is provided by the Topographic Survey Department 5 Demis processes all delivered data in an operational planner 6 DBU does quality checks and provides volunteer input to enhance the data. The end
results is published on a web site 7 The users can use this service for free
Description of principal money flows is as follows Money flows Letter Description
A Provincial authorities are the mainstay of the planner. Some funding by Agentschap NL for innovative research has been secured in the past.
B For data processing, software development and maintenance Demis is paid a consultancy fee
Different actors and their main roles Actor Description of role
Provincial authorities Provide funding to achieve their objectives in terms of sustainable transport and “must have” public services
Agentschap NL Provides funding for innovative developments Dutch Cyclist Union (DBU)
Owner and organiser of the bicycle route planner service
Alterra Provides data for a consultancy fee Ministry of Public Works
Provides free road national network data (NWB)

ROADIDEA 215455
128/141
KNMI Provides rainfall forecast data Topograhic Survey department
Provides background topographical map
Demis Software support and development Volunteers Enhance underlying data and data quality of the service Users Use the website to obtain trip planning with rainfall prediction, for free. Basically the only addition caused by the trip rainfall forecast service idea is that rainfall forecast data needs to be linked to the existing system. In the ROADIDEA pilot the software to link this to the Demis trip planner system has already been realised and only small changes are expected for the live version of this service idea. The main costs to be considered in the business model are the cost for obtaining the rainfall forecast from KNMI or another Dutch weather provider. KNMI doesn’t normally provide this data for free, but in the meeting organised between KNMI, Dutch Cyclist Union and Demis it was hinted that a properly worded request by the Dutch Cyclist Union might actually solve this. As became apparent from the end survey there is no willingness to pay at all for this kind of service, nor for the trip planning system itself. Therefore the realisation of this service idea pretty much depends on obtaining free rainfall forecast data. The Dutch Cyclist Union plans to contact the KNMI later this year, as they are currently fully occupied with adding new provinces and special recreational and node trip planners.
5.6.8. Costs and socioeconomic impacts Costs The costs of implementing the service idea as an add-on are:
1. Development cost (changes in web client and InterNetter server software) 2. Extra yearly maintenance cost of the software 3. Yearly cost for obtaining rainfall forecasts 4. Extra yearly cost of bandwidth used due to the addition to the system
Additional development cost is quite low, estimated at around € 3000 initially and say € 300 for the extra software maintenance per year. KNMI has mentioned a cost of € 4000 per year for the weather data for the Netherlands as a whole. Costs for extra bandwidth used are estimated at € 100 Euro per year (20 Gb at 5 Euro per Gb). If we write off the initial cost in say 5 years, the annual cost of the service is in the order of € 5000. If the Dutch Cyclist Union can convince KNMI that the societal benefits are high enough, then they might be allowed free access to this data. This would lower the annual cost to € 1000 per year.

ROADIDEA 215455
129/141
Benefits As there is no willingness to pay, there will be no benefits. Also using advertisements on the site is not allowed in the Dutch Cyclist Union policy. There are societal benefits and user benefits, but these are hard to value in monetary terms. Proposed funding mechanisms From the joint meeting with KNMI and the Dutch Cyclist Union it became apparent that with free data from KNMI the service is viable and can be paid as part of the existing funding by provincial authorities of the bicycle route planners. In case the weather data are not free, it is not likely that a public funding source can be found.
5.6.9. Degree of innovation From the literature study it appears that for Europe the service idea of a trip rainfall forecast is still quite new. When the idea first surfaced in the 1st innovation seminar it was probably unique. However by now in the US a number of websites have already implemented trip weather forecasts. But these are for car transport only. This ROADIDEA service idea is that this service is most important for people more exposed to the weather, such as bicyclists, motorcyclists, pedestrians, etc. This aspect of the idea is still new and innovative. The way the service is implemented in on-line trip planners is not really innovative, even though it is implemented somewhat different compared to the existing trip forecast services in the US.
5.6.10. Discussion and conclusions Overall this service idea is deemed to be in the category ‘nice-to-have’ and not essential or highly innovative. But it can of course enrich the content of a trip planning system and make it more attractive. In view of the lack of willingness to pay the service must be designed as an add-on to an existing service in order to be viable. The service idea has benefits for road users exposed to weather such as bicyclists. If free weather data access can be secured the service is likely to become operational at the end of the year as part of the existing Dutch on-line bicycle trip planning systems. Investments are very low and yearly cost too. But the added value of the service is also limited. Preliminary contacts with Finnish and German cyclist unions have been made, and these parties have shown interest in the service idea. This is however not yet at a stage that clear exploitation is possible.
5.6.11. Major Steps Forward Research needs: For this service in itself there is no specific research need. The algorithm to calculate a route rainfall forecast based on a given route and a raster based rainfall forecast is very straightforward. However the reliability and accuracy of the rainfall forecast in itself is a research topic that will have direct implications for such a route rainfall forecast service. If the raster rainfall forecast would have uncertainty information (in terms of both the level of the rainfall and for temporal uncertainties) the service could be enhanced with uncertainty information.

ROADIDEA 215455
130/141
Technical issues: The pilot demonstrated that a route rainfall forecast service can be implemented with relatively simple means. Nevertheless for implementation of such a service on a European scale there are two major issues. First of all the required raster rainfall forecast data are not easily obtained. For example, in the course of the project preliminary discussions on creating a German pilot for this service were held, but the availibity of this data was the major problem. It is expected that this obstacle will be less in the future and then it will be easier to implement a European level service. The second issue is that the service is positioned as an add-on to existing online route planning systems. This requires that for application in other countries the appropriate route planners must be identified and contacted. In Germany for example preliminary discussions were held with the Berlin bicycle route planner BBBike. In many countries bicycle route planning is under development and not readily available as an on-line service. In those cases implementation of the route rainfall forecast would require initiation of the route planning service first. Lack of reliable network data for bicycle trips is the main obstacle here. Initiatives such as the openstreetmap.org that provide a basic bicycle network based on input of volunteers can be used for this. Gaps in the business model analysis: In the business model analysis of the service the focus was on the specific Dutch application where an excellent existing on-line bicycle route planner is available. In that situation the extra cost of the service is quite low. For other countries the cost is likely to be much higher, depending on the cost of the weather data (can be quite high as shown in WP2) and on the availability of an on-line route planner to add the route rainfall forecast service to. Based on the current user feedback a mobile (smart) phone application was not further researched in terms of an implementation plan and business model for that. However with the rapid advances in smart phone technology this will likely become an interesting opportunity within a year or so. Then the question of the appropriate service and business model will need to be worked out.

ROADIDEA 215455
131/141
6. General Conclusions and Recommendations
6.1 The Overall ROADIDEA Project Methodology
6.1.1. Assessment Activities in ROADIDEA and Objectives:
The ROADIDEA project started off with the hypothesis that new innovative ITS-based public and private mobility services in the road traffic sector can be created combining by all kinds of useful background information also using advanced data fusion methods and technological platforms. The aim was to demonstrate how innovative thinking of experts can lead into a series of improved and new service ideas which support a clean, safe and efficient mobility for people and goods. A special emphasis was put on the promoting role of innovation processes, which were related to the world of ITS services. Especially, the two Innovation Seminars in Prague (May 2008) and Dubrovnik (May 2009) were milestones in the project activities being the main trigger for pilot and idea development in the project. The project partners came together and – based on their own specific professional ITS background and having potential users in mind – they took part in plenary and focus group brainstorming sessions according to the Charrette method. Sessions were led by innovation methodology experts in order to find approaches to new ITS service ideas. The most promising ideas were developed more deeply as practical or theoretical service pilots. During pilot and idea development the ROADIDEA partners from different sectors and potential users made significant experience in the development of service concepts and technical applications. They considered data collection, data fusion, data modelling and business models. This way, the ROADIDEA partners experienced typical drivers and barriers in ITS service development. Ideas were freely discussed, allowing significant space for imagination. Some of them could be driven forward up to practical piloting, and others were abandoned or could only be developed to a certain extent having run through some iterative steps. Some ROADIDEA pilots have a clear potential for further exploitation and up-scaling/ dissemination, others still need re-thinking or further development. At the end of the project, conclusions were drawn on a ROADMAP for Innovations in European transport services. Reflecting the ROADIDEA experience, the document provides a concept how innovation can contribute to the development of ITS services taking into account the most significant European transport and ITS policy programmes and most burning problems in the European ITS service development. Assessing Retrospective Comments on the Project Methodology 1. Positioning the innovation process in the ITS Development The ROADIDEA project managed to investigate the topic of ITS service development and innovation. Especially WP4 produced a solid wrap-up of the ITS service

ROADIDEA 215455
132/141
development and the perspectives in Europe. A Roadmap was produced for innovations in European transport services which has the potential of becoming a European guideline for handling innovation in the ITS sector. In this respect ROADIDEA achieved its goal. There might be a need to discuss how the innovation process was led by WP5, so that the future idea development and pilots can better contribute to the resolution of relevant and burning problems in the European ITS development. The ROADIDEA project touched most of the relevant issues in ITS development:
• On the one hand data sources, data modelling, service concepts and business models were investigated. This was initially done on a theoretical level. Later on, the collected knowledge was also related to the pilots.
• On the other hand, innovation seminars were held which – quite independently - produced the service ideas and the pilots. There was the clear requirement that innovation should be free and without limitations in order to allow ideas to be created.
Certainly, useful experience was made and useful results were produced during pilot development, but the outcome from pilots and ideas to the overall European ITS development was limited. The ROADIDEA partners themselves experienced barriers and drivers in the development of new ITS services. The project produced solutions and approaches, but in the future the focus must be on new ITS services, which are still more significant for the European ITS development schedule. One significant problem here is the positioning of the innovation process in the overall project logic. From the point of view of innovation theory, the Innovation Seminars were very well prepared. As already said, the innovation seminars turned out to be the drivers for the development of ideas and pilots in ROADIDEA. In principle, this is acceptable. But the problem here is that the innovation seminars need stronger ITS problem-orientation. The background for a problem-oriented debate of general ITS developments (e.g. overview of existing and planned public and private services and applications, system architecture, standards, development problems, European implementation policy issues and guidelines, unresolved ITS problems) was prepared by WP4 practically in parallel and should have flown more actively flown into the innovation debate at the innovation seminars. Mostly indirectly via the expertise of seminar participants, ITS knowledge flew into the discussion, and it was hoped that participants raise good ideas. So, in the future, the content of the discussed ideas and the idea/pilot selection must be stronger and be steered by a broad knowledge on significant real ITS problems, maybe even by set ITS problems. It would have been useful to elaborate the general state-of-the art, the state-of-research, development problems in ITS before the Innovation Seminars together with the participants so that the participants can work on pre-identified significant problems which are later on turned into pilots with specific development goals if a promising ideas arise. Otherwise there will be a strong risk that produced ideas are not too radical or not concrete enough in relation to the strong everyday needs in ITS development. 2. Role and Co-operation of the Single Work Packages Having in mind the conclusion from the previous point, it might have been useful if the whole project had started off with the activities on the utilisation of advanced information for driver and traveller support services with a clear technical

ROADIDEA 215455
133/141
leadership of the respective work package 4. This would have provided the project partners with roughly the same level of background knowledge in ITS service development (e.g. a broad overview of public and private services and applications, state-of-research, system architecture, standards, development problems, European implementation policy issues and guidelines, plans, directives, unresolved ITS problems). It is not evident that all the project partners (potential innovators) were on the same broad level of ITS expertise in the beginning. These activities could have delivered the overall framework and context of the ITS development. It actually partly did this in ROADIDEA, but the project results would have probably been more effective if ITS background knowledge had been systematically fed into the innovation process from the beginning with the aim to provide problem-awareness, technical guidance on ITS services and more ITS-related background for innovators. Other technical work packages on data sources, data modelling and business models could have then more intensely followed the general background of service development and more intentionally support the idea and pilot development with their specific expertise.
6.1.2. Conclusions and Recommendations ROADIDEA has suggested an interesting form of promoting progress in ITS development. The combination of innovation techniques and strong ITS background can lead to supporting effects and problems solving in the ITS development. This idea should be picked up by an ITS Innovation Task Force at the European level. But the following lessons have been learnt:
• Innovation Work must be based on a broad ITS knowledge of the involved experts. Therefore, future Innovation Seminars must get strong input on the state-of-play in ITS services, namely:
o information on all ITS services (running, planned, in research) o information on ITS significant development problems o information on policies and priorities o access to research of the ITS industry o an understanding of user requirements
• Future Innovation Seminars should be more ITS problem-oriented in order to produce significant solutions to problems.
• The additional involvement of ITS user group representatives and experts from related fields of expertise in the Innovation Seminars will be useful to bring in other patterns of thinking and new ideas, but it must be made sure that ITS experts with the above mentioned are deeply involved and in the discussions and the idea development in order to efficiently produce relevant new approaches. Guidance and monitoring by ITS experts is important.
• Activities on data source research, data modelling and business models should be more aiming at promoting pilot and idea development.
Piloting is a good means to drive problem-solving forward and to gain significant experience. In the future, the selection of pilots should not only be done based on the maturity of the idea but also based on the significance for European ITS development (Will the solution remove significant barriers for deployment?).

ROADIDEA 215455
134/141
6.2 Retrospect Analysis of the Innovation Process In the ROADIDEA Validation and Evaluation Plan (D8.1), a diagram was introduced by WP8 which was aiming at the illustrating the subject of innovation work in the field of ITS (see figure below). The purpose was to locate the target and to create an awareness of the ambition of the ROADIDEA innovation work. This was also important for the assessment of the generated ideas and pilots.
Figure 6.1: Positioning of the ROADIDEA Innovation Work The inner circles of the diagram in yellow show the basis of the innovation work which should be known to innovators, i.e. the ITS systems which are already in everyday operation representing the state-of-the-art. An example here is turn-by-turn navigation. Innovators have to be aware of the global picture there in order to know the available applications as well as their limitations and problems as a basis for new thinking. This will also make sure that they discuss problems, which are already resolved. The next circle shows the world of current research. Good ITS examples here are co-operative systems or automatic driving. The innovators need to know this as well as far as possible in order to build on already ongoing activities and identified problems. This is not always easy because not all ideas are accessible and published. But the requirement here is to have a very good insight in ongoing ITS research. The outer circle shows more radical visions, which are not yet subject to ongoing research activities. Innovators have to maintain the perspective of future possibilities and challenges as well. The arrow symbolises the ROADIDEA roadmap. The roadmap illustrates how ITS development will run, taking into account innovations starting from everyday solutions, taking into account ongoing research and ending up with visions for the future. The ambition for the ROADIDEA pilots is that they are located somewhere at the borderline
Useful Visions
Current Research
LeadingState-of-the-Art
Everydayoperation
Our Roadmap
Innovation
Our Pilots Our Pilots
Useful Visions
Current Research
LeadingState-of-the-Art
Everydayoperation
Our Roadmap
Innovation
Our Pilots Our Pilots

ROADIDEA 215455
135/141
between current research and useful visions. On the one hand they had to deal with a significant unresolved problem, on the other hand they could not be too visionary and because results had to be visible during the project. The three practical pilots which where successfully shown in ROADIDEA (Pulp Friction. Rainfall Warning, Fog Warning) are certainly located at the expected position in the diagram. They all could demonstrate a new functional element, which did not yet exist before. In their specific application domains, they certainly represent a successful new solution. The Gothenburg pilot has still potential to become an innovative solution if a new concept is followed in a new iteration. Problem in ROADIDEA was that appropriate data was not available to implement a working pilot, and partners in charge did not have any resources for piloting in the work plan. The Hamburg pilot is a very visionary approach, which is located in the sector of “useful visions”. It met a number of significant problems because the preconditions for a successful implementation do not exist today and could not be created during the project. However, the idea is valid and could become an element of the traffic management in the Port of Hamburg in the future. The ideas resulting from the ROADIDEA Innovation Seminars have in most cases not yet the status of being applications, which can be implemented. They are approaches which need further developing. Certainly some of them will be dropped, and others would modify and change the focus as they develop further. Others, especially those from the second Innovation Seminar are very visionary and need more thinking. In the following some assessing remarks on the Innovation Seminars are provided. Preparation of the Innovation Seminars: The preparation of the Innovation Seminars was excellent from the point of view of the innovation methodology. Good materials were prepared on how the innovation process should run. There was a solid concept and programme for the seminars themselves. Therefore, the seminars as such have been led with a strong and visible concept. The weak point about the preparation was that more knowledge about ITS and significant problems to be resolved would have been necessary so that a problem-orientation can be brought into the debate from the beginning. The preparation for this would need to come from ITS experts. Should innovation seminars on ITS take place in the future, it must be obligatory that ITS information is provided to a larger part of innovators before the seminar or that set problems are discussed so that these basics definitely can flow into the innovation process in a problem-oriented way. Participants of the Seminars: The proposed programme was adopted by the participants, and they very actively contributed during the seminars. The participants came mainly from the project consortium itself. The result of the seminars was very much depending of the ITS knowledge of the participant, their specific problem awareness as well as their willingness or ability to communicate problems and approaches. To the second innovation seminar, external ITS experts were invited in order to bring in more discussion on relevant developments in ITS. They brought their specific knowledge with them. The participant mix consisted mainly of road weather and traffic specialists. It was obvious that the bulk of discussed ideas were related to weather phenomena as

ROADIDEA 215455
136/141
many participants came from this area of expertise. Ideas from other ITS areas (e.g. public transport, freight transport) were rare. This shows that content of generated ideas very much depends on the background and the preparation of the invited people. The problems and ideas to be discussed were raised by the participants as problem owners. Participants also raised ideas, which were not too much covered by their own expertise and their own ability to drive the ideas forward. These ideas had hardly a chance to become mature during the project. Some industry partners were involved. But, it would have been desirable to involve more participants from ITS industry research. Idea Generation: There was the set demand that the innovation debate should be free, and any idea should be allowed to be discussed. But – as discussed earlier – it would have been desirable if the debates had been guided by senior ITS experts and if problem-oriented knowledge had flown into the debate during the seminar. In this case the discussions would have been more specific, and maybe more concrete ideas would have been generated. The ideas from the first seminar were generally speaking not too radical. Naturally, the ideas were near their field of expertise of the participants. The most mature ideas were naturally those, which had already in the mind of some participants as specific problems. The ideas from the second seminar were more radical but remained somewhat global. The discussion of general societal development scenarios maybe distracted the participants too much from discussing problems of ITS development. This also calls for a better problem-orientation in future innovation seminars. It remains an open question whether ideas with a real commercial potential will openly discussed at seminars if they reveal a clear potential for business. Business interests may be a barrier to these kinds of open discussions. Innovators may want to keep their ideas a secret. So the field of Intellectual Property Rights must be borne in mind during idea generation. Idea Ranking/ Selection Process: The seminar participants had the chance to weigh (giving hearts and basketing) the proposed ideas. This way they significantly influenced the selection of ideas for further development after the seminar. The result very much depends on the personal preferences, understanding and experiences of participants. It would probably be more effective if the selection and ranking of ideas had been done by an independent panel of experienced senior ITS experts having the state-of-the-art and the political priorities of ITS development in mind as the decisive selection criteria. Idea Development after the Seminar: The generated ideas were developed further after the innovation seminar by idea teams. The concepts were iterated in the Idea-Wikis on the ROADIDEA website. The following tendencies could be observed: Those ideas have progressed best for which the idea teams had their own background. A barrier showed up if the support external partners outside ROADIDEA would have been necessary.

ROADIDEA 215455
137/141
Ideas for innovation seminars are mostly not mature immediately after the seminar. The innovation procedure must consider that ideas will have their live in which the ideas
• run through several iterations until maturity • the idea is merged with other ideas because of similarity or because it its into a
larger context • will be abandoned if
o the innovative element is not confirmed in the course of the development o the application is not feasible due to technical or non-technical reasons
Generally, more incentives need to be given to idea development after the seminar (for example by reserving budget for idea development, awards for good progress). Maybe it would be an idea for future innovation activities to define and launch complete sub-projects (with partners, budget, milestones, deliverables etc.) for idea development and piloting. These sub-projects could be realised by ROADIDEA partners, and they would be open to new partners, if those are necessary for idea development. Thus the project budget should contain a specific “piloting funds”, and the consortium could decide on its use according to the innovation results. This would have removed e.g. the problem with the Gothenburg pilot, in which the partners in question did not have any resources for piloting in the original project plan. Relationship between innovation seminars and pilots: Similar to the selection of ideas, the ideas for the ROADIDEA pilots were selected at the first Innovation Seminar in Prague. The following criteria were important for the selection:
• Could the (pilot) idea describe a real problem to be resolved? • Does the solution represent an innovation? • Was the idea description mature enough to build an application? • Did the (pilot) idea result form considerations of data fusion and/or data
modelling? Other factors, which certainly influenced the decision were:
• Which type of expertise was available in the ROADIDEA Consortium? • Are there ROADIDEA partners who can plan and implement the pilot during the
project? (or who can plan the theoretical pilot)? For the selection of pilots in the future the following criteria should play role as well:
• How significant is the added value of the pilot in the European ITS policy context? • Does the pilot have a potential for a pan-European service?
6.3 Opportunities for Future Development
The Roadmap developed by ROADIDEA can become a solid programme for the regular introduction of innovation procedures, which promote the development of European ITS and the resolution of associated implementation problems. The project has produced useful background material and a valid description of the potential for the ITS development in the future. If these results are maintained and developed there will be a solid basis for influencing ITS-related innovation processes in the future. However, it will be important that the future innovation process is strictly built on this knowledge and identified problems. This can only be done if innovation experts and ITS experts closely co-operate.

ROADIDEA 215455
138/141
The establishment of an ITS Innovation Taskforce was suggested. This taskforce should have following objectives:
• to maintain a broad overview of ITS services which exist and which are subject to ongoing research activities (including service ideas, business concepts, data sources, data models, standards etc.)
• to observe the major trends in the development of technologies in order to identify the opportunities and challenges of the future (the look ahead). The involvement of the industry (information technology, communications, automotive, transport), authorities and research organisations would be important here.
• to hold regular Innovation Seminars in order to promote ideas to identify European pilot projects which create services with pan-European relevance. The work of this task force could also influence research programmes of the EC.
• to accompany and monitor the initiated pilot projects. The service platform in ROADIDEA was limited with respect to functionality and geography. Not all pilots run on the platform. However, the idea of data mediation is currently a trend in several countries (e.g. Mobilitätsdatenmarktplatz MDM - Germany), and the pre-conditions for a European transport data platform are already being created. So, it could be a solution to disseminate the successful ROADIDEA pilots to a European data platform which still needs to be established. This, however, must be a pan-European effort with the involvement of the European user community. The operator of the platform should support the idea of a European service provider with the real ambition to support pan-European services, i.e. have a pan-European business concept, cover Europe-wide applications and seek co-operations with other data marketplaces for data mediation which arise in Europe. The ambition must be to cover enable the functions, the service concept on the geographic scale of Europe. Furthermore, it must be borne in mind that the functionality for a specific service not only means data mediation but also in cases quite complex modelling and IT operations related to the application itself. The European platform must foresee specific co-operations for this if the functions are not located on the platform itself. The three practical pilots in ROADIDEA have already demonstrated their viability. Pulp Friction is ready to be used by the Finnish Meteorological Institute. The Fog Warning can be used by ARPAV, and the Rainfall Warning can be operated by Demis. The challenge here is now to arrange everyday operation according to the ROADIDEA exploitation plan. There is certainly also the potential to disseminate the applications to other European areas and users. The Fog Warning pilot made more progress in the project than expected. It was planned to be a “theoretical pilot”, but it became the valid implementation based on the invested resources and the motivation of ROADIDEA partners. The Hamburg Port pilot proved to be an interesting idea which, however, could not be finalised in the project because of the complexity of the topic, the temporary lack of technical preconditions at the site and the limited user community within ROADIDEA. A separate new research project could be a perspective. The Gothenburg pilot needs to be re-thought. The concept of predicting the road traffic situations depending on weather forecasts will most likely be of value. The challenge here is to integrate the theoretical idea with the right local user environment in Gothenburg and to test a new service concept together with the local users (e.g. the SNA).

ROADIDEA 215455
139/141
References 4 Results of the platform
Dölger, R. 2009, Usage, benefits and prospects of DATEX II for European road authorities, Proceedings of the 16th World Congress and Exhibition on Intelligent Transport Systems and Services, 21-25 September 2009, Stockholm, Sweden
Info24 AB. 2009, Info24 Marketplace web site https://www.info24marketplace.com/v1/ (accessed 20th November 2009)
Lindqvist, H., J. Kiuru, J. Parikka, A. Vilkman, D. Jankó and F. Zardini, 2009, D6.1 Pilot Specifications, ROADIDEA Deliverable D6.1
Sabel, B. and A. Peterson, 2009, Marketplace for Traffic Information – Information Broker www.ITS-exchange, Proceedings of the 16th World Congress and Exhibition on Intelligent Transport Systems and Services, 21-25 September 2009, Stockholm, Sweden
Sundberg, J. 2009, The use of data warehouses and information brokers in cross-border ITS, Proceedings of the 16th World Congress and Exhibition on Intelligent Transport Systems and Services, 21-25 September 2009, Stockholm, Sweden
Wang, Y.-H. and J. C. Liao, 2009, Why Or Why Not Service Oriented Architecture, Proceedings of the 2009 IITA International Conference on Services Science, Management and Engineering, 11-12 July 2009, Zhangjiajie, China http://ieeexplore.ieee.org/stamp/stamp.jsp?tp=&arnumber=5233345&isnumber=5233202 (accessed 24th November 2009) 5.2 Pulp Friction pilot
Andreescu Mircea-Paul, Frost David B, 1998: Weather and traffic accidents in Montreal Canada. Clim. Res. 9, 225-230.
COST Office, 2008: New Developments for Winter Service on European Roads – Final Report COST Action 353. April, 2008.
Haavasoja Taisto, Pilli-Sihvola Yrjö, 2010: Friction as a Measure of Slippery Road Surfaces. SIRWEC proceedings, 15th International Road Weather Conference, Quebec, Canada.
Online at: http://www.sirwec.org/conferences/Quebec/full_paper/11_sirwec_2010_paper_haavasoja.pdf
Hogan, Robin J., O’Connor, Ewan J. and Illingworth, Anthony, J., 2009: Verification of cloud-fraction forecasts (Q. J. R. Meteorol. Soc.). Online at: www.interscience.wiley.com DOI: 10.1002/qj.481
Jolliffe, Ian T. and Stephenson, David B., 2003 (Editors): Forecast Verification: A Practitioner's Guide in Atmospheric Science (Wiley).
Nurmi, Pertti, 2003: Recommendations on the verification of local weather forecasts (ECMWF TM430). Online at: http://www.ecmwf.int/publications/library/ecpublications/_pdf/tm/401-500/tm430.pdf

ROADIDEA 215455
140/141
Sihvola Niina, Rämä Pirkko, Juga Ilkka, 2008: Liikennesäätiedotuksen toteutuminen ja arviointi 2004-2007 ja yhteenveto 1997-2007. Tiehallinnon selvityksiä 15/2008. Tiehallinto. (In Finnish, abstract in English)
Wallman Carl-Gustav, Åström Henrik, 2001: Friction measurement methods and the correlation between road friction and traffic safety. A literature review. VTI Meddelande 911A. Online at: http://www.transportforum.se/EPiBrowser/Publikationer%20-%20English/M911A.pdf
Wilks, D.S., 2006: Statistical Methods in the Atmospheric Sciences (Chapter 7) (Elsevier)
Forecast verification website of the WMO JWGFVR: http://www.cawcr.gov.au/projects/verification/
5.4 Fog warning pilot
QUANTIS. 2010. QUANTIS (Quality assessment and assurance methodology for traffic data and information services) web site. http://www.quantis-project.eu [accessed 9th February 2010].
ISO. 2008. Intelligent transport systems – Integrated transport information, management and control – Data quality in ITS systems. ISO Technical Report ISO/TR 21707:2008. International Standardization Organization, Geneva, Switzerland.
Öörni, R., Kulmala, R., Newton, D., Scheider, T. and Kellermann, A. 2009. Definition of Key European ITS Services and Data Types. QUANTIS Deliverable D1. http://www.quantis-project.eu/2009-11-19_QUANTIS_D1_final.pdf [accessed 9th February 2010]
Hollo, Peter. Automated Driver Information Systems and Traffic Detectors: the Stat-of-the-art and Evaluation Results. Unpublished technical memo. July 2009.
Dubbert, J, Hautala, R, Leviäkangas, P, Öörni, R, Nurmi, P, Hippi, M, Juga, I, Rossa, A, Hollo, P, Markovic, D, Wigan, M, Saarikivi, P, Vilkman, A, and Müller, S, D8.2 Final Validation and Evaluation Plan, Roadidea project deliverable, 20 August 2009. Restricted availability.
Hautala, Raine & Leviäkangas, Pekka (Eds.). Ilmatieteen laitoksen palveluiden vaikuttavuus. Hyötyjen arviointi ja arvottaminen eri hyödyntäjä-toimialoilla [Effectiveness of Finnish Meteorological Institute (FMI) services]. Espoo 2007. VTT Publications 665. 205 p. + app. 73 p.
5.5 Hamburg Port pilot
Eggers, E. (DAKOSY AG, DBH, HHLA, LHG, ECL, TRADAV, ISL BC); Förderinitiative ISETEC II, Projektskizze BIT “Business Integrated Truck”
Gladiator, D. (DAKOSY AG), IMP Import Message Platform

ROADIDEA 215455
141/141
Annexes List of Annexes Annex 1 AINO worksheets (for Pulp Friction, Gothenburg and Hamburg Port) Annex 2 Questionnaire INNOVATION ASPECTS Annex 3 Questionnaire SERVICE CONCEPT Annex 4 Evaluation report from Pekka Kumpula Annex 5 Questionnaire PROCESS EVALUATION Annex 6 Literature review for the Fog Warning Systems (by RODS) Annex 7 Cross validation of the fog pilot products (by ARPAV)

ITS service assessment sheet page 1/4NAME OF PROJECT/SERVICEASSESSMENT INFORMATION
EU-ROADIDEA pilot Pulp Friction
SERVICE DESCRIPTIONBACKRGOUND AND OBJECTIVES SERVICE CONTENT AND DISSEMINATION CHANNELS
SERVICE PROVISION CONCEPT COSTS, RESOURCE NEEDS AND FINANCING
POTENTIAL MARKET AND USERS RELATIONSHIPS TO OTHER ACTIVITIES
- What is the user need behind the service and the problem to be solvedwith the service?* Information about road conditions (friction).
- What is the development trend and severity of the backgroundproblem (e.g. the current and future number of accidents, incidents ordelays, and their effect on the society)?
- What are the objectives of the service?*To collect friction data to analyze the road conditions (normal, bad andvery bad conditions). Data from optical sensors, acustic methods etc.,
- What kind of information or control does the service produce?*Information about road conditions, warnings about slipperiness.
- Via which channels can users access the service?*Radio, web, mobile, car to car etc.
- Can the service be tailored to fit user's needs?*Possibly by service providers.
- How will the service content and dissemination channels changewhen new technology solutions are developed and taken into use?*More and more real-time and high resolution data.
- What investments, annual maintenance and operational costs as wellas fees does the service require in total and from the public sector as apurchaser/supporter?
-Who are the primary investors?
-What is the price of or cost associated with the data needed?
- What actors/organisations finance the service and in which mannerand proportions?
- What is the potential for wider commercial exploitation of the service?
- How is the service to be marketed or promoted, and have themarketing costs been considered in the calculations?
- How is service provision organised? Who hosts the service? Whodistributes it?- Which are the responsibilities of the organisations involved?- How are the service ownership and host issues solved?- How are the maintenance and liability issues solved?- Upon which data bases and technology solutions are the serviceprovision and user access built?
- how is the data processed further to information and service?*Road condition analysis based on friction (and RWIS) data. Real-timewarnings.
- what is the availability of source data?*At least RWIS data available from the Finnish Road admisistration. FMIcan provide weather data for the pilot (observations and model runs).
- what is the quality of primarysource data?
- Who are the potential primary customers of the service?*Different service providers and end users (drivers and roadmaintenance personnel)
-How large, concentrated or diversified these customers are?*The potential is large.
- Which is the estimated number of persons, companies ortransportations using the service (e.g. estimated number of servicesubscribers) and how is the estimate calculated?
- Description of how the service can possibly be related to otherservices (integrated services, service packets) ?
- Does the service enable new or more efficient operations, and what isthe economic significance of such operations?*More efficient winter maintenance activies, improved safety.
Päivämäärä Arvioijan nimi ja organisaatio Arviointivaihe19.8.2008 Name and affiliation of evaluator Assessment phase

ITS service assessment sheet page 2/4NAME OF PROJECT/SERVICEASSESSMENT INFORMATION
SERVICE IMPACT ASSESSMENT PLAN
IMPACTS ON SPECIAL GROUPSIMPACTS ON SAFETY, ENVIRONMENT AND COMMUNITYSTRUCTURE
IMPACTS ON TRANSPORT SYSTEM DEVELOPMENT ANDMANAGEMENT, OTHER IMPACTS?
DESCRIPTION OF IMPACT INFORMATION
EU-ROADIDEA pilot Pulp Friction
IMPACTS ON TRAVEL IMPACTS ON TRANSPORT SYSTEM EFFICIENCY
- How does the service affect the number, time and modal choice ofjourneys and their costs?*The service can reduce travelling by car during very bad roadconditions.
-Does the service reduce need of travel?
- How does the service affect route choices, journey times,congestion and traffic flow?
- How does the service affect incident occurrence, incident impactsand possibilities for incident management?*One main idea of the system is to prevent accidents by real-timewarnings.
- How does the service affect the travel and other possibilities ofspecific user groups, such as the elderly and disabled?
- How does the service affect the business possibilities and welfare ofsome types of enterprises?
- How does the service affect e.g. the needs to build and improvetransport infrastructure?
- How does the service affect transport infrastructure maintenanceand operational costs?
- How does the service affect public transport operational costs?
- What other impacts does the service have (e.g. health)?*Less traffic accidents.
- How does the service affect traffic safety, security, environment,climate change, landscape, cityscape and community structure?*Improved safety on the roads.
-Does the service have any impacts on gender, age or other socialissues?
- How can the impacts of the service be studied and monitored (e.g.user acceptance and user interfaces)?*By questioning
- What assessment methods can and will be applied (e.g. usertests, questionnaires)?
Päivämäärä Arvioijan nimi ja organisaatio ArviointivaiheDate Name and affiliation of evaluator Assessment phase

ITS service assessment sheet page 3/4NAME OF PROJECT/SERVICEASSESSMENT INFORMATION
EU-ROADIDEA pilot Pulp Friction
Promotion of standardised and generic solutions
Other, specify?Development and piloting of innovative solutions
Improved service provision prerequisites and tenderingImproved logistic chains and deliveries
Prer
equi
sitiv
es fo
rbu
sine
sses
Serv
ice
leve
l and
perf
orm
ance
of
trans
port
syst
em
Cos
ts o
f tra
nspo
rtsy
stem
OPPORTUNITIES AND THREATS
Traf
fic sa
fety
Oth
er, s
peci
fy?
Target of impacts
SERVICE ASSESSMENTTECHNICAL PERFORMANCE AND QUALITY ASSURANCE
Change in transport infrastructure or vehicle fleet investmentsImproved public transport incident management or route choice
More efficient public transport operation
USEFULNESS, INNOVATION AND ECONOMIC EFFICIENCY
ACCESSIBILITY AND USER CENTERED DESIGN
IMPACT MECHANISMS AND TARGETS
Promotion of non-motorised transports
More efficient use of transport infrastructure
Improved dirver and vehicle supportMore efficient transport network incident management
- What new or more efficient operations does the service enable?*More efficient and focused road maintenance activities.- What relevant information does the service produce?- What is the added value or operations due to the service?- What are the innovative aspects in service provision?*Friction is a new output.- Are there experiences from similar services or technologyapplications from elsewhere?- How does the service cater for fulfilment of transport or other policyobjectives?- Which are the social benefits that can be expressed in monetaryterms in relation to investment and maintenance costs (if estimationis possible)?- Which are the total costs and fees for the ervice life cycle againstthe number of user groups, users or use occasions?- Which are the prerequisites for the business profitability of theservice? Sensitivity to central assumptions made?
- How reliably does the service functions (as estimated ormeasured)?*The reliability of friction data is not yet known precisely but it isstudied and different observation methods are compared.
- Correctness of the information provided by the service (asestimated or studied)?
- How is the quality of the service ensured and/or monitored?*The service is verified against available information aboutobserved road condition.
- How is user needs and feedback utilised in the furtherdevelopment of the service?*Possibly the feedback is collected from some test users.
- Do similar services exist elsewhere? How many users exists forcompeting services?- Is service financing settled and clear?- Is the service compatible to existing system architectures(standard solutions, open interfaces, generic platforms, etc.)- Is service hosting (maintenance, development) settled?- Have the key organisations in the service value network beenidentified and involved?- Have legal issues (privacy, data security, etc.) been solved? Arenew or modified regulations required?- Can the service be organised via competitive tendering?- Can the service be extended with regard to content or usergroups (service integration, e.g. with tourism, entertainment)?- Can the service be expanded and exported (markets,competition, business opportunities)?- What threats exist with regard to service comprehensibility,adaptability and usability?- Whic is the required hardware (e.g. terminals), how many existtoday, what is their price, future trends? Possibility of newcompeting technologies?- Is the communication solution restricting use (e.g. number ofusers at same time, many different terminals at same time)?
- How many users can use the service?*The information can be used in many ways (by road maintenancepersonnel, service providers and drivers)
- What is the estimated number of users of service?- Is the user interfaces unambigous, clear and comprehensible? Hasthe HMI been tested?
- Does the use require special skills, investments or actions?
- How have user requirements been considered in design of humanmachine interaction? Has use context been considered (in vehicle/athome/etc.)?
- Have the needs of special groups been considered?
- Has the users' willingness to pay been investigated or tested?
- Are there user instructions and support services?
Impa
ct m
echa
nim
sPäivämäärä Arvioijan nimi ja organisaatio ArviointivaiheDate Name and affiliation of evaluator Assessment phase

ITS service assessment sheet page 4/4NAME OF PROJECT/SERVICEASSESSMENT INFORMATION
PRINCIPLE SCHEME OF SERVICE OR MAP SUMMARY OF SERVICE DESCRIPTION
COSTS AND PRICE OF SERVICE SUMMARY OF PRIMARY IMPACTS (to be filled for appropriate parts, specified in sheet 1)
Costs for planning and specification €Investment costs €Technical maintenance costs €/yearOperational costs €/yearService pilot price / month €Actual service price €/monthPublic sector funding support €Public sector personnel resources required person-month/y
COST-EFFICIENCY OF SERVICEPotential service usersNumber of service usersCosts/price for tilaaja over whole service life cycle
(life cycle length is assumed as 5 years)€/y
SERVICE PRODUCTION MODEL
Financers of service
SUMMARY OF SERVICE ASSESSMENT
EU-ROADIDEA pilot Pulp Friction
SERVICE OVERVIEW
ADDITIONAL INFORMATION
€/user
Overview of production model
Providers of user service
Actors / organisationsinvolved in planning
The main purpose of the pilot is to look for a closer relationshipbetween weather and road condition/friction. Also road weathermodelling is developed so, that friction is included in the model(s).Friction data is collected from automatic measurements (for exampleoptical sensors and acustic data). This will give an analysis of the stateof the roads. The information can be used by road maintenancepersonnel, service providers and drivers as end users.
- For instance, estimated benefit/cost ratio, multiple criteria analysis(MCA) or rating for comparison of different projects
Improved safety on the roads. More focused road maintenanceactivities.
- Contact information for additional information on assessment
- Essential literature references
Date Name and affiliation of evaluator Assessment phase

ITS service assessment sheet
OTHER ADDITIONAL INFORMATION
ADDITIONAL INFORMATION
PERSONS INVOLVED IN ASSESSMENT
LITERATURE AND REFERENCES
ADDITIONAL INFORMATION TO CALCULATIONS AND ASSESSMENTS
- Names, affiliations, organisation, phone numbers and e-mail addresses.
FMI:Marjo Hippi, FMI, [email protected] Juga, FMI, [email protected] Nurmi, FMI, [email protected]
All literature and other material used in evaluation in such a form that they can be obtained on the basis of theinformation given.
Additional or background information, calculations etc. behind the information given in sheets 1-4, preferablyspecifying the sheet and calculation/estimate referred to.
All other additional information related to the assessment such as, e.g.; reason for assessment, context withinwhich made, inspectors/verifiers of assessment

ITS service assessment sheet page 1/4NAME OF PROJECT/SERVICEASSESSMENT INFORMATION
ROADIDEA Gothenburg pilot
SERVICE DESCRIPTIONBACKRGOUND AND OBJECTIVES SERVICE CONTENT AND DISSEMINATION CHANNELS
SERVICE PROVISION CONCEPT COSTS, RESOURCE NEEDS AND FINANCING
POTENTIAL MARKET AND USERS RELATIONSHIPS TO OTHER ACTIVITIES
- What is the user need behind the service and the problem to be solvedwith the service?- The basic user need behind the service is the need for more accuratetraffic information before and during the trip. The major problem to besolved with the service is congestion and congestion related problems inthe cities.
- What is the development trend and severity of the backgroundproblem (e.g. the current and future number of accidents, incidents ordelays, and their effect on the society)?- The volumes of traffic have been growing steadily in the Western cities(although the growth rate has slowed down during the last years).Because increasing the physical capacity of roads is possible only up toa certain point, more traffic eventually means more severe traffic jams.The problems related to congestion are various, e.g. pollution, trafficsafety problems and waste of time.
- What are the objectives of the service?- The main objective of the service is to get more accurate trafficforecasts and to develop a solution to share this information to the endusers.
- What kind of information or control does the service produce?- The service provides information about the current and future trafficsituation (traffic flow, road weather).
- Via which channels can users access the service?- Users can access the service via mobile phone or internet.
- Can the service be tailored to fit user's needs?- The service can, to some extent, be tailored to fit user’s needs.
- How will the service content and dissemination channels changewhen new technology solutions are developed and taken into use?-
- What investments, annual maintenance and operational costs as wellas fees does the service require in total and from the public sector as apurchaser/supporter?- The service requires investment costs (establishment of the service,server costs, developing costs of user interface), annual maintenancecosts and some operational costs- The source data is provided by a public sector actor (Vägverket). Thatdata is used in several services and purposes and would be collectedanyway and so the service does not cause any new costs for publicsector actors.
-Who are the primary investors?
-What is the price of or cost associated with the data needed?- Vägverket provides traffic and weather data free of charge for the pilotuse. In the future, if the service is commercialised, the situation maychange.
- What actors/organisations finance the service and in which mannerand proportions?
- What is the potential for wider commercial exploitation of the service?The potential for wider commercial exploitation of the service is quite
- How is service provision organised? Who hosts the service? Whodistributes it?- In the pilot phase Destia will host the service and Lociga is responsibleof the end user interface.
- Which are the responsibilities of the organisations involved?- See the previous answer.
- How are the service ownership and host issues solved?-
- How are the maintenance and liability issues solved?
- Upon which data bases and technology solutions are the serviceprovision and user access built?
- how is the data processed further to information and service?
- what is the availability of source data?- Source data (traffic flow and road weather data)are available viaVägverket (i.e. Swedish Road Administration)
- Who are the potential primary customers of the service?- The primary target customer group of the service consist of road usersand traffic information service providers. Other potential customers areroad managers and local authorities
-How large, concentrated or diversified these customers are?- Since the primary target customer group consists of road users, it isnaturally a very large and diversified group. However, the service isdirected mainly to private car users so children and people withoutdriver’s licence probably do not benefit directly from the service. Theymay get indirect benefits though through e.g. smoother public transport.
- Which is the estimated number of persons, companies ortransportations using the service (e.g. estimated number of servicesubscribers) and how is the estimate calculated?- In the pilot phase the number of service users is very limited.
- Description of how the service can possibly be related to otherservices (integrated services, service packets)?- The service can very easily be integrated to other services, e.g. togeneral traffic/travel information portals.
- Does the service enable new or more efficient operations, and what isthe economic significance of such operations?- The aim of the service is to reduce problems related to congestion. Ifthis objective is realized the service will generate also economicalbenefits.
Päivämäärä Arvioijan nimi ja organisaatio Arviointivaihe31.03.2009 Armi Vilkman & Hanne Lindqvist, Destia Assessment phase

ITS service assessment sheet page 2/4NAME OF PROJECT/SERVICEASSESSMENT INFORMATION
SERVICE IMPACT ASSESSMENT PLAN
IMPACTS ON SPECIAL GROUPSIMPACTS ON SAFETY, ENVIRONMENT AND COMMUNITYSTRUCTURE
IMPACTS ON TRANSPORT SYSTEM DEVELOPMENT ANDMANAGEMENT, OTHER IMPACTS?
DESCRIPTION OF IMPACT INFORMATION
ROADIDEA Gothenburg pilot
IMPACTS ON TRAVEL IMPACTS ON TRANSPORT SYSTEM EFFICIENCY
- How does the service affect the number, time and modal choice ofjourneys and their costs?- The service will reduce the duration of journeys because it willreduce congestion. Also the costs caused by traffic andtransportation will be smaller if the congestion problem can bediminished.
-Does the service reduce need of travel?-The service does probably not reduce the need of travel itself but itwill reduce the time spent for travelling.
- How does the service affect route choices, journey times,congestion and traffic flow?- The main objectives of the service are to reduce congestion, maketraffic flow and travelling smoother and shorten journey times.
- How does the service affect incident occurrence, incident impactsand possibilities for incident management?- The service includes information about occurred incidents. Thatwill make incident management as well as incident preventioneasier.
- How does the service affect the travel and other possibilities ofspecific user groups, such as the elderly and disabled?
- How does the service affect the business possibilities and welfare ofsome types of enterprises?- The service may offer new business possibilities to enterprises thatare specialised in areas like end-user service development and datamanagement.
How does the service affect e.g. the needs to build and improvetransport infrastructure?- The service can help to reduce the need to build new transportinfrastructure.
- How does the service affect transport infrastructure maintenanceand operational costs?The service can help to direct the transport infrastructuremaintenance and operational resources to the most essential issues.
- How does the service affect public transport operational costs?
- What other impacts does the service have (e.g. health)?
- How does the service affect traffic safety, security, environment,climate change, landscape, cityscape and community structure?- The service aims to reduce congestion which will improve trafficsafety (because of smoother traffic) and reduce the amount ofemissions.
-Does the service have any impacts on gender, age or other socialissues?
- How can the impacts of the service be studied and monitored (e.g.user acceptance and user interfaces)?- The service will be available for users via mobile phone andinternet. User acceptance can be tested via normal user testprocedures. In the pilot phase it is likely that the amount of userswill be quite limited so tests will focus more on the technicalfunctioning of the service.
- What assessment methods can and will be applied (e.g. usertests, questionnaires)?- Details of user tests will be decided later on.
Päivämäärä Arvioijan nimi ja organisaatio Arviointivaihe31.03.2009 Armi Vilkman & Hanne Lindqvist, Destia Assessment phase

ITS service assessment sheet page 3/4NAME OF PROJECT/SERVICEASSESSMENT INFORMATION
x xx x x
x xx x x xx x x x
xx x
x x x x
ROADIDEA Gothenburg pilot
Promotion of standardised and generic solutions
Other, specify?Development and piloting of innovative solutions
Improved service provision prerequisites and tenderingImproved logistic chains and deliveries
Prer
equi
sitiv
es fo
rbu
sine
sses
Serv
ice
leve
l and
perf
orm
ance
of
trans
port
syst
em
Cos
ts o
f tra
nspo
rtsy
stem
OPPORTUNITIES AND THREATS
Traf
fic sa
fety
Oth
er, s
peci
fy?
Target of impacts
SERVICE ASSESSMENTTECHNICAL PERFORMANCE AND QUALITY ASSURANCE
Change in transport infrastructure or vehicle fleet investmentsImproved public transport incident management or route choice
More efficient public transport operation
USEFULNESS, INNOVATION AND ECONOMIC EFFICIENCY
ACCESSIBILITY AND USER CENTERED DESIGN
IMPACT MECHANISMS AND TARGETS
Promotion of non-motorised transports
More efficient use of transport infrastructure
Improved dirver and vehicle supportMore efficient transport network incident management
- What new or more efficient operations does the service enable?- The service will provide a prediction of the future traffic situation.- What relevant information does the service produce?- The service provides information of traffic situation (current &future) and weather.- What is the added value or operations due to the service?- The added value due to the service is that users can get real-timeand predicted traffic information via mobile phones and internet.- What are the innovative aspects in service provision?- The most innovative aspects in service provision are predictions oftraffic situation and piloting of the end-user interface.- Are there experiences from similar services or technologyapplications from elsewhere?- Similar technology applications have been developed and used inmany studies. In Finland the traffic forecasting model has been indemo use in Oulu region (in Northern Finland).- How does the service cater for fulfilment of transport or other policyobjectives?- Reducing of congestion related problems and innovative use oftechnology are both important policy objectives
- How reliably does the service function (as estimated ormeasured)?
- Correctness of the information provided by the service (asestimated or studied)?
- How is the quality of the service ensured and/or monitored?
- How is user needs and feedback utilised in the furtherdevelopment of the service?
- Do similar services exist elsewhere? How many users exists forcompeting services?- Is service financing settled and clear?- Is the service compatible to existing system architectures(standard solutions, open interfaces, generic platforms, etc.)?- Is service hosting (maintenance, development) settled?- Have the key organisations in the service value network beenidentified and involved?- Have legal issues (privacy, data security, etc.) been solved? Arenew or modified regulations required?- Can the service be organised via competitive tendering?- Can the service be extended with regard to content or usergroups (service integration, e.g. with tourism, entertainment)?- Service can be extended (more content, larger target customergroup) and also integrated to other services.- Can the service be expanded and exported (markets,competition, business opportunities)?The service can be expanded and exported to other market areaswith certain conditions (e.g. the source data must be available).- What threats exist with regard to service comprehensibility,adaptability and usability?- Source data of the service is provided by Vägverket. If they
How many users can use the service?- There is no upper limit to the number of users.
- What is the estimated number of users of service?
- Is the user interface unambigous, clear and comprehensible? Hasthe HMI been tested?- The HMI has not yet been tested in this project (since it is indevelopment phase), but same type of HMI has been in use earlierand its usability has been tested.
- Does the use require special skills, investments or actions?- The service can be used via mobile phone or internet so user needsto have access to these as well as basic information about how touse them.
- How have user requirements been considered in design of humanmachine interaction? Has use context been considered (in vehicle/athome/etc.)?Logica has designed the user interface according to its bestknowledge of user requirements. The service can be used in static(via PC) and in mobile context (via mobile phone).
Impa
ct m
echa
nim
sPäivämäärä Arvioijan nimi ja organisaatio Arviointivaihe31.03.2009 Armi Vilkman & Hanne Lindqvist, Destia Assessment phase

ITS service assessment sheet page 4/4NAME OF PROJECT/SERVICEASSESSMENT INFORMATION
PRINCIPLE SCHEME OF SERVICE OR MAP SUMMARY OF SERVICE DESCRIPTION
COSTS AND PRICE OF SERVICE SUMMARY OF PRIMARY IMPACTS (to be filled for appropriate parts, specified in sheet 1)
Costs for planning and specification €Investment costs €Technical maintenance costs €/yearOperational costs €/yearService pilot price / month €Actual service price €/monthPublic sector funding support €Public sector personnel resources required person-month/y
COST-EFFICIENCY OF SERVICEPotential service usersNumber of service usersCosts/price for tilaaja over whole service life cycle
(life cycle length is assumed as 5 years)€/y
SERVICE PRODUCTION MODEL
Financers of service
SUMMARY OF SERVICE ASSESSMENT
ROADIDEA Gothenburg pilot
SERVICE OVERVIEW
ADDITIONAL INFORMATION
€/user
Overview of production model
Providers of user service
Actors / organisationsinvolved in planning
Service provides Traffic Forecast and Weather Related Data for roadusers to inform and warn them about possible traffic indidents. Theservice uses Swedish Road Authoritie's raw data and processes it toTraffic information to be given trough mobile phones.
- For instance, estimated benefit/cost ratio, multiple criteria analysis(MCA) or rating for comparison of different projects
Service helps road users to avoid congestion on route and createstime savings for single road users. The service helps to spread thetraffic more evenly to the network both in time and in space so thewhole transport system gains positive impacts.
Tthe service provides information about road weather which alerts theroad users about possible problems on route. This creates better roadsafety for single road users and for transport system as a whole.
- Contact information for additional information on assessment
- Essential literature references
31.03.2009 Armi Vilkman & Hanne Lindqvist, Destia Assessment phase

ITS service assessment sheet
OTHER ADDITIONAL INFORMATION
ADDITIONAL INFORMATION
PERSONS INVOLVED IN ASSESSMENT
LITERATURE AND REFERENCES
ADDITIONAL INFORMATION TO CALCULATIONS AND ASSESSMENTS
Hanne Lindqvist, Destia, +358 400 368 944, [email protected] Vilkman, Destia, +358 40 592 1458, [email protected]
All literature and other material used in evaluation in such a form that they can be obtained on the basis of theinformation given.
Additional or background information, calculations etc. behind the information given in sheets 1-4, preferablyspecifying the sheet and calculation/estimate referred to.
All other additional information related to the assessment such as, e.g.; reason for assessment, context withinwhich made, inspectors/verifiers of assessment

ITS service assessment sheet page 1/4NAME OF PROJECT/SERVICEASSESSMENT INFORMATION
POTENTIAL MARKET AND USERS RELATIONSHIPS TO OTHER ACTIVITIES
COSTS, RESOURCE NEEDS AND FINANCINGSERVICE PROVISION CONCEPT
SERVICE DESCRIPTIONBACKRGOUND AND OBJECTIVES SERVICE CONTENT AND DISSEMINATION CHANNELS
- What is the user need behind the service and the problem to be solvedwith the service?- What is the development trend and severity of the backgroundproblem (e.g. the current and future number of accidents, incidents ordelays, and their effect on the society)?- What are the objectives of the service?The user behind the service is the Hamburg Port Authority (HPA) andpossibly further public urban traffic managers. The application issupposed to model the interrelationship between the container shipmoves (arrivals/ depatures) and the generate road container traffic. Theinteresting case is to model the corretation between traffic on thewaterside and generated traffic on the roadside. Prognosis shallbecome possible for road container traffic based on data on the knowship moves. In a second step, the application shall determine whichimplication the generated road container traffic has on the overall roadtraffic situation on the roads in the port area and on the feeder roads tothe port. This will be a basis for an improved road traffic management.The development trend is increasing road freigt traffic on the accessroads to/from the ports which threatens the overall competitveness ofthe ports and overloads road networks.
- What kind of information or control does the service produce?- Via which channels can users access the service?- Can the service be tailored to fit user's needs?- How will the service content and dissemination channels changewhen new technology solutions are developed and taken into use?The service will produce information of the generate traffic volumes ofcontainer trucks in a time interval by a container terminal and the trafficvolumes on the road network sections based on O-D-Considerations.The user operate the service himself based on own information.The information will be made available via the planning software ofHPA Additional information may come from the DAKOSY port IT serviceprovider and the container terminals.There are good chances that the service can be tailored to fit the user'sneeds. However, the application is quite complex an needcomprehensive data research.
- What investments, annual maintenance and operational costs as wellas fees does the service require in total and from the public sector as apurchaser/supporter?Investments: Costs for database development, software, hardware,interfaces, data costs, communication costsMaintenance: data quality checks, constant data collection andmaintenance.Operation: operation scheme not yet finally determined.-Who are the primary investors?HPA-What is the price of or cost associated with the data needed?It is likely that data is not supplied for free. Prices have not yet beendiscussed.- What actors/organisations finance the service and in which mannerand proportions?HPA most likely- What is the potential for wider commercial exploitation of the service?Commercial exploitation is limited. Data cannot be distributed withcredible anonymisation. Information could possibly be used in trafficinformation services.- How is the service to be marketed or promoted, and have themarketing costs been considered in the calculations?Marketing is not the primary objective The application will primarily
- How is service provision organised? Who hosts the service? Whodistributes it?The service will only distributed to traffic planners and traffic managers.An in-house solution is foreseen which is not distributed to the public.- Which are the responsibilities of the organisations involved?HPA, DAKOSY: data deliveryHPA, Assessment of the applicationPöyry Infra Traffic, concept developerDLR (?), concept, application developer- How are the service ownership and host issues solved?Discussions ongoing. Data ownership problems expected.Service will be owned by the user HPA. The data need to be treatedwith confidentiality because they are private, and kept secret forcompetition reasons.- How are the maintenance and liability issues solved?Needs to be considered later. It can be expected the HPA and DAKOSYwork together- Upon which data bases and technology solutions are the serviceprovision and user access built?DAKOSY databases, HPA databases- how is the data processed further to information and service?Process still needs to be modelled.
what is the availability of source data?
- Who are the potential primary customers of the service?HPA-How large, concentrated or diversified these customers are?One important organisation.- Which is the estimated number of persons, companies ortransportations using the service (e.g. estimated number of servicesubscribers) and how is the estimate calculated?Persons (planners, operators): 10Companies: 1 (HPA)Affected poeple: 10.000 per day (travellers to the port, transportbusiness).
- Description of how the service can possibly be related to otherservices (integrated services, service packets) ?The application could be part of a wider traffic management system forthe port.- Does the service enable new or more efficient operations, and what isthe economic significance of such operations?The application will make road traffic in the port more predictable.Planning measures can be better tailored.Traffic management can bemore specific.
Päivämäärä Arvioijan nimi ja organisaatio Arviointivaihe02.02.2009 Jörg Dubbert, Port Pilot Development Assessment

ITS service assessment sheet page 2/4NAME OF PROJECT/SERVICEASSESSMENT INFORMATION
DESCRIPTION OF IMPACT INFORMATION
0
IMPACTS ON TRAVEL IMPACTS ON TRANSPORT SYSTEM EFFICIENCY
SERVICE IMPACT ASSESSMENT PLAN
IMPACTS ON SPECIAL GROUPSIMPACTS ON SAFETY, ENVIRONMENT AND COMMUNITYSTRUCTURE
IMPACTS ON TRANSPORT SYSTEM DEVELOPMENT ANDMANAGEMENT, OTHER IMPACTS?
- How does the service affect the number, time and modal choice ofjourneys and their costs?It provides a prediction of the container truck volumes at a certaintime depending on the planned ship arrivals. This could be - in asecond step - a basis for informing travellers/ transport business,controlling traffic and planning infrastructure measures.
-Does the service reduce need of travel?Not fundamentally. It may contribute to smoothing peak times.
- How does the service affect route choices, journey times,congestion and traffic flow?The application is a basis for this. Route choice in the Hamburg portarea is restricted. There are not too many options. The traffic flowcould be improved by better prediction of the traffic situation.Journey times could be reduced by better planning of the logisticsprocess.- How does the service affect incident occurrence, incident impactsand possibilities for incident management?Not directly. Indirectly, the application may contribute to lesscongestion und incident risk
- How does the service affect the travel and other possibilities ofspecific user groups, such as the elderly and disabled?No, not elderly and disabled.- How does the service affect the business possibilities and welfare ofsome types of enterprises?Better accessibility of businesses in the port area.HPA can better plan the port infrastructure capacity.
- How does the service affect e.g. the needs to build and improvetransport infrastructure?The application is supposed to contribute considerably to a betterroad capacity planning due to the fact that the demand in containertraffic can better be predicted.- How does the service affect transport infrastructure maintenanceand operational costs?The road infrastructure can be better planned according to the realneeds. There is currently the risk that the port looses economicperformance because of weak hinterland links. The betterpredictablilty is absolutely important for the efficient maintenace andoperation of the infrastructure.- How does the service affect public transport operational costs?Not at all- What other impacts does the service have (e.g. health)?Better traffic information service quality.Better informed decisions by transport comapnies.
- How does the service affect traffic safety, security, environment,climate change, landscape, cityscape and community structure?Higher Traffic Safety,: may be an indirect effect of better trafficmanagementSecurity: no effectEnvironment, climate change, community structure: no significanteffect expected.Cityscape: Road network can be better planned.
-Does the service have any impacts on gender, age or other socialissues?No.
- How can the impacts of the service be studied and monitored (e.g.user acceptance and user interfaces)?By interviews of HPA.Comparison of predictions with parallel traffic counts.- What assessment methods can and will be applied (e.g. usertests, questionnaires)?Interviews
Päivämäärä Arvioijan nimi ja organisaatio ArviointivaiheDate Name and affiliation of evaluator Assessment phase

ITS service assessment sheet page 3/4NAME OF PROJECT/SERVICEASSESSMENT INFORMATION
x x x
x x x
x x xPromotion of non-motorised transports
More efficient use of transport infrastructure
Improved dirver and vehicle supportMore efficient transport network incident management
USEFULNESS, INNOVATION AND ECONOMIC EFFICIENCY
ACCESSIBILITY AND USER CENTERED DESIGN
IMPACT MECHANISMS AND TARGETS
Change in transport infrastructure or vehicle fleet investmentsImproved public transport incident management or route choice
More efficient public transport operation
SERVICE ASSESSMENTTECHNICAL PERFORMANCE AND QUALITY ASSURANCE
OPPORTUNITIES AND THREATS
Traf
fic sa
fety
Oth
er, s
peci
fy?
Target of impacts
Improved service provision prerequisites and tenderingImproved logistic chains and deliveries
Prer
equi
sitiv
es fo
rbu
sine
sses
Serv
ice
leve
l and
perf
orm
ance
of
trans
port
syst
em
Cos
ts o
f tra
nspo
rtsy
stem
ROADIDEA
Promotion of standardised and generic solutions
Other, specify?Development and piloting of innovative solutions
- What new or more efficient operations does the service- What relevant information does the service produce?Prediction of road container traffic for a certain time period of the daydepending on know container ship arrivals.- What is the added value or operations due to the service?Better predictions of the traffic situation in the port for planning andtraffic management.- What are the innovative aspects in service provision?The multi-modal approach.- Are there experiences from similar services or technologyapplications from elsewhere?No.- How does the service cater for fulfilment of transport or other policyobjectives?The service makes the Port of Hamburg more competitve by a betterplanning of the hinterland connection.- Which are the social benefits that can be expressed in monetaryterms in relation to investment and maintenance costs (if estimationis possible)?Not possible
- How reliably does the service functions (as estimated ormeasured)?How service needs a very good process model and good data.This is the precondition for reliable functioning.- Correctness of the information provided by the service (asestimated or studied)?At the moment, the service is not implemented. So, this cannot bestudied now.- How is the quality of the service ensured and/or monitored?Check of the process model. Comparison of preditions with realsituations. Regular data checks.- How is user needs and feedback utilised in the furtherdevelopment of the service?The performance will be discussed with HPA. Needs forcorrections will be analysed.
- Do similar services exist elsewhere?Don't know. How many users exists for competing services?None- Is service financing settled and clear?No- Is the service compatible to existing system architectures(standard solutions, open interfaces, generic platforms, etc.)Not yet considered.- Is service hosting (maintenance, development) settled?Several options: HPA, DAKOSY, others- Have the key organisations in the service value network beenidentified and involved?Process is ongoing. Key partners known.- Have legal issues (privacy, data security, etc.) been solved? Arenew or modified regulations required?Important question which will need even more attention. Processjust begins.- Can the service be organised via competitive tendering?Not foreseen.- Can the service be extended with regard to content or usergroups (service integration, e.g. with tourism, entertainment)?
- How many users can use the service?Direct users number is restricted to the planners of HPA. Should theapplication become an input to trffic management, die number ofafffceted poeple will multiply.- What is the estimated number of users of service?10 directly.- Is the user interfaces unambigous, clear and comprehensible? Hasthe HMI been tested?No HMI available at the moment.- Does the use require special skills, investments or actions?Skills: Knowledge of traffic planning software, profile of a trafficengineer.Investment: Model and software development. Computing systems,databasesActions: Bringing together people from logistics and traffic planning,traffic management, Clarification of the condtions for data receipt anduse.- How have user requirements been considered in design of humanmachine interaction? Has use context been considered (in vehicle/athome/etc.)?No yet relevant.- Have the needs of special groups been considered?N
Impa
ct m
echa
nim
sPäivämäärä Arvioijan nimi ja organisaatio Arviointivaihe02.02.09 Jörg Dubbert Assessment phase

ITS service assessment sheet page 4/4NAME OF PROJECT/SERVICEASSESSMENT INFORMATION
PRINCIPLE SCHEME OF SERVICE OR MAP SUMMARY OF SERVICE DESCRIPTION
COSTS AND PRICE OF SERVICE SUMMARY OF PRIMARY IMPACTS (to be filled for appropriate parts, specified in sheet 1)
Costs for planning and specification €Investment costs €Technical maintenance costs €/yearOperational costs €/yearService pilot price / month €Actual service price €/monthPublic sector funding support €Public sector personnel resources required person-month/y
COST-EFFICIENCY OF SERVICEPotential service usersNumber of service usersCosts/price for tilaaja over whole service life cycle
(life cycle length is assumed as 5 years)€/y
SERVICE PRODUCTION MODEL
ADDITIONAL INFORMATION
€/user
Overview of production model
Providers of user service
Actors / organisationsinvolved in planning
to be clarified
SERVICE OVERVIEW
0
HPA, DAKOSY, ContainerTerminals,Forwarders,shippers
HPA
Financers of service
SUMMARY OF SERVICE ASSESSMENT
Traffiic Planners10
The application is supposed to predict the number of container trucksat a certain time period at the terminal gates in the Port of Hamburgdepending on the known ship arrivals and container data.In a second step the effect of the generated road container traffic onthe general traffic situation in the port network has to be determined byorigin-destiantion-calcultaions.
- For instance, estimated benefit/cost ratio, multiple criteria analysis(MCA) or rating for comparison of different projects
It is expected that the service contributes to a better road networkplanning and traffic management.
A better road transport infrastructur planning tool which is built on thepredictability of road container traffic in the port network.A better basis for traffic information and traffic management on theroads in the Port and auround it.
- Contact information for additional information on assessment
- Essential literature references
Date Name and affiliation of evaluator Assessment phase

ITS service assessment sheet
OTHER ADDITIONAL INFORMATION
ADDITIONAL INFORMATION
PERSONS INVOLVED IN ASSESSMENT
LITERATURE AND REFERENCES
ADDITIONAL INFORMATION TO CALCULATIONS AND ASSESSMENTS
Jörg Dubbert, Pöyry Infra Traffic GmbH Hamburg, [email protected], Tel: +49 40 369692 32Sascha Westermann, Hamburg Port Authority (HPA), [email protected], Tel: +49 40 428473223
All literature and other material used in evaluation in such a form that they can be obtained on the basis of theinformation given.
None
Additional or background information, calculations etc. behind the information given in sheets 1-4, preferablyspecifying the sheet and calculation/estimate referred to.
None
All other additional information related to the assessment such as, e.g.; reason for assessment, context withinwhich made, inspectors/verifiers of assessment

Annex 2 QUESTIONNAIRE INNOVATION ASPECTS
Evaluation of each short-listed free radical idea as the last exercise of 2nd innovationseminar lead by group leaders. Tick the appropriate box.
Name of Idea
Innovation Aspects Factor Value
New or innovative/existence of a new element0=the idea exists and is on the market already, 1= similar services onthe market but idea has some new aspects, 2= completely new ideanot known to be implemented, 3= completely new idea not known tobe developed anywhere, 4= revolutionary and radical new idea
0 1 2 3 4
Relation to the state-of-the-art0=no added value, 1= unclear added value, 2=minor added value,3=large added value, 4=revolutionary
0 1 2 3 4
Scale and potential impact of the idea0=no foreseen impact, 1=small scale innovation, small impact,2=small scale innovation, large impact, 3=large scale innovation,small impact, 4=large scale innovation, large impact
0 1 2 3 4
Potential for multiple use0= does not solve known problems, 1=solutions for a single problem,2=solutions for a few deployment cases, 3=solutions for many similardeployment cases, 4= revolutionary new solution with multitude ofpotential deployment sectors
0 1 2 3 4
Relevance to global policy objectives0=no clear contribution or idea politically not accepted, 1=lowcontribution, 2=average contribution with usual impact, 3=clearstrong contribution to sustainable development, strong impact, 4=revolutionary new concept solving key problems in society
0 1 2 3 4
Feasibility of the concept/obstacle to implementation0=idea hard to implement in general, 1=idea hard to implement in theshort run, 2=idea can be implemented with an average effort andrisk, 3=idea easy to implement, 4=industry will compete on this ideafor quick implementation
0 1 2 3 4
Relevance for business generation0=no business opportunity foreseen, 1=unclear business case, somepotential maybe in the future, 2=clear business case today, but smallmarket, 3= clear business case, large market, 4=killer application,large market
0 1 2 3 4
Public interest0=no public interest in the idea, 1= some public interest, 2=clearpublic interest, but no business case, 3= clear public interest withbusiness case, 4= public will go wild with this idea
0 1 2 3 4
Comments

1
Annex 3 Questionnaire SERVICE CONCEPT
IDEA EVALUATING QUESTIONNAIRE
IDEA: ________________________________________________________________________
Evaluator: _______________________________________________________________________
1. Are you aware of what kind of data is needed for the idea and are they available? ________
______________________________________________________________________________
______________________________________________________________________________
2. What is the problem to be solved by idea? ________________________________________
______________________________________________________________________________
______________________________________________________________________________
3. Are you aware of what is needed to be done for technical implementation of idea? _______
______________________________________________________________________________
______________________________________________________________________________
4. Who are primary costumers/users of the idea? ____________________________________
______________________________________________________________________________
______________________________________________________________________________
5. What is the user need/s behind the idea? _________________________________________
______________________________________________________________________________
______________________________________________________________________________
6. Via which channels can users access the idea/service? ______________________________
______________________________________________________________________________
______________________________________________________________________________
7. Is there a potential for wider exploitation of the idea (business opportunities)?
______________________________________________________________________________
______________________________________________________________________________

2
8. Are there similar products on the market? _________________________________________
______________________________________________________________________________
______________________________________________________________________________
9. What a potential for wider commercial exploitation of the idea? _____________________
______________________________________________________________________________
______________________________________________________________________________
10. What are the most important benefits for the user? (the added value) __________________
______________________________________________________________________________
______________________________________________________________________________
11. Is the idea something completely new, or it represents development of existing service (Fillthe attached Table for Evaluation of Innovation Aspects of idea!)?
12. Are you aware of socio-economic impacts of idea? ________________________________
______________________________________________________________________________
______________________________________________________________________________

Aihe / Subject: ROADIDEA, 2nd Innovation Seminar / Evaluation report
Dokumentti No / Document No: 0001
Päiväys / Date: 05/06/2009
S.E.O.S. Design Oy
www.seos.fi
Y-tunnus: Y-2140058-0
Hämeentie 153 B Helsinki
00560
Evaluation report of the ROADIDEA 2nd Innovation Seminar
Dubrovnik 14–15.5.2009
MY BACKGROUND
My professional background is in product development. It consists of working in
several different positions as senior industrial designer and researcher, mainly in
the international arena. During the last 12 years I have been working in both
business- and academic fields and includes experience working in two different
Industrial design consultancies, as freelance design consultant, lecturer of
advanced product design in Helsinki university of Art and Design, researcher and
creative specialist, partner and chairman in a consultancy that concentrates in
sustainable design and research.
During my professional career as industrial designer I have been working for more
than 50 international clients, in several different types of projects including:
Industrial-, interior-, packaging-, furniture-, conceptual automotive, concept-, and
strategic design.
My experiences as researcher can be divided in two different fields: academic and
consulting. As a research consultant I have experience in using several different
ethnographic and consumer research methods in association with product
development. In the academic field I’m part of Decode research group which is a
cross-disciplinary group within Design Factory and BIT Research Centre at Aalto
University (TKK). The focus of my research is user centered design and pre-design
research. The goal of Decode on the other hand is to develop conceptual and
hands-on means to identify, create, and realize strategic innovations.
In these practises we commonly use different innovation methods and techniques,
including brainstorming, bodystorming and a technique that we call quick-and-dirty
prototyping. This is a technique that allows us to communicate our ideas through
models and mock-ups during the innovation process, with the added benefit of
communication through other than verbal channels.
This is the background through which reflect my evaluation of the ROADIDEA, 2nd
Innovation Seminar held in Dubrovnik, Croatia. I personally am not a subject matter
expert in weather services nor in ITS, both sectors of which were in the very hearth
in knowledge wise in this seminar. Never the less with my professional experience I
consider myself a specialist in the field of innovation and it is because of this that
my evaluation of the Dubrovnik Seminar is focused of the process it self.

Aihe / Subject: ROADIDEA, 2nd Innovation Seminar / Evaluation report
Dokumentti No / Document No: 0001
Päiväys / Date: 05/06/2009
S.E.O.S. Design Oy
www.seos.fi
Y-tunnus: Y-2140058-0
Hämeentie 153 B Helsinki
00560
THE EVALUATION
Based on my experiences in the field of product development it is in my
understanding that to come up with radically new ideas in a given field, as it is in
the case of ROADIDEA is a serious task. To successfully conduct innovation
activities, that is to really come up with radically new ideas, requires that all the
necessary pieces of the puzzle in the innovation process to be in the right place at
the right time.
Innovations don’t just happen. Or they might, but the reality of the industry is that
they are commonly produced through very specific processes. Innovation processes
are used in the industry for several reasons, but because of the focus of ROADIDEA
let’s concentrate on the search for radically new ideas.
I sincerely feel that the Dubrovnik seminar was conducted on a very high
professional level. In this evaluation I will bring out only the parts of the seminar that
I personally would have looked more in to. By comparing a few topics of an ideal
innovation process to what I experienced in Dubrovnik my aim is to give you
suggestions to further enhance the innovation process used in the ROADIDEA
project.
PRIOR KNOWLEDGE
Innovation practices are information intensive activities. When in a search for
radically new types of ideas a vast amount of information has to be brought together
in a controlled manner for successfully complete the task. It is in my understanding
that in the innovation seminar held in Dubrovnik this aspect was well taken in to
consideration. An international group of subject matter experts, with extensive
knowledge and experience was brought together under a common aim.
As the time horizon for the new ideas was in 2030 the SME-teams were further
stimulated with well prepared scenarios that gave the teams the ability to
experience life in the aimed future. Scenarios are a very effective tool of concept
design and future studies and I believe that the ones the teams used in Dubrovnik
were one of the best ones I have ever seen.
As stated previously innovations are typically created through controlled processes
and this was the case also in the Dubrovnik seminar. To effectively conduct these
types of activities requires knowledge, not only on the subject matter, but of the
innovation process itself as this very much affects the outcome of the project. Even
though the organizers had prepared the seminar well I believe that the participants
of the event generally lacked experience of innovation activities. I strongly believe
that if the participants had have more experience in the innovation process itself the
daily activities would have been conducted in a much more efficient way and
though affecting the final outcome of the seminar.

Aihe / Subject: ROADIDEA, 2nd Innovation Seminar / Evaluation report
Dokumentti No / Document No: 0001
Päiväys / Date: 05/06/2009
S.E.O.S. Design Oy
www.seos.fi
Y-tunnus: Y-2140058-0
Hämeentie 153 B Helsinki
00560
INNOVATION TEAMS
Depending of the field, ideally an innovation teams are relatively small, cross-
disciplinary teams of subject matter experts who have prior knowledge in innovation
activities. If needed the team is further supported with experts at certain phases of
the project. The best thing would be to have only a few members, ideally only three
in the team with all of the knowledge and expertise needed.
The reality is that it is very hard or even impossible to find persons who know it all
so the typical answer to the problem is to have more team members. Larger teams
allow more knowledge flow for the use of team, but the challenge then becomes the
fact that a bigger team is seldom as effective, efficient or motivated as a small one.
Time schedules, decision making and even to be on the same “level” takes more
time. It then becomes a compromise between expertise in subject matter and
efficiency.
Other fact that affects the final outcome produced by the team is team dynamics.
That is the ability of the team to work together for a common goal. Commitment and
willingness to succeed depends a lot on how the team dynamics work. This is
greatly affected by the different personalities of the team members. Do they get
along, are they capable to bring out their knowledge to the use of team in a given
situation and do they have the capacity to use shared knowledge in a creative way
to come up with innovations? It is crucial is to ensure that all team members are
capable and are obligated to produce and process material of and for the team. Any
free riders within the team reduce the motivation of all team members.
Large teams need a strong leader. The capability and experience of the team
leaders play an important role in guiding a large team in their task. With a right type
of guidance and the right tools the possible friction between the team members can
be reduced.
I believe that the team sizes in the seminar were generally too large. There are
naturally several reasons why the teams were big as they were, but I strongly
recommend to reduce the team sizes for next possible session. Big teams will
greatly affect the teams’ capability to work together in an efficient manner. Also
what I suggest is to carefully select the members for each team. Knowledge in a
given field naturally the starting point for selecting members for the team, but also
personalities play an important role. There are several types of personality test that
can be conducted prior to the team selection in the search for the best team
combinations.

Aihe / Subject: ROADIDEA, 2nd Innovation Seminar / Evaluation report
Dokumentti No / Document No: 0001
Päiväys / Date: 05/06/2009
S.E.O.S. Design Oy
www.seos.fi
Y-tunnus: Y-2140058-0
Hämeentie 153 B Helsinki
00560
PRESENTATIONS
In the Dubrovnik seminar the teams presented their concepts with posted notes.
As a visual person I know that they way we present our ideas strongly affects on
how they are understood and accepted by the audience. This naturally affects also
on how well the concepts do in any selective evaluation. Visual communications
plays an important role not only in an innovation processes, but general on how well
we comprehend our surroundings.
In the innovation activities we commonly conduct for our clients we use all the
possible manners to ensure that our ideas are well communicated. This includes
3D-modelling, models, prototypes, sketches, computer renderings and animations.
All of which are common ways to communicate ideas in the field of industrial
design.
Taking in to consideration the background of the participants in the seminar it is
understandable that the capabilities in regarding visual communication are limited.
Never the less I would like to point out a few methods which will greatly enhance
the way ideas can be communicated in these types of situations.
1) Hand made sketches. Sketches are an easy and fast way to communicate ideas.
I would recommend you to encourage the participants draw much more and
present their ideas, not only the final ones, but also between the team members,
with drawings.
2) Quick-and-dirty prototypes. In our activities we use very basic model making
skills in creating fast models to communicate complex ideas. In this we use
cardboard, paper, plastolin, tape, glue or what ever is made available. For the team
members who are not capable of drawing, model making is a valid option.
3) Bodystorming. Use body in experiencing and communicating ideas. This type of
activities can include even plays which can then be video taped and used as
presentation material.
Together with verbal communication, all of these three different ways of
communicating ideas will greatly enhance innovations teams ability to communicate
their ideas, not only in the presentations, but also within the team while working.

Aihe / Subject: ROADIDEA, 2nd Innovation Seminar / Evaluation report
Dokumentti No / Document No: 0001
Päiväys / Date: 05/06/2009
S.E.O.S. Design Oy
www.seos.fi
Y-tunnus: Y-2140058-0
Hämeentie 153 B Helsinki
00560
Contact
I hope that this evaluation will give you a possibility to further enhance the
innovation process used in the ROADIDEA project. If you have any questions about
this evaluation or need for additional information, please contact me for further
information.
Best Regards,
Pekka Kumpula
Creative Specialist, Chairman
MA Industrial Design
Seos Design Ltd.
+358 44 0800 383
www.seos.fi

1 (2)
Annex 5 Questionnaire PROCESS EVALUATION
The participants
1. Had the participants enough ITS and road traffic background in order to proposerelevant ideas (R&D projects, EU guidelines, ITS action plan, relevant unresolvedproblems etc.)?
2. Were the participants generally motivated and well prepared with pre-preparedideas?
3. Is there enough awareness of the state-of-the-art, the state-of-research andunresolved burning problems?
4. How big is the risk that the discussion goes in a certain direction due to the bias inthe expertise of participants?
The process of idea generation
1. Can the process of idea generation be open or are must there be set traffic-relatedtopics in order to get more relevant results?
2. Was the process of idea generation competently guided and monitored by suitableexperts?
3. Are the participants free of interests concerning the decision on which idea topropose and to deepen?
4. Were there incentives for a competition to provide the best idea?
5. Were the challenges of a changing world (until 2030) taken into account?

2 (2)
The idea ranking
1. Are the ideas sufficiently described and presented so that evaluating persons canunderstand the ideas?
2. How objective is the process of giving hearts to ideas?
a. What are the criteria, the background and the interests of persons distributinghearts?
b. How large is the risk that good ideas are not highlighted?
3. Is the basketing done or supervised by knowledgeable traffic and ITS expert?
The idea development after the seminar
1. Who is responsible for idea development after the seminar? Was this clearlydetermined?
2. Has this organisation enough resources to push it forward?

Annex 6 Literature review for the Fog Warning System
1 (17)
Automated Driver Information systems and Traffic Detectors: the Stateof the Art and Evaluation Results.(C. Arthur MacCarley. Calofornia Polytechnic State University)
Some examples of activ Driver Warning Systems worldwide.
� Fog-Detection and Warning Project, Netherlands.Located along 7,5 miles of the A16, Breda. 1991-
� Variable Speed Limits on Autobahn, Germany. 1960-� Fog Warning and Advisory Speed Limit System, Australia
11 km. of F6 Tollway south of Sydney. 1963-� M25 Automatic Fog Warning System, London Orbital Motorway England
Six visibility detection sites. 1990-� The Weather-Controlled Road system, Finland.
15,5 miles of E 18 between Pyhtaa and Hamina. 5 weather monitoring stations,66 VSL, 13 CMS. 1994-
� Storm Warning system, Idaho, USA, I-84 in southeast Idaho.Sensors for traffic, visibility, wether, road surface, video cameras, 4 CMS. 1993-
� The Fog-Detection and Warning System, Tenessee, USA.19 miles of I-75, near the Hinwasse River. 8 fog and 44 speed detectors. 1994-
� TravelAid, Washington State, USA, I-90. Snoqualmie Pass, 13 CMS, var. speed limits. 1997-� Adverse Visibility Information system (ADVISE), UTAH, USA. I-215 in Salt Lake City. 1999-2000� Fog Detection and Warning System, Georgia, USA.
12 mile stretch of I-75, near Adel. 2001-� New-Jersey Turnpike, New-Jersey, USA. 120 variable speed limit signs over 148 miles. 1968-� Variable Speed Limit project, Nevada USA, I-80 and other roads, weather monitoring.
22 variable speed limit and warning signs. 2002-
Overall Observations and Results

Annex 6 Literature review for the Fog Warning System
2 (17)
� When CMS dislpayed fog related warning, mean speed decreased an average of 1,1 mphcompared with the behavior of traffic in the absence of warning.
� However, average PCS (Potential Collision Speed) increased differentially by 7 mph, due tocompression of platoons and sensitivity of this metric to progressively worse visibility afterCMS
� Proximate speed variance did not appear to be significantly effected, staying within of 6-7mph across all lanes in most cases.
� Warning messages were found to evoke a measurable but very small effect on driverbehavior. When visibility was identical before and after the CMS, mean speed decreased of0,18 mph, PCS decreases of 3,53 mph.
� Drivers appeared to respond predominantly to their own perceptions and reduced speed infog, but not nearly enough for the reduced visibility distance. When advised 30 mph in densefog, mean speeds averaged 61 mph.
Fog Sensors
Nephelometers measure the light scattered in a forward direction by fog particles and are the mostwidely used and cost-effective fog sensors. They provide accurate fog density measurement in aselectable output format (visibility in distance units or voltage proportional to fog density). Thesesensors have low maintenance requirements and are designed with roadside highway use in mind;they are small and lightweight and their light emitters and detectors are contained within theirhousing, eliminating the need for external lenses and windows.
A nephelometer sensor unit consists of an optical system, electronics, and software forcommunication to a host computer. The data obtained by the detector are digitized and transferredto the host computer. Once the host computer requests fog density data from each sensor, itdetermines the level of warning based on a pre-established conversion equation.
Vaisala IceCast Fog Warning System
The hazards of fog can be managed using the Present Weather Detector (PWD) range ofinstruments, supplemented by Vaisala Weather Cameras. Both instruments can be installedas an integral part of ROSA weather stations or as stand-alone solutions.

Annex 6 Literature review for the Fog Warning System
3 (17)
Data can be displayed via IceView or IceWeb. These solutions may be integrated with VMStechnology to provide road and bridge users with warning/advisory information. Roadweather solutions typically use the PWD12 measuring visibility with a range of 10-2000m.
There are several Vaisala Traffic Weather Camera options available, depending on thelocation of the weather station.
Automatic Fog Warning System (FWS)FUNCTION
The Automatic Fog Warning System (FWS) has been developed as a preventive measure designed tosave human lives and properties from traffic accidents caused by fog or other elements that reducedriver's visibility.
The system operates by first detecting the presence of fog from the sensor modules installed on thesurrounding area, which transmits signal to warning system that emit warning signals from advanceddistance of 0.5 to 1 km depending on the density of the fog.The warning meassage includes automatic lightening of fog lamp and reduced speed warning on thefog display board located on the roadside that are designed to assist vehicles entering foggy areas tosafely pass through by leading them to the safe average visibility range.In addition, the automatic fog warning system came on the line to give a strong warning against fogto vehicles,with access to the poor visibility range.Feature
Preventive measure against automobile pile up accidents caused by fog in foggy areas.Advanced warning message from distances of 500 m, 1 km before fog generation.Reduced speed warning on the fog display board (40km, 60km, 80km)
Roadside installation of fog lamps to assist driver's safe passage. Displaying the curvature of the road through LED flickers at night. Independent automatic fog warning system with data recording capability Automatic diagnosis and transmission of road information as an option.
Automatic Fog Warning Light (FWL)

Annex 6 Literature review for the Fog Warning System
4 (17)
FUNCTIONThe system can be utilized for road guidance light or fog warning lights depending on the variousinformation (day/night, snow/rain, fog, etc) the central control system receives.For road guidance light, the system emits 12EA red LED light in frequency of 0.2 sec/0.8sec ofON/OFF interval, increasing driver's safety at night or in snow/ rain, by simutaneously lighting alllamps to reveal the shape and the curvature of the road.For fog warning light, the system illuminates the lights alternatively in pre-installed level thatmatches the density of the fog, and thus improving the driver's vision for safe passage.
FeatureCombined capability of fog light and guidance lightAutomatic adjustment of fog light based on the density of fogMinimization of construction cost through utilization of existing connection wires when installing thesystem in fog light designated areas.Minimization of maintenance cost with reduced energy consumptioN
South Carolina DOT Low Visibility Warning SystemAs a result of a federal court decision the South Carolina Department of Transportation (DOT) wasrequired to incorporate fog mitigation technologies during construction of the Interstate 526 CooperRiver Bridge. The DOT deployed a low visibility warning system on seven miles (11.3 kilometers) ofthe freeway to inform drivers of dense fog conditions, reduce traffic speeds, and guide vehicles safelythrough the fog-prone area.
System Components: Warning system components include an Environmental Sensor Station (ESS),five forward-scatter visibility sensors spaced at 500-foot (152.4-meter) intervals, pavement lightsinstalled at 110-foot spacing (33.5-meter), adjustable street light controls, eight Closed CircuitTelevision (CCTV) cameras, eight Dynamic Message Signs (DMS), a Remote Processing Unit (RPU), acentral control computer, and a fiber optic cable communicationsystem. The ESS measures windspeed and direction, air temperature, and humidity. The onsiteRPU transmits field sensor data to thecontrol computer, which is located in a DOT district office.
System Operations: The central computer’s decision support software predicts or detects foggyconditions, correlates environmental data with predetermined response strategies, and alerts trafficmanagers in the district office. When alerted by the computer, system operators view images fromthe CCTV cameras to verify reduced visibility conditions. Operators may accept or decline responsestrategies recommended by the computer system. Potential advisory and control strategies includedisplaying pre-programmed messages on DMS, illuminating pavement lights to guide vehiclesthrough the fog, extinguishing overhead street lights to minimize glare, and closing the freeway anddetouring traffic to Interstate 26 and US Highway 17. When When warranted, Highway Patrol officerserect barricades to close the freeway. Response strategies for various visibility ranges are shown inthe table.

Annex 6 Literature review for the Fog Warning System
5 (17)
Transportation Outcome: The low visibility warning system enhances mobility by providing travelerinformation and clearly delineating travel lanes with pavement lights. Regarding safety, no fog-related crashes have occurred since the system was deployed.
Implementation Issues: The owner of a paper mill near the Cooper River Bridge site filed a lawsuitagainst the South Carolina DOT as they planned construction of the bridge in the mid-1980s. Thebridge was to be built at the same height as the paper mill’s smoke stacks. After reviewing variousfog mitigation techniques recommended by a consulting firm, a federal judge required that a lowvisibility warning system be included in the bridge construction project.The warning system began operating in 1992. Initially, there were several system reliability problemsrelated to the harsh, outdoor environment. In order to prevent unnecessary activations systemsoftware was calibrated to average visibility distance observations and disregard low readings causedby smoke plumes from the paper mill. Components of the microwave communication system, whichwas originally deployed, were struck by lightning and ultimately replaced by the fiber optic cablecommunication system. The DOT permitted the installation of privately owned communicationcables in the state’s right-of-way in exchange for dedicated fibers from the project site to the districtoffice.
UTAH’S FOG WARNING SYSTEM - “ADVISE”FOG - IS IT A PROBLEM?Lately, fog has not been a significant issue in Utah nor attracted notable media attention. Thepresence of fog is a cyclic phenomenon, much like extreme cold or mild winters. Fog has createdsome treacherous conditions in the past. There were two days at two locations in late 1988 and early1991 where fog was the contributing environmental element in which a total of 128 vehicles wereinvolved in multi-vehicle incidents. One of the locations is the Interstate 215 south segment betweenRedwood Road and the I-215/I- 15 Interchange in Salt Lake City. This was the location that wasselected for the deployment of a fog warning system because of the high daily traffic volumes andthe climatological conditions that are conducive to the rapid formation of dense fog. At this location,between December 1995 and March 1998, there were 29 days with recorded fog sufficient to reducesafe stopping distances. In comparison, there were only four recorded low visibility events in thewinter of 1999/00.
ADVISE BACKGROUND

Annex 6 Literature review for the Fog Warning System
6 (17)
In 1993, UDOT researchers developed a proposal in response to a FHWA solicitation for theDevelopment of a Prototype Adverse Visibility Warning and Control Systems for OperationalEvaluations” UDOT was awarded the project which was to develop a prototype system that wouldprovide realtime warning to motorists during poor visibility situations. The project was named theADverse Visibility Information System Evaluation or ADVISE. The primary objective of the project wasto assess the behavior of drivers during a low visibility event and their response to a warning system.The purpose of this research was to determine if the ADVISE System, reduces the variability in speedsbetween vehicles and lowers the overall mean vehicle speeds during low visibility events.A Request for Proposal was issued in 1994 and Rockwell International was selected as the consultantto design and install the fog warning system. The system was to be deployed in two primary stages:1st stage – visibility sensors, 2nd stage - changeable message signs. Equipment installation wasessentially completed in 1996, but sign and communication equipment failures preventedresearchers from collecting useable data. During the winter of 1999/00, several data sets werecollected with all components of the system operational. A contract was setup with the University ofUtah Traffic Lab to provide analysis of the system effectiveness.
ADVISE SYSTEM CONFIGURATIONThere are four primary components of the ADVISE system: 1) Four visibility sensors, 2) Two variablemessage signs (VMS), 3) Six traffic counters, and 4) Client/Server Computer Local Area Network andcommunication equipment. The visibility sensors are a HSS Model PW 600-120 present weathersensor. The ADVISE VMS were designed with bulb-matrix technology, which are readable at a greaterangle and a greater distance than the fiber optic technology used in the freeway VMS. The trafficcounters were originally installed at six locations to collect traffic speed and volumes. Currently, onlytow traffic detection sites are functional. The computer hardware and software was designed tocommunicate with the When visibility readings measured by the fog sensors are within certainpredefined thresholds (based on safe stopping sight distances) an appropriate message would bedisplayed on the VMS such as “Dense Fog, Advise 30 mph”. The research team had to deal with I-215restriping, I-15 Reconstruction, lightning strikes to equipment, and accidents that have destroyedsome of the traffic detection equipment.
PROJECT RESULTS & CONCLUSIONSAn evaluation by the University of Utah Traffic Lab has recently been completed and a draft reporthas been prepared. Data from the 1st stage (fog sensors without VMS) and 2nd stage (fog sensorswith behavior modifying VMS messages) were evaluated and found that the ADVISE system met oneof the project goals which was to reduce the variation of speed under foggy conditions. The systemdid not reduce the mean speed to the advised speeds. However, since speed variation reduction is animportant factor to reducing the potential for multi-vehicular accidents, it was recommended toincorporate the ADVISE system into the Advance Traffic Management System (ATMS) and tocontinue to evaluate the system’s effectiveness. A task order is currently being developed to have aconsultant integrate the system into Utah’s ATMS.

Annex 6 Literature review for the Fog Warning System
7 (17)
ContactStudy Conclusions/Results:• In General, at low visibility, speed variations of vehicles increase.• Vehicle speed variation decreased by 22% when the ADVISE system was functioning.• Under adverse visibility, an average 8 mph increase was observed due to factors such as an overall6 mph general speed increase in the area and reduction of excessively slow drivers during fog events.• The ADVISE System has a positive effect on traffic provided the system can be maintained such thataccurate and reliable information is conveyed to drivers.Recommendations Included:1) Integrate System in Advanced Traffic Management System2) Add traffic speed input into control algorithms;3) Continue to evaluate effectiveness.
Nebelwarnanlage für Autobahn in Österreich (A1 232-242 km)(Fog Warning system in Austria)
An implementation of an automated fog detection and warning system was carried out as asubsystem of the Austria-wide traffic management and information system of ASFINAG. The systemcovers approximately 10 - 12 km of the Upper Austrian lake area and consist of 7 fog detectiondevices combined with an information display, visibility gauges, weather station, video observation,traffic data management interchangeable road signs, road side stations, gantrie as well as fibre cableinfrastructure with connection to the Corporate Network of ASFINAG. This project developed as amaster-project for an aligned traffic management sytem with special features for environmentalincidents, is an exemples for future traffic projects in other exposed and dangerous areas.
Facts:
� Section length 12 km, both directions� Visibility measurement (backscatter)� Automatic weather stations� Traffic data management

Annex 6 Literature review for the Fog Warning System
8 (17)
� Video onservation� Subcentres with 5 operator stations� 2x6 cabtilevers with variable message signs, dynamic route information panels, signal lamps,
detectors� Fibre-cabling
(More detail in German)
Der Siemens-Bereich Industrial Solutions and Services (I&S) hat im Auftrag der österreichischenAutobahnen- und Schnellstraßen Finanzierungs AG (ASFINAG), eine europaweit einzigartigeNebelwarnanlage errichtet. Mit Hilfe von Witterungssensoren werden entlang eines rund zehnKilometer langen Abschnitts der West Autobahn die Sichtverhältnisse analysiert.Wechselverkehrszeichen warnen die Verkehrsteilnehmer automatisch bei Nebel oder starkemSchneefall. Dazu erklärte der österreichische Verkehrsminister Hubert Gorbach: „DieNebelwarnanlage ist eine weitere Maßnahme aus unserem Verkehrssicherheitspaket, mit dem wirunser ehrgeiziges Ziel, die Anzahl der Verkehrstoten bis 2010 zu halbieren, konsequent verfolgen.“Die Anlage hat Anfang November den Probebetrieb aufgenommen. Das Projekt hat ein Volumen vonrund zwei Mio. EUR.
Die Nebelwarnanlage befindet sich auf der A1 West Autobahn zwischen Kilometer 232 und Kilometer242 im oberösterreichischen Seengebiet und ist die erste ihrer Art in Europa. Neunzehn im Abstandvon 600 Metern installierte Messsysteme ermitteln die Sichtverhältnisse entlang der Strecke. Sobalddie Sichtweite ein bestimmtes Maß unterschreitet, wird automatisch eine Warnung ausgelöst.Gleichzeitig wird auch die Nebelwarn-Zentrale in der Autobahnmeisterei (ABM) Seewalchenalarmiert. Über sechs Videoquerschnitte können sich die Mitarbeiter der ABM einen Überblickverschaffen, die Funktion der Anlage überprüfen, gegebenenfalls zusätzliche Informationeneinblenden oder bei Unfällen rasch die notwendigen Alarmierungen vornehmen. Zusätzlich zu denMessdaten der Sichtweitesensoren werden über Wetter- und Umweltstationen ergänzendeInformationen ins System übertragen.
Zur Information der Autofahrer dienen fünf im Abstand von zwei Kilometern installierteAnzeigequerschnitte, die mit Wechselverkehrszeichen auf LED (Light Emitting Diode)-Basisausgestattet sind. Eine automatische Warnung erfolgt bei Nebel oder starkem Schneefall. Zusätzlichbesteht auch die Möglichkeit zur manuellen Eingabe von Warnungen sowie von Hinweisen aufBaustellen, Unfälle, Staus oder laufende Servicearbeiten.

Annex 6 Literature review for the Fog Warning System
9 (17)
Seit Anfang November befindet sich die Anlage im Testbetrieb. Dabei wird das System in dennächsten Monaten zunächst manuell über die Zentrale gesteuert, der vollautomatische Betriebgetestet sowie die Zusammenarbeit der diversen Teilsysteme wie Sichtweitesensoren,Wetterstationen und Verkehrsdatenerfassung optimiert. Auch die Reaktion der Verkehrteilnehmerauf das neue System soll untersucht werden. “Mit dieser Pilotanlage werden wir über einen längerenZeitraum nicht nur vor Nebel warnen, sondern auch das Verhalten der Autofahrer auf dieseWarnungen beobachten“, sagte Franz Lückler, Vorstandsdirektor der ASFINAG. „Nur wenn dieKraftfahrer die Warnungen ernst nehmen, können wir mittelfristig das Risiko von Nebelunfällensenken.“
Um verstärkt auf die Nebelwarnanlage und die Sichtbehinderungen im Bereich desoberösterreichischen Seengebiets hinzuweisen, werden einige der Kamerabilder, die in derNebelwarnzentrale zu sehen sind, künftig auch im Internet unter www.asfinag.at verfügbar sein.Damit können sich beispielsweise Pendler vor Fahrtantritt rasch über die aktuelle Situation in diesemnebelgefährdeten Gebiet informieren.
Pennsylvania Turnpike Commission Fog Warning System(Deatils from a presentation by Larry Bankert, (PB Farradyne) 2005.)

Annex 6 Literature review for the Fog Warning System
10 (17)

Annex 6 Literature review for the Fog Warning System
11 (17)
Tennessee Fog Detection and Warning System
In Tennessee, a fog detection and warning system implemented in 1994 significantly improved safetyas no fog-related accidents have occurred since implementation.
In December 1990, a chain-reaction collision involving 99 vehicles prompted the design andimplementation of a fog detection and warning system on Interstate 75 in southeastern Tennessee.The system covers 19 miles including a 3-mile, fog-prone section above the Hiwassee River and 8-mile sections on each side.
Center managers with Tennessee DOT access a central computer system that collects data from 2ESS, 8 fog detectors, and 44 vehicle speed detectors. By continually monitoring fog and speed sensordata, the computer system predicts and detects conditions conducive to fog formation, and alertsmanagers when established threshold criteria are met. Highway Patrol personnel visually verifyonsite conditions. The computer system correlates field sensor data with pre-determined responsescenarios, which include advising motorists of prevailing conditions via flashing beacons atop 6 staticsigns, 2 HAR transmitters, and 10 DMS; reducing speed limits using 10 VSL signs; and restrictingaccess to the affected highway section with ramp gates.
Center managers select pre-programmed DMS messages (see table below), pre-recorded HARmessages, and appropriate speed limits (i.e., 50 mi/h or 35 mi/h) based upon response scenariosproposed by the system. Under the worst-case scenario (i.e., visibility less than 240 feet), theHighway Patrol activates eight automatic ramp gates to close the interstate and detour traffic to USRoute 11.
TDOT Fog Detection/Warning System DMS Messages
Conditions Displayed Messages
ReducedSpeedDetected
Flashing "CAUTION" with "SLOW TRAFFIC AHEAD"
FogDetected
Flashing "CAUTION" with "FOG AHEAD TURN ON LOW BEAMS"

Annex 6 Literature review for the Fog Warning System
12 (17)
Flashing "FOG AHEAD" with "ADVISORY RADIO TUNE TO XXXX AM"
Flashing "FOG AHEAD" with "REDUCE SPEED TURN ON LOW BEAMS"SpeedLimitReduced
Flashing "FOG" with "SPEED LIMIT YY MPH"
Flashing "DETOUR AHEAD" with "REDUCE SPEED MERGE RIGHT"
Flashing "I-75 CLOSED" with "DETOUR w/ arrow""RoadwayClosed
Flashing "FOG AHEAD" with "ADVISORY RADIO TUNE TO XXXX AM"
There have been over 200 crashes, 130 injuries and 18 fatalities on this highway section since theinterstate opened in 1973. Since the fog detection and warning system began operating in 1994,safety has been significantly improved as no fog-related accidents have occurred.
Automated Fog and Smoke Warning system in Georgia
A heavily traveled, 14-mile stretch of interstate highway in south Georgia cuts through a peat bog,which often conspires with humid air to produce fog so thick it separates drivers from reality.Occasionally, the swamp hosts forest fires ignited by lightning, and southern breezes push gusts ofsmoke into the sightline of drivers.
Many a motorist has entered the fog zone, often in the dark of night, and been taken by surprise;some have suffered injury and even death in vehicle pileups. One often-repeated story is that of astate trooper who encountered smoke and fog so thick, he could not see the blue light atop hispatrol car as he stood at the hood of the vehicle.
State and federal highway officials decided several years ago it was time to make the roadway safer,but not just for the 22,000 motorists a day who pass through this often-treacherous area. It was timeto help other drivers across the nation who fight fog, smoke, dust and blinding snow on thehighways. They requested proposals for design of a state-of-the-art visibility detection and warningsystem.
Engineers at the Georgia Tech Research Institute in Atlanta proposed a solution, and this summer, a$2.4 million, automated fog and smoke warning system is expected to become operational onInterstate 75 near Adel, Ga., just 35 miles north of the Florida state line. Georgia Department ofTransportation (GDOT) officials call it a model system that could be implemented wherever visibilityproblems regularly occur.
At the heart of the system's data collection operation is a set of 19 commercially available fogsensors. Each sensor has a transmitter and a receiver. The transmitter is angled away from thereceiver, so that in clear conditions, its light beam misses the receiver. But when fog or smokeparticles are present in the air, they scatter some of the light into the receiver. The sensor detectsthis light and sends a reading to the system's on-site computer.

Annex 6 Literature review for the Fog Warning System
13 (17)
The computer, linked to the system's components via a fiber optic network, is located inside aconcrete building alongside the interstate in the fog zone. The computer collects data not only fromthe fog sensors, but also from an adjacent weather station, speed detectors on the highway andtelevision cameras, which GDOT officials can operate remotely to scan the area. Also, the computercontains several telephone modem lines so officials can remotely upload and download data fromthe site.
The system's software analyzes data from the fog sensors, notifies GDOT officials at theTransportation Management Center (TMC) in Atlanta of potential problems and automaticallydecides what message to post on four changeable message signs on the north- and southboundoutskirts of the fog zone. The 36-foot-wide and 9-foot-high signs are attached to metal structuresbuilt over the highway.
When the fog warning system detects a decline in visibility to a certain level, it automatically notifiesthe TMC and also sends a caution to motorists via the changeable message signs. It also turns onstreetlights along the roadway. If visibility drops to a second threshold, the system again notifies theTMC and then issues a speed advisory to motorists via the signs. The system recognizes twoadditional lower levels of visibility and again alerts the TMC and issues advisories to motorists tofurther decrease their speed.
"That is when the television cameras will be useful," Gimmestad says, "because they will give localGDOT people a visual impression of conditions at the scene."
In very poor conditions, local officials may decide to close the road and detour traffic, if this iswarranted.
GTRI researchers hope to conduct a follow-up study on the warning system after it becomesoperational. "We want to study the system's maintenance requirements and accuracy," Gimmestadsays. "We also want to look at human factors, such as whether drivers are really slowing down whenthey see warnings on the changeable message signs."
In designing the warning system, GTRI engineers found that various systems, usually simpler ones,have been in use since the early 1980s. The only other similar system in the United States is one on I-75 in Tennessee, but it is not an automated system. So the system near Adel is unique in this nation,though Europe is home to several automated warning systems, Gimmestad says.
Safer Interstate Highways With Automated Fog and Smoke WarningSystem
Fog Warning system in Maryland
HAGERSTOWN - Drivers bound for the mountains of western Maryland are getting a new kind ofwarning when fog obscures a notorious stretch of Interstate 68.

Annex 6 Literature review for the Fog Warning System
14 (17)
A $230,000 system automatically activates flashing signs when visibility drops below 1,000 feet onKeysers Ridge or Big Savage Mountain, where two people died in an 89-vehicle pileup in 2003, theState Highway Administration said July 7.
When roadside sensors using infrared technology detect thick fog on the 2,800-foot peaks, they sendradio signals.
California’s Automated Fog Warning System
Tule fog, as it is called by residents of California’s Central Valley, was responsible for more than 200crashes, 130 injuries and 18 fatalities on a stretch of I-5 between 1973 and 1994. The dense fogtypically occurs during winter months. In 1995 the California Department of Transportation (Caltrans)installed an automated fog warning system that uses nine roadside weather and visibility monitoringstations and 36 detectors lodged in the pavement. A computer system provides decision support bycorrelating field sensor data with pre-determined response scenarios. Motorists are advised ofprevailing conditions via flashing beacons atop static signs, information broadcast over advisory radiofrequencies, and messages posted on dynamic message signs. Under the worst conditions, when fogis especially dense, access to affected areas of the highway is restricted. Caltrans reports that thenumber of fog-related accidents has been cut by nearly 70 percent on two stretches of I-5 andHighway 120 where the system has been installed. In 2005 the agency plans to expand the system tosections of Highway 99.
Caltrans Automated Warning System (CAWS)
Primary functions.
� Detect the presence of redused visibility� Detect the presence of congested traffic on the highway� Automatically activate changeable message signs (CMSs) to provide advanced warning to
drivers.
Automated Features
� A network of remote meteorological stations� A network of traffic speed detection stations� A network of self-illuminated CMSs

Annex 6 Literature review for the Fog Warning System
15 (17)
The Aurora Program
This is an excellent source of completed and on-going projects that focus on the testing anddeployment of advanced technologies for road weather monitoring and forecasting. Members ofAurora include departments of transportation from a number of states as well as Canadian provinces.The organization works closely with the Federal Highway Administration, university researchinstitutions, and various international groups. Improvement of existing road weather informationservices is a high priority for the organization. The program Web site is here: http://www.aurora-program.org

Annex 6 Literature review for the Fog Warning System
16 (17)
Weather warning system in Germany

Annex 6 Literature review for the Fog Warning System
17 (17)
Meteoalarm in Europe

Annex 7CROSS VALIDATION OF FOG PILOT PRODUCTS

TABLE 1 - MERGED ORIGINAL OUTPUT

TABLE 2 - MERGED OUTPUT/CROSSED VERIFICATION

TABLE 3 - MERGED AND SMOOTHED OUTPUT

TABLE 4 - MERGED AND SMOOTHED OUTPUT/CROSSED VERIFICATION

TABLE 5 – CART CALMET OUTPUT (SINGLE FIELD EVALUATION)

TABLE 6 – SAFNWC OUTPUT (SINGLE FIELD EVALUATION)