da supplement. food category sources: all life stages
TRANSCRIPT

Food Category Sources: All Life Stages
2020 Dietary Guidelines Advisory Committee Supplementary Data Analysis
Published date: July 15, 2020
U.S. Department of Agriculture
1400 Independence Avenue SW
Washington, DC 20250
U.S. Department of Health and Human Services 200 Independence Avenue SW
Washington, DC 20201
Data analysis was used by the 2020 Dietary Guidelines Advisory Committee to describe the current health and dietary intakes of Americans. The data analysis team supported the work of the 2020 Dietary Guidelines Advisory Committee by conducting the analyses. The team, which is comprised of Federal scientists with advanced degrees in nutrition, statistics, and epidemiology, included scientists from the following Departments and agencies:
United States Department of Agriculture (USDA) Center for Nutrition Policy and Promotion; Food and Nutrition Service; Food, Nutrition, and Consumer Services Agricultural Research Service; Research, Education, and Economics
United States Department of Health and Human Services (HHS) Office of Disease Prevention and Health Promotion; Office of the Assistant Secretary for Health National Cancer Institute; National Institutes of Health National Center for Health Statistics; Centers for Disease Control and Prevention
The results of the data analyses for the 2020 Advisory Committee Project are available at: https://www.dietaryguidelines.gov/2020-advisory-committee-report/data-analysis. Data analyses were used to address topics and supporting scientific questions from USDA and HHS. The results should not be interpreted as dietary guidance. To view the results in the context of the 2020 Advisory Committee’s Scientific Report visit: https://www.dietaryguidelines.gov/2020-advisory-committee-report.
Suggested citation for this data supplement: 2020 Dietary Guidelines Advisory Committee and Data Analysis Team. Data Supplement for Food Category Sources: All Life Stages. 2020 Dietary Guidelines Advisory Committee Project. Washington, DC: U.S. Department of Agriculture and U.S. Department of Health and Human Services.
Related citation: Dietary Guidelines Advisory Committee. 2020. Scientific Report of the 2020 Dietary Guidelines Advisory Committee: Advisory Report to the Secretary of Agriculture and the Secretary of Health and Human Services. U.S. Department of Agriculture, Agricultural Research Service, Washington, DC.
This data supplement is being published by the USDA. More information about the sources of the analysis is available at the bottom of each table of results. The contents of this document may be used and reprinted without permission. Endorsements by the USDA of derivative products developed from this work may not be stated or implied.
In accordance with Federal civil rights law and USDA civil rights regulations and policies, the USDA, its Agencies, offices, and employees, and institutions participating in or administering USDA programs are prohibited from discriminating based on race, color, national origin, religion, sex, gender identity (including gender expression), sexual orientation, disability, age, marital status, family/parental status, income derived from a public assistance program, political beliefs, or reprisal or retaliation for prior civil rights activity, in any program or activity conducted or funded by USDA (not all bases apply to all programs). Remedies and complaint filing deadlines vary by program or incident.
Persons with disabilities who require alternative means of communication for program information (e.g., Braille, large print, audiotape, American Sign Language, etc.) should contact the responsible Agency or USDA's TARGET Center at (202) 720-2600 (voice and TTY) or contact USDA through the Federal Relay Service at (800) 877-8339.
To file a program discrimination complaint, complete the USDA Program Discrimination Complaint Form, AD-3027, found online at How to File a Program Discrimination Complaint and at any USDA office or write a letter addressed to USDA and provide in the letter all of the information requested in the form. To request a copy of the complaint form, call (866) 632-9992. Submit your completed form or letter to USDA by: (1) mail: U.S. Department of Agriculture, Office of the Assistant Secretary for Civil Rights, 1400 Independence Avenue, SW, Washington, D.C. 20250-9410; (2) fax: (202) 690-7442; or (3) email: [email protected].
USDA is an equal opportunity provider, employer, and lender.

ACKNOWLEDGEMENTS
Data Analysis and Food Pattern Modeling Cross-Cutting Working Group:
Regan Bailey, PhD, MPH, RD, Purdue University, Working Group Chair
Jamy Ard, MD, Wake Forest School of Medicine
Teresa Davis, PhD, Baylor College of Medicine
Timothy Naimi, MD, MPH, Boston University
Jamie Stang, PhD, MPH, RD, University of Minnesota
Barbara Schneeman, PhD, University of California, Davis, Chair of the 2020 Dietary GuidelinesAdvisory Committee
Data Analysis Team:
TusaRebecca Pannucci, PhD, MPH, RD, Center for Nutrition Policy and Promotion,Food and Nutrition Service, U.S. Department of Agriculture (USDA), Team Lead
Jaspreet Ahuja, Methods of Application of Food Composition Laboratory, AgriculturalResearch Service, USDA
Joseph Goldman, MA, Food Surveys Research Group, Agricultural Research Service,USDA
Heather C. Hamner, PhD, MS, MPH, Division of Nutrition, Physical Activity, andObesity, Centers for Disease Control and Prevention, U.S. Department of Health andHuman Services (HHS)
Kirsten Herrick, PhD, MSc, National Cancer Institute, National Institutes of Health, HHS
Hazel Hiza, PhD, RD, Center for Nutrition Policy and Promotion, Food and NutritionService, USDA
Kristin Koegel, MBA, RD, Center for Nutrition Policy and Promotion, Food and NutritionService, USDA
Kevin Kuczynski, MS, RD, Center for Nutrition Policy and Promotion, Food andNutrition Service, USDA
Alanna Moshfegh, MS, RD, Food Surveys Research Group, Agricultural ResearchService, USDA
Melissa Nickle, MS, Food Surveys Research Group, Agricultural Research Service,USDA
Lauren O’Conner, PhD, MPH, National Cancer Institute, National Institutes of Health,HHS
Cynthia Ogden, PhD, MRP, National Center for Health Statistics, Centers for DiseaseControl and Prevention, HHS
Jill Reedy, PhD, MPH, RD, National Cancer Institute, National Institutes of Health, HHS
Donna Rhodes, MS, RD, Food Surveys Research Group, Agricultural ResearchService, USDA

Marissa Shams-White, PhD, MS, MPH, National Cancer Institute, National Institutes ofHealth, HHS
Cheyenne Swanson, MS (through February 2020), Panum Group
Edwina Wambogo, PhD, MPH, RD, Office of Dietary Supplements, National Institutesof Health, HHS
Federal Liaison:
Kellie O. Casavale, PhD, RD, Center for Food Safety and Applied Nutrition, Office ofNutrition and Food Labeling, HHS
Project Leadership:
Eve Stoody, PhD, Designated Federal Officer and Director, Office of NutritionGuidance and Analysis, Center for Nutrition Policy and Promotion, Food and NutritionService, USDA
Janet de Jesus, MS, RD, Nutrition Advisor, Office of Disease Prevention and HealthPromotion, Office of the Assistant Secretary for Health, HHS
INTRODUCTION
The Data Supplement for Food Category Sources: All Life Stages includes the results of the data analyses conducted for the 2020 Dietary Guidelines Advisory Committee by the data analysis team. The findings are further summarized within the Scientific Report of the 2020 Dietary Guidelines Advisory Committee (see Part D: Chapters 1, 10, 11, 12, and 13), available at: https://www.dietaryguidelines.gov/2020-advisory-committee-report.
The Advisory Committee, with support from Federal staff, developed a protocol, or plan, that described how the scientific questions would be addressed using data analysis. The protocol included an analytic framework that described the overall scope and the approach used to answer the question and an analytic plan that detailed the data and subsequent analysis to be considered. More information on the data analyses conducted for the 2020 Dietary Guidelines Advisory Committee, including the protocols, is available at: https://www.dietaryguidelines.gov/2020-advisory-committee-report/data-analysis.
The Committee examined a collection of analyses to answer these questions. Key nationally representative, Federal data sources included the National Health and Nutrition Examination Survey (NHANES), the National Health Interview Survey (NHIS), and Surveillance, Epidemiology and End Results (SEER). More information about the data source used in the analysis is included in each report within this data supplement.
The Committee developed conclusion statements for each question answered using data analysis. The conclusion statements describe the state of the science, based on the evidence considered, in order to answer the specific question examined. The conclusion statements are described in the 2020 Dietary Guidelines Advisory Committee’s Scientific Report, available at: https://www.dietaryguidelines.gov/2020-advisory-committee-report.

LIST OF INCLUDED RESULTS
The Data Analysis Supplement for Food Category Sources: All Life Stages includes the following reports:
Section 1. Sources of Food Group Intakes
Section 2: Sources of Nutrients
Section 3. Sources of Energy
Section 4. Sources of Energy by Race/Ethnicity and Income
Section 5. Food Sources of Food Group Intakes Among Infants and Toddlers
Section 6. Food Sources of Nutrients Among Infants and Toddlers
.

SOURCES OF FOOD GROUP
INTAKES NHANES 2013-16
Acknowledgements The following individuals represent the team who produced this analysis: Edwina Wambogo1
Jill Reedy1
Marissa Shams-White1
National Cancer Institute, NIH

i
TABLE OF CONTENTS Acknowledgements ..................................................................................................................................
Sources of Food Groups Intake among the U.S. Population, 2013-16 ............................................. 1
Objective ......................................................................................................................................... 1
Methods .......................................................................................................................................... 1
Key Findings ................................................................................................................................... 1
Table A: List of specific foods: Major categories and sub-categories for Dietary Guidelines 2020
analysis – Assignment of WWEIA (WWEIA) Food Categories ........................................................ 4
DAIRY ............................................................................................................................................. 4
PROTEIN FOODS .......................................................................................................................... 4
GRAINS .......................................................................................................................................... 6
SNACKS AND SWEETS ................................................................................................................. 6
FRUITS and FRUIT JUICE ........................................................................................................... 7
VEGETABLES ................................................................................................................................ 7
BEVERAGES (NOT INCL. MILK AND 100% FRUIT JUICE) * ................................................... 7
CONDIMENTS, GRAVIES, SPREADS, SALAD DRESSINGS ...................................................... 8
LIST OF TABLES ........................................................................................................................... 9
LIST OF FIGURES ....................................................................................................................... 13
Percent of total fruits intake, 2013-16, for U.S. population ages 2 years and older, from WWEIA
Food Categories ............................................................................................................................... 17
WHOLE SAMPLE (MALES + FEMALES) .................................................................................. 17
MALES.......................................................................................................................................... 20
FEMALES ..................................................................................................................................... 23
Percent of total vegetables intake, 2013-16, for age/sex groups of the U.S. population from
WWEIA Food Categories ................................................................................................................. 32
WHOLE SAMPLE (MALES + FEMALES) .................................................................................. 32
MALES.......................................................................................................................................... 35
FEMALES ..................................................................................................................................... 38
Percent of total grains intake, 2013-16, for U.S. population ages 2 years and older, from WWEIA
Food Categories ............................................................................................................................... 48
WHOLE SAMPLE (MALES + FEMALES) .................................................................................. 48
MALES.......................................................................................................................................... 51
FEMALES ..................................................................................................................................... 54
Percent of total whole grains intake, 2013-16, for U.S. population ages 2 years and older, from
WWEIA Food Categories ................................................................................................................. 63

ii WHOLE SAMPLE (MALES + FEMALES) .................................................................................. 63
MALES.......................................................................................................................................... 66
FEMALES ..................................................................................................................................... 69
Percent of total refined grains intake, 2013-16, for U.S. population ages 2 years and older, from
WWEIA Food Categories ................................................................................................................. 79
WHOLE SAMPLE (MALES + FEMALES) .................................................................................. 79
MALES.......................................................................................................................................... 82
FEMALES ..................................................................................................................................... 85
Percent of total protein foods intake, 2013-16, for U.S. population ages 2 years and older, from
WWEIA Food Categories ................................................................................................................. 94
WHOLE SAMPLE (MALES + FEMALES) .................................................................................. 94
MALES ......................................................................................................................................... 97
FEMALES ................................................................................................................................... 100
Percent of red meat intake, 2013-16, for U.S. population ages 2 years and older, from WWEIA
Food Categories ............................................................................................................................. 110
WHOLE SAMPLE (MALES + FEMALES) ................................................................................ 110
MALES ....................................................................................................................................... 113
FEMALES ................................................................................................................................... 116
Percent of cured meats intake, 2013-16, for U.S. population ages 2 years and older, from
WWEIA Food Categories ............................................................................................................... 126
WHOLE SAMPLE (MALES + FEMALES) ................................................................................ 126
MALES........................................................................................................................................ 129
FEMALES ................................................................................................................................... 132
Percent of total dairy intake, 2013-16, for U.S. population ages 2 years and older, from WWEIA
Food Categories ............................................................................................................................. 142
WHOLE SAMPLE (MALES + FEMALES) ................................................................................ 142
MALES........................................................................................................................................ 145
FEMALES ................................................................................................................................... 148
Percent of milk intake, 2013-16, for U.S. population ages 2 years and older, from WWEIA Food
Categories ....................................................................................................................................... 157
WHOLE SAMPLE (MALES + FEMALES) ................................................................................ 157
MALES........................................................................................................................................ 160
FEMALES ................................................................................................................................... 163
Percent of cheese intake, 2013-16, for U.S. population ages 2 years and older, from WWEIA
Food Categories ............................................................................................................................. 172

iii WHOLE SAMPLE (MALES + FEMALES) ................................................................................ 172
MALES........................................................................................................................................ 175
FEMALES ................................................................................................................................... 178
Percent of oils intake, 2013-16, for U.S. population ages 2 years and older, from WWEIA Food
Categories ....................................................................................................................................... 188
WHOLE SAMPLE (MALES + FEMALES) ................................................................................ 188
MALES........................................................................................................................................ 191
FEMALES ................................................................................................................................... 194
Percent of solid fats intake, 2013-16, for U.S. population ages 2 years and older, from WWEIA
Food Categories ............................................................................................................................. 204
WHOLE SAMPLE (MALES + FEMALES) ................................................................................ 204
MALES........................................................................................................................................ 207
FEMALES ................................................................................................................................... 210
Percent of added sugars intake, 2013-16, for U.S. population ages 2 years and older, from
WWEIA Food Categories ............................................................................................................... 220
WHOLE SAMPLE (MALES + FEMALES) ................................................................................ 220
MALES........................................................................................................................................ 224
FEMALES ................................................................................................................................... 228
References ...................................................................................................................................... 242

1
2020 Dietary Guidelines Advisory Committee Data Supplement: Food Category Sources
https://www.dietaryguidelines.gov/2020-advisory-committee-report/data-analysis
Sources of food group intake among the U.S. population,
2013-16
Objective
The purpose of this research was to identify the major contributors to food group intake among the U.S. population.
Methods
We used the 2013-16 National Health and Nutrition Examination Survey (NHANES) data to determine the weighted population contribution of food categories to energy intake. We categorized the NHANES dietary data into 150 mutually exclusive What We Eat In America (WWEIA) Food Categories [1]. We further regrouped these 150 food categories into 9 major categories and 36 sub-categories. The focus of the food categorization system is to group similar foods and beverages on the basis of usage and nutrient content. Each food within the categories is linked to the food codes in the Food and Nutrient Database for Dietary Studies (FNDDS), which provides ingredient proportions and nutrient values [2]. Additionally, the Food Patterns Equivalents Database (FPED) data [3], was used to determine food groupings.

1
Table A.
List of specific foods: Major categories and sub-categories for Dietary Guidelines 2020
analysis – Assignment of What We Eat In America (WWEIA) Food Categories.
Table 1.1 - 14.9
There are 87 tables for the percentage contribution of various food groups to total fruits, total vegetables, total grains, whole grains, refined grains, total proteins, red meat, cured meats, total dairy, milk, cheese, oils, solid fats, and added sugars intake.
Figure 1.1 - 14.9
There are 87 figures for the percentage contribution of various food groups to total fruits, total vegetables, total grains, whole grains, refined grains, total proteins, red meat, cured meats, total dairy, milk, cheese, oils, solid fats, and added sugars intake.
Selected Key Findings
Total fruits:
By major category: Overall, the top source of total fruits intake was fruits and fruit juice.
All sex-age groups consumed most of their fruits as whole fruit, compared to 100% fruit
juice. Compared to other age groups, adults aged adults 51 years and older consumed
the largest proportion of their fruits as whole fruit. Females of all age groups, also
consumed a larger proportion of their fruits as whole fruit, compared to males.
For most age groups, the second largest source of fruit intake was beverages (Not Incl.
Milk and 100% Fruit Juice). However, snacks and sweets was the second largest source
for adults 51 years and older.
By subcategory: The top five sources included fruit; 100% fruit juice; sugar-sweetened
and diet vegetables; desserts and sweet snacks; and breakfast cereals and bars.
Total Vegetables:
By major category: Overall, the top two sources were vegetables and mixed dishes.
Children and adolescents 6-19 years, and males 20-40 years, obtained most of their
vegetables from mixed dishes. Males 2-19 years, and females 6-11 years, consumed a
larger proportion of starchy vegetables, compared to dark green vegetables, orange
vegetables, and legumes.
2020 Dietary Guidelines Advisory Committee Data Supplement: Food Category Sources
https://www.dietaryguidelines.gov/2020-advisory-committee-report/data-analysis

2
By subcategory: The top five sources included vegetables; starchy vegetables; burgers
and sandwiches; rice, pasta, and other-grain based mixed dishes; and chips, crackers,
and savory snacks.
Total grains:
By major category: Overall, the top sources were mixed dishes and grains.
By sub-category: Overall, the top source was burgers and sandwiches. Yeast breads and
tortillas provided the second largest proportion of total grains intake among adults 41
years and older, and rice, pasta and other grain-based mixed dishes for those aged 2-40
years.
Whole grains:
By major category: Overall, the top sources were grains and mixed dishes. Although
mixed dishes was the second top source for most males, except those aged 41-50 years,
snacks and sweets was the second top source of whole grains for females.
By sub-category: Overall, the top source was breakfast cereals and cereal bars. The
second top source for males was burgers and sandwiches. For females, chips, crackers,
and savory snacks provided the second top source, except for females 12-19 years, and
females 51 years and older, who also obtained the second largest proportion of whole
grains from burgers and sandwiches.
Refined grains:
By major category: Overall, the top source was mixed dishes. Grains was the second top
source for all sex-age groups, except for children 2-5 years, whose second top source was
snacks and sweets.
By sub-category: The top sources were burgers and sandwiches for most sex-age groups;
yeast breads and tortillas for adults 41 years and older; and rice, pasta, and other grain
based mixed dishes for those 12-40 years. Chips, crackers, and savory snacks provided
the second largest proportion of refined grains for males 2-5 years, and females 6-11
years.
Total proteins:
By major category: The two top sources of total protein foods intake, for all sex-age
groups, were mixed dishes and protein foods.
2020 Dietary Guidelines Advisory Committee Data Supplement: Food Category Sources
https://www.dietaryguidelines.gov/2020-advisory-committee-report/data-analysis

3
By sub-category: Burgers and sandwiches provided the largest proportion of total
proteins for all sex-age groups. The other two sources were poultry (not Incl. deli) and
meat, poultry and seafood mixed dishes.
Total dairy:
By major category: Overall, the top two sources were dairy and mixed dishes. For adults
20-50 years, mixed dishes provided the largest proportion of total dairy intake.
By sub-category: Overall, the top five sources were high fat milk/yogurt; burgers and
sandwiches; cheese; low-fat milk/yogurt; and pizza. For many sex-age groups, the top
source was higher fat milk/yogurt. However, for males 20-70 years and females 20-40
years, the top source was burgers and sandwiches. For children 2-11 years, both male
and female, the second top source was low-fat milk/yogurt.
Solid fats:
By major category: Overall, the top source of solid fats intake was mixed dishes.
However, for females aged 2-5 years, the top source of solid fats intake was dairy. For
males 2-5 years, dairy was the second top source, and for most other sex-age groups, the
second top source was snacks and sweets.
By sub-category: Overall, the top five sources of solid fat were burgers and sandwiches;
desserts and sweet snacks; rice, pasta, and other grain-based mixed dishes; higher fat
milk/yogurt; and pizza.
Added sugars:
By major category: Overall, the top source was beverages (not Incl. milk and 100%
juice). However, for children 2-11 years and for adults 71 years and older, snacks and
sweets was the top source of added sugars intake.
By sub-category: Overall, the top five sources of added sugars were sugar-sweetened and
diet beverages; desserts and sweet snacks; coffee and tea; candy and sugars; and
breakfast cereals and bars. For adults 20 years and older, coffee and tea provided a
larger proportion of added sugars.
2020 Dietary Guidelines Advisory Committee Data Supplement: Food Category Sources
https://www.dietaryguidelines.gov/2020-advisory-committee-report/data-analysis

4
2020 Dietary Guidelines Advisory Committee Data Supplement: Food Category Sources
https://www.dietaryguidelines.gov/2020-advisory-committee-report/data-analysis
Table A: List of specific foods: Major categories and sub-
categories for Dietary Guidelines 2020 analysis –
Assignment of What We Eat In America (WWEIA) Food
Categories
Major categories (n=9) and sub-categories (n=36) for DGAC analyses of contributions of
food category intake to energy intake.
MAJOR CATEGORY
SUB- CATEGORY
WWEIA CATEGORY
SPECIFIC CATEGORY FROM WWEIA
DAIRY
LOW-FAT MILK/YOGURT 1006 Milk, low-fat
1008 Milk, nonfat
1206 Flavored milk, low-fat
1208 Flavored milk, nonfat
1404 Milk substitutes
HIGHER FAT MILK/YOGURT 1002 Milk, whole
1004 Milk, reduced fat
1202 Flavored milk, whole
1204 Flavored milk, reduced fat
1402 Milk shakes and other dairy drinks
1820 Yogurt, regular
1822 Yogurt, Greek
CHEESE
1602 Cheese
1604 Cottage/ricotta cheese
PROTEIN FOODS
MEATS (Not Incl. Deli and Mixed Dishes)
2002 Beef, excludes ground
2004 Ground beef
2006 Pork
2008 Lamb, goat, game
2010 Liver and organ meats
DELI/CURED PRODUCTS (Meat and Poultry)
2602 Cold cuts and cured meats
2604 Bacon
2606 Frankfurters
2608 Sausages POULTRY (Not Incl. Deli and Mixed Dishes)

5
2020 Dietary Guidelines Advisory Committee Data Supplement: Food Category Sources
https://www.dietaryguidelines.gov/2020-advisory-committee-report/data-analysis
2202 Chicken, whole pieces
2204 Chicken patties, nuggets and tenders
2206 Turkey, duck, other poultry
SEAFOOD (Not Incl. Mixed Dishes)
2402 Fish
2404 Shellfish
EGGS
2502 Eggs and omelets NUTS, SEEDS, AND SOY
2804 Nuts and seeds
2806 Processed soy products
MIXED DISHES PIZZA
3602 Pizza BURGERS AND SANDWICHES (Incl. Tacos and Burritos)
3702 Burgers (single code)
3704 Chicken/turkey sandwiches (single code)
3706 Egg/breakfast sandwiches (single code)
3708 Other sandwiches (single code+ combo codes)
3502 Burritos and Tacos
3703 Frankfurter sandwiches (single code + combo codes)
3720 Cheese sandwiches (single code +combo codes)
3722 Peanut butter and jelly sandwiches(single code + combo codes)
MEAT, POULTRY, SEAFOOD MIXED DISHES 3002 Meat mixed dishes
3004 Poultry mixed dishes
3006 Seafood mixed dishes
3404 Stir-fry and soy-based sauce mixtures
RICE, PASTA AND OTHER GRAIN-BASED MIXED DISHES 3202 Rice mixed dishes
3204 Pasta mixed dishes, excludes macaroni and cheese
3206 Macaroni and cheese
3208 Turnovers and other grain-based items
3402 Fried rice and lo/chow mein
3406 Egg rolls, dumplings, sushi 3506 Other Mexican mixed dishes

6
2020 Dietary Guidelines Advisory Committee Data Supplement: Food Category Sources
https://www.dietaryguidelines.gov/2020-advisory-committee-report/data-analysis
SOUPS 3802 Soups
GRAINS
RICE AND PASTA 4002 Rice
4004 Pasta, noodles, cooked grains
YEAST BREADS AND TORTILLAS 4202 Yeast breads
4204 Rolls and buns
4206 Bagels and English muffins
4208 Tortillas
QUICK BREADS (Biscuits, Muffins, Pancakes, Waffles) 4402 Biscuits, muffins, quick breads
4404 Pancakes, waffles, French toast
BREAKFAST CEREALS AND BARS 4602 Ready-to-eat cereal, higher sugar
(>21.2g/100g) 4604 Ready-to-eat cereal, lower sugar
(≤21.2g/100g) 4802 Oatmeal
4804 Grits and other cooked cereals
5402 Cereal bars
5404 Nutrition bars
SNACKS AND SWEETS
CHIPS, CRACKERS, AND SAVORY SNACKS 5002 Potato chips
5004 Tortilla, corn, other chips
5006 Popcorn
5008 Pretzels/snack mix
5202 Crackers, excludes saltines
5204 Saltine crackers
3504 Nachos
DESSERTS AND SWEET SNACKS 5502 Cakes and pies
5504 Cookies and brownies
5506 Doughnuts, sweet rolls, pastries
5802 Ice cream and frozen dairy desserts
5804 Pudding
5806 Gelatins, ices, sorbets
CANDY AND SUGARS 5702 Candy containing chocolate
5704 Candy not containing chocolate 8802 Sugars and honey

7
2020 Dietary Guidelines Advisory Committee Data Supplement: Food Category Sources
https://www.dietaryguidelines.gov/2020-advisory-committee-report/data-analysis
8804 Sugar substitutes
8806 Jams, syrups, toppings
FRUITS and FRUIT JUICE
FRUIT (Non-Juice) 6002 Apples
6004 Bananas
6006 Grapes
6008 Peaches and nectarines
6010 Berries
6012 Citrus fruits
6014 Melons
6016 Dried fruits
6018 Other fruits and fruit salads
100% FRUIT JUICE 7002 Citrus juice
7004 Apple juice
7006 Other fruit juice
VEGETABLES
VEGETABLES (Incl. Beans and Peas, not Starchy) 6402 Tomatoes 6404 Carrots
6406 Other red and orange vegetables
6408 Dark green vegetables, excludes lettuce
6410 Lettuce and lettuce salads (Incl. combo codes)
6412 String beans
6414 Onions
8410 Pasta sauces, tomato-based
6420 Other vegetables and combinations
6422 Vegetable mixed dishes
7008 Vegetable juice
2802 Beans, peas, legumes
STARCHY VEGETABLES
6416 Corn
6418 Other starchy vegetables
6802 White potatoes, baked or boiled
6804 French fries and other fried white potatoes
6806 Mashed potatoes and white potato mixtures
BEVERAGES (NOT INCL. MILK AND 100% FRUIT JUICE) *
SUGAR-SWEETENED AND DIET BEVERAGES

8
2020 Dietary Guidelines Advisory Committee Data Supplement: Food Category Sources
https://www.dietaryguidelines.gov/2020-advisory-committee-report/data-analysis
7102 Diet soft drinks
7104 Diet sport and energy drinks
7106 Other diet drinks
7202 Soft drinks
7204 Fruit drinks
7206 Sport and energy drinks
7208 Nutritional beverages
7802 Flavored or carbonated water
7220 Smoothies and grain drinks
COFFEE AND TEA
7302 Coffee
7304 Tea ALCOHOLIC BEVERAGES
7502 Beer
7504 Wine
7506 Liquor and cocktails
WATERS 7702 Tap water
7704 Bottled water
7804 Enhanced or fortified water
CONDIMENTS, GRAVIES, SPREADS, SALAD DRESSINGS
CONDIMENTS AND GRAVIES 8402 Tomato-based condiments
8404 Soy-based condiments
8406 Mustard and other condiments
8408 Olives, pickles, pickled vegetables
8412 Dips, gravies, other sauces
SPREADS 8002 Butter and animal fats
8004 Margarine
8006 Cream cheese, sour cream, whipped cream
8008 Cream and cream substitutes
SALAD DRESSINGS 8010 Mayonnaise
8012 Salad dressings and vegetable oils

9
2020 Dietary Guidelines Advisory Committee Data Supplement: Food Category Sources
https://www.dietaryguidelines.gov/2020-advisory-committee-report/data-analysis
LIST OF TABLES*
Table 1. 1: Males and Females - Distribution of total fruits intake (percentages) across major
categories ......................................................................................................................................... 17
Table 1. 2: Males and Females - Distribution of total fruits intake (percentages) across sub-
categories ......................................................................................................................................... 18
Table 1. 3: Males - Distribution of total fruits intake (percentages) across major categories ....... 20
Table 1. 4: Males - Distribution of total fruits intake (percentages) across sub-categories .......... 21
Table 1. 5: Females - Distribution of total fruits intake (percentages) across major categories ... 23
Table 1. 6: Females - Distribution of total fruits intake (percentages) across sub-categories ....... 24
Table 2. 1: Males and Females – Distribution of total vegetables intake (percentages) across
major categories ............................................................................................................................... 32
Table 2. 2: Males and Females - Distribution of total vegetables intake (percentages) across sub-
categories ......................................................................................................................................... 33
Table 2. 3: Males - Distribution of total vegetables intake (percentages) across major categories
.................................................................................................................................................................... 35
Table 2. 4: Males - Distribution of total vegetables intake (percentages) across sub-categories . 36
Table 2. 5: Females - Distribution of total vegetables intake (percentages) across major
categories ......................................................................................................................................... 38
Table 2. 6: Females - Distribution of total vegetables intake (percentages) across sub-categories
.................................................................................................................................................................... 39
Table 3. 1: Males and Females - Distribution of total grains intake (percentages) across major
categories ......................................................................................................................................... 48
Table 3. 2: Males and Females - Distribution of total grains intake (percentages) across sub-
categories ......................................................................................................................................... 49
Table 3. 3: Males - Distribution of total grains intake (percentages) across major categories ..... 51
Table 3. 4: Males - Distribution of total grains intake (percentages) across sub-categories ......... 52
Table 3. 5: Females - Distribution of total grains intake (percentages) across major categories . 54
Table 3. 6: Females - Distribution of total grains intake (percentages) across sub-categories ..... 55
Table 4. 1: Males and Females- Distribution of total whole grains intake (percentages) across
major categories ............................................................................................................................... 63
Table 4. 2: Males and Females- Distribution of total whole grains intake (percentages) across
sub-categories .................................................................................................................................. 64
Table 4. 3: Males - Distribution of total whole grains intake (percentages) across major
categories ......................................................................................................................................... 66
Table 4. 4: Males - Distribution of total whole grains intake (percentages) across sub-categories
.................................................................................................................................................................... 67
Table 4. 5: Females- Distribution of total whole grains intake (percentages) across major
categories ......................................................................................................................................... 69
Table 4. 6: Females- Distribution of total whole grains intake (percentages) across sub-
categories ......................................................................................................................................... 70

10
2020 Dietary Guidelines Advisory Committee Data Supplement: Food Category Sources
https://www.dietaryguidelines.gov/2020-advisory-committee-report/data-analysis
Table 5. 1: Males and Females- Distribution of total refined grains intake (percentages) across
major categories ............................................................................................................................... 79
Table 5. 2: Males and Females- Distribution of total refined grains intake (percentages) across
sub-categories .................................................................................................................................. 80
Table 5. 3: Males - Distribution of total refined grains intake (percentages) across major
categories ......................................................................................................................................... 82
Table 5. 4: Males - Distribution of total refined grains intake (percentages) across sub-categories
.................................................................................................................................................................... 83
Table 5. 5: Females- Distribution of total refined grains intake (percentages) across major
categories ......................................................................................................................................... 85
Table 5. 6: Females- Distribution of total refined grains intake (percentages) across sub-
categories ......................................................................................................................................... 86
Table 6. 1: Males and Females- Distribution of total protein intake (percentages) across major
categories ......................................................................................................................................... 94
Table 6. 2: Males and Females- Distribution of total protein intake (percentages) across sub-
categories ......................................................................................................................................... 95
Table 6. 3: Males - Distribution of total protein intake (percentages) across major categories ... 97
Table 6. 4: Males - Distribution of total protein intake (percentages) across sub-categories ....... 98
Table 6. 5: Females- Distribution of total protein intake (percentages) across major categories
.................................................................................................................................................................. 100
Table 6. 6: Females- Distribution of total protein intake (percentages) across sub-categories .. 101
Table 7. 1: Males and Females- Distribution of red meat intake (percentages) across major
categories ....................................................................................................................................... 110
Table 7. 2: Males and Females- Distribution of red meat intake (percentages) across sub-
categories ....................................................................................................................................... 111
Table 7. 3: Males - Distribution of red meat intake (percentages) across major categories ....... 113
Table 7. 4: Males - Distribution of red meat intake (percentages) across sub-categories ........... 114
Table 7. 5: Females- Distribution of red meat intake (percentages) across major categories ..... 116
Table 7. 6: Females- Distribution of red meat intake (percentages) across sub-categories ........ 117
Table 8. 1: Males and Females- Distribution of cured meats intake (percentages) across major
categories ....................................................................................................................................... 126
Table 8. 2: Males and Females- Distribution of cured meats intake (percentages) across sub-
categories ....................................................................................................................................... 127
Table 8. 3: Males - Distribution of cured meats intake (percentages) across major categories .. 129
Table 8. 4: Males - Distribution of cured meats intake (percentages) across sub-categories ..... 130
Table 8. 5: Females- Distribution of cured meats intake (percentages) across major categories
.................................................................................................................................................................. 132
Table 8. 6: Females- Distribution of cured meats intake (percentages) across sub-categories .. 133
11
2020 Dietary Guidelines Advisory Committee Data Supplement: Food Category Sources
https://www.dietaryguidelines.gov/2020-advisory-committee-report/data-analysis
Table 9. 1: Males and Females - Distribution of total dairy intake (percentages) across major
categories ....................................................................................................................................... 142
Table 9. 2: Males and Females - Distribution of total dairy intake (percentages) across sub-
categories ....................................................................................................................................... 143
Table 9. 3: Males - Distribution of total dairy intake (percentages) across major categories ..... 145
Table 9. 4: Males - Distribution of total dairy intake (percentages) across sub-categories ........ 146
Table 9. 5: Females - Distribution of total dairy intake (percentages) across major categories . 148
Table 9. 6: Females - Distribution of total dairy intake (percentages) across sub-categories..... 149
Table 10. 1: Males and Females- Distribution of milk intake (percentages) across major
categories ....................................................................................................................................... 157
Table 10. 2: Males and Females- Distribution of milk intake (percentages) across sub-categories
.................................................................................................................................................................. 158
Table 10. 3: Males - Distribution of milk intake (percentages) across major categories ............. 160
Table 10. 4: Males - Distribution of milk intake (percentages) across sub-categories ................ 161
Table 10. 5: Females- Distribution of milk intake (percentages) across major categories .......... 163
Table 10. 6: Females- Distribution of milk intake (percentages) across sub-categories ............. 164
Table 11. 1: Males and Females- Distribution of cheese intake (percentages) across major
categories ....................................................................................................................................... 172
Table 11. 2: Males and Females- Distribution of cheese intake (percentages) across sub-
categories ....................................................................................................................................... 173
Table 11. 3: Males - Distribution of cheese intake (percentages) across major categories .......... 175
Table 11. 4: Males - Distribution of cheese intake (percentages) across sub-categories ............. 176
Table 11. 5: Females- Distribution of cheese intake (percentages) across major categories ....... 178
Table 11. 6: Females- Distribution of cheese intake (percentages) across sub-categories .......... 179
Table 12. 1: Males and Females - Distribution of oils intake (percentages) across major
categories ....................................................................................................................................... 188
Table 12. 2: Males and Females - Distribution of oils intake (percentages) across sub-categories
.................................................................................................................................................................. 189
Table 12. 3: Males - Distribution of oils intake (percentages) across major categories .............. 191
Table 12. 4: Males - Distribution of oils intake (percentages) across sub-categories .................. 192
Table 12. 5: Females - Distribution of oils intake (percentages) across major categories ........... 194
Table 12. 6: Females - Distribution of oils intake (percentages) across sub-categories .............. 195
Table 13. 1: Males and Females - Distribution of solid fats intake (percentages) across major
categories ....................................................................................................................................... 204
Table 13. 2: Males and Females - Distribution of solid fats intake (percentages) across sub-
categories ....................................................................................................................................... 205
Table 13. 3: Males - Distribution of solid fats intake (percentages) across major categories...... 207
Table 13. 4: Males - Distribution of solid fats intake (percentages) across sub-categories ......... 208
Table 13. 5: Females - Distribution of solid fats intake (percentages) across major categories .. 210

12
2020 Dietary Guidelines Advisory Committee Data Supplement: Food Category Sources
https://www.dietaryguidelines.gov/2020-advisory-committee-report/data-analysis
Table 13. 6: Females - Distribution of solid fats intake (percentages) across sub-categories ..... 211
Table 14. 1: Males and Females- Distribution of added sugars intake (percentages) across major
categories ....................................................................................................................................... 220
Table 14. 2: Males and Females- Distribution of added sugars intake (percentages) across sub-
categories ....................................................................................................................................... 221
Table 14. 3: Males and Females- Distribution of added sugars intake (percentages) across
beverage categories ........................................................................................................................ 223
Table 14. 4: Males - Distribution of added sugars intake (percentages) across major categories
.................................................................................................................................................................. 224
Table 14. 5: Males - Distribution of added sugars intake (percentages) across sub-categories .. 225
Table 14. 6: Males - Distribution of added sugars intake (percentages) across beverage categories
.................................................................................................................................................................. 227
Table 14. 7: Females - Distribution of added sugars intake (percentages) across major categories
.................................................................................................................................................................. 228
Table 14. 8: Females - Distribution of added sugars intake (percentages) across sub-categories
.................................................................................................................................................................. 229
Table 14. 9: Females - Distribution of added sugars intake (percentages) across beverage
categories ....................................................................................................................................... 231
*Note: Each data table in this section has a figure that directly corresponds with the data in thetable. Figures do not include a description as it would be a direct repetition of the data in thepreceding tables.

13
2020 Dietary Guidelines Advisory Committee Data Supplement: Food Category Sources
https://www.dietaryguidelines.gov/2020-advisory-committee-report/data-analysis
LIST OF FIGURES*
Figure 1. 1: Males and Females - Distribution of total fruits intake (percentages) across major
categories ......................................................................................................................................... 26
Figure 1. 2: Males and Females - Distribution of total fruits intake (percentages) across top 10
sub-categories .................................................................................................................................. 27
Figure 1. 3: Males - Distribution of total fruits intake (percentages) across major categories ..... 28
Figure 1. 4: Males - Distribution of total fruits intake (percentages) across top 10 sub-categories
.................................................................................................................................................................... 29
Figure 1. 5: Females - Distribution of total fruits intake (percentages) across major categories . 30
Figure 1. 6: Females - Distribution of total fruits intake (percentages) across top 10 sub-
categories ......................................................................................................................................... 31
Figure 2. 1: Males and Females - Distribution of total vegetables intake (percentages) across
major categories ............................................................................................................................... 41
Figure 2. 2: Males and Females – Distribution of total vegetables intake (percentages) across top
10 sub-categories ............................................................................................................................. 42
Figure 2. 3: Males - Distribution of total vegetables intake (percentages) across major categories
.................................................................................................................................................................... 43
Figure 2. 4: Males- Distribution of total vegetables intake (percentages) across top 10 sub-
categories ......................................................................................................................................... 44
Figure 2. 5: Females – Distribution of total vegetables intake (percentages) across major
categories ......................................................................................................................................... 45
Figure 2. 6: Females - Distribution of total vegetables intake (percentages) across top 10 sub-
categories ......................................................................................................................................... 46
Figure 3. 1: Males and Females – Distribution of total grains intake (percentages) across major
categories ......................................................................................................................................... 57
Figure 3. 2: Males and Females – Distribution of total grains intake (percentages) across top 10
sub-categories .................................................................................................................................. 58
Figure 3. 3: Males - Distribution of total grains intake (percentages) across major categories .... 59
Figure 3. 4: Males - Distribution of total grains intake (percentages) across top 10 sub-categories
.................................................................................................................................................................... 60
Figure 3. 5: Females - Distribution of total grains intake (percentages) across major categories 61
Figure 3. 6: Females – Distribution of total grains intake (percentages) across top 10 sub-
categories ......................................................................................................................................... 62
Figure 4. 1: Males and Females- Distribution of total whole grains intake (percentages) across
major categories ............................................................................................................................... 72
Figure 4. 2: Males and Females- Distribution of total whole grains intake (percentages) across
top 10 sub-categories ....................................................................................................................... 73
Figure 4. 3: Males - Distribution of total whole grains intake (percentages) across major
categories ......................................................................................................................................... 74

14
2020 Dietary Guidelines Advisory Committee Data Supplement: Food Category Sources
https://www.dietaryguidelines.gov/2020-advisory-committee-report/data-analysis
Figure 4. 4: Males - Distribution of total whole grains intake (percentages) across top 10 sub-
categories ......................................................................................................................................... 75
Figure 4. 5: Females- Distribution of total whole grains intake (percentages) across major
categories ......................................................................................................................................... 76
Figure 4. 6: Females- Distribution of total whole grains intake (percentages) across top 10 sub-
categories ......................................................................................................................................... 77
Figure 5. 1: Males and Females- Distribution of total refined grains intake (percentages) across
major categories ............................................................................................................................... 88
Figure 5. 2: Males and Females- Distribution of total refined grains intake (percentages) across
top 10 sub-categories ....................................................................................................................... 89
Figure 5. 3: Males - Distribution of total refined grains intake (percentages) across major
categories ......................................................................................................................................... 90
Figure 5. 4: Males - Distribution of total refined grains intake (percentages) across top 10 sub-
categories ......................................................................................................................................... 91
Figure 5. 5: Females- Distribution of total refined grains intake (percentages) across major
categories ......................................................................................................................................... 92
Figure 5. 6: Females- Distribution of total refined grains intake (percentages) across top 10 sub-
categories ......................................................................................................................................... 93
Figure 6. 1: Males and Females- Distribution of total protein intake (percentages) across major
categories ....................................................................................................................................... 103
Figure 6. 2: Males and Females- Distribution of total protein intake (percentages) across top 10
sub-categories ................................................................................................................................ 104
Figure 6. 3: Males - Distribution of total protein intake (percentages) across major categories 105
Figure 6. 4: Males - Distribution of total protein intake (percentages) across top 10 sub-
categories ....................................................................................................................................... 106
Figure 6. 5: Females- Distribution of total protein intake (percentages) across major categories
.................................................................................................................................................................. 107
Figure 6. 6: Females- Distribution of total protein intake (percentages) across top 10 sub-
categories ....................................................................................................................................... 108
Figure 7. 1: Males and Females- Distribution of red meat intake (percentages) across major
categories ....................................................................................................................................... 119
Figure 7. 2: Males and Females- Distribution of red meat intake (percentages) across top 10 sub-
categories ....................................................................................................................................... 120
Figure 7. 3: Males - Distribution of red meat intake (percentages) across major categories ...... 121
Figure 7. 4: Males - Distribution of red meat intake (percentages) across top 10 sub-categories
.................................................................................................................................................................. 122
Figure 7. 5: Females- Distribution of red meat intake (percentages) across major categories ... 123
Figure 7. 6: Females- Distribution of red meat intake (percentages) across top 10 sub-categories
.................................................................................................................................................................. 124

15
2020 Dietary Guidelines Advisory Committee Data Supplement: Food Category Sources
https://www.dietaryguidelines.gov/2020-advisory-committee-report/data-analysis
Figure 8. 1: Males and Females- Distribution of cured meats intake (percentages) across major
categories ....................................................................................................................................... 135
Figure 8. 2: Males and Females- Distribution of cured meats intake (percentages) across top 10
sub-categories ................................................................................................................................ 137
Figure 8. 3: Males - Distribution of cured meats intake (percentages) across major categories 137
Figure 8. 4: Males - Distribution of cured meats intake (percentages) across top 10 sub-
categories ....................................................................................................................................... 138
Figure 8. 5: Females- Distribution of cured meats intake (percentages) across major categories
.................................................................................................................................................................. 139
Figure 8. 6: Females- Distribution of cured meats intake (percentages) across top 10 sub-
categories ....................................................................................................................................... 140
Figure 9. 1: Males and Females - Distribution of total dairy intake (percentages) across major
categories ....................................................................................................................................... 151
Figure 9. 2: Males and Females - Distribution of total dairy intake (percentages) across top 10
sub-categories ................................................................................................................................ 152
Figure 9. 3: Males - Distribution of total dairy intake (percentages) across major categories ... 153
Figure 9. 4: Males - Distribution of total dairy intake (percentages) across top 10 sub-categories
.................................................................................................................................................................. 154
Figure 9. 5: Females - Distribution of total dairy intake (percentages) across major categories 155
Figure 9. 6: Females - Distribution of total dairy intake (percentages) across top 10 sub-
categories ....................................................................................................................................... 156
Figure 10. 1: Males and Females- Distribution of milk intake (percentages) across major
categories ....................................................................................................................................... 166
Figure 10. 2: Males and Females- Distribution of milk intake (percentages) across top 10 sub-
categories ....................................................................................................................................... 167
Figure 10. 3: Males - Distribution of milk intake (percentages) across major categories ........... 168
Figure 10. 4: Males - Distribution of milk intake (percentages) across top 10 sub-categories ... 169
Figure 10. 5: Females- Distribution of milk intake (percentages) across major categories ........ 170
Figure 10. 6: Females- Distribution of milk intake (percentages) across top 10 sub-categories 171
Figure 11. 1: Males and Females- Distribution of cheese intake (percentages) across major
categories ....................................................................................................................................... 181
Figure 11. 2: Males and Females- Distribution of cheese intake (percentages) across top 10 sub-
categories ....................................................................................................................................... 182
Figure 11. 3: Males - Distribution of cheese intake (percentages) across major categories ........ 183
Figure 11. 4: Males - Distribution of cheese intake (percentages) across top 10 sub-categories 184
Figure 11. 5: Females- Distribution of cheese intake (percentages) across major categories ..... 185
Figure 11. 6: Females- Distribution of cheese intake (percentages) across top 10 sub-categories
.................................................................................................................................................................. 186
Figure 12. 1: Males and Females - Distribution of oils intake (percentages) across major
categories ....................................................................................................................................... 197

16
2020 Dietary Guidelines Advisory Committee Data Supplement: Food Category Sources
https://www.dietaryguidelines.gov/2020-advisory-committee-report/data-analysis
Figure 12. 2: Males and Females - Distribution of oils intake (percentages) across top 10 sub-
categories ....................................................................................................................................... 198
Figure 12. 3: Males - Distribution of oils intake (percentages) across major categories ............. 199
Figure 12. 4: Males - Distribution of oils intake (percentages) across top 10 sub-categories ..... 201
Figure 12. 5: Females - Distribution of oils intake (percentages) across major categories ......... 202
Figure 12. 6: Females - Distribution of oils intake (percentages) across top 10 sub-categories . 203
Figure 13. 1: Males and Females - Distribution of solid fats intake (percentages) across major
categories ....................................................................................................................................... 213
Figure 13. 2: Males and Females - Distribution of solid fats intake (percentages) across top 10
sub-categories ................................................................................................................................ 214
Figure 13. 3: Males - Distribution of solid fats intake (percentages) across major categories .... 215
Figure 13. 4: Males - Distribution of solid fats intake (percentages) across top 10 sub-categories
.................................................................................................................................................................. 216
Figure 13. 5: Females - Distribution of solid fats intake (percentages) across major categories 217
Figure 13. 6: Females - Distribution of solid fats intake (percentages) across top 10 sub-
categories ....................................................................................................................................... 218
Figure 14. 1: Males and Females- Distribution of added sugars intake (percentages) across major
categories ....................................................................................................................................... 232
Figure 14. 2: Males and Females- Distribution of added sugars intake (percentages) across top
10 sub-categories ........................................................................................................................... 233
Figure 14. 3: Males and Females- Distribution of added sugars intake (percentages) across
beverage categories ........................................................................................................................ 234
Figure 14. 4: Males - Distribution of added sugars intake (percentages) across major categories
.................................................................................................................................................................. 235
Figure 14. 5: Males - Distribution of added sugars intake (percentages) across top 10 sub-
categories ....................................................................................................................................... 236
Figure 14. 6: Males - Distribution of added sugars intake (percentages) across beverage
categories ....................................................................................................................................... 237
Figure 14. 7: Females - Distribution of added sugars intake (percentages) across major
categories ....................................................................................................................................... 238
Figure 14. 8: Females - Distribution of added sugars intake (percentages) across top 10 sub-
categories ....................................................................................................................................... 239
Figure 14. 9: Females - Distribution of added sugars intake (percentages) across beverage
categories ....................................................................................................................................... 240
*Note: Each data table in this section has a figure that directly corresponds with the data in thetable. Figures do not include a description as it would be a direct repetition of the data in thepreceding tables.

17
2020 Dietary Guidelines Advisory Committee Data Supplement: Food Category Sources
https://www.dietaryguidelines.gov/2020-advisory-committee-report/data-analysis
Percent of total fruits intake, 2013-16, for U.S. population ages 2 years and
older, from WWEIA Food Categories
These data are estimates of the percent of USDA Food Pattern total fruits intake from WWEIA Food Categories, regrouped into DGAC major categories and sub-categories as described elsewhere, for individuals 2 years and older based on the day 1 dietary recalls from WWEIA, NHANES 2013-16. Breastfed children, and pregnant and lactating women have been excluded. The sample size is 15,807.
WHOLE SAMPLE (MALES + FEMALES)
Table 1. 1: Males and Females - Distribution of total fruits intake (percentages) across major categories
DGAC major category
Age Groups (Years) 2+ 2-5 6-11 12-19 20-40 41-50 51-70 71+
% FRUITS+FRUIT JUICE 62.54 74.02 68.78 66.80 56.17 56.80 62.56 67.21
BEVERAGES (Not Incl. Milk and 100% Fruit Juice)
11.02 11.19 13.89 11.38 14.65 10.39 8.34 6.64
SNACKS AND SWEETS 7.43 3.22 5.26 6.03 6.03 9.29 9.07 10.66 GRAINS 5.19 1.18 2.10 3.67 5.84 9.18 6.22 3.29 MIXED DISHES 3.37 2.50 2.52 4.39 4.44 3.85 2.76 2.04 DAIRY 2.60 2.43 2.40 1.32 2.63 2.45 3.36 2.36 VEGETABLES 1.63 0.01 0.02 0.92 1.83 2.75 2.36 1.24
CONDIMENTS, GRAVIES, SPREADS, SALAD DRESSINGS
0.94 0.53 0.67 0.96 1.55 1.34 0.60 0.34
PROTEIN FOODS 0.76 0.55 0.46 0.27 0.91 0.94 0.82 0.93 TOTAL* 95.48 95.65 96.08 95.74 94.05 96.98 96.08 94.71
*Totals are less than 100% because results do not include baby foods, infant formulas and WWEIA category - other

18
2020 Dietary Guidelines Advisory Committee Data Supplement: Food Category Sources
https://www.dietaryguidelines.gov/2020-advisory-committee-report/data-analysis
Table 1. 2: Males and Females - Distribution of total fruits intake (percentages) across sub-categories
DGAC sub-category Age Groups (Years) 2+ 2-5 6-11 12-19 20-40 41-50 51-70 71+
% FRUIT (Non-Juice) 49.85 51.73 49.01 50.63 44.96 46.90 53.22 55.40 100% FRUIT JUICE 12.69 22.30 19.77 16.17 11.21 9.90 9.34 11.81 SUGAR-SWEETENED AND DIET BEVERAGES 8.35 7.14 12.88 10.18 10.89 7.50 5.64 4.83 DESSERTS AND SWEET SNACKS 5.55 2.87 4.20 4.78 4.94 6.86 6.02 8.00 BREAKFAST CEREALS AND BARS 3.12 0.68 0.93 2.25 4.04 6.40 2.98 1.85 HIGHER FAT MILK/YOGURT 2.59 2.43 2.40 1.32 2.63 2.45 3.35 2.35 CANDY AND SUGARS 1.80 0.36 1.06 1.24 1.08 2.28 2.78 2.66
VEGETABLES (Incl. Beans and Peas, not Starchy)
1.63 0.01 0.02 0.92 1.83 2.75 2.36 1.24
BURGERS AND SANDWICHES (Incl. Tacos and Burritos)
1.41 2.35 1.58 1.94 1.41 1.10 1.25 0.85
QUICK BREADS (Biscuits, Muffins, Pancakes, Waffles)
1.32 0.45 1.05 1.17 1.02 2.10 1.94 0.51
WATERS 1.22 4.05 0.72 0.41 1.74 0.87 0.76 1.04 CONDIMENTS AND GRAVIES 0.94 0.53 0.67 0.96 1.55 1.34 0.60 0.34
RICE, PASTA AND OTHER GRAIN-BASED MIXED DISHEs
0.82 0.10 0.15 0.73 1.16 1.62 0.77 0.31
MEAT, POULTRY, SEAFOOD MIXED DISHES 0.78 0.05 0.42 0.98 1.37 0.80 0.47 0.74 NUTS, SEEDS, AND SOY 0.76 0.55 0.46 0.27 0.91 0.94 0.82 0.93 COFFEE AND TEA 0.76 0.00 0.18 0.61 0.77 1.17 1.12 0.48 YEAST BREADS AND TORTILLAS 0.72 0.05 0.12 0.24 0.74 0.64 1.28 0.78 ALCOHOLIC BEVERAGES 0.69 0.00 0.11 0.18 1.24 0.85 0.82 0.30 PIZZA 0.33 0.01 0.37 0.73 0.43 0.27 0.24 0.14 CHIPS, CRACKERS, AND SAVORY SNACKS 0.09 0.00 0.00 0.00 0.00 0.15 0.27 0.00 SOUPS 0.04 0.00 0.00 0.01 0.07 0.05 0.05 0.00 RICE AND PASTA 0.04 0.00 0.00 0.00 0.04 0.05 0.02 0.16 CHEESE 0.00 0.00 0.00 0.00 0.00 0.00 0.01 0.01 SALAD DRESSINGS 0.00 0.00 0.00 0.00 0.00 0.00 0.00 0.00

19
2020 Dietary Guidelines Advisory Committee Data Supplement: Food Category Sources
https://www.dietaryguidelines.gov/2020-advisory-committee-report/data-analysis
LOW-FAT MILK/YOGURT 0.00 0.00 0.00 0.00 0.00 0.00 0.00 0.00 DELI/CURED PRODUCTS (Meat and Poultry) 0.00 0.00 0.00 0.00 0.00 0.00 0.00 0.00 EGGS 0.00 0.00 0.00 0.00 0.00 0.00 0.00 0.00 MEATS (Not Incl. Deli and Mixed Dishes) 0.00 0.00 0.00 0.00 0.00 0.00 0.00 0.00 POULTRY (Not Incl. Deli and Mixed Dishes) 0.00 0.00 0.00 0.00 0.00 0.00 0.00 0.00 SEAFOOD (Not Incl. Mixed Dishes) 0.00 0.00 0.00 0.00 0.00 0.00 0.00 0.00 SPREADS 0.00 0.00 0.00 0.00 0.00 0.00 0.00 0.00 STARCHY VEGETABLES 0.00 0.00 0.00 0.00 0.00 0.00 0.00 0.00 TOTAL* 95.48 95.65 96.08 95.74 94.05 96.98 96.08 94.71
*Totals are less than 100% because results do not include baby foods, infant formulas and WWEIA category - other
*Note: Each data table in this section has a figure that directly corresponds with the data in thetable. Figures do not include a description as it would be a direct repetition of the data in thepreceding tables.
(continued from previous page)

20
2020 Dietary Guidelines Advisory Committee Data Supplement: Food Category Sources
https://www.dietaryguidelines.gov/2020-advisory-committee-report/data-analysis
MALES
Table 1. 3: Males - Distribution of total fruits intake (percentages) across major categories
DGAC major category Age Groups (Years) 2+ 2-5 6-11 12-19 20-40 41-50 51-70 71+
% FRUITS+FRUIT JUICE 61.21 72.64 67.23 66.85 54.87 53.41 62.23 64.17
BEVERAGES (Not Incl. Milk and 100% Fruit Juice)
11.05 11.76 13.91 9.39 16.06 9.68 7.53 6.45
SNACKS AND SWEETS 8.35 3.49 5.28 7.95 6.52 11.68 11.27 11.52 GRAINS 5.25 1.36 1.97 3.91 5.67 11.29 6.41 3.01 MIXED DISHES 3.59 3.12 2.88 4.32 5.05 2.82 3.32 1.68 DAIRY 1.78 2.22 3.16 0.97 2.01 1.14 1.40 2.05 VEGETABLES 1.41 0.00 0.01 0.06 0.94 3.89 2.32 1.86
CONDIMENTS, GRAVIES, SPREADS, SALAD DRESSINGS
1.05 0.67 0.61 1.02 1.51 2.10 0.65 0.71
PROTEIN FOODS 0.81 0.13 0.72 0.49 0.69 1.25 0.83 1.79 TOTAL* 94.50 95.38 95.77 94.95 93.32 97.26 95.96 93.25
*Totals are less than 100% because results do not include baby foods, infant formulas and WWEIA category - other

21
2020 Dietary Guidelines Advisory Committee Data Supplement: Food Category Sources
https://www.dietaryguidelines.gov/2020-advisory-committee-report/data-analysis
Table 1. 4: Males - Distribution of total fruits intake (percentages) across sub-categories
DGAC sub-category Age Groups (Years)
2+ 2-5 6-11 12-19 20-40 41-50 51-70 71+
%
FRUIT (Non-Juice) 47.17 49.11 46.75 48.76 43.09 42.84 50.72 52.38
100% FRUIT JUICE 14.04 23.53 20.49 18.09 11.79 10.57 11.51 11.79
SUGAR-SWEETENED AND DIET BEVERAGES
8.29 7.01 12.62 8.03 11.93 7.51 5.22 4.94
DESSERTS AND SWEET SNACKS 6.05 2.98 3.89 6.08 5.78 9.26 6.72 7.56
BREAKFAST CEREALS AND BARS 3.18 0.83 0.78 2.48 4.20 8.05 2.81 1.56
CANDY AND SUGARS 2.19 0.50 1.39 1.86 0.74 2.42 4.10 3.96
HIGHER FAT MILK/YOGURT 1.78 2.22 3.16 0.97 2.01 1.14 1.40 2.04
BURGERS AND SANDWICHES (Incl. Tacos and Burritos)
1.55 2.92 1.98 2.12 1.52 0.96 1.37 0.60
WATERS 1.49 4.75 0.98 0.36 2.25 0.85 0.52 0.82
VEGETABLES (Incl. Beans and Peas, not Starchy)
1.41 0.00 0.01 0.06 0.94 3.89 2.32 1.86
QUICK BREADS (Biscuits, Muffins, Pancakes, Waffles)
1.20 0.51 1.04 1.28 0.67 2.24 1.96 0.23
CONDIMENTS AND GRAVIES 1.05 0.67 0.61 1.02 1.51 2.10 0.65 0.71
MEAT, POULTRY, SEAFOOD MIXED DISHES
0.88 0.08 0.45 1.42 1.59 0.87 0.61 0.31
RICE, PASTA AND OTHER GRAIN- BASED MIXED DISHEs
0.84 0.11 0.18 0.12 1.52 0.77 1.06 0.67
YEAST BREADS AND TORTILLAS 0.82 0.01 0.15 0.15 0.80 0.97 1.61 0.86
NUTS, SEEDS, AND SOY 0.81 0.13 0.72 0.49 0.69 1.25 0.83 1.79
ALCOHOLIC BEVERAGES 0.64 0.00 0.16 0.26 1.18 0.87 0.66 0.47
COFFEE AND TEA 0.62 0.00 0.14 0.74 0.70 0.46 1.14 0.23
PIZZA 0.32 0.01 0.27 0.64 0.43 0.16 0.27 0.11

22
2020 Dietary Guidelines Advisory Committee Data Supplement: Food Category Sources
https://www.dietaryguidelines.gov/2020-advisory-committee-report/data-analysis
CHIPS, CRACKERS, AND SAVORY SNACKS
0.11 0.00 0.00 0.00 0.00 0.00 0.45 0.00
RICE AND PASTA 0.04 0.00 0.00 0.00 0.00 0.03 0.02 0.37
SOUPS 0.01 0.00 0.00 0.01 0.00 0.04 0.01 0.00
CHEESE 0.00 0.00 0.00 0.00 0.00 0.00 0.00 0.01
DELI/CURED PRODUCTS (Meat and Poultry)
0.00 0.00 0.00 0.00 0.00 0.00 0.00 0.00
EGGS 0.00 0.00 0.00 0.00 0.00 0.00 0.00 0.00
LOW-FAT MILK/YOGURT 0.00 0.00 0.00 0.00 0.00 0.00 0.00 0.00
MEATS (Not Incl. Deli and Mixed Dishes)
0.00 0.00 0.00 0.00 0.00 0.00 0.00 0.00
POULTRY (Not Incl. Deli and Mixed Dishes)
0.00 0.00 0.00 0.00 0.00 0.00 0.00 0.00
SALAD DRESSINGS 0.00 0.00 0.00 0.00 0.00 0.00 0.00 0.00
SEAFOOD (Not Incl. Mixed Dishes) 0.00 0.00 0.00 0.00 0.00 0.00 0.00 0.00
SPREADS 0.00 0.00 0.00 0.00 0.00 0.00 0.00 0.00
STARCHY VEGETABLES 0.00 0.00 0.00 0.00 0.00 0.00 0.00 0.00
TOTAL* 94.50 95.38 95.77 94.95 93.32 97.26 95.96 93.25
*Totals are less than 100% because results do not include baby foods, infant formulas and WWEIA category - other
(continued from previous page)

23
2020 Dietary Guidelines Advisory Committee Data Supplement: Food Category Sources
https://www.dietaryguidelines.gov/2020-advisory-committee-report/data-analysis
FEMALES
Table 1. 5: Females - Distribution of total fruits intake (percentages) across major categories
DGAC major category Age Groups (Years)
2+ 2-5 6-11 12-19 20-40 41-50 51-70 71+
%
FRUITS+FRUIT JUICE 63.61 75.31 70.52 66.74 57.52 59.37 62.84 69.46
BEVERAGES (Not Incl. Milk and 100% Fruit Juice)
10.98 10.66 13.86 13.42 13.18 10.93 9.05 6.78
SNACKS AND SWEETS 6.31 2.98 5.23 4.06 5.52 7.47 7.13 10.02
GRAINS 4.95 1.02 2.25 3.42 6.02 7.58 6.04 3.50
DAIRY 3.32 2.63 1.53 1.69 3.27 3.44 5.08 2.58
MIXED DISHES 3.09 1.93 2.11 4.46 3.81 4.63 2.28 2.30
VEGETABLES 1.78 0.02 0.03 1.81 2.75 1.88 2.39 0.79
CONDIMENTS, GRAVIES, SPREADS, SALAD DRESSINGS
0.80 0.41 0.73 0.89 1.60 0.76 0.56 0.07
PROTEIN FOODS 0.69 0.95 0.17 0.05 1.14 0.71 0.81 0.30
TOTAL* 95.51 95.90 96.44 96.54 94.81 96.77 96.18 95.79
*Totals are less than 100% because results do not include baby foods, infant formulas and WWEIA category - other
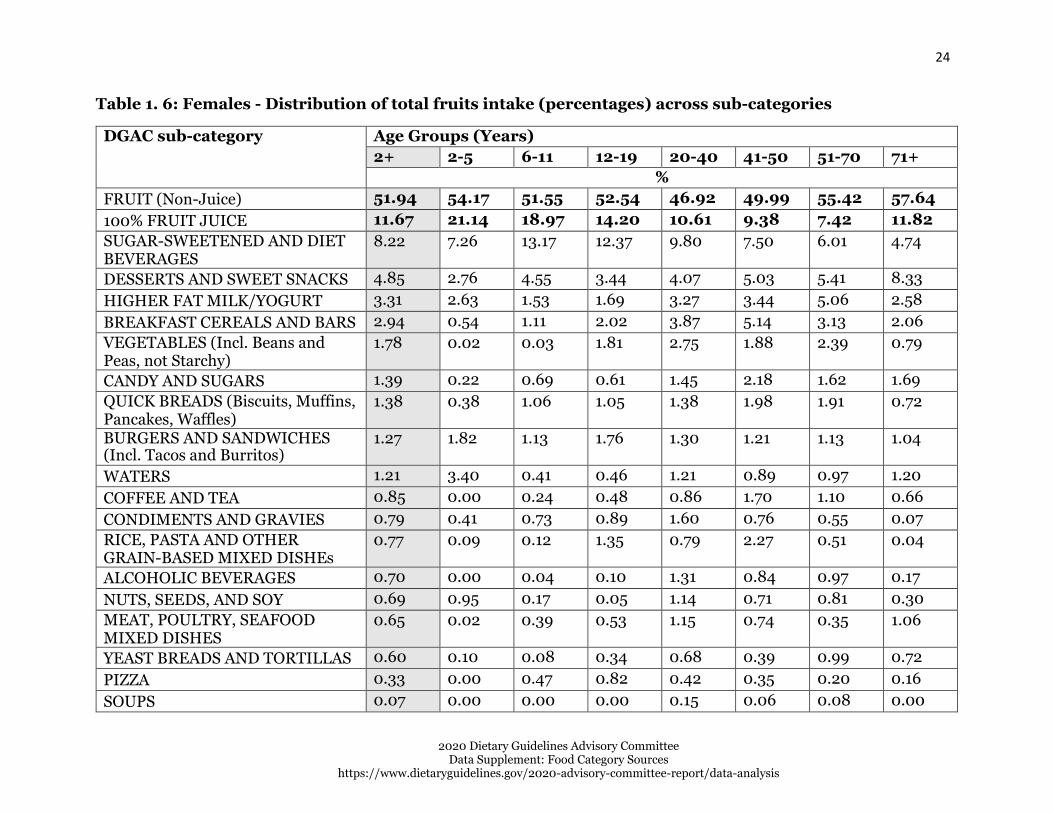
24
2020 Dietary Guidelines Advisory Committee Data Supplement: Food Category Sources
https://www.dietaryguidelines.gov/2020-advisory-committee-report/data-analysis
Table 1. 6: Females - Distribution of total fruits intake (percentages) across sub-categories
DGAC sub-category Age Groups (Years)
2+ 2-5 6-11 12-19 20-40 41-50 51-70 71+
%
FRUIT (Non-Juice) 51.94 54.17 51.55 52.54 46.92 49.99 55.42 57.64
100% FRUIT JUICE 11.67 21.14 18.97 14.20 10.61 9.38 7.42 11.82
SUGAR-SWEETENED AND DIET BEVERAGES
8.22 7.26 13.17 12.37 9.80 7.50 6.01 4.74
DESSERTS AND SWEET SNACKS 4.85 2.76 4.55 3.44 4.07 5.03 5.41 8.33
HIGHER FAT MILK/YOGURT 3.31 2.63 1.53 1.69 3.27 3.44 5.06 2.58
BREAKFAST CEREALS AND BARS 2.94 0.54 1.11 2.02 3.87 5.14 3.13 2.06
VEGETABLES (Incl. Beans and Peas, not Starchy)
1.78 0.02 0.03 1.81 2.75 1.88 2.39 0.79
CANDY AND SUGARS 1.39 0.22 0.69 0.61 1.45 2.18 1.62 1.69
QUICK BREADS (Biscuits, Muffins, Pancakes, Waffles)
1.38 0.38 1.06 1.05 1.38 1.98 1.91 0.72
BURGERS AND SANDWICHES (Incl. Tacos and Burritos)
1.27 1.82 1.13 1.76 1.30 1.21 1.13 1.04
WATERS 1.21 3.40 0.41 0.46 1.21 0.89 0.97 1.20
COFFEE AND TEA 0.85 0.00 0.24 0.48 0.86 1.70 1.10 0.66
CONDIMENTS AND GRAVIES 0.79 0.41 0.73 0.89 1.60 0.76 0.55 0.07
RICE, PASTA AND OTHER GRAIN-BASED MIXED DISHEs
0.77 0.09 0.12 1.35 0.79 2.27 0.51 0.04
ALCOHOLIC BEVERAGES 0.70 0.00 0.04 0.10 1.31 0.84 0.97 0.17
NUTS, SEEDS, AND SOY 0.69 0.95 0.17 0.05 1.14 0.71 0.81 0.30
MEAT, POULTRY, SEAFOOD MIXED DISHES
0.65 0.02 0.39 0.53 1.15 0.74 0.35 1.06
YEAST BREADS AND TORTILLAS 0.60 0.10 0.08 0.34 0.68 0.39 0.99 0.72
PIZZA 0.33 0.00 0.47 0.82 0.42 0.35 0.20 0.16
SOUPS 0.07 0.00 0.00 0.00 0.15 0.06 0.08 0.00

25
2020 Dietary Guidelines Advisory Committee Data Supplement: Food Category Sources
https://www.dietaryguidelines.gov/2020-advisory-committee-report/data-analysis
CHIPS, CRACKERS, AND SAVORY SNACKS
0.06 0.00 0.00 0.00 0.00 0.26 0.11 0.00
RICE AND PASTA 0.03 0.00 0.00 0.00 0.09 0.06 0.01 0.00
CHEESE 0.00 0.00 0.00 0.00 0.00 0.00 0.01 0.00
SALAD DRESSINGS 0.00 0.00 0.00 0.00 0.00 0.00 0.01 0.00
LOW-FAT MILK/YOGURT 0.00 0.00 0.00 0.00 0.00 0.00 0.00 0.00
DELI/CURED PRODUCTS (Meat and Poultry)
0.00 0.00 0.00 0.00 0.00 0.00 0.00 0.00
EGGS 0.00 0.00 0.00 0.00 0.00 0.00 0.00 0.00
MEATS (Not Incl. Deli and Mixed Dishes)
0.00 0.00 0.00 0.00 0.00 0.00 0.00 0.00
POULTRY (Not Incl. Deli and Mixed Dishes)
0.00 0.00 0.00 0.00 0.00 0.00 0.00 0.00
SEAFOOD (Not Incl. Mixed Dishes) 0.00 0.00 0.00 0.00 0.00 0.00 0.00 0.00
SPREADS 0.00 0.00 0.00 0.00 0.00 0.00 0.00 0.00
STARCHY VEGETABLES 0.00 0.00 0.00 0.00 0.00 0.00 0.00 0.00
TOTAL* 95.51 95.90 96.44 96.54 94.81 96.77 96.18 95.79
*Totals are less than 100% because results do not include baby foods, infant formulas and WWEIA category - other
(continued from previous page)
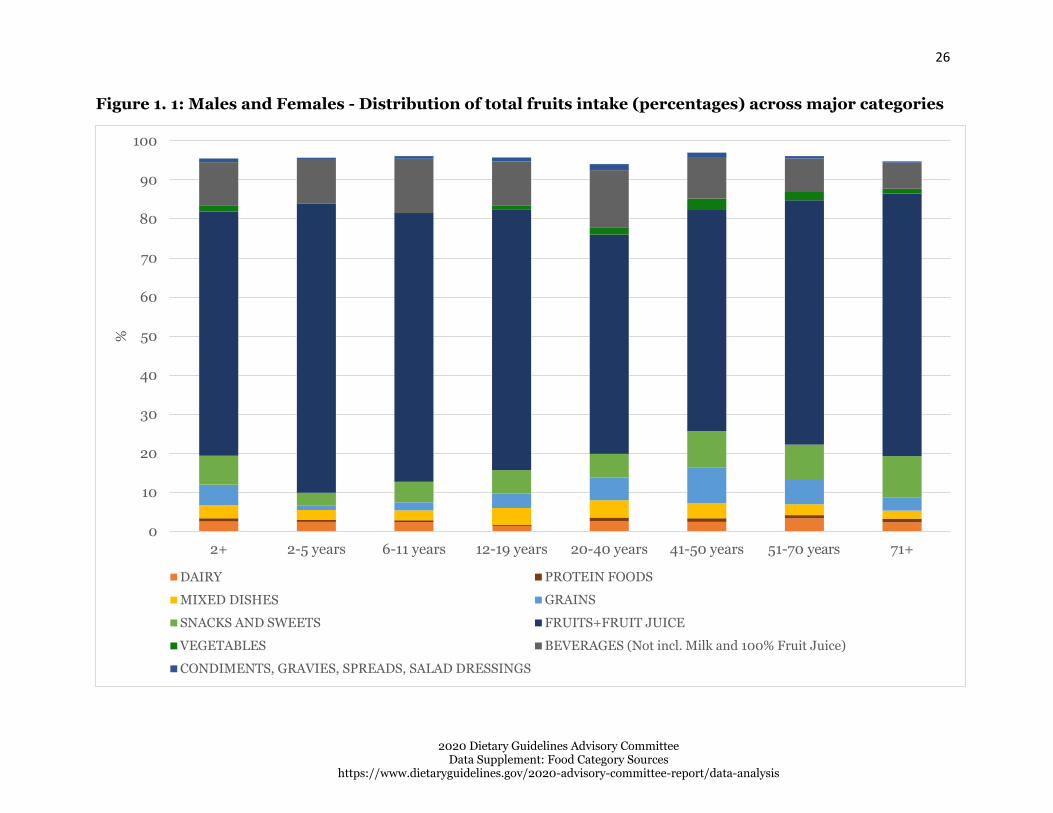
26
2020 Dietary Guidelines Advisory Committee Data Supplement: Food Category Sources
https://www.dietaryguidelines.gov/2020-advisory-committee-report/data-analysis
Figure 1. 1: Males and Females - Distribution of total fruits intake (percentages) across major categories
100
90
80
70
60
50
40
30
20
10
0
2+
DAIRY
MIXED DISHES
2-5 years 6-11 years 12-19 years 20-40 years 41-50 years 51-70 years
PROTEIN FOODS
GRAINS
71+
SNACKS AND SWEETS FRUITS+FRUIT JUICE
VEGETABLES BEVERAGES (Not incl. Milk and 100% Fruit Juice)
CONDIMENTS, GRAVIES, SPREADS, SALAD DRESSINGS
%

27
2020 Dietary Guidelines Advisory Committee Data Supplement: Food Category Sources
https://www.dietaryguidelines.gov/2020-advisory-committee-report/data-analysis
Figure 1. 2: Males and Females - Distribution of total fruits intake (percentages) across top 10 sub- categories
100
90
80
70
60
50
40
30
20
10
0 2+ 2-5 years 6-11 years 12-19 years 20-40 years 41-50 years 51-70 years 71+
FRUIT (non-juice) HUNDRED % FRUIT JUICE
SUGAR-SWEETENED AND DIET BEVERAGES DESSERTS AND SWEET SNACKS
BREAKFAST CEREALS AND BARS HIGHER FAT MILK/YOGURT
CANDY AND SUGARS VEGETABLES (Incl. Beans and Peas, not Starchy)
BURGERS AND SANDWICHES (incl. tacos and burritos) QUICK BREADS (Biscuits, Muffins, Pancakes, Waffles)
%

28
2020 Dietary Guidelines Advisory Committee Data Supplement: Food Category Sources
https://www.dietaryguidelines.gov/2020-advisory-committee-report/data-analysis
Figure 1. 3: Males - Distribution of total fruits intake (percentages) across major categories
120
100
80
60
40
20
0 2+
DAIRY
MIXED DISHES
2-5 years 6-11 years 12-19 years 20-40 years 41-50 years 51-70 years 71+
PROTEIN FOODS
GRAINS
SNACKS AND SWEETS FRUITS+FRUIT JUICE
VEGETABLES BEVERAGES (Not incl. Milk and 100% Fruit Juice)
CONDIMENTS, GRAVIES, SPREADS, SALAD DRESSINGS
%

29
2020 Dietary Guidelines Advisory Committee Data Supplement: Food Category Sources
https://www.dietaryguidelines.gov/2020-advisory-committee-report/data-analysis
Figure 1. 4: Males - Distribution of total fruits intake (percentages) across top 10 sub-categories
100
90
80
70
60
50
40
30
20
10
0
2+ 2-5 years 6-11 years 12-19 years 20-40 years 41-50 years 51-70 years 71+
FRUIT (non-juice) HUNDRED % FRUIT JUICE
SUGAR-SWEETENED AND DIET BEVERAGES DESSERTS AND SWEET SNACKS
BREAKFAST CEREALS AND BARS CANDY AND SUGARS
HIGHER FAT MILK/YOGURT BURGERS AND SANDWICHES (incl. tacos and burritos)
WATERS VEGETABLES (Incl. Beans and Peas, not Starchy)
%

30
2020 Dietary Guidelines Advisory Committee Data Supplement: Food Category Sources
https://www.dietaryguidelines.gov/2020-advisory-committee-report/data-analysis
Figure 1. 5: Females - Distribution of total fruits intake (percentages) across major categories
120
100
80
60
40
20
0 2+
DAIRY
MIXED DISHES
2-5 years 6-11 years 12-19 years 20-40 years 41-50 years 51-70 years 71+
PROTEIN FOODS
GRAINS
SNACKS AND SWEETS FRUITS+FRUIT JUICE
VEGETABLES BEVERAGES (Not incl. Milk and 100% Fruit Juice)
CONDIMENTS, GRAVIES, SPREADS, SALAD DRESSINGS
%

31
2020 Dietary Guidelines Advisory Committee Data Supplement: Food Category Sources
https://www.dietaryguidelines.gov/2020-advisory-committee-report/data-analysis
Figure 1. 6: Females - Distribution of total fruits intake (percentages) across top 10 sub-categories
100
90
80
70
60
50
40
30
20
10
0 2+ 2-5 years 6-11 years 12-19 years 20-40 years 41-50 years 51-70 years 71+
FRUIT (non-juice) HUNDRED % FRUIT JUICE
SUGAR-SWEETENED AND DIET BEVERAGES DESSERTS AND SWEET SNACKS
HIGHER FAT MILK/YOGURT BREAKFAST CEREALS AND BARS
VEGETABLES (Incl. Beans and Peas, not Starchy) CANDY AND SUGARS
QUICK BREADS (Biscuits, Muffins, Pancakes, Waffles) BURGERS AND SANDWICHES (incl. tacos and burritos)
%

32
2020 Dietary Guidelines Advisory Committee Data Supplement: Food Category Sources
https://www.dietaryguidelines.gov/2020-advisory-committee-report/data-analysis
Percent of total vegetables intake, 2013-16, for U.S. population ages 2 years
and older, from WWEIA Food Categories
These data are estimates of the percent of total vegetables from WWEIA Food Categories, re-grouped into DGAC major categories and sub-categories as described elsewhere, for 2 years and older by age/sex group, based on the day 1 dietary recalls from WWEIA, NHANES 2013-16.
Breastfed children, and pregnant and lactating women have been excluded. The overall sample size is 15,807.
WHOLE SAMPLE (MALES + FEMALES)
Table 2. 1: Males and Females – Distribution of total vegetables intake (percentages) across major categories
DGAC major category
Age Groups (Years) 2+ 2-5 6-11 12-19 20-40 41-50 51-70 71+
%
VEGETAB LES
45.02 41.92 38.34 37.66 41.37 46.72 50.89 53.72
MIXED DISHES
40.26 38.47 43.77 46.35 42.90 39.73 35.86 35.95
SNACKS AND SWEETS
7.02 10.71 11.10 9.20 6.39 6.16 6.03 4.86
CONDIME NTS, GRAVIES, SPREADS, SALAD DRESSIN GS
4.87 6.77 4.80 5.12 6.08 4.67 4.03 2.50
PROTEIN FOODS
1.20 0.75 0.75 0.74 1.50 1.09 1.43 0.96

33
2020 Dietary Guidelines Advisory Committee Data Supplement: Food Category Sources
https://www.dietaryguidelines.gov/2020-advisory-committee-report/data-analysis
BEVERAG ES (Not Incl. Milk and 100% Fruit Juice)
0.54 0.36 0.51 0.04 0.72 0.63 0.55 0.49
FRUITS+F RUIT JUICE
0.13 0.22 0.20 0.01 0.12 0.25 0.09 0.13
GRAINS 0.09 0.04 0.05 0.15 0.07 0.11 0.11 0.08 DAIRY 0.00 0.00 0.00 0.00 0.00 0.01 0.01 0.00 TOTAL* 99.14 99.24 99.52 99.27 99.14 99.36 99.00 98.69
*Totals are less than 100% because results do not include baby foods, infant formulas and WWEIA category – other
Table 2. 2: Males and Females - Distribution of total vegetables intake (percentages) across sub- categories
DGAC sub-category Age Groups (Years) 2+ 2-5 6-11 12-19 20-40 41-50 51-70 71+
%
VEGETABLES (Incl. Beans and Peas, not Starchy)
26.98 21.02 18.65 18.77 24.17 29.53 32.83 35.89
STARCHY VEGETABLES 18.04 20.90 19.70 18.89 17.20 17.19 18.06 17.83
BURGERS AND SANDWICHES (Incl. Tacos and Burritos)
14.38 8.81 13.76 18.17 17.33 13.76 12.27 11.13
RICE, PASTA AND OTHER GRAIN-BASED MIXED DISHES
9.67 13.77 11.38 10.75 10.11 9.71 8.07 7.78
CHIPS, CRACKERS, AND SAVORY SNACKS 6.87 10.63 10.97 9.16 6.33 5.97 5.73 4.64 MEAT, POULTRY, SEAFOOD MIXED DISHES 6.62 4.23 5.36 5.15 5.96 7.58 7.72 8.30 PIZZA 5.78 7.92 10.05 9.94 6.55 4.44 3.27 2.53 CONDIMENTS AND GRAVIES 4.85 6.77 4.76 5.11 6.06 4.66 3.98 2.49
(continued from previous page)

34
2020 Dietary Guidelines Advisory Committee Data Supplement: Food Category Sources
https://www.dietaryguidelines.gov/2020-advisory-committee-report/data-analysis
SOUPS 3.81 3.74 3.22 2.34 2.94 4.24 4.54 6.20 EGGS 0.68 0.30 0.26 0.39 0.86 0.76 0.74 0.78 SUGAR-SWEETENED AND DIET BEVERAGES 0.42 0.24 0.51 0.03 0.57 0.53 0.39 0.33 POULTRY (Not Incl. Deli and Mixed Dishes) 0.34 0.41 0.36 0.30 0.56 0.26 0.22 0.07 DESSERTS AND SWEET SNACKS 0.16 0.08 0.13 0.04 0.06 0.19 0.30 0.22 NUTS, SEEDS, AND SOY 0.14 0.04 0.08 0.04 0.02 0.01 0.42 0.07 100% FRUIT JUICE 0.12 0.20 0.20 0.01 0.11 0.25 0.08 0.13 ALCOHOLIC BEVERAGES 0.08 0.00 0.00 0.00 0.11 0.08 0.10 0.14
QUICK BREADS (Biscuits, Muffins, Pancakes, Waffles)
0.05 0.04 0.04 0.13 0.02 0.00 0.09 0.03
WATERS 0.03 0.13 0.00 0.00 0.04 0.01 0.06 0.01 YEAST BREADS AND TORTILLAS 0.03 0.00 0.01 0.02 0.03 0.08 0.02 0.04 SALAD DRESSINGS 0.03 0.00 0.04 0.01 0.02 0.02 0.06 0.02 SEAFOOD (Not Incl. Mixed Dishes) 0.02 0.00 0.01 0.00 0.03 0.04 0.03 0.03 MEATS (Not Incl. Deli and Mixed Dishes) 0.02 0.00 0.03 0.01 0.03 0.01 0.02 0.01 BREAKFAST CEREALS AND BARS 0.01 0.00 0.00 0.00 0.02 0.02 0.00 0.01 FRUIT (Non-Juice) 0.01 0.02 0.00 0.00 0.01 0.00 0.01 0.01 COFFEE AND TEA 0.01 0.00 0.00 0.01 0.01 0.00 0.01 0.00 CHEESE 0.00 0.00 0.00 0.00 0.00 0.01 0.00 0.00 HIGHER FAT MILK/YOGURT 0.00 0.00 0.00 0.00 0.00 0.00 0.00 0.00 CANDY AND SUGARS 0.00 0.00 0.00 0.00 0.00 0.00 0.00 0.00 DELI/CURED PRODUCTS (Meat and Poultry) 0.00 0.00 0.00 0.00 0.00 0.00 0.00 0.00 LOW-FAT MILK/YOGURT 0.00 0.00 0.00 0.00 0.00 0.00 0.00 0.00 RICE AND PASTA 0.00 0.00 0.00 0.00 0.00 0.00 0.00 0.00 SPREADS 0.00 0.00 0.00 0.00 0.00 0.00 0.00 0.00 TOTAL* 99.14 99.24 99.52 99.27 99.14 99.36 99.00 98.69
*Totals are less than 100% because results do not include baby foods, infant formulas and WWEIA category – other
(continued from previous page)

35
2020 Dietary Guidelines Advisory Committee Data Supplement: Food Category Sources
https://www.dietaryguidelines.gov/2020-advisory-committee-report/data-analysis
MALES
Table 2. 3: Males - Distribution of total vegetables intake (percentages) across major categories
DGAC major category Age Groups (Years)
2+ 2-5 6-11 12-19 20-40 41-50 51-70 71+
%
MIXED DISHES 42.59 38.99 44.88 49.56 46.95 42.49 37.58 35.35
VEGETABLES 41.71 40.65 36.21 35.17 36.13 43.39 48.22 54.81
SNACKS AND SWEETS 7.69 11.95 12.58 8.60 7.34 6.49 7.06 4.54
CONDIMENTS, GRAVIES, SPREADS, SALAD DRESSINGS
5.11 6.03 4.16 5.06 6.86 5.29 4.29 2.44
PROTEIN FOODS 1.13 0.85 0.70 0.75 1.56 1.06 1.04 1.08
BEVERAGES (Not Incl. Milk and 100% Fruit Juice)
0.47 0.27 0.87 0.01 0.54 0.47 0.48 0.49
FRUITS+FRUIT JUICE 0.10 0.38 0.36 0.01 0.02 0.14 0.06 0.13
GRAINS 0.07 0.08 0.01 0.23 0.07 0.03 0.04 0.04

36
2020 Dietary Guidelines Advisory Committee Data Supplement: Food Category Sources
https://www.dietaryguidelines.gov/2020-advisory-committee-report/data-analysis
DAIRY 0.00 0.00 0.00 0.00 0.00 0.00 0.01 0.00
TOTAL* 98.87 99.20 99.78 99.37 99.46 99.34 98.78 98.87
*Totals are less than 100% because results do not include baby foods, infant formulas and WWEIA category - other
Table 2. 4: Males - Distribution of total vegetables intake (percentages) across sub-categories
DGAC sub-category Age Groups (Years)
2+ 2-5 6-11 12-19 20-40 41-50 51-70 71+
%
VEGETABLES (Incl. Beans and Peas, not Starchy)
23.62 19.64 17.69 16.80 19.96 25.97 29.21 34.54
STARCHY VEGETABLES 18.09 21.01 18.52 18.37 16.17 17.42 19.01 20.27
BURGERS AND SANDWICHES (Incl. Tacos and Burritos)
16.11 10.10 13.64 20.54 20.23 15.13 14.27 11.36
RICE, PASTA AND OTHER GRAIN-BASED MIXED DISHES
10.33 14.22 10.72 10.68 10.60 12.10 8.73 8.06
CHIPS, CRACKERS, AND SAVORY SNACKS 7.54 11.81 12.42 8.53 7.30 6.27 6.75 4.48
MEAT, POULTRY, SEAFOOD MIXED DISHES 6.56 3.24 6.34 5.80 6.50 6.74 6.95 8.51
PIZZA 6.12 8.44 10.64 10.28 7.31 4.06 3.45 1.68
CONDIMENTS AND GRAVIES 5.08 6.03 4.16 5.06 6.83 5.27 4.18 2.43
SOUPS 3.46 3.00 3.54 2.25 2.30 4.45 4.18 5.74
(continued from previous page)

37
2020 Dietary Guidelines Advisory Committee Data Supplement: Food Category Sources
https://www.dietaryguidelines.gov/2020-advisory-committee-report/data-analysis
EGGS 0.57 0.32 0.21 0.42 0.80 0.58 0.44 0.86
POULTRY (Not Incl. Deli and Mixed Dishes) 0.41 0.46 0.43 0.29 0.68 0.41 0.19 0.15
SUGAR-SWEETENED AND DIET BEVERAGES
0.32 0.25 0.87 0.01 0.44 0.28 0.21 0.17
DESSERTS AND SWEET SNACKS 0.15 0. 0.16 0.06 0.04 0.22 0.31 0.06
ALCOHOLIC BEVERAGES 0.11 0.00 0.00 0.00 0.08 0.17 0.16 0.32
100% FRUIT JUICE 0.10 0.38 0.36 0.01 0.02 0.14 0.06 0.12
NUTS, SEEDS, AND SOY 0.08 0.07 0.00 0.02 0.00 0.00 0.32 0.00
SALAD DRESSINGS 0.04 0.00 0.01 0.00 0.03 0.01 0.11 0.01
SEAFOOD (Not Incl. Mixed Dishes) 0.04 0.00 0.01 0.00 0.03 0.06 0.05 0.06
WATERS 0.03 0.02 0.00 0.00 0.01 0.02 0.12 0.00
QUICK BREADS (Biscuits, Muffins, Pancakes, Waffles)
0.03 0.08 0.00 0.23 0.00 0.00 0.01 0.01
MEATS (Not Incl. Deli and Mixed Dishes) 0.03 0.00 0.06 0.01 0.04 0.01 0.03 0.01
BREAKFAST CEREALS AND BARS 0.02 0.00 0.00 0.00 0.04 0.02 0.00 0.03
YEAST BREADS AND TORTILLAS 0.02 0.00 0.01 0.00 0.02 0.00 0.03 0.00
FRUIT (Non-Juice) 0.00 0.00 0.00 0.00 0.01 0.00 0.00 0.01
HIGHER FAT MILK/YOGURT 0.00 0.00 0.00 0.00 0.00 0.00 0.01 0.00
COFFEE AND TEA 0.00 0.00 0.00 0.00 0.00 0.00 0.00 0.00
CHEESE 0.00 0.00 0.00 0.00 0.00 0.00 0.00 0.00
CANDY AND SUGARS 0.00 0.00 0.00 0.00 0.00 0.00 0.00 0.00
DELI/CURED PRODUCTS (Meat and Poultry) 0.00 0.00 0.00 0.00 0.00 0.00 0.00 0.00
LOW-FAT MILK/YOGURT 0.00 0.00 0.00 0.00 0.00 0.00 0.00 0.00
RICE AND PASTA 0.00 0.00 0.00 0.00 0.00 0.00 0.00 0.00
SPREADS 0.00 0.00 0.00 0.00 0.00 0.00 0.00 0.00
TOTAL* 98.87 99.20 99.78 99.37 99.46 99.34 98.78 98.87
*Totals are less than 100% because results do not include baby foods, infant formulas and WWEIA category - other
(continued from previous page)

38
2020 Dietary Guidelines Advisory Committee Data Supplement: Food Category Sources
https://www.dietaryguidelines.gov/2020-advisory-committee-report/data-analysis
FEMALES
Table 2. 5: Females - Distribution of total vegetables intake (percentages) across major categories
DGAC major category Age Groups (Years)
2+ 2-5 6-11 12-19 20-40 41-50 51-70 71+
%
VEGETABLES 48.28 43.09 40.85 40.15 47.24 49.77 53.32 52.86
MIXED DISHES 37.58 37.98 42.46 43.13 38.36 37.19 34.29 36.42
SNACKS AND SWEETS 6.25 9.58 9.36 9.80 5.33 5.86 5.09 5.11
CONDIMENTS, GRAVIES, SPREADS, SALAD DRESSINGS
4.53 7.44 5.56 5.18 5.21 4.11 3.80 2.56
PROTEIN FOODS 1.25 0.65 0.81 0.74 1.43 1.11 1.78 0.86
BEVERAGES (Not Incl. Milk and 100% Fruit Juice)
0.59 0.45 0.07 0.07 0.93 0.77 0.61 0.48
FRUITS+FRUIT JUICE 0.16 0.07 0.00 0.02 0.22 0.36 0.12 0.14
GRAINS 0.11 0.00 0.09 0.07 0.07 0.18 0.17 0.12
DAIRY 0.00 0.00 0.00 0.00 0.00 0.01 0.01 0.00
TOTAL* 98.76 99.27 99.21 99.17 98.78 99.37 99.19 98.55
*Totals are less than 100% because results do not include baby foods, infant formulas and WWEIA category -other

39
2020 Dietary Guidelines Advisory Committee Data Supplement: Food Category Sources
https://www.dietaryguidelines.gov/2020-advisory-committee-report/data-analysis
Table 2. 6: Females - Distribution of total vegetables intake (percentages) across sub-categories
DGAC sub-category Age Groups (Years)
2+ 2-5 6-11 12-19 20-40 41-50 51-70 71+
%
VEGETABLES (Incl. Beans and Peas, not Starchy)
30.20 22.28 19.78 20.74 28.89 32.80 36.13 36.97
STARCHY VEGETABLES 18.08 20.80 21.07 19.41 18.35 16.97 17.19 15.89
BURGERS AND SANDWICHES (Incl. Tacos and Burritos)
12.32 7.63 13.91 15.79 14.09 12.50 10.44 10.96
RICE, PASTA AND OTHER GRAIN- BASED MIXED DISHES
9.04 13.36 12.15 10.82 9.56 7.51 7.46 7.56
MEAT, POULTRY, SEAFOOD MIXED DISHES
6.69 5.14 4.20 4.50 5.36 8.35 8.42 8.12
CHIPS, CRACKERS, AND SAVORY SNACKS
6.09 9.55 9.27 9.79 5.25 5.70 4.81 4.77
PIZZA 5.37 7.45 9.37 9.59 5.69 4.79 3.11 3.21
CONDIMENTS AND GRAVIES 4.51 7.44 5.47 5.17 5.19 4.09 3.79 2.54
SOUPS 4.16 4.41 2.83 2.44 3.65 4.05 4.87 6.57

40
2020 Dietary Guidelines Advisory Committee Data Supplement: Food Category Sources
https://www.dietaryguidelines.gov/2020-advisory-committee-report/data-analysis
EGGS 0.79 0.28 0.33 0.36 0.92 0.93 1.02 0.72
SUGAR-SWEETENED AND DIET BEVERAGES
0.51 0.23 0.07 0.05 0.72 0.76 0.55 0.45
POULTRY (Not Incl. Deli and Mixed Dishes)
0.26 0.36 0.29 0.30 0.43 0.12 0.24 0.01
NUTS, SEEDS, AND SOY 0.18 0.01 0.17 0.07 0.04 0.03 0.52 0.12
DESSERTS AND SWEET SNACKS 0.16 0.03 0.09 0.01 0.08 0.16 0.28 0.35
100% FRUIT JUICE 0.15 0.03 0.00 0.02 0.21 0.36 0.10 0.13
QUICK BREADS (Biscuits, Muffins, Pancakes, Waffles)
0.07 0.00 0.09 0.04 0.03 0.01 0.16 0.04
ALCOHOLIC BEVERAGES 0.05 0.00 0.00 0.00 0.13 0.00 0.05 0.00
YEAST BREADS AND TORTILLAS 0.04 0.00 0.00 0.03 0.04 0.16 0.00 0.07
WATERS 0.03 0.22 0.00 0.00 0.07 0.00 0.00 0.03
SALAD DRESSINGS 0.02 0.00 0.08 0.02 0.01 0.02 0.01 0.02
FRUIT (Non-Juice) 0.01 0.04 0.00 0.00 0.01 0.00 0.02 0.00
SEAFOOD (Not Incl. Mixed Dishes) 0.01 0.00 0.02 0.00 0.03 0.01 0.00 0.00
COFFEE AND TEA 0.01 0.00 0.00 0.02 0.02 0.01 0.01 0.00
MEATS (Not Incl. Deli and Mixed Dishes)
0.01 0.00 0.00 0.00 0.01 0.02 0.01 0.01
CHEESE 0.00 0.00 0.00 0.00 0.00 0.01 0.01 0.00
BREAKFAST CEREALS AND BARS 0.00 0.00 0.00 0.00 0.00 0.02 0.00 0.00
CANDY AND SUGARS 0.00 0.00 0.00 0.00 0.00 0.00 0.00 0.00
HIGHER FAT MILK/YOGURT 0.00 0.00 0.00 0.00 0.00 0.00 0.00 0.00
DELI/CURED PRODUCTS (Meat and Poultry)
0.00 0.00 0.00 0.00 0.00 0.00 0.00 0.00
LOW-FAT MILK/YOGURT 0.00 0.00 0.00 0.00 0.00 0.00 0.00 0.00
RICE AND PASTA 0.00 0.00 0.00 0.00 0.00 0.00 0.00 0.00
SPREADS 0.00 0.00 0.00 0.00 0.00 0.00 0.00 0.00
TOTAL* 98.76 99.27 99.21 99.17 98.78 99.37 99.19 98.55
*Totals are less than 100% because results do not include baby foods, infant formulas and WWEIA category - othe
(continued from previous page)

41
2020 Dietary Guidelines Advisory Committee Data Supplement: Food Category Sources
https://www.dietaryguidelines.gov/2020-advisory-committee-report/data-analysis
Figure 2. 1: Males and Females - Distribution of total vegetables intake (percentages) across major categories
100
90
80
70
60
50
40
30
20
10
0 2+
DAIRY
MIXED DISHES
2-5 years 6-11 years 12-19 years 20-40 years 41-50 years 51-70 years
PROTEIN FOODS
GRAINS
71+
SNACKS AND SWEETS FRUITS+FRUIT JUICE
VEGETABLES BEVERAGES (Not incl. Milk and 100% Fruit Juice)
CONDIMENTS, GRAVIES, SPREADS, SALAD DRESSINGS
%

42
2020 Dietary Guidelines Advisory Committee Data Supplement: Food Category Sources
https://www.dietaryguidelines.gov/2020-advisory-committee-report/data-analysis
Figure 2. 2: Males and Females – Distribution of total vegetables intake (percentages) across top 10 sub-categories
100
90
80
70
60
50
40
30
20
10
0 2+ 2-5 years 6-11 years 12-19 years 20-40 years 41-50 years 51-70 years 71+
VEGETABLES (Incl. Beans and Peas, not Starchy) STARCHY VEGETABLES
BURGERS AND SANDWICHES (incl. tacos and burritos) RICE, PASTA AND OTHER GRAIN-BASED MIXED DISHEs
CHIPS, CRACKERS, AND SAVORY SNACKS MEAT, POULTRY, SEAFOOD MIXED DISHES
PIZZA CONDIMENTS AND GRAVIES
SOUPS EGGS
%

44
2020 Dietary Guidelines Advisory Committee Data Supplement: Food Category Sources
https://www.dietaryguidelines.gov/2020-advisory-committee-report/data-analysis
Figure 2. 3: Males - Distribution of total vegetables intake (percentages) across major categories
71+ 12-19 years 20-40 years 41-50 years 51-70 years6-11 years 2-5 years 2+
DAIRY
MIXED DISHES
100
90
80
70
60
50
40
30
20
10
0
PROTEIN FOODS
GRAINS
FRUITS+FRUIT JUICE
BEVERAGES (Not incl. Milk and 100% Fruit Juice)
SNACKS AND SWEETS
VEGETABLES
CONDIMENTS, GRAVIES, SPREADS, SALAD DRESSINGS
%

45
2020 Dietary Guidelines Advisory Committee Data Supplement: Food Category Sources
https://www.dietaryguidelines.gov/2020-advisory-committee-report/data-analysis
VEGETABLES (Incl. Beans and Peas, not Starchy)
BURGERS AND SANDWICHES (incl. tacos and burritos)
CHIPS, CRACKERS, AND SAVORY SNACKS
PIZZA
SOUPS
STARCHY VEGETABLES
RICE, PASTA AND OTHER GRAIN-BASED MIXED DISHEs
MEAT, POULTRY, SEAFOOD MIXED DISHES
CONDIMENTS AND GRAVIES
EGGS
Figure 2. 4: Males- Distribution of total vegetables intake (percentages) across top 10 sub-categories
71+ 6-11 years 12-19 years 20-40 years 41-50 years 51-70 years2-5 years2+
100
90
80
70
60
50
40
30
20
10
0
%

46
2020 Dietary Guidelines Advisory Committee Data Supplement: Food Category Sources
https://www.dietaryguidelines.gov/2020-advisory-committee-report/data-analysis
Figure 2. 5: Females – Distribution of total vegetables intake (percentages) across major categories
100
90
80
70
60
50
40
30
20
10
0 2+
DAIRY
MIXED DISHES
2-5 years 6-11 years 12-19 years 20-40 years 41-50 years 51-70 years
PROTEIN FOODS
GRAINS
71+
SNACKS AND SWEETS FRUITS+FRUIT JUICE
VEGETABLES BEVERAGES (Not incl. Milk and 100% Fruit Juice)
CONDIMENTS, GRAVIES, SPREADS, SALAD DRESSINGS
%

47
2020 Dietary Guidelines Advisory Committee Data Supplement: Food Category Sources
https://www.dietaryguidelines.gov/2020-advisory-committee-report/data-analysis
Figure 2. 6: Females - Distribution of total vegetables intake (percentages) across top 10 sub-categories
100
90
80
70
60
50
40
30
20
10
0 2+ 2-5 years 6-11 years 12-19 years 20-40 years 41-50 years 51-70 years 71+
VEGETABLES (Incl. Beans and Peas, not Starchy) STARCHY VEGETABLES
BURGERS AND SANDWICHES (incl. tacos and burritos) RICE, PASTA AND OTHER GRAIN-BASED MIXED DISHEs
MEAT, POULTRY, SEAFOOD MIXED DISHES CHIPS, CRACKERS, AND SAVORY SNACKS
PIZZA CONDIMENTS AND GRAVIES
SOUPS EGGS
%

48
2020 Dietary Guidelines Advisory Committee Data Supplement: Food Category Sources
https://www.dietaryguidelines.gov/2020-advisory-committee-report/data-analysis
Percent of total grains intake, 2013-16, for U.S. population ages 2 years and
older, from WWEIA Food Categories
These data are estimates of the percent of total grains from WWEIA Food Categories, re-grouped into DGAC major categories and sub-categories as described elsewhere, for individuals 2 years and older based on the day 1 dietary recalls from WWEIA, NHANES 2013-16. Breastfed children, and pregnant and lactating women have been excluded. The sample size is 15,807.
WHOLE SAMPLE (MALES + FEMALES)
Table 3. 1: Males and Females - Distribution of total grains intake (percentages) across major categories
DGAC major category Age Groups (Years)
2+ 2-5 6-11 12-19 20-40 41-50 51-70 71+
%
MIXED DISHES 45.99 39.99 45.15 49.95 51.77 45.58 42.46 38.01
GRAINS 29.19 28.73 27.21 25.40 25.19 29.67 32.78 37.46
SNACKS AND SWEETS 18.97 24.86 22.35 18.26 17.07 18.71 18.96 19.59
PROTEIN FOODS 3.68 4.93 4.26 4.41 3.79 4.19 3.03 2.31
VEGETABLES 1.01 0.31 0.19 0.68 1.22 1.04 1.37 0.85
DAIRY 0.19 0.07 0.32 0.62 0.19 0.09 0.11 0.02
CONDIMENTS, GRAVIES, SPREADS, SALAD DRESSINGS
0.19 0.12 0.13 0.19 0.22 0.12 0.20 0.23
BEVERAGES (Not Incl. Milk and 100% Fruit Juice)
0.09 0.05 0.05 0.12 0.12 0.11 0.06 0.04
FRUITS+FRUIT JUICE 0.01 0.00 0.02 0.00 0.01 0.00 0.00 0.01
TOTAL* 99.31 99.05 99.67 99.63 99.58 99.52 98.97 98.50
*Totals are less than 100% because results do not include baby foods, infant formulas and WWEIA category – other

49
2020 Dietary Guidelines Advisory Committee Data Supplement: Food Category Sources
https://www.dietaryguidelines.gov/2020-advisory-committee-report/data-analysis
Table 3. 2: Males and Females - Distribution of total grains intake (percentages) across sub-categories
DGAC sub-category Age Groups (Years)
2+ 2-5 6-11 12-19 20-40 41-50 51-70 71+
%
BURGERS AND SANDWICHES (Incl. Tacos and Burritos)
24.97 19.03 21.70 25.06 27.97 25.61 24.35 22.82
YEAST BREADS AND TORTILLAS 12.46 8.35 9.56 8.67 10.89 14.01 14.84 18.08
RICE, PASTA AND OTHER GRAIN-BASED MIXED DISHES
10.86 11.62 10.85 11.25 12.39 11.16 9.85 7.70
DESSERTS AND SWEET SNACKS 9.62 11.67 10.33 8.56 7.98 9.19 9.96 13.86
CHIPS, CRACKERS, AND SAVORY SNACKS
9.27 13.15 11.88 9.63 8.98 9.48 8.95 5.68
BREAKFAST CEREALS AND BARS 7.63 10.14 7.79 8.05 5.54 6.56 8.56 10.95
PIZZA 6.35 6.73 9.39 10.38 7.57 5.46 3.87 2.83
RICE AND PASTA 4.71 3.81 3.42 3.84 5.74 5.01 4.68 3.98
QUICK BREADS (Biscuits, Muffins, Pancakes, Waffles)
4.38 6.43 6.45 4.84 3.02 4.09 4.71 4.46
POULTRY (Not Incl. Deli and Mixed Dishes)
2.54 4.13 3.57 3.82 2.68 2.50 1.65 1.16
MEAT, POULTRY, SEAFOOD MIXED DISHES
2.41 1.07 1.65 1.86 2.47 2.32 2.90 3.11
SOUPS 1.40 1.54 1.57 1.41 1.37 1.03 1.50 1.54
VEGETABLES (Incl. Beans and Peas, not Starchy)
0.88 0.23 0.13 0.59 1.03 0.84 1.28 0.73
SEAFOOD (Not Incl. Mixed Dishes) 0.78 0.48 0.38 0.39 0.74 1.26 0.92 0.87
MEATS (Not Incl. Deli and Mixed Dishes)
0.27 0.21 0.26 0.19 0.27 0.29 0.32 0.22
CONDIMENTS AND GRAVIES 0.19 0.12 0.13 0.19 0.22 0.12 0.20 0.23
CHEESE 0.18 0.05 0.31 0.60 0.18 0.06 0.08 0.01
STARCHY VEGETABLES 0.13 0.08 0.05 0.09 0.19 0.20 0.08 0.12

50
2020 Dietary Guidelines Advisory Committee Data Supplement: Food Category Sources
https://www.dietaryguidelines.gov/2020-advisory-committee-report/data-analysis
SUGAR-SWEETENED AND DIET BEVERAGES
0.09 0.05 0.05 0.12 0.12 0.11 0.06 0.03
CANDY AND SUGARS 0.07 0.04 0.14 0.07 0.11 0.04 0.05 0.05
NUTS, SEEDS, AND SOY 0.06 0.10 0.05 0.01 0.03 0.13 0.06 0.04
EGGS 0.03 0.00 0.00 0.00 0.06 0.01 0.07 0.01
HIGHER FAT MILK/YOGURT 0.01 0.01 0.00 0.02 0.00 0.00 0.03 0.01
FRUIT (Non-Juice) 0.00 0.00 0.02 0.00 0.01 0.00 0.00 0.00
LOW-FAT MILK/YOGURT 0.00 0.00 0.00 0.00 0.00 0.02 0.00 0.00
DELI/CURED PRODUCTS (Meat and Poultry)
0.00 0.00 0.00 0.00 0.00 0.00 0.00 0.01
100% FRUIT JUICE 0.00 0.00 0.00 0.00 0.00 0.00 0.00 0.01
WATERS 0.00 0.00 0.00 0.00 0.00 0.00 0.00 0.01
COFFEE AND TEA 0.00 0.00 0.00 0.00 0.00 0.00 0.00 0.00
ALCOHOLIC BEVERAGES 0.00 0.00 0.00 0.00 0.00 0.00 0.00 0.00
SALAD DRESSINGS 0.00 0.00 0.00 0.00 0.00 0.00 0.00 0.00
SPREADS 0.00 0.00 0.00 0.00 0.00 0.00 0.00 0.00
TOTAL* 99.31 99.05 99.67 99.63 99.58 99.52 98.97 98.50
*Totals are less than 100% because results do not include baby foods, infant formulas and WWEIA category - other
(continued from previous page)

51
2020 Dietary Guidelines Advisory Committee Data Supplement: Food Category Sources
https://www.dietaryguidelines.gov/2020-advisory-committee-report/data-analysis
MALES
Table 3. 3: Males - Distribution of total grains intake (percentages) across major categories
DGAC major category Age Groups (Years)
2+ 2-5 6-11 12-19 20-40 41-50 51-70 71+
%
MIXED DISHES 48.34 40.84 47.93 51.74 55.73 48.42 43.97 40.25
GRAINS 28.10 28.07 25.13 24.29 23.76 29.20 32.75 37.29
SNACKS AND SWEETS 17.52 25.69 21.75 17.87 14.59 16.41 18.22 17.28
PROTEIN FOODS 3.74 4.44 4.38 4.53 4.02 4.58 2.71 2.41
VEGETABLES 0.87 0.19 0.14 0.56 1.11 0.96 1.16 0.74
CONDIMENTS, GRAVIES, SPREADS, SALAD DRESSINGS
0.16 0.05 0.11 0.18 0.13 0.10 0.22 0.16
DAIRY 0.13 0.09 0.25 0.26 0.20 0.06 0.03 0.02
BEVERAGES (Not Incl. Milk and 100% Fruit Juice)
0.07 0.04 0.04 0.12 0.07 0.13 0.03 0.01
FRUITS+FRUIT JUICE 0.01 0.00 0.00 0.00 0.02 0.00 0.00 0.02
TOTAL* 98.93 99.40 99.72 99.55 99.64 99.86 99.09 98.20
*Totals are less than 100% because results do not include baby foods, infant formulas and WWEIA category - other
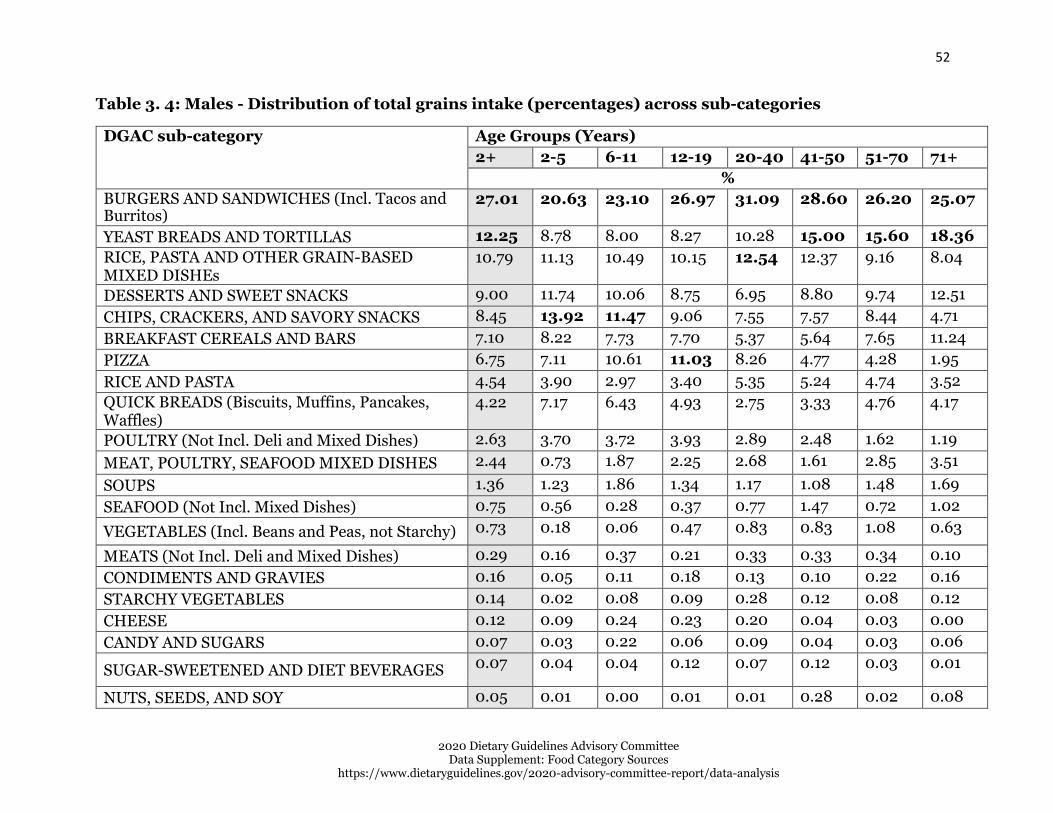
52
2020 Dietary Guidelines Advisory Committee Data Supplement: Food Category Sources
https://www.dietaryguidelines.gov/2020-advisory-committee-report/data-analysis
Table 3. 4: Males - Distribution of total grains intake (percentages) across sub-categories
DGAC sub-category Age Groups (Years)
2+ 2-5 6-11 12-19 20-40 41-50 51-70 71+
%
BURGERS AND SANDWICHES (Incl. Tacos and Burritos)
27.01 20.63 23.10 26.97 31.09 28.60 26.20 25.07
YEAST BREADS AND TORTILLAS 12.25 8.78 8.00 8.27 10.28 15.00 15.60 18.36
RICE, PASTA AND OTHER GRAIN-BASED MIXED DISHEs
10.79 11.13 10.49 10.15 12.54 12.37 9.16 8.04
DESSERTS AND SWEET SNACKS 9.00 11.74 10.06 8.75 6.95 8.80 9.74 12.51
CHIPS, CRACKERS, AND SAVORY SNACKS 8.45 13.92 11.47 9.06 7.55 7.57 8.44 4.71
BREAKFAST CEREALS AND BARS 7.10 8.22 7.73 7.70 5.37 5.64 7.65 11.24
PIZZA 6.75 7.11 10.61 11.03 8.26 4.77 4.28 1.95
RICE AND PASTA 4.54 3.90 2.97 3.40 5.35 5.24 4.74 3.52
QUICK BREADS (Biscuits, Muffins, Pancakes, Waffles)
4.22 7.17 6.43 4.93 2.75 3.33 4.76 4.17
POULTRY (Not Incl. Deli and Mixed Dishes) 2.63 3.70 3.72 3.93 2.89 2.48 1.62 1.19
MEAT, POULTRY, SEAFOOD MIXED DISHES 2.44 0.73 1.87 2.25 2.68 1.61 2.85 3.51
SOUPS 1.36 1.23 1.86 1.34 1.17 1.08 1.48 1.69
SEAFOOD (Not Incl. Mixed Dishes) 0.75 0.56 0.28 0.37 0.77 1.47 0.72 1.02
VEGETABLES (Incl. Beans and Peas, not Starchy) 0.73 0.18 0.06 0.47 0.83 0.83 1.08 0.63
MEATS (Not Incl. Deli and Mixed Dishes) 0.29 0.16 0.37 0.21 0.33 0.33 0.34 0.10
CONDIMENTS AND GRAVIES 0.16 0.05 0.11 0.18 0.13 0.10 0.22 0.16
STARCHY VEGETABLES 0.14 0.02 0.08 0.09 0.28 0.12 0.08 0.12
CHEESE 0.12 0.09 0.24 0.23 0.20 0.04 0.03 0.00
CANDY AND SUGARS 0.07 0.03 0.22 0.06 0.09 0.04 0.03 0.06
SUGAR-SWEETENED AND DIET BEVERAGES 0.07 0.04 0.04 0.12 0.07 0.12 0.03 0.01
NUTS, SEEDS, AND SOY 0.05 0.01 0.00 0.01 0.01 0.28 0.02 0.08

53
2020 Dietary Guidelines Advisory Committee Data Supplement: Food Category Sources
https://www.dietaryguidelines.gov/2020-advisory-committee-report/data-analysis
EGGS 0.01 0.01 0.01 0.00 0.02 0.02 0.01 0.00
HIGHER FAT MILK/YOGURT 0.01 0.00 0.00 0.03 0.00 0.01 0.00 0.01
FRUIT (Non-Juice) 0.01 0.00 0.00 0.00 0.02 0.00 0.00 0.00
DELI/CURED PRODUCTS (Meat and Poultry) 0.00 0.00 0.00 0.00 0.00 0.00 0.00 0.02
100% FRUIT JUICE 0.00 0.00 0.00 0.00 0.00 0.00 0.00 0.02
COFFEE AND TEA 0.00 0.00 0.00 0.00 0.00 0.00 0.00 0.00
ALCOHOLIC BEVERAGES 0.00 0.00 0.00 0.00 0.00 0.00 0.00 0.00
LOW-FAT MILK/YOGURT 0.00 0.00 0.00 0.00 0.00 0.00 0.00 0.00
SALAD DRESSINGS 0.00 0.00 0.00 0.00 0.00 0.00 0.00 0.00
SPREADS 0.00 0.00 0.00 0.00 0.00 0.00 0.00 0.00
WATERS 0.00 0.00 0.00 0.00 0.00 0.00 0.00 0.00
TOTAL* 98.93 99.40 99.72 99.55 99.64 99.86 99.09 98.20
*Totals are less than 100% because results do not include baby foods, infant formulas and WWEIA category - other
(continued from previous page)

54
2020 Dietary Guidelines Advisory Committee Data Supplement: Food Category Sources
https://www.dietaryguidelines.gov/2020-advisory-committee-report/data-analysis
FEMALES
Table 3. 5: Females - Distribution of total grains intake (percentages) across major categories
DGAC major category Age Groups (Years)
2+ 2-5 6-11 12-19 20-40 41-50 51-70 71+
%
MIXED DISHES 42.90 39.21 41.98 48.11 47.29 43.02 41.08 36.24
GRAINS 30.14 29.34 29.58 26.54 26.81 30.09 32.82 37.60
SNACKS AND SWEETS 20.41 24.09 23.04 18.65 19.87 20.79 19.64 21.40
PROTEIN FOODS 3.60 5.38 4.13 4.29 3.52 3.84 3.32 2.22
VEGETABLES 1.12 0.41 0.24 0.80 1.35 1.11 1.55 0.93
DAIRY 0.26 0.05 0.39 0.99 0.18 0.12 0.19 0.01
CONDIMENTS, GRAVIES, SPREADS, SALAD DRESSINGS
0.22 0.19 0.15 0.21 0.32 0.14 0.17 0.28
BEVERAGES (Not Incl. Milk and 100% Fruit Juice)
0.11 0.05 0.06 0.12 0.18 0.09 0.08 0.06
FRUITS+FRUIT JUICE 0.00 0.00 0.03 0.00 0.00 0.00 0.00 0.00
TOTAL* 98.77 98.72 99.61 99.71 99.52 99.21 98.86 98.73
*Totals are less than 100% because results do not include baby foods, infant formulas and WWEIA category - other

55
2020 Dietary Guidelines Advisory Committee Data Supplement: Food Category Sources
https://www.dietaryguidelines.gov/2020-advisory-committee-report/data-analysis
Table 3. 6: Females - Distribution of total grains intake (percentages) across sub-categories
DGAC sub-category Age Groups (Years)
2+ 2-5 6-11 12-19 20-40 41-50 51-70 71+
%
BURGERS AND SANDWICHES (Incl. Tacos and Burritos)
22.32 17.55 20.10 23.09 24.43 22.91 22.65 21.06
YEAST BREADS AND TORTILLAS 12.56 7.96 11.33 9.09 11.58 13.12 14.15 17.85
RICE, PASTA AND OTHER GRAIN-BASED MIXED DISHEs
10.92 12.07 11.25 12.37 12.23 10.08 10.47 7.44
DESSERTS AND SWEET SNACKS 10.19 11.60 10.64 8.36 9.15 9.54 10.15 14.92
CHIPS, CRACKERS, AND SAVORY SNACKS 10.15 12.44 12.35 10.21 10.60 11.20 9.43 6.44
BREAKFAST CEREALS AND BARS 8.20 11.91 7.85 8.42 5.74 7.38 9.38 10.72
PIZZA 5.85 6.38 7.99 9.72 6.79 6.08 3.49 3.53
RICE AND PASTA 4.88 3.72 3.94 4.30 6.17 4.81 4.62 4.35
QUICK BREADS (Biscuits, Muffins, Pancakes, Waffles)
4.50 5.74 6.47 4.74 3.32 4.78 4.66 4.68
POULTRY (Not Incl. Deli and Mixed Dishes) 2.46 4.52 3.40 3.71 2.44 2.52 1.69 1.13
MEAT, POULTRY, SEAFOOD MIXED DISHES 2.37 1.38 1.40 1.46 2.24 2.96 2.95 2.79
SOUPS 1.44 1.83 1.23 1.48 1.60 0.99 1.51 1.42
VEGETABLES (Incl. Beans and Peas, not Starchy)
1.01 0.27 0.22 0.71 1.26 0.84 1.47 0.81
SEAFOOD (Not Incl. Mixed Dishes) 0.79 0.39 0.48 0.41 0.72 1.06 1.11 0.76
MEATS (Not Incl. Deli and Mixed Dishes) 0.24 0.27 0.13 0.17 0.20 0.25 0.30 0.31
CHEESE 0.23 0.03 0.39 0.98 0.16 0.08 0.13 0.01
CONDIMENTS AND GRAVIES 0.22 0.19 0.15 0.21 0.32 0.14 0.17 0.28
STARCHY VEGETABLES 0.11 0.14 0.02 0.09 0.09 0.27 0.08 0.12
SUGAR-SWEETENED AND DIET BEVERAGES
0.11 0.05 0.06 0.12 0.18 0.09 0.08 0.05
CANDY AND SUGARS 0.07 0.05 0.04 0.08 0.13 0.05 0.07 0.03

56
2020 Dietary Guidelines Advisory Committee Data Supplement: Food Category Sources
https://www.dietaryguidelines.gov/2020-advisory-committee-report/data-analysis
NUTS, SEEDS, AND SOY 0.06 0.19 0.11 0.00 0.05 0.00 0.10 0.00
EGGS 0.06 0.00 0.00 0.00 0.10 0.00 0.11 0.01
HIGHER FAT MILK/YOGURT 0.02 0.02 0.00 0.00 0.01 0.00 0.05 0.00
LOW-FAT MILK/YOGURT 0.01 0.00 0.00 0.00 0.00 0.04 0.00 0.00
FRUIT (Non-Juice) 0.00 0.00 0.03 0.00 0.00 0.00 0.00 0.00
DELI/CURED PRODUCTS (Meat and Poultry) 0.00 0.00 0.00 0.00 0.00 0.00 0.00 0.01
WATERS 0.00 0.00 0.00 0.00 0.00 0.00 0.00 0.01
100% FRUIT JUICE 0.00 0.00 0.00 0.00 0.00 0.00 0.00 0.00
COFFEE AND TEA 0.00 0.00 0.00 0.00 0.00 0.00 0.00 0.00
ALCOHOLIC BEVERAGES 0.00 0.00 0.00 0.00 0.00 0.00 0.00 0.00
SALAD DRESSINGS 0.00 0.00 0.00 0.00 0.00 0.00 0.00 0.00
SPREADS 0.00 0.00 0.00 0.00 0.00 0.00 0.00 0.00
TOTAL* 98.76 98.72 99.61 99.71 99.51 99.21 98.86 98.73
*Totals are less than 100% because results do not include baby foods, infant formulas and WWEIA category - other
(continued from previous page)

57
2020 Dietary Guidelines Advisory Committee Data Supplement: Food Category Sources
https://www.dietaryguidelines.gov/2020-advisory-committee-report/data-analysis
Figure 3. 1: Males and Females – Distribution of total grains intake (percentages) across major categories
100
90
80
70
60
50
40
30
20
10
0 2+
DAIRY
MIXED DISHES
2-5 years 6-11 years 12-19 years 20-40 years 41-50 years 51-70 years
PROTEIN FOODS
GRAINS
71+
SNACKS AND SWEETS FRUITS+FRUIT JUICE
VEGETABLES BEVERAGES (Not incl. Milk and 100% Fruit Juice)
CONDIMENTS, GRAVIES, SPREADS, SALAD DRESSINGS
%

58
2020 Dietary Guidelines Advisory Committee Data Supplement: Food Category Sources
https://www.dietaryguidelines.gov/2020-advisory-committee-report/data-analysis
Figure 3. 2: Males and Females – Distribution of total grains intake (percentages) across top 10 sub- categories
100
90
80
70
60
50
40
30
20
10
0 2+ 2-5 years 6-11 years 12-19 years 20-40 years 41-50 years 51-70 years 71+
BURGERS AND SANDWICHES (incl. tacos and burritos) YEAST BREADS AND TORTILLAS
RICE, PASTA AND OTHER GRAIN-BASED MIXED DISHEs DESSERTS AND SWEET SNACKS
CHIPS, CRACKERS, AND SAVORY SNACKS BREAKFAST CEREALS AND BARS
PIZZA RICE AND PASTA
QUICK BREADS (Biscuits, Muffins, Pancakes, Waffles) POULTRY (Not incl. Deli and Mixed Dishes)
%

59
2020 Dietary Guidelines Advisory Committee Data Supplement: Food Category Sources
https://www.dietaryguidelines.gov/2020-advisory-committee-report/data-analysis
Figure 3. 3: Males - Distribution of total grains intake (percentages) across major categories
100
90
80
70
60
50
40
30
20
10
0 2+ 2-5 years 6-11 years 12-19 years 20-40 years 41-50 years 51-70 years 71+
DAIRY PROTEIN FOODS
MIXED DISHES GRAINS
SNACKS AND SWEETS FRUITS+FRUIT JUICE
VEGETABLES BEVERAGES (Not incl. Milk and 100% Fruit Juice)
CONDIMENTS, GRAVIES, SPREADS, SALAD DRESSINGS
%

60
2020 Dietary Guidelines Advisory Committee Data Supplement: Food Category Sources
https://www.dietaryguidelines.gov/2020-advisory-committee-report/data-analysis
Figure 3. 4: Males - Distribution of total grains intake (percentages) across top 10 sub-categories
100
90
80
70
60
50
40
30
20
10
0 2+ 2-5 years 6-11 years 12-19 years 20-40 years 41-50 years 51-70 years 71+
BURGERS AND SANDWICHES (incl. tacos and burritos) YEAST BREADS AND TORTILLAS
RICE, PASTA AND OTHER GRAIN-BASED MIXED DISHEs DESSERTS AND SWEET SNACKS
CHIPS, CRACKERS, AND SAVORY SNACKS BREAKFAST CEREALS AND BARS
PIZZA RICE AND PASTA
QUICK BREADS (Biscuits, Muffins, Pancakes, Waffles) POULTRY (Not incl. Deli and Mixed Dishes)
%

61
2020 Dietary Guidelines Advisory Committee Data Supplement: Food Category Sources
https://www.dietaryguidelines.gov/2020-advisory-committee-report/data-analysis
Figure 3. 5: Females - Distribution of total grains intake (percentages) across major categories
100
90
80
70
60
50
40
30
20
10
0 2+
DAIRY
MIXED DISHES
2-5 years 6-11 years 12-19 years 20-40 years 41-50 years 51-70 years
PROTEIN FOODS
GRAINS
71+
SNACKS AND SWEETS FRUITS+FRUIT JUICE
VEGETABLES BEVERAGES (Not incl. Milk and 100% Fruit Juice)
CONDIMENTS, GRAVIES, SPREADS, SALAD DRESSINGS
%

62
2020 Dietary Guidelines Advisory Committee Data Supplement: Food Category Sources
https://www.dietaryguidelines.gov/2020-advisory-committee-report/data-analysis
Figure 3. 6: Females – Distribution of total grains intake (percentages) across top 10 sub-categories
100
90
80
70
60
50
40
30
20
10
0 2+ 2-5 years 6-11 years 12-19 years 20-40 years 41-50 years 51-70 years 71+
BURGERS AND SANDWICHES (incl. tacos and burritos) YEAST BREADS AND TORTILLAS
RICE, PASTA AND OTHER GRAIN-BASED MIXED DISHEs DESSERTS AND SWEET SNACKS
CHIPS, CRACKERS, AND SAVORY SNACKS BREAKFAST CEREALS AND BARS
PIZZA RICE AND PASTA
QUICK BREADS (Biscuits, Muffins, Pancakes, Waffles) POULTRY (Not incl. Deli and Mixed Dishes)
%

63
2020 Dietary Guidelines Advisory Committee Data Supplement: Food Category Sources
https://www.dietaryguidelines.gov/2020-advisory-committee-report/data-analysis
Percent of total whole grains intake, 2013-16, for U.S. population ages 2 years
and older, from WWEIA Food Categories
These data are estimates of the percent of whole grains from WWEIA Food Categories, re-grouped into DGAC major categories and sub-categories as described elsewhere, for individuals 2 years and older based on the day 1 dietary recalls from WWEIA, NHANES 2013-16. Breastfed children, and pregnant and lactating women have been excluded. The sample size is 15,807.
WHOLE SAMPLE (MALES + FEMALES)
Table 4. 1: Males and Females- Distribution of total whole grains intake (percentages) across major categories
DGAC major category
Age Groups (Years)
2+ 2-5 6-11 12-19 20-40 41-50 51-70 71+
%
GRAINS 54.83 55.27 51.25 50.51 51.48 54.41 57.13 64.44
MIXED
DISHES 22.30 21.95 24.00 28.57 23.97 18.77 20.68 18.79
SNACKS
AND
SWEETS
20.42 21.34 19.88 17.08 21.70 23.45 20.98 16.11
PROTEIN
FOODS 1.46 0.82 4.51 3.29 0.95 1.66 0.57 0.44
VEGETAB
LES 0.45 0.02 0.17 0.19 0.90 1.11 0.21 0.04
BEVERAG
ES (Not Incl. Milk and 100%
0.17 0.03 0.06 0.16 0.15 0.27 0.25 0.06

64
2020 Dietary Guidelines Advisory Committee Data Supplement: Food Category Sources
https://www.dietaryguidelines.gov/2020-advisory-committee-report/data-analysis
Fruit
Juice)
DAIRY 0.05 0.05 0.07 0.05 0.04 0.10 0.03 0.04
FRUITS+F
RUIT JUICE
0.01 0.00 0.00 0.00 0.03 0.00 0.02 0.00
CONDIME
NTS,
GRAVIES,
SPREADS,
SALAD
DRESSIN GS
0.00 0.00 0.00 0.00 0.00 0.00 0.00 0.00
TOTAL* 99.69 99.47 99.94 99.84 99.22 99.77 99.88 99.93
*Totals are less than 100% because results do not include baby foods, infant formulas and WWEIA category – other
Table 4. 2: Males and Females - Distribution of total whole grains intake (percentages) across sub- categories
DGAC sub-category Age Groups (Years) 2+ 2-5 6-11 12-19 20-40 41-50 51-70 71+
%
BREAKFAST CEREALS AND BARS 36.06 42.15 40.46 39.13 32.92 34.14 33.86 40.34
BURGERS AND SANDWICHES (Incl.
Tacos and Burritos)
19.02 17.37 17.91 20.23 20.95 17.34 19.01 17.19
CHIPS, CRACKERS, AND SAVORY
SNACKS
16.19 13.94 16.60 15.24 18.25 19.04 16.37 9.74
YEAST BREADS AND TORTILLAS 14.49 8.99 7.54 8.47 13.19 15.88 18.69 20.89
DESSERTS AND SWEET SNACKS 4.24 7.39 3.27 1.84 3.45 4.41 4.61 6.38
RICE AND PASTA 3.12 2.15 1.18 1.79 4.39 3.84 3.45 2.23
(continued from previous page)

65
2020 Dietary Guidelines Advisory Committee Data Supplement: Food Category Sources
https://www.dietaryguidelines.gov/2020-advisory-committee-report/data-analysis
RICE, PASTA AND OTHER GRAIN-
BASED MIXED DISHEs
1.85 2.54 1.54 2.87 2.29 1.27 1.55 1.07
PIZZA 1.18 2.04 4.39 5.23 0.14 0.06 0.08 0.00
QUICK BREADS (Biscuits, Muffins,
Pancakes, Waffles)
1.16 1.98 2.08 1.12 0.98 0.56 1.13 0.98
POULTRY (Not Incl. Deli and Mixed
Dishes)
0.80 0.69 4.08 3.14 0.04 0.10 0.01 0.00
SEAFOOD (Not Incl. Mixed Dishes) 0.66 0.07 0.44 0.15 0.92 1.57 0.56 0.44
VEGETABLES (Incl. Beans and Peas, not
Starchy)
0.41 0.00 0.01 0.16 0.82 1.11 0.21 0.04
MEAT, POULTRY, SEAFOOD MIXED
DISHES
0.26 0.00 0.17 0.23 0.59 0.11 0.04 0.53
SUGAR-SWEETENED AND DIET
BEVERAGES
0.16 0.03 0.06 0.16 0.15 0.22 0.25 0.01
HIGHER FAT MILK/YOGURT 0.04 0.05 0.07 0.05 0.04 0.00 0.03 0.04
STARCHY VEGETABLES 0.04 0.02 0.16 0.03 0.08 0.00 0.00 0.00
COFFEE AND TEA 0.01 0.00 0.00 0.00 0.00 0.05 0.00 0.00
FRUIT (Non-Juice) 0.01 0.00 0.00 0.00 0.03 0.00 0.00 0.00
100 FRUIT JUICE 0.01 0.00 0.00 0.00 0.00 0.00 0.02 0.00
LOW-FAT MILK/YOGURT 0.01 0.00 0.00 0.00 0.00 0.10 0.00 0.00
WATERS 0.01 0.00 0.00 0.00 0.00 0.00 0.00 0.05
ALCOHOLIC BEVERAGES 0.00 0.00 0.00 0.00 0.00 0.00 0.00 0.00
CANDY AND SUGARS 0.00 0.00 0.00 0.00 0.00 0.00 0.00 0.00
CHEESE 0.00 0.00 0.00 0.00 0.00 0.00 0.00 0.00
CONDIMENTS AND GRAVIES 0.00 0.00 0.00 0.00 0.00 0.00 0.00 0.00
DELI/CURED PRODUCTS (Meat and
Poultry)
0.00 0.00 0.00 0.00 0.00 0.00 0.00 0.00
EGGS 0.00 0.00 0.00 0.00 0.00 0.00 0.00 0.00
MEATS (Not Incl. Deli and Mixed
Dishes)
0.00 0.00 0.00 0.00 0.00 0.00 0.00 0.00
(continued from previous page)

66
2020 Dietary Guidelines Advisory Committee Data Supplement: Food Category Sources
https://www.dietaryguidelines.gov/2020-advisory-committee-report/data-analysis
NUTS, SEEDS, AND SOY 0.00 0.05 0.00 0.00 0.00 0.00 0.00 0.00
SALAD DRESSINGS 0.00 0.00 0.00 0.00 0.00 0.00 0.00 0.00
SOUPS 0.00 0.00 0.00 0.00 0.00 0.00 0.00 0.00
SPREADS 0.00 0.00 0.00 0.00 0.00 0.00 0.00 0.00 TOTAL* 99.69 99.47 99.94 99.84 99.22 99.77 99.88 99.93
*Totals are less than 100% because results do not include baby foods, infant formulas and WWEIA category – other
MALES
Table 4. 3: Males - Distribution of total whole grains intake (percentages) across major categories
DGAC major category Age Groups (Years)
2+ 2-5 6-11 12-19 20-40 41-50 51-70 71+
%
GRAINS 53.13 52.51 49.29 50.11 50.62 51.89 55.22 64.33
MIXED DISHES 24.48 24.79 27.54 29.71 26.57 21.83 22.78 20.91
SNACKS AND SWEETS 19.18 21.68 17.99 15.52 19.89 23.57 20.94 14.10
PROTEIN FOODS 1.58 0.26 4.70 4.05 1.05 2.54 0.24 0.42
VEGETABLES 0.45 0.05 0.30 0.30 1.10 0.00 0.44 0.00
(continued from previous page)

67
2020 Dietary Guidelines Advisory Committee Data Supplement: Food Category Sources
https://www.dietaryguidelines.gov/2020-advisory-committee-report/data-analysis
BEVERAGES (Not Incl. Milk
and 100% Fruit Juice)
0.11 0.00 0.03 0.16 0.05 0.11 0.26 0.01
DAIRY 0.05 0.00 0.06 0.10 0.00 0.00 0.05 0.09
FRUITS+FRUIT JUICE 0.02 0.00 0.00 0.00 0.07 0.00 0.00 0.00
CONDIMENTS, GRAVIES,
SPREADS, SALAD DRESSINGS
0.00 0.00 0.00 0.00 0.00 0.00 0.00 0.00
GRAINS 53.13 52.51 49.29 50.11 50.62 51.89 55.22 64.33
*Totals are less than 100% because results do not include baby foods, infant formulas and WWEIA category – other
Table 4. 4: Males - Distribution of total whole grains intake (percentages) across sub-categories
DGAC sub-category Age Groups (Years) 2+ 2-5 6-11 12-19 20-40 41-50 51-70 71+
%
BREAKFAST CEREALS AND BARS 35.46 37.81 40.29 36.94 34.55 30.88 32.07 42.97
BURGERS AND SANDWICHES
(Incl. Tacos and Burritos)
21.27 20.70 21.24 21.75 23.87 20.31 21.04 19.82
CHIPS, CRACKERS, AND SAVORY
SNACKS
15.31 14.39 15.41 14.39 17.59 17.96 15.90 8.48
YEAST BREADS AND TORTILLAS 13.52 10.06 5.84 10.31 12.15 15.15 18.11 18.47
(continued from previous page)

68
2020 Dietary Guidelines Advisory Committee Data Supplement: Food Category Sources
https://www.dietaryguidelines.gov/2020-advisory-committee-report/data-analysis
DESSERTS AND SWEET SNACKS 3.87 7.29 2.58 1.14 2.30 5.62 5.03 5.62
RICE AND PASTA 2.88 2.18 0.88 1.79 2.76 5.34 3.73 2.59
RICE, PASTA AND OTHER GRAIN-
BASED MIXED DISHEs
1.82 2.38 1.11 3.43 1.95 1.40 1.67 0.92
QUICK BREADS (Biscuits, Muffins,
Pancakes, Waffles)
1.27 2.46 2.27 1.06 1.16 0.52 1.32 0.30
PIZZA 1.19 1.71 4.89 4.53 0.19 0.06 0.07 0.00
POULTRY (Not Incl. Deli and Mixed
Dishes)
0.91 0.15 4.37 3.80 0.00 0.15 0.00 0.00
SEAFOOD (Not Incl. Mixed Dishes) 0.68 0.11 0.33 0.25 1.05 2.38 0.23 0.41
VEGETABLES (Incl. Beans and
Peas, not Starchy)
0.40 0.00 0.01 0.27 1.01 0.00 0.44 0.00
MEAT, POULTRY, SEAFOOD
MIXED DISHES
0.20 0.00 0.30 0.00 0.56 0.06 0.01 0.16
SUGAR-SWEETENED AND DIET
BEVERAGES
0.10 0.00 0.03 0.16 0.05 0.00 0.26 0.01
STARCHY VEGETABLES 0.06 0.05 0.29 0.03 0.09 0.00 0.00 0.00
HIGHER FAT MILK/YOGURT 0.05 0.00 0.06 0.10 0.00 0.00 0.05 0.09
FRUIT (Non-Juice) 0.02 0.00 0.00 0.00 0.07 0.00 0.00 0.00
COFFEE AND TEA 0.01 0.00 0.00 0.00 0.00 0.11 0.00 0.00
ALCOHOLIC BEVERAGES 0.00 0.00 0.00 0.00 0.00 0.00 0.00 0.00
CANDY AND SUGARS 0.00 0.00 0.00 0.00 0.00 0.00 0.00 0.00
CHEESE 0.00 0.00 0.00 0.00 0.00 0.00 0.00 0.00
CONDIMENTS AND GRAVIES 0.00 0.00 0.00 0.00 0.00 0.00 0.00 0.00
DELI/CURED PRODUCTS (Meat
and Poultry)
0.00 0.00 0.00 0.00 0.00 0.00 0.00 0.00
EGGS 0.00 0.00 0.00 0.00 0.00 0.00 0.00 0.00
100 FRUIT JUICE 0.00 0.00 0.00 0.00 0.00 0.00 0.00 0.00
LOW-FAT MILK/YOGURT 0.00 0.00 0.00 0.00 0.00 0.00 0.00 0.00
(continued from previous page)

69
2020 Dietary Guidelines Advisory Committee Data Supplement: Food Category Sources
https://www.dietaryguidelines.gov/2020-advisory-committee-report/data-analysis
MEATS (Not Incl. Deli and Mixed
Dishes)
0.00 0.00 0.00 0.00 0.00 0.00 0.00 0.00
NUTS, SEEDS, AND SOY 0.00 0.00 0.00 0.00 0.00 0.00 0.00 0.00
SALAD DRESSINGS 0.00 0.00 0.00 0.00 0.00 0.00 0.00 0.00
SOUPS 0.00 0.00 0.00 0.00 0.00 0.00 0.00 0.00
SPREADS 0.00 0.00 0.00 0.00 0.00 0.00 0.00 0.00
WATERS 0.00 0.00 0.00 0.00 0.00 0.00 0.00 0.00 TOTAL* 98.99 99.28 99.91 99.94 99.35 99.94 99.94 99.86
*Totals are less than 100% because results do not include baby foods, infant formulas and WWEIA category – other
FEMALES
Table 4. 5: Females - Distribution of total whole grains intake (percentages) across major categories
DGAC major category Age Groups (Years)
2+ 2-5 6-11 12-19 20-40 41-50 51-70 71+
%
GRAINS 56.27 57.77 53.62 50.93 52.39 56.49 58.77 64.53
SNACKS AND SWEETS 21.18 21.03 22.15 18.69 23.64 23.34 21.02 17.74
MIXED DISHES 19.58 19.38 19.75 27.38 21.18 16.25 18.87 17.09
PROTEIN FOODS 1.29 1.33 4.28 2.49 0.84 0.94 0.86 0.45
(continued from previous page)

70
2020 Dietary Guidelines Advisory Committee Data Supplement: Food Category Sources
https://www.dietaryguidelines.gov/2020-advisory-committee-report/data-analysis
VEGETABLES 0.42 0.00 0.00 0.07 0.70 2.03 0.01 0.08
BEVERAGES (Not Incl. Milk
and 100% Fruit Juice)
0.21 0.06 0.10 0.16 0.25 0.40 0.24 0.09
DAIRY 0.06 0.09 0.08 0.00 0.09 0.19 0.01 0.01
FRUITS+FRUIT JUICE 0.01 0.00 0.00 0.00 0.00 0.00 0.04 0.00
CONDIMENTS, GRAVIES,
SPREADS, SALAD DRESSINGS
0.00 0.00 0.00 0.00 0.00 0.00 0.00 0.00
TOTAL* 99.02 99.64 99.97 99.72 99.09 99.63 99.83 99.99
*Totals are less than 100% because results do not include baby foods, infant formulas and WWEIA category – other
Table 4. 6: Females - Distribution of total whole grains intake (percentages) across sub-categories
DGAC sub-category Age Groups (Years)
2+ 2-5 6-11 12-19 20-40 41-50 51-70 71+
%
BREAKFAST CEREALS AND BARS 36.68 46.07 40.66 41.40 31.18 36.82 35.40 38.21
CHIPS, CRACKERS, AND SAVORY
SNACKS 16.59 13.54 18.04 16.12 18.95 19.94 16.77 10.76
BURGERS AND SANDWICHES
(Incl. Tacos and Burritos) 16.30 14.36 13.92 18.66 17.81 14.88 17.26 15.06
(continued from previous page)

71
2020 Dietary Guidelines Advisory Committee Data Supplement: Food Category Sources
https://www.dietaryguidelines.gov/2020-advisory-committee-report/data-analysis
YEAST BREADS AND TORTILLAS 15.26 8.03 9.58 6.55 14.30 16.49 19.18 22.85
DESSERTS AND SWEET SNACKS 4.59 7.49 4.10 2.57 4.68 3.40 4.24 6.99
RICE AND PASTA 3.26 2.12 1.53 1.80 6.14 2.60 3.22 1.94
RICE, PASTA AND OTHER
GRAIN-BASED MIXED DISHEs 1.86 2.68 2.05 2.30 2.66 1.16 1.45 1.19
PIZZA 1.11 2.34 3.78 5.95 0.09 0.05 0.09 0.00
QUICK BREADS (Biscuits, Muffins,
Pancakes, Waffles) 1.07 1.55 1.86 1.19 0.78 0.58 0.97 1.53
POULTRY (Not Incl. Deli and
Mixed Dishes) 0.66 1.18 3.72 2.44 0.07 0.05 0.02 0.00
SEAFOOD (Not Incl. Mixed Dishes) 0.62 0.04 0.56 0.05 0.77 0.89 0.84 0.45
VEGETABLES (Incl. Beans and
Peas, not Starchy) 0.40 0.00 0.00 0.05 0.63 2.03 0.01 0.08
MEAT, POULTRY, SEAFOOD
MIXED DISHES 0.32 0.00 0.00 0.47 0.62 0.14 0.07 0.84
SUGAR-SWEETENED AND DIET
BEVERAGES 0.20 0.06 0.10 0.16 0.25 0.40 0.24 0.00
HIGHER FAT MILK/YOGURT 0.04 0.09 0.08 0.00 0.09 0.00 0.01 0.01
LOW-FAT MILK/YOGURT 0.02 0.00 0.00 0.00 0.00 0.19 0.00 0.00
STARCHY VEGETABLES 0.02 0.00 0.00 0.02 0.07 0.00 0.00 0.00
100 FRUIT JUICE 0.01 0.00 0.00 0.00 0.00 0.00 0.03 0.00
NUTS, SEEDS, AND SOY 0.01 0.10 0.00 0.00 0.00 0.00 0.00 0.00
WATERS 0.01 0.00 0.00 0.00 0.00 0.00 0.00 0.09
ALCOHOLIC BEVERAGES 0.00 0.00 0.00 0.00 0.00 0.00 0.00 0.00
CANDY AND SUGARS 0.00 0.00 0.00 0.00 0.00 0.00 0.00 0.00
CHEESE 0.00 0.00 0.00 0.00 0.00 0.00 0.00 0.00
COFFEE AND TEA 0.00 0.00 0.00 0.00 0.00 0.00 0.00 0.00
CONDIMENTS AND GRAVIES 0.00 0.00 0.00 0.00 0.00 0.00 0.00 0.00
(continued from previous page)

72
2020 Dietary Guidelines Advisory Committee Data Supplement: Food Category Sources
https://www.dietaryguidelines.gov/2020-advisory-committee-report/data-analysis
DELI/CURED PRODUCTS (Meat
and Poultry) 0.00 0.00 0.00 0.00 0.00 0.00 0.00 0.00
EGGS 0.00 0.00 0.00 0.00 0.00 0.00 0.00 0.00
FRUIT (Non-Juice) 0.00 0.00 0.00 0.00 0.00 0.00 0.00 0.00
MEATS (Not Incl. Deli and Mixed
Dishes) 0.00 0.00 0.00 0.00 0.00 0.00 0.00 0.00
SALAD DRESSINGS 0.00 0.00 0.00 0.00 0.00 0.00 0.00 0.00
SOUPS 0.00 0.00 0.00 0.00 0.00 0.00 0.00 0.00
SPREADS 0.00 0.00 0.00 0.00 0.00 0.00 0.00 0.00
TOTAL* 99.02 99.64 99.97 99.72 99.09 99.63 99.83 99.99
*Totals are less than 100% because results do not include baby foods, infant formulas and WWEIA category – other
(continued from previous page)

73
2020 Dietary Guidelines Advisory Committee Data Supplement: Food Category Sources
https://www.dietaryguidelines.gov/2020-advisory-committee-report/data-analysis
90
80
70
60
50
40
30
20
10
0
Figure 4. 1: Males and Females - Distribution of total whole grains intake (percentages) across major categories
71+ 12-19 years 20-40 years 41-50 years 51-70 years6-11 years 2-5 years 2+
DAIRY
MIXED DISHES
100
PROTEIN FOODS
GRAINS
FRUITS+FRUIT JUICE
BEVERAGES (Not incl. Milk and 100% Fruit Juice)
SNACKS AND SWEETS
VEGETABLES
CONDIMENTS, GRAVIES, SPREADS, SALAD DRESSINGS
%

74
2020 Dietary Guidelines Advisory Committee Data Supplement: Food Category Sources
https://www.dietaryguidelines.gov/2020-advisory-committee-report/data-analysis
Figure 4. 2: Males and Females - Distribution of total whole grains intake (percentages) across top 10 sub-categories
100
90
80
70
60
50
40
30
20
10
0 2+ 2-5 years 6-11 years 12-19 years 20-40 years 41-50 years 51-70 years 71+
BREAKFAST CEREALS AND BARS BURGERS AND SANDWICHES (incl. tacos and burritos)
CHIPS, CRACKERS, AND SAVORY SNACKS YEAST BREADS AND TORTILLAS
DESSERTS AND SWEET SNACKS RICE AND PASTA
RICE, PASTA AND OTHER GRAIN-BASED MIXED DISHEs PIZZA
QUICK BREADS (Biscuits, Muffins, Pancakes, Waffles)
%

75
2020 Dietary Guidelines Advisory Committee Data Supplement: Food Category Sources
https://www.dietaryguidelines.gov/2020-advisory-committee-report/data-analysis
Figure 4. 3: Males - Distribution of total whole grains intake (percentages) across major categories
100
90
80
70
60
50
40
30
20
10
0 2+
DAIRY
2-5 years 6-11 years 12-19 years 20-40 years 41-50 years 51-70 years
PROTEIN FOODS
71+
MIXED DISHES GRAINS
SNACKS AND SWEETS FRUITS+FRUIT JUICE
VEGETABLES BEVERAGES (Not incl. Milk and 100% Fruit Juice)
CONDIMENTS, GRAVIES, SPREADS, SALAD DRESSINGS
%
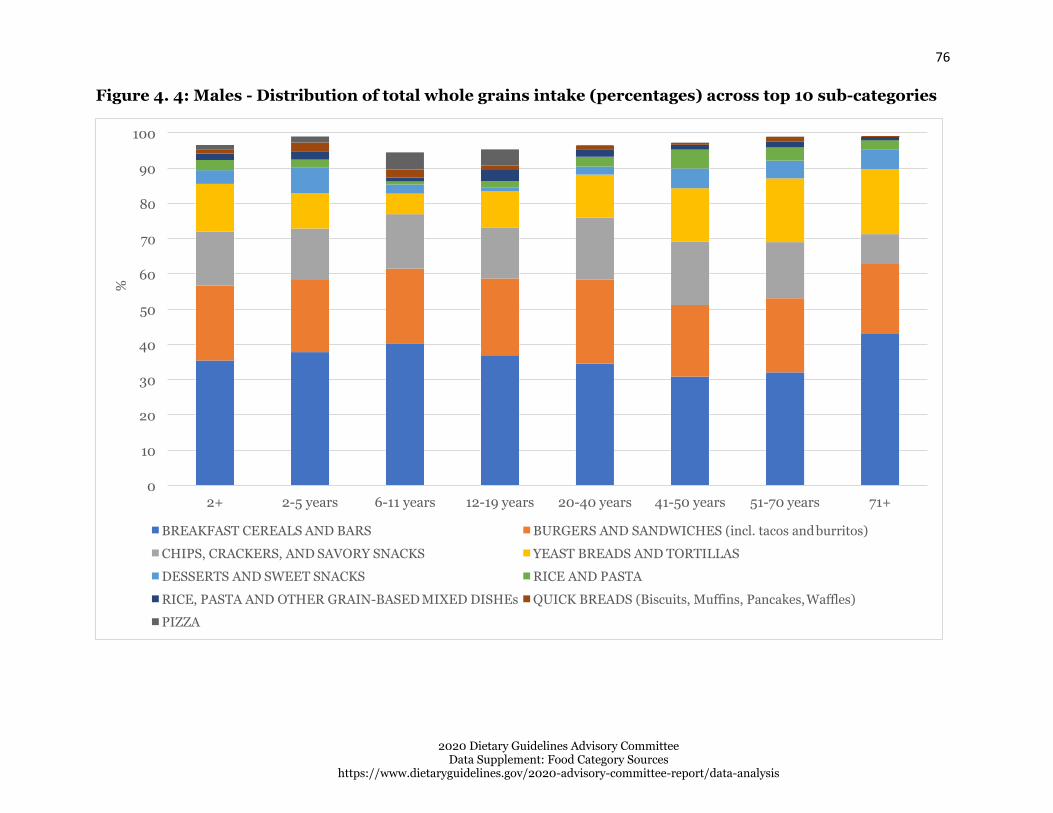
76
2020 Dietary Guidelines Advisory Committee Data Supplement: Food Category Sources
https://www.dietaryguidelines.gov/2020-advisory-committee-report/data-analysis
BREAKFAST CEREALS AND BARS BURGERS AND SANDWICHES (incl. tacos and burritos)
CHIPS, CRACKERS, AND SAVORY SNACKS YEAST BREADS AND TORTILLAS
DESSERTS AND SWEET SNACKS RICE AND PASTA
RICE, PASTA AND OTHER GRAIN-BASED MIXED DISHEs QUICK BREADS (Biscuits, Muffins, Pancakes, Waffles)
PIZZA
Figure 4. 4: Males - Distribution of total whole grains intake (percentages) across top 10 sub-categories
71+ 12-19 years 20-40 years 41-50 years 51-70 years6-11 years2-5 years2+
100
90
80
70
60
50
40
30
20
10
0
%

77
2020 Dietary Guidelines Advisory Committee Data Supplement: Food Category Sources
https://www.dietaryguidelines.gov/2020-advisory-committee-report/data-analysis
Figure 4. 5: Females - Distribution of total whole grains intake (percentages) across major categories
100
90
80
70
60
50
40
30
20
10
0
2+
DAIRY
2-5 years 6-11 years 12-19 years 20-40 years 41-50 years 51-70 years
PROTEIN FOODS
71+
MIXED DISHES GRAINS
SNACKS AND SWEETS FRUITS+FRUIT JUICE
VEGETABLES BEVERAGES (Not incl. Milk and 100% Fruit Juice)
CONDIMENTS, GRAVIES, SPREADS, SALAD DRESSINGS
%

78
2020 Dietary Guidelines Advisory Committee Data Supplement: Food Category Sources
https://www.dietaryguidelines.gov/2020-advisory-committee-report/data-analysis
BREAKFAST CEREALS AND BARS CHIPS, CRACKERS, AND SAVORY SNACKS
BURGERS AND SANDWICHES (incl. tacos and burritos) YEAST BREADS AND TORTILLAS
DESSERTS AND SWEET SNACKS RICE AND PASTA
RICE, PASTA AND OTHER GRAIN-BASED MIXED DISHEs PIZZA
QUICK BREADS (Biscuits, Muffins, Pancakes, Waffles) POULTRY (Not incl. Deli and Mixed Dishes)
Figure 4. 6: Females - Distribution of total whole grains intake (percentages) across top 10 sub-categories
71+ 51-70 years20-40 years 41-50 years12-19 years6-11 years2-5 years2+
100
90
80
70
60
50
40
30
20
10
0
%

79
2020 Dietary Guidelines Advisory Committee Data Supplement: Food Category Sources
https://www.dietaryguidelines.gov/2020-advisory-committee-report/data-analysis
Percent of total refined grains intake, 2013-16, for U.S. population ages 2 years
and older, from WWEIA Food Categories
These data are estimates of the percent of total refined grains from WWEIA Food Categories, re-grouped into DGAC major categories and sub-categories as described elsewhere, for individuals 2 years and older based on the day 1 dietary recalls from WWEIA, NHANES 2013-16. Breastfed children, and pregnant and lactating women have been excluded. The sample size is 15,807.
WHOLE SAMPLE (MALES + FEMALES)
Table 5. 1: Males and Females- Distribution of total refined grains intake (percentages) across major categories
DGAC major category Age Groups (Years)
2+ 2-5 6-11 12-19 20-40 41-50 51-70 71+
%
MIXED DISHES 48.48 41.50 46.93 51.35 54.19 48.68 45.22 41.19
GRAINS 25.13 24.18 23.98 22.88 22.09 26.08 27.72 30.46
SNACKS AND SWEETS 19.67 26.78 23.31 18.92 17.13 18.21 20.18 21.93
PROTEIN FOODS 4.26 5.75 4.62 4.82 4.29 5.05 3.59 3.04
VEGETABLES 1.12 0.43 0.25 0.82 1.20 1.02 1.63 1.06
CONDIMENTS, GRAVIES, SPREADS, SALAD DRESSINGS
0.24 0.13 0.14 0.29 0.24 0.17 0.25 0.34
DAIRY 0.21 0.06 0.34 0.53 0.29 0.09 0.12 0.01
BEVERAGES (Not Incl. Milk and 100% Fruit Juice)
0.08 0.05 0.05 0.07 0.14 0.12 0.03 0.04
FRUITS+FRUIT JUICE 0.00 0.00 0.02 0.00 0.00 0.00 0.00 0.01
TOTAL* 99.19 98.88 99.65 99.69 99.57 99.43 98.74 98.08
*Totals are less than 100% because results do not include baby foods, infant formulas and WWEIA category – other

80
2020 Dietary Guidelines Advisory Committee Data Supplement: Food Category Sources
https://www.dietaryguidelines.gov/2020-advisory-committee-report/data-analysis
Table 5. 2: Males and Females - Distribution of total refined grains intake (percentages) across sub- categories
DGAC sub-category Age Groups (Years)
2+ 2-5 6-11 12-19 20-40 41-50 51-70 71+
%
BURGERS AND SANDWICHES (Incl. Tacos and Burritos)
25.06 17.70 21.29 25.32 28.24 26.24 24.16 23.01
YEAST BREADS AND TORTILLAS 12.02 7.70 9.57 8.55 10.60 13.37 14.47 16.45
RICE, PASTA AND OTHER GRAIN-BASED MIXED DISHES
11.97 12.69 11.82 11.42 13.34 12.39 11.29 9.21
DESSERTS AND SWEET SNACKS 11.13 13.11 11.67 9.96 8.89 10.40 12.07 16.49
CHIPS, CRACKERS, AND SAVORY SNACKS
8.44 13.62 11.49 8.88 8.06 7.75 8.05 5.39
PIZZA 6.93 7.45 10.13 10.86 8.31 6.00 4.43 3.16
QUICK BREADS (Biscuits, Muffins, Pancakes, Waffles)
4.87 7.18 6.92 5.45 3.42 4.53 5.23 5.16
RICE AND PASTA 4.43 3.74 3.57 3.84 5.20 4.99 4.17 3.76
BREAKFAST CEREALS AND BARS 3.81 5.56 3.92 5.04 2.87 3.19 3.85 5.09
POULTRY (Not Incl. Deli and Mixed Dishes)
2.90 4.75 3.88 4.15 3.08 2.86 2.02 1.52
MEAT, POULTRY, SEAFOOD MIXED DISHES
2.86 1.38 1.92 2.17 2.76 2.84 3.52 3.88
SOUPS 1.66 2.28 1.78 1.59 1.54 1.21 1.82 1.93
VEGETABLES (Incl. Beans and Peas, not Starchy)
0.96 0.31 0.17 0.71 0.99 0.81 1.54 0.88
SEAFOOD (Not Incl. Mixed Dishes) 0.91 0.57 0.41 0.46 0.77 1.54 1.06 1.18
MEATS (Not Incl. Deli and Mixed Dishes) 0.33 0.28 0.27 0.20 0.29 0.51 0.37 0.28
CONDIMENTS AND GRAVIES 0.24 0.13 0.14 0.29 0.24 0.17 0.25 0.34
CHEESE 0.20 0.06 0.34 0.53 0.28 0.06 0.09 0.01
STARCHY VEGETABLES 0.15 0.13 0.08 0.11 0.21 0.21 0.09 0.18
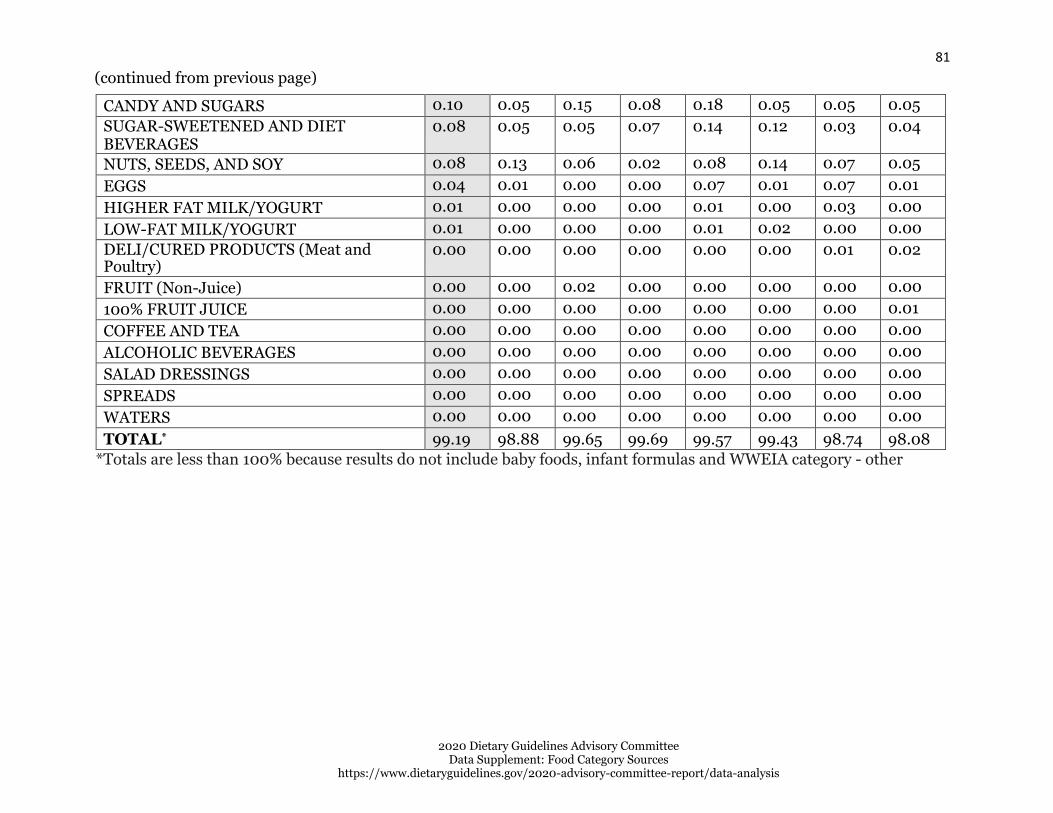
81
2020 Dietary Guidelines Advisory Committee Data Supplement: Food Category Sources
https://www.dietaryguidelines.gov/2020-advisory-committee-report/data-analysis
CANDY AND SUGARS 0.10 0.05 0.15 0.08 0.18 0.05 0.05 0.05
SUGAR-SWEETENED AND DIET BEVERAGES
0.08 0.05 0.05 0.07 0.14 0.12 0.03 0.04
NUTS, SEEDS, AND SOY 0.08 0.13 0.06 0.02 0.08 0.14 0.07 0.05
EGGS 0.04 0.01 0.00 0.00 0.07 0.01 0.07 0.01
HIGHER FAT MILK/YOGURT 0.01 0.00 0.00 0.00 0.01 0.00 0.03 0.00
LOW-FAT MILK/YOGURT 0.01 0.00 0.00 0.00 0.01 0.02 0.00 0.00
DELI/CURED PRODUCTS (Meat and Poultry)
0.00 0.00 0.00 0.00 0.00 0.00 0.01 0.02
FRUIT (Non-Juice) 0.00 0.00 0.02 0.00 0.00 0.00 0.00 0.00
100% FRUIT JUICE 0.00 0.00 0.00 0.00 0.00 0.00 0.00 0.01
COFFEE AND TEA 0.00 0.00 0.00 0.00 0.00 0.00 0.00 0.00
ALCOHOLIC BEVERAGES 0.00 0.00 0.00 0.00 0.00 0.00 0.00 0.00
SALAD DRESSINGS 0.00 0.00 0.00 0.00 0.00 0.00 0.00 0.00
SPREADS 0.00 0.00 0.00 0.00 0.00 0.00 0.00 0.00
WATERS 0.00 0.00 0.00 0.00 0.00 0.00 0.00 0.00
TOTAL* 99.19 98.88 99.65 99.69 99.57 99.43 98.74 98.08
*Totals are less than 100% because results do not include baby foods, infant formulas and WWEIA category - other
(continued from previous page)

82
2020 Dietary Guidelines Advisory Committee Data Supplement: Food Category Sources
https://www.dietaryguidelines.gov/2020-advisory-committee-report/data-analysis
MALES
Table 5. 3: Males - Distribution of total refined grains intake (percentages) across major categories
DGAC major category Age Groups (Years)
2+ 2-5 6-11 12-19 20-40 41-50 51-70 71+
%
MIXED DISHES 50.65 41.54 49.42 53.43 57.84 50.61 46.63 43.82
GRAINS 24.68 25.06 22.34 21.65 21.05 26.66 28.65 30.28
SNACKS AND SWEETS 17.93 27.21 22.37 18.47 14.64 15.90 18.65 19.12
PROTEIN FOODS 4.29 5.02 4.94 4.92 4.52 5.28 3.30 3.01
VEGETABLES 0.98 0.36 0.17 0.71 1.07 1.03 1.37 1.11
CONDIMENTS, GRAVIES, SPREADS, SALAD DRESSINGS
0.18 0.05 0.13 0.18 0.16 0.12 0.26 0.18
DAIRY 0.14 0.09 0.27 0.30 0.21 0.07 0.03 0.01
BEVERAGES (Not Incl. Milk and 100% Fruit Juice)
0.08 0.04 0.04 0.02 0.11 0.18 0.01 0.01
FRUITS+FRUIT JUICE 0.00 0.00 0.00 0.00 0.00 0.00 0.00 0.02
TOTAL* 98.92 99.36 99.68 99.69 99.60 99.85 98.92 97.55
*Totals are less than 100% because results do not include baby foods, infant formulas and WWEIA category - other

83
2020 Dietary Guidelines Advisory Committee Data Supplement: Food Category Sources
https://www.dietaryguidelines.gov/2020-advisory-committee-report/data-analysis
Table 5. 4: Males - Distribution of total refined grains intake (percentages) across sub-categories
DGAC sub-category Age Groups (Years)
2+ 2-5 6-11 12-19 20-40 41-50 51-70 71+
%
BURGERS AND SANDWICHES (Incl. Tacos and Burritos)
27.05 19.16 21.96 27.36 31.32 28.75 26.29 24.92
YEAST BREADS AND TORTILLAS 11.96 7.89 8.30 7.89 9.97 14.33 15.59 17.57
RICE, PASTA AND OTHER GRAIN- BASED MIXED DISHES
11.89 11.91 11.67 10.51 13.38 13.31 10.55 9.99
DESSERTS AND SWEET SNACKS 10.34 13.06 11.36 10.29 7.78 9.87 11.47 15.13
CHIPS, CRACKERS, AND SAVORY SNACKS
7.48 14.11 10.77 8.11 6.69 5.99 7.14 3.92
PIZZA 7.36 8.19 11.45 11.36 9.04 5.17 4.90 2.20
QUICK BREADS (Biscuits, Muffins, Pancakes, Waffles)
4.74 8.13 6.92 5.23 3.18 3.87 5.45 4.91
RICE AND PASTA 4.34 3.86 3.22 3.37 5.13 5.25 4.15 3.07
BREAKFAST CEREALS AND BARS 3.63 5.18 3.90 5.16 2.77 3.22 3.47 4.74
POULTRY (Not Incl. Deli and Mixed Dishes)
2.98 4.20 4.21 4.22 3.28 2.63 1.99 1.57
MEAT, POULTRY, SEAFOOD MIXED DISHES
2.81 0.92 2.26 2.70 2.80 2.12 3.26 4.49
SOUPS 1.54 1.36 2.08 1.49 1.30 1.25 1.63 2.21
SEAFOOD (Not Incl. Mixed Dishes) 0.87 0.64 0.33 0.43 0.77 1.83 0.85 1.20
VEGETABLES (Incl. Beans and Peas, not Starchy)
0.81 0.32 0.07 0.59 0.78 0.90 1.28 0.89
MEATS (Not Incl. Deli and Mixed Dishes) 0.35 0.16 0.39 0.24 0.35 0.53 0.42 0.11
CONDIMENTS AND GRAVIES 0.18 0.05 0.13 0.18 0.16 0.12 0.26 0.18
STARCHY VEGETABLES 0.17 0.04 0.10 0.12 0.29 0.13 0.10 0.22
CHEESE 0.13 0.09 0.27 0.30 0.20 0.05 0.03 0.00
CANDY AND SUGARS 0.10 0.03 0.24 0.07 0.16 0.04 0.04 0.07
NUTS, SEEDS, AND SOY 0.08 0.01 0.00 0.03 0.10 0.28 0.02 0.10

84
2020 Dietary Guidelines Advisory Committee Data Supplement: Food Category Sources
https://www.dietaryguidelines.gov/2020-advisory-committee-report/data-analysis
SUGAR-SWEETENED AND DIET BEVERAGES
0.08 0.04 0.04 0.02 0.11 0.18 0.01 0.01
EGGS 0.01 0.01 0.01 0.00 0.02 0.02 0.01 0.00
HIGHER FAT MILK/YOGURT 0.00 0.00 0.00 0.00 0.01 0.01 0.00 0.01
DELI/CURED PRODUCTS (Meat and Poultry)
0.00 0.00 0.00 0.00 0.00 0.00 0.00 0.02
LOW-FAT MILK/YOGURT 0.00 0.00 0.00 0.00 0.00 0.01 0.00 0.01
100% FRUIT JUICE 0.00 0.00 0.00 0.00 0.00 0.00 0.00 0.02
FRUIT (Non-Juice) 0.00 0.00 0.00 0.00 0.00 0.00 0.00 0.00
ALCOHOLIC BEVERAGES 0.00 0.00 0.00 0.00 0.00 0.00 0.00 0.00
COFFEE AND TEA 0.00 0.00 0.00 0.00 0.00 0.00 0.00 0.00
SALAD DRESSINGS 0.00 0.00 0.00 0.00 0.00 0.00 0.00 0.00
SPREADS 0.00 0.00 0.00 0.00 0.00 0.00 0.00 0.00
WATERS 0.00 0.00 0.00 0.00 0.00 0.00 0.00 0.00
TOTAL* 98.92 99.36 99.68 99.69 99.60 99.85 98.92 97.55
*Totals are less than 100% because results do not include baby foods, infant formulas and WWEIA category - other
(continued from previous page)

85
2020 Dietary Guidelines Advisory Committee Data Supplement: Food Category Sources
https://www.dietaryguidelines.gov/2020-advisory-committee-report/data-analysis
FEMALES
Table 5. 5: Females - Distribution of total refined grains intake (percentages) across major categories
DGAC major category Age Groups (Years)
2+ 2-5 6-11 12-19 20-40 41-50 51-70 71+
%
MIXED DISHES 45.62 41.47 44.10 49.28 49.98 46.94 43.91 39.09
GRAINS 25.47 23.36 25.85 24.11 23.29 25.56 26.86 30.60
SNACKS AND SWEETS 21.50 26.38 24.39 19.36 19.99 20.28 21.59 24.17
PROTEIN FOODS 4.22 6.42 4.27 4.71 4.02 4.84 3.87 3.07
VEGETABLES 1.22 0.51 0.34 0.93 1.36 1.01 1.87 1.02
CONDIMENTS, GRAVIES, SPREADS, SALAD DRESSINGS
0.29 0.20 0.16 0.40 0.34 0.23 0.24 0.47
DAIRY 0.29 0.03 0.41 0.77 0.39 0.11 0.19 0.01
BEVERAGES (Not Incl. Milk and 100% Fruit Juice)
0.09 0.06 0.06 0.11 0.17 0.07 0.05 0.05
FRUITS+FRUIT JUICE 0.00 0.00 0.04 0.00 0.00 0.00 0.00 0.00
TOTAL* 98.70 98.44 99.61 99.68 99.54 99.05 98.58 98.49
*Totals are less than 100% because results do not include baby foods, infant formulas and WWEIA category - other

86
2020 Dietary Guidelines Advisory Committee Data Supplement: Food Category Sources
https://www.dietaryguidelines.gov/2020-advisory-committee-report/data-analysis
Table 5. 6: Females - Distribution of total refined grains intake (percentages) across sub-categories
DGAC sub-category Age Groups (Years)
2+ 2-5 6-11 12-19 20-40 41-50 51-70 71+
%
BURGERS AND SANDWICHES (Incl. Tacos and Burritos)
22.48 16.35 20.53 23.27 24.70 23.98 22.20 21.50
RICE, PASTA AND OTHER GRAIN- BASED MIXED DISHES
12.05 13.42 11.98 12.32 13.28 11.57 11.97 8.59
YEAST BREADS AND TORTILLAS 11.98 7.51 11.02 9.21 11.33 12.50 13.44 15.56
DESSERTS AND SWEET SNACKS 11.88 13.15 12.04 9.62 10.16 10.89 12.63 17.57
CHIPS, CRACKERS, AND SAVORY SNACKS
9.53 13.17 12.31 9.65 9.64 9.33 8.89 6.56
PIZZA 6.41 6.76 8.62 10.37 7.47 6.75 3.99 3.92
QUICK BREADS (Biscuits, Muffins, Pancakes, Waffles)
4.97 6.31 6.92 5.67 3.69 5.13 5.04 5.37
RICE AND PASTA 4.54 3.63 3.96 4.30 5.27 4.76 4.19 4.30
BREAKFAST CEREALS AND BARS 3.98 5.91 3.95 4.92 3.00 3.17 4.20 5.37
MEAT, POULTRY, SEAFOOD MIXED DISHES
2.89 1.81 1.54 1.64 2.72 3.49 3.75 3.39
POULTRY (Not Incl. Deli and Mixed Dishes)
2.86 5.27 3.51 4.07 2.85 3.07 2.04 1.47
SOUPS 1.79 3.12 1.43 1.68 1.81 1.16 2.00 1.70
VEGETABLES (Incl. Beans and Peas, not Starchy)
1.09 0.30 0.28 0.83 1.24 0.73 1.78 0.87
SEAFOOD (Not Incl. Mixed Dishes) 0.92 0.51 0.50 0.48 0.76 1.27 1.25 1.16
MEATS (Not Incl. Deli and Mixed Dishes)
0.30 0.40 0.14 0.16 0.22 0.49 0.33 0.41
CONDIMENTS AND GRAVIES 0.29 0.20 0.16 0.40 0.34 0.23 0.24 0.47
CHEESE 0.26 0.03 0.41 0.76 0.37 0.08 0.14 0.01
STARCHY VEGETABLES 0.13 0.21 0.06 0.10 0.11 0.28 0.09 0.15
CANDY AND SUGARS 0.10 0.06 0.05 0.09 0.20 0.06 0.07 0.04

87
2020 Dietary Guidelines Advisory Committee Data Supplement: Food Category Sources
https://www.dietaryguidelines.gov/2020-advisory-committee-report/data-analysis
SUGAR-SWEETENED AND DIET BEVERAGES
0.09 0.06 0.06 0.11 0.17 0.07 0.05 0.05
NUTS, SEEDS, AND SOY 0.07 0.25 0.12 0.01 0.06 0.00 0.12 0.00
EGGS 0.07 0.00 0.00 0.00 0.13 0.00 0.12 0.02
HIGHER FAT MILK/YOGURT 0.02 0.01 0.00 0.00 0.00 0.00 0.06 0.00
LOW-FAT MILK/YOGURT 0.01 0.00 0.00 0.00 0.02 0.03 0.00 0.00
DELI/CURED PRODUCTS (Meat and Poultry)
0.00 0.00 0.00 0.00 0.00 0.00 0.01 0.01
FRUIT (Non-Juice) 0.00 0.00 0.04 0.00 0.00 0.00 0.00 0.00
COFFEE AND TEA 0.00 0.00 0.00 0.00 0.00 0.00 0.00 0.00
ALCOHOLIC BEVERAGES 0.00 0.00 0.00 0.00 0.00 0.00 0.00 0.00
100% FRUIT JUICE 0.00 0.00 0.00 0.00 0.00 0.00 0.00 0.00
SALAD DRESSINGS 0.00 0.00 0.00 0.00 0.00 0.00 0.00 0.00
SPREADS 0.00 0.00 0.00 0.00 0.00 0.00 0.00 0.00
WATERS 0.00 0.00 0.00 0.00 0.00 0.00 0.00 0.00
TOTAL* 98.70 98.44 99.61 99.68 99.54 99.05 98.58 98.49
*Totals are less than 100% because results do not include baby foods, infant formulas and WWEIA category - other
(continued from previous page)

88
2020 Dietary Guidelines Advisory Committee Data Supplement: Food Category Sources
https://www.dietaryguidelines.gov/2020-advisory-committee-report/data-analysis
100
90
80
70
60
50
40
30
20
10
0
Figure 5. 1: Males and Females - Distribution of total refined grains intake (percentages) across major categories
71+ 12-19 years 20-40 years 41-50 years 51-70 years6-11 years 2-5 years 2+
DAIRY
MIXED DISHES
PROTEIN FOODS
GRAINS
FRUITS+FRUIT JUICE
BEVERAGES (Not incl. Milk and 100% Fruit Juice)
SNACKS AND SWEETS
VEGETABLES
CONDIMENTS, GRAVIES, SPREADS, SALAD DRESSINGS
%

89
2020 Dietary Guidelines Advisory Committee Data Supplement: Food Category Sources
https://www.dietaryguidelines.gov/2020-advisory-committee-report/data-analysis
100
90
80
70
60
50
40
30
20
10
0
BURGERS AND SANDWICHES (incl. tacos and burritos) YEAST BREADS AND TORTILLAS
RICE, PASTA AND OTHER GRAIN-BASED MIXED DISHEs DESSERTS AND SWEET SNACKS
CHIPS, CRACKERS, AND SAVORY SNACKS PIZZA
QUICK BREADS (Biscuits, Muffins, Pancakes, Waffles) RICE AND PASTA
BREAKFAST CEREALS AND BARS POULTRY (Not incl. Deli and Mixed Dishes)
Figure 5. 2: Males and Females - Distribution of total refined grains intake (percentages) across top 10 sub-categories
71+ 12-19 years 20-40 years 41-50 years 51-70 years6-11 years 2-5 years 2+
%

90
2020 Dietary Guidelines Advisory Committee Data Supplement: Food Category Sources
https://www.dietaryguidelines.gov/2020-advisory-committee-report/data-analysis
Figure 5. 3: Males - Distribution of total refined grains intake (percentages) across major categories
100
90
80
70
60
50
40
30
20
10
0 2+
DAIRY
MIXED DISHES
2-5 years 6-11 years 12-19 years 20-40 years 41-50 years 51-70 years
PROTEIN FOODS
GRAINS
71+
SNACKS AND SWEETS FRUITS+FRUIT JUICE
VEGETABLES BEVERAGES (Not incl. Milk and 100% Fruit Juice)
CONDIMENTS, GRAVIES, SPREADS, SALAD DRESSINGS
%

91
2020 Dietary Guidelines Advisory Committee Data Supplement: Food Category Sources
https://www.dietaryguidelines.gov/2020-advisory-committee-report/data-analysis
Figure 5. 4: Males - Distribution of total refined grains intake (percentages) across top 10 sub-categories
100
90
80
70
60
50
40
30
20
10
0
2+ 2-5 years 6-11 years 12-19 years 20-40 years 41-50 years 51-70 years 71+
BURGERS AND SANDWICHES (incl. tacos and burritos) YEAST BREADS AND TORTILLAS
RICE, PASTA AND OTHER GRAIN-BASED MIXED DISHEs DESSERTS AND SWEET SNACKS
CHIPS, CRACKERS, AND SAVORY SNACKS PIZZA
QUICK BREADS (Biscuits, Muffins, Pancakes, Waffles) RICE AND PASTA
BREAKFAST CEREALS AND BARS POULTRY (Not incl. Deli and Mixed Dishes)
%

92
2020 Dietary Guidelines Advisory Committee Data Supplement: Food Category Sources
https://www.dietaryguidelines.gov/2020-advisory-committee-report/data-analysis
Figure 5. 5: Females - Distribution of total refined grains intake (percentages) across major categories
100
90
80
70
60
50
40
30
20
10
0 2+
DAIRY
MIXED DISHES
2-5 years 6-11 years 12-19 years 20-40 years 41-50 years 51-70 years
PROTEIN FOODS
GRAINS
71+
SNACKS AND SWEETS FRUITS+FRUIT JUICE
VEGETABLES BEVERAGES (Not incl. Milk and 100% Fruit Juice)
CONDIMENTS, GRAVIES, SPREADS, SALAD DRESSINGS
%
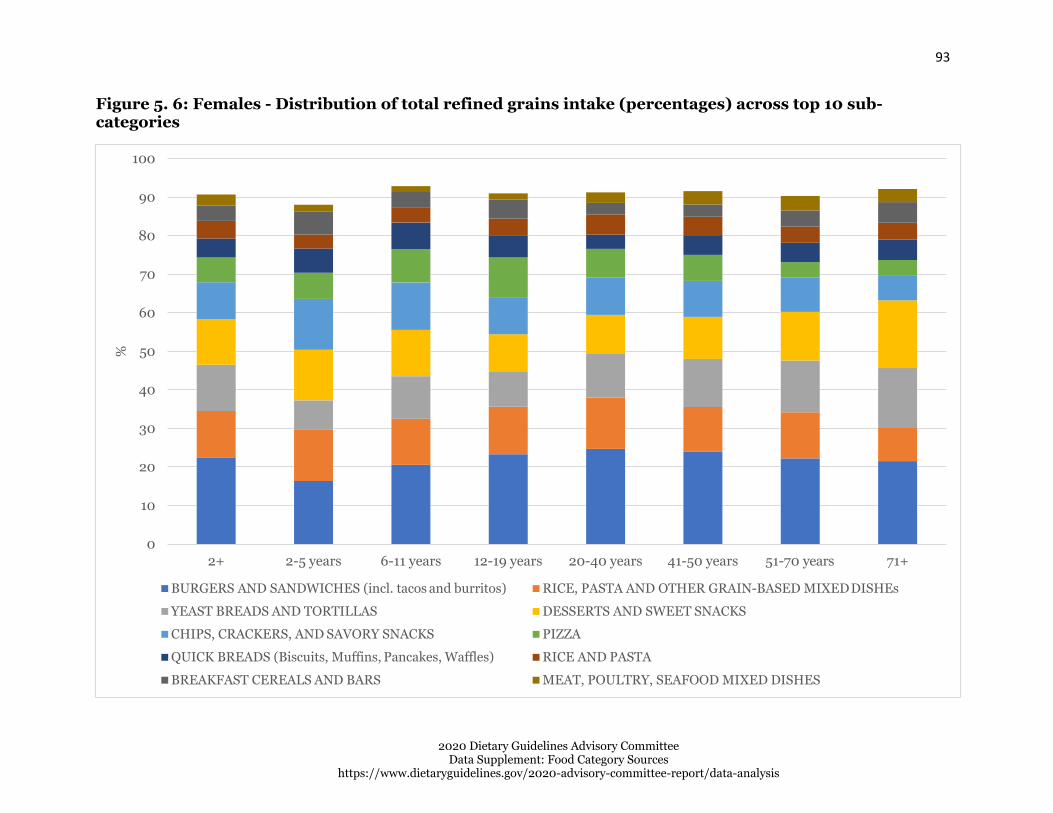
93
2020 Dietary Guidelines Advisory Committee Data Supplement: Food Category Sources
https://www.dietaryguidelines.gov/2020-advisory-committee-report/data-analysis
Figure 5. 6: Females - Distribution of total refined grains intake (percentages) across top 10 sub- categories
100
90
80
70
60
50
40
30
20
10
0
2+ 2-5 years 6-11 years 12-19 years 20-40 years 41-50 years 51-70 years 71+
BURGERS AND SANDWICHES (incl. tacos and burritos) RICE, PASTA AND OTHER GRAIN-BASED MIXED DISHEs
YEAST BREADS AND TORTILLAS DESSERTS AND SWEET SNACKS
CHIPS, CRACKERS, AND SAVORY SNACKS PIZZA
QUICK BREADS (Biscuits, Muffins, Pancakes, Waffles) RICE AND PASTA
BREAKFAST CEREALS AND BARS MEAT, POULTRY, SEAFOOD MIXED DISHES
%

94
2020 Dietary Guidelines Advisory Committee Data Supplement: Food Category Sources
https://www.dietaryguidelines.gov/2020-advisory-committee-report/data-analysis
Percent of total protein foods intake, 2013-16, for U.S. population ages 2 years
and older, from WWEIA Food Categories
These data are estimates of the percent of total protein foods from WWEIA Food Categories, re-grouped into DGAC major categories and sub-categories as described elsewhere, for individuals 2 years and older based on the day 1 dietary recalls from WWEIA, NHANES 2013-16. Breastfed children, and pregnant and lactating women have been excluded. The sample size is 15,807.
WHOLE SAMPLE (MALES + FEMALES)
Table 6. 1: Males and Females- Distribution of total protein intake (percentages) across major categories
DGAC major category
Age Groups (Years)
2+ 2-5 6-11 12-19 20-40 41-50 51-70 71+
%
MIXED DISHES
47.79 41.27 50.79 54.62 49.28 46.95 45.00 44.89
PROTEIN FOODS
42.62 50.49 39.88 35.38 40.98 43.22 45.42 45.81
SNACKS AND SWEETS
3.48 3.96 4.14 4.36 3.21 2.74 3.31 3.93
VEGETAB LES
2.93 0.38 1.32 2.01 3.28 3.65 3.55 2.98
GRAINS 2.21 2.89 3.50 3.10 2.08 2.11 1.71 1.49
BEVERAG ES (Not Incl. Milk and 100% Fruit Juice)
0.53 0.36 0.08 0.10 0.76 0.73 0.54 0.57
DAIRY 0.21 0.33 0.12 0.18 0.15 0.31 0.25 0.23

95
2020 Dietary Guidelines Advisory Committee Data Supplement: Food Category Sources
https://www.dietaryguidelines.gov/2020-advisory-committee-report/data-analysis
CONDIME NTS, GRAVIES, SPREADS, SALAD DRESSIN GS
0.17 0.30 0.12 0.20 0.18 0.23 0.15 0.04
FRUITS+F RUIT JUICE
0.05 0.03 0.01 0.00 0.05 0.07 0.06 0.07
TOTAL* 99.99 99.99 99.98 99.96 99.98 100.00 99.99 100.00
*Totals are less than 100% because results do not include baby foods, infant formulas and WWEIA category – other
Table 6. 2: Males and Females - Distribution of total protein intake (percentages) across sub-categories
DGAC sub-category Age Groups (Years)
2+ 2-5 6-11 12-19 20-40 41-50 51-70 71+
%
BURGERS AND SANDWICHES (Incl. Tacos and Burritos)
28.60 26.10 31.70 33.81 30.44 27.00 25.62 25.90
POULTRY (Not Incl. Deli and Mixed Dishes) 13.26 19.83 16.77 14.95 14.07 11.76 11.36 9.43
MEAT, POULTRY, SEAFOOD MIXED DISHES 9.08 4.98 7.31 7.95 8.29 10.07 10.50 11.34
MEATS (Not Incl. Deli and Mixed Dishes) 8.16 5.18 5.85 7.83 8.17 8.73 8.95 9.28
NUTS, SEEDS, AND SOY 6.19 3.21 3.29 2.94 5.09 6.90 9.15 8.38
EGGS 5.84 8.86 4.95 4.03 5.84 5.64 5.85 7.46
RICE, PASTA AND OTHER GRAIN-BASED MIXED DISHES
5.35 5.65 5.78 6.02 5.74 5.72 4.96 3.28
DELI/CURED PRODUCTS (Meat and Poultry) 4.59 10.59 6.72 3.30 3.32 3.85 4.76 5.44
SEAFOOD (Not Incl. Mixed Dishes) 4.58 2.82 2.30 2.34 4.49 6.35 5.35 5.83
(continued from previous page)

96
2020 Dietary Guidelines Advisory Committee Data Supplement: Food Category Sources
https://www.dietaryguidelines.gov/2020-advisory-committee-report/data-analysis
VEGETABLES (Incl. Beans and Peas, not Starchy)
2.75 0.35 1.06 1.81 3.03 3.59 3.40 2.81
PIZZA 2.70 2.39 4.01 5.21 3.09 2.07 1.46 1.81
SOUPS 2.07 2.14 2.00 1.64 1.72 2.10 2.46 2.57
DESSERTS AND SWEET SNACKS 1.97 2.38 2.76 2.42 1.59 1.60 1.80 2.69
QUICK BREADS (Biscuits, Muffins, Pancakes, Waffles)
1.06 2.21 2.66 1.74 0.63 0.92 0.71 0.66
BREAKFAST CEREALS AND BARS 1.02 0.42 0.76 1.29 1.33 1.15 0.85 0.62
CANDY AND SUGARS 0.98 0.77 0.96 1.03 1.07 0.77 1.07 0.84
CHIPS, CRACKERS, AND SAVORY SNACKS 0.53 0.81 0.42 0.92 0.55 0.37 0.44 0.40
SUGAR-SWEETENED AND DIET BEVERAGES
0.46 0.36 0.06 0.09 0.68 0.57 0.44 0.55
STARCHY VEGETABLES 0.18 0.03 0.26 0.20 0.25 0.06 0.15 0.18
LOW-FAT MILK/YOGURT 0.18 0.27 0.10 0.17 0.15 0.29 0.14 0.20
CONDIMENTS AND GRAVIES 0.13 0.28 0.11 0.09 0.12 0.22 0.13 0.03
RICE AND PASTA 0.07 0.07 0.06 0.07 0.12 0.02 0.05 0.04
YEAST BREADS AND TORTILLAS 0.06 0.20 0.02 0.01 0.01 0.03 0.09 0.18
COFFEE AND TEA 0.05 0.00 0.02 0.00 0.03 0.13 0.09 0.01
SALAD DRESSINGS 0.04 0.02 0.02 0.11 0.07 0.01 0.02 0.01
FRUIT (Non-Juice) 0.04 0.03 0.01 0.00 0.04 0.07 0.04 0.07
HIGHER FAT MILK/YOGURT 0.02 0.06 0.01 0.01 0.00 0.02 0.06 0.01
WATERS 0.02 0.00 0.00 0.00 0.06 0.02 0.01 0.01
CHEESE 0.01 0.00 0.01 0.01 0.00 0.00 0.04 0.02
100% FRUIT JUICE 0.01 0.00 0.00 0.00 0.00 0.00 0.02 0.00
ALCOHOLIC BEVERAGES 0.00 0.00 0.00 0.00 0.00 0.00 0.00 0.00
SPREADS 0.00 0.00 0.00 0.00 0.00 0.00 0.00 0.00
TOTAL* 99.99 99.99 99.98 99.96 99.98 100.00 99.99 100.00
*Totals are less than 100% because results do not include baby foods, infant formulas and WWEIA category - other
(continued from previous page)

97
2020 Dietary Guidelines Advisory Committee Data Supplement: Food Category Sources
https://www.dietaryguidelines.gov/2020-advisory-committee-report/data-analysis
MALES
Table 6. 3: Males - Distribution of total protein intake (percentages) across major categories
DGAC major category Age Groups (Years)
2+ 2-5 6-11 12-19 20-40 41-50 51-70 71+
%
MIXED DISHES 49.71 42.81 54.09 57.00 52.21 48.13 46.95 43.71
PROTEIN FOODS 42.15 48.63 37.23 35.06 40.24 42.72 45.26 48.32
SNACKS AND SWEETS 2.99 3.52 3.96 3.86 2.52 2.67 2.94 3.09
VEGETABLES 2.32 0.37 1.19 1.08 2.45 3.34 2.83 3.09
GRAINS 1.94 3.13 3.25 2.62 1.78 1.97 1.35 0.93
BEVERAGES (Not Incl. Milk and 100% Fruit Juice)
0.39 0.64 0.06 0.10 0.58 0.42 0.29 0.62
DAIRY 0.20 0.52 0.16 0.18 0.08 0.52 0.16 0.12
CONDIMENTS, GRAVIES, SPREADS, SALAD DRESSINGS
0.15 0.37 0.07 0.09 0.11 0.23 0.14 0.02
FRUITS+FRUIT JUICE 0.03 0.02 0.01 0.00 0.04 0.02 0.06 0.08
TOTAL* 99.89 100.00 100.00 100.00 100.00 100.00 99.98 99.99
*Totals are less than 100% because results do not include baby foods, infant formulas and WWEIA category - other

98
2020 Dietary Guidelines Advisory Committee Data Supplement: Food Category Sources
https://www.dietaryguidelines.gov/2020-advisory-committee-report/data-analysis
Table 6. 4: Males - Distribution of total protein intake (percentages) across sub-categories
DGAC sub-category Age Groups (Years)
2+ 2-5 6-11 12-19 20-40 41-50 51-70 71+
%
BURGERS AND SANDWICHES (Incl. Tacos and Burritos)
30.94 29.19 34.00 35.91 32.92 29.60 28.22 28.46
POULTRY (Not Incl. Deli and Mixed Dishes)
13.61 18.64 16.63 14.79 14.24 12.59 11.64 10.23
MEAT, POULTRY, SEAFOOD MIXED DISHES
8.74 4.65 7.95 9.30 8.23 8.35 9.95 9.80
MEATS (Not Incl. Deli and Mixed Dishes)
8.64 3.80 4.81 8.29 8.95 9.12 10.47 9.37
EGGS 5.66 9.00 4.44 4.42 5.29 4.82 5.37 8.91
NUTS, SEEDS, AND SOY 5.38 2.44 2.73 2.49 4.51 6.43 8.07 8.05
RICE, PASTA AND OTHER GRAIN- BASED MIXED DISHES
5.32 5.59 5.49 5.01 5.97 6.70 4.65 2.94

99
2020 Dietary Guidelines Advisory Committee Data Supplement: Food Category Sources
https://www.dietaryguidelines.gov/2020-advisory-committee-report/data-analysis
DELI/CURED PRODUCTS (Meat and Poultry)
4.73 11.36 6.63 3.03 3.11 3.98 5.04 5.74
SEAFOOD (Not Incl. Mixed Dishes) 4.13 3.39 2.00 2.04 4.15 5.78 4.68 6.02
PIZZA 2.85 2.19 4.54 5.77 3.48 1.54 1.71 0.64
VEGETABLES (Incl. Beans and Peas, not Starchy)
2.13 0.36 1.07 0.93 2.12 3.26 2.64 2.90
SOUPS 1.86 1.20 2.11 1.01 1.61 1.94 2.41 1.87
DESSERTS AND SWEET SNACKS 1.66 2.00 2.29 2.15 1.33 1.44 1.67 1.76
QUICK BREADS (Biscuits, Muffins, Pancakes, Waffles)
1.04 2.28 2.61 1.78 0.60 0.70 0.63 0.55
CANDY AND SUGARS 0.89 0.78 1.12 0.85 0.94 0.78 0.89 0.89
BREAKFAST CEREALS AND BARS 0.83 0.41 0.59 0.83 1.14 1.24 0.61 0.34
CHIPS, CRACKERS, AND SAVORY SNACKS
0.44 0.75 0.54 0.86 0.25 0.45 0.37 0.44
SUGAR-SWEETENED AND DIET BEVERAGES
0.36 0.64 0.03 0.10 0.57 0.23 0.29 0.62
STARCHY VEGETABLES 0.19 0.01 0.11 0.15 0.32 0.07 0.19 0.19
LOW-FAT MILK/YOGURT 0.17 0.40 0.13 0.17 0.07 0.48 0.07 0.11
CONDIMENTS AND GRAVIES 0.13 0.35 0.05 0.08 0.10 0.22 0.11 0.02
RICE AND PASTA 0.04 0.06 0.01 0.02 0.03 0.01 0.08 0.01
HIGHER FAT MILK/YOGURT 0.04 0.12 0.00 0.00 0.00 0.03 0.10 0.00
YEAST BREADS AND TORTILLAS 0.03 0.38 0.04 0.00 0.00 0.01 0.03 0.03
COFFEE AND TEA 0.03 0.00 0.03 0.00 0.01 0.19 0.00 0.00
FRUIT (Non-Juice) 0.02 0.02 0.01 0.00 0.04 0.02 0.01 0.08
SALAD DRESSINGS 0.02 0.02 0.01 0.01 0.01 0.01 0.03 0.01
100% FRUIT JUICE 0.01 0.00 0.00 0.00 0.00 0.00 0.04 0.00
CHEESE 0.00 0.00 0.02 0.02 0.00 0.00 0.00 0.01
WATERS 0.00 0.00 0.00 0.00 0.00 0.00 0.00 0.00
ALCOHOLIC BEVERAGES 0.00 0.00 0.00 0.00 0.00 0.00 0.00 0.00
SPREADS 0.00 0.00 0.00 0.00 0.00 0.00 0.00 0.00
TOTAL* 99.89 100.00 100.00 100.00 100.00 100.00 99.98 99.99
*Totals are less than 100% because results do not include baby foods, infant formulas and WWEIA category - other
(continued from previous page)
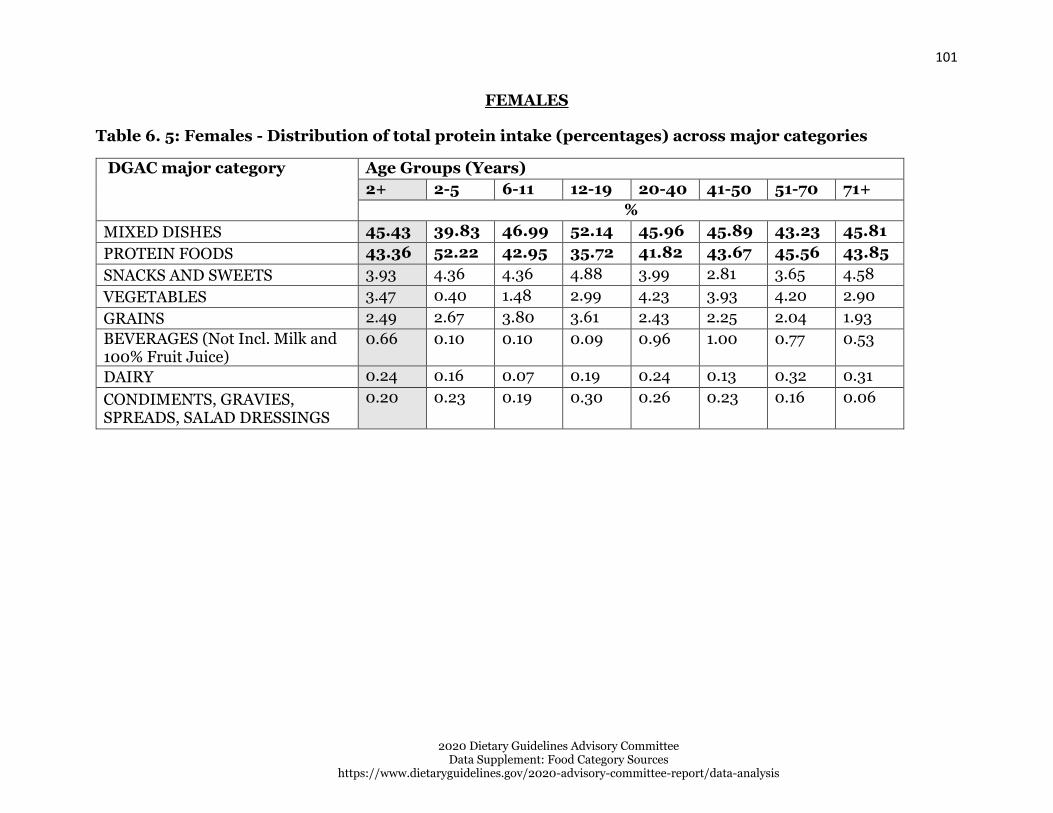
101
2020 Dietary Guidelines Advisory Committee Data Supplement: Food Category Sources
https://www.dietaryguidelines.gov/2020-advisory-committee-report/data-analysis
FEMALES
Table 6. 5: Females - Distribution of total protein intake (percentages) across major categories
DGAC major category Age Groups (Years)
2+ 2-5 6-11 12-19 20-40 41-50 51-70 71+
%
MIXED DISHES 45.43 39.83 46.99 52.14 45.96 45.89 43.23 45.81
PROTEIN FOODS 43.36 52.22 42.95 35.72 41.82 43.67 45.56 43.85
SNACKS AND SWEETS 3.93 4.36 4.36 4.88 3.99 2.81 3.65 4.58
VEGETABLES 3.47 0.40 1.48 2.99 4.23 3.93 4.20 2.90
GRAINS 2.49 2.67 3.80 3.61 2.43 2.25 2.04 1.93
BEVERAGES (Not Incl. Milk and 100% Fruit Juice)
0.66 0.10 0.10 0.09 0.96 1.00 0.77 0.53
DAIRY 0.24 0.16 0.07 0.19 0.24 0.13 0.32 0.31
CONDIMENTS, GRAVIES, SPREADS, SALAD DRESSINGS
0.20 0.23 0.19 0.30 0.26 0.23 0.16 0.06

102
2020 Dietary Guidelines Advisory Committee Data Supplement: Food Category Sources
https://www.dietaryguidelines.gov/2020-advisory-committee-report/data-analysis
FRUITS+FRUIT JUICE 0.06 0.03 0.01 0.00 0.05 0.13 0.07 0.07
TOTAL* 99.84 99.99 99.95 99.91 99.95 100.00 100.00 100.00
*Totals are less than 100% because results do not include baby foods, infant formulas and WWEIA category – other
Table 6. 6: Females - Distribution of total protein intake (percentages) across sub-categories
DGAC sub-category Age Groups (Years)
2+ 2-5 6-11 12-19 20-40 41-50 51-70 71+
%
BURGERS AND SANDWICHES (Incl. Tacos and Burritos)
25.79 23.23 29.04 31.61 27.63 24.65 23.26 23.89
POULTRY (Not Incl. Deli and Mixed Dishes) 13.07 20.94 16.93 15.12 13.88 11.00 11.10 8.79
MEAT, POULTRY, SEAFOOD MIXED DISHES
9.44 5.29 6.57 6.54 8.36 11.62 11.00 12.55
MEATS (Not Incl. Deli and Mixed Dishes) 7.61 6.47 7.06 7.35 7.28 8.38 7.56 9.21
NUTS, SEEDS, AND SOY 6.87 3.91 3.93 3.41 5.75 7.32 10.13 8.63
EGGS 6.24 8.73 5.54 3.62 6.48 6.38 6.29 6.33
RICE, PASTA AND OTHER GRAIN-BASED MIXED DISHES
5.34 5.71 6.12 7.08 5.47 4.84 5.23 3.54
SEAFOOD (Not Incl. Mixed Dishes) 4.95 2.29 2.66 2.65 4.88 6.86 5.97 5.68
(continued from previous page)

103
2020 Dietary Guidelines Advisory Committee Data Supplement: Food Category Sources
https://www.dietaryguidelines.gov/2020-advisory-committee-report/data-analysis
DELI/CURED PRODUCTS (Meat and Poultry)
4.62 9.88 6.83 3.57 3.57 3.72 4.51 5.20
VEGETABLES (Incl. Beans and Peas, not Starchy)
3.31 0.34 1.05 2.72 4.06 3.89 4.08 2.73
PIZZA 2.53 2.58 3.39 4.63 2.65 2.54 1.24 2.72
SOUPS 2.33 3.01 1.87 2.29 1.85 2.24 2.50 3.12
DESSERTS AND SWEET SNACKS 2.27 2.74 3.30 2.70 1.88 1.74 1.93 3.42
BREAKFAST CEREALS AND BARS 1.20 0.43 0.96 1.77 1.53 1.06 1.07 0.84
QUICK BREADS (Biscuits, Muffins, Pancakes, Waffles)
1.10 2.16 2.71 1.69 0.66 1.11 0.78 0.74
CANDY AND SUGARS 1.05 0.75 0.77 1.21 1.21 0.77 1.24 0.79
CHIPS, CRACKERS, AND SAVORY SNACKS 0.61 0.86 0.29 0.97 0.89 0.30 0.49 0.37
SUGAR-SWEETENED AND DIET BEVERAGES
0.55 0.10 0.10 0.09 0.80 0.88 0.58 0.49
LOW-FAT MILK/YOGURT 0.20 0.15 0.05 0.17 0.24 0.12 0.21 0.27
STARCHY VEGETABLES 0.16 0.05 0.44 0.26 0.17 0.04 0.11 0.17
CONDIMENTS AND GRAVIES 0.14 0.21 0.17 0.09 0.14 0.21 0.14 0.04
RICE AND PASTA 0.10 0.07 0.12 0.12 0.23 0.02 0.03 0.07
YEAST BREADS AND TORTILLAS 0.08 0.02 0.01 0.02 0.01 0.05 0.16 0.29
COFFEE AND TEA 0.07 0.00 0.00 0.00 0.04 0.08 0.17 0.03
SALAD DRESSINGS 0.07 0.02 0.02 0.21 0.13 0.02 0.02 0.02
FRUIT (Non-Juice) 0.06 0.03 0.01 0.00 0.05 0.13 0.07 0.06
WATERS 0.04 0.00 0.00 0.00 0.12 0.04 0.02 0.01
CHEESE 0.02 0.00 0.00 0.00 0.00 0.00 0.08 0.03
HIGHER FAT MILK/YOGURT 0.01 0.01 0.01 0.01 0.00 0.00 0.03 0.02
100% FRUIT JUICE 0.00 0.00 0.00 0.00 0.00 0.00 0.00 0.01
ALCOHOLIC BEVERAGES 0.00 0.00 0.00 0.00 0.00 0.00 0.00 0.00
SPREADS 0.00 0.00 0.00 0.00 0.00 0.00 0.00 0.00
TOTAL* 99.84 99.99 99.95 99.91 99.95 100.00 100.00 100.00
*Totals are less than 100% because results do not include baby foods, infant formulas and WWEIA category – other
(continued from previous page)

105
2020 Dietary Guidelines Advisory Committee Data Supplement: Food Category Sources
https://www.dietaryguidelines.gov/2020-advisory-committee-report/data-analysis
Figure 6. 1: Males and Females - Distribution of total protein intake (percentages) across major categories
100
90
80
70
60
50
40
30
20
10
0 2+
DAIRY
MIXED DISHES
2-5 years 6-11 years 12-19 years 20-40 years 41-50 years 51-70 years
PROTEIN FOODS
GRAINS
71+
SNACKS AND SWEETS FRUITS+FRUIT JUICE
VEGETABLES BEVERAGES (Not incl. Milk and 100% Fruit Juice)
CONDIMENTS, GRAVIES, SPREADS, SALAD DRESSINGS
%

106
2020 Dietary Guidelines Advisory Committee Data Supplement: Food Category Sources
https://www.dietaryguidelines.gov/2020-advisory-committee-report/data-analysis
Figure 6. 2: Males and Females - Distribution of total protein intake (percentages) across top 10 sub- categories
100
90
80
70
60
50
40
30
20
10
0
2+ 2-5 years 6-11 years 12-19 years 20-40 years 41-50 years 51-70 years 71+
BURGERS AND SANDWICHES (incl. tacos and burritos) POULTRY (Not incl. Deli and Mixed Dishes)
MEAT, POULTRY, SEAFOOD MIXED DISHES MEATS (Not incl. Deli and Mixed Dishes)
NUTS, SEEDS, AND SOY EGGS
RICE, PASTA AND OTHER GRAIN-BASED MIXED DISHES DELI/CURED PRODUCTS (Meat and Poultry)
SEAFOOD (Not incl. Mixed Dishes) VEGETABLES (Incl. Beans and Peas, not Starchy)
%

107
2020 Dietary Guidelines Advisory Committee Data Supplement: Food Category Sources
https://www.dietaryguidelines.gov/2020-advisory-committee-report/data-analysis
Figure 6. 3: Males - Distribution of total protein intake (percentages) across major categories
100
90
80
70
60
50
40
30
20
10
0 2+
DAIRY
MIXED DISHES
2-5 years 6-11 years 12-19 years 20-40 years 41-50 years 51-70 years
PROTEIN FOODS
GRAINS
71+
SNACKS AND SWEETS FRUITS+FRUIT JUICE
VEGETABLES BEVERAGES (Not incl. Milk and 100% Fruit Juice)
CONDIMENTS, GRAVIES, SPREADS, SALAD DRESSINGS
%

108
2020 Dietary Guidelines Advisory Committee Data Supplement: Food Category Sources
https://www.dietaryguidelines.gov/2020-advisory-committee-report/data-analysis
BURGERS AND SANDWICHES (incl. tacos and burritos) POULTRY (Not incl. Deli and Mixed Dishes)
MEAT, POULTRY, SEAFOOD MIXED DISHES MEATS (Not incl. Deli and Mixed Dishes)
EGGS NUTS, SEEDS, AND SOY
RICE, PASTA AND OTHER GRAIN-BASED MIXED DISHES DELI/CURED PRODUCTS (Meat and Poultry)
SEAFOOD (Not incl. Mixed Dishes) PIZZA
Figure 6. 4: Males - Distribution of total protein intake (percentages) across top 10 sub-categories
71+ 12-19 years 20-40 years 41-50 years 51-70 years6-11 years2-5 years2+
100
90
80
70
60
50
40
30
20
10
0
%

109
2020 Dietary Guidelines Advisory Committee Data Supplement: Food Category Sources
https://www.dietaryguidelines.gov/2020-advisory-committee-report/data-analysis
Figure 6. 5: Females - Distribution of total protein intake (percentages) across major categories
100
90
80
70
60
50
40
30
20
10
0 2+
DAIRY
MIXED DISHES
2-5 years 6-11 years 12-19 years 20-40 years 41-50 years 51-70 years
PROTEIN FOODS
GRAINS
71+
SNACKS AND SWEETS FRUITS+FRUIT JUICE
VEGETABLES BEVERAGES (Not incl. Milk and 100% Fruit Juice)
CONDIMENTS, GRAVIES, SPREADS, SALAD DRESSINGS
%

110
2020 Dietary Guidelines Advisory Committee Data Supplement: Food Category Sources
https://www.dietaryguidelines.gov/2020-advisory-committee-report/data-analysis
Figure 6. 6: Females - Distribution of total protein intake (percentages) across top 10 sub-categories
100
90
80
70
60
50
40
30
20
10
0
2+ 2-5 years 6-11 years 12-19 years 20-40 years 41-50 years 51-70 years 71+
BURGERS AND SANDWICHES (incl. tacos and burritos) POULTRY (Not incl. Deli and Mixed Dishes)
MEAT, POULTRY, SEAFOOD MIXED DISHES MEATS (Not incl. Deli and Mixed Dishes)
NUTS, SEEDS, AND SOY EGGS
RICE, PASTA AND OTHER GRAIN-BASED MIXED DISHES SEAFOOD (Not incl. Mixed Dishes)
DELI/CURED PRODUCTS (Meat and Poultry) VEGETABLES (Incl. Beans and Peas, not Starchy)
%

110
2020 Dietary Guidelines Advisory Committee Data Supplement: Food Category Sources
https://www.dietaryguidelines.gov/2020-advisory-committee-report/data-analysis
Percent of red meat intake, 2013-16, for U.S. population ages 2 years and older,
from WWEIA Food Categories
These data are estimates of the percent of red meat from WWEIA Food Categories, re-grouped into DGAC major categories and sub-categories as described elsewhere, for individuals 2 years and older based on the day 1 dietary recalls from WWEIA, NHANES 2013-16. Breastfed children, and pregnant and lactating women have been excluded. The sample size is 15,807.
WHOLE SAMPLE (MALES + FEMALES)
Table 7. 1: Males and Females- Distribution of red meat intake (percentages) across major categories
DGAC major category
Age Groups (Years)
2+ 2-5 6-11 12-19 20-40 41-50 51-70 71+
%
MIXED DISHES
69.30 74.67 78.31 72.86 70.23 69.76 64.74 64.47
PROTEIN FOODS
28.12 24.40 19.87 24.23 26.80 28.51 32.19 33.49
VEGETAB LES
1.82 0.73 1.04 1.28 2.11 0.69 2.66 2.03
SNACKS AND SWEETS
0.73 0.19 0.84 1.68 0.84 0.96 0.39 0.00
DAIRY 0.00 0.00 0.00 0.00 0.00 0.00 0.00 0.00
GRAINS 0.00 0.00 0.00 0.00 0.00 0.00 0.00 0.00
FRUITS+F RUIT JUICE
0.00 0.00 0.00 0.00 0.00 0.00 0.00 0.00
BEVERAG ES (Not Incl. Milk
0.00 0.00 0.00 0.00 0.00 0.00 0.00 0.00
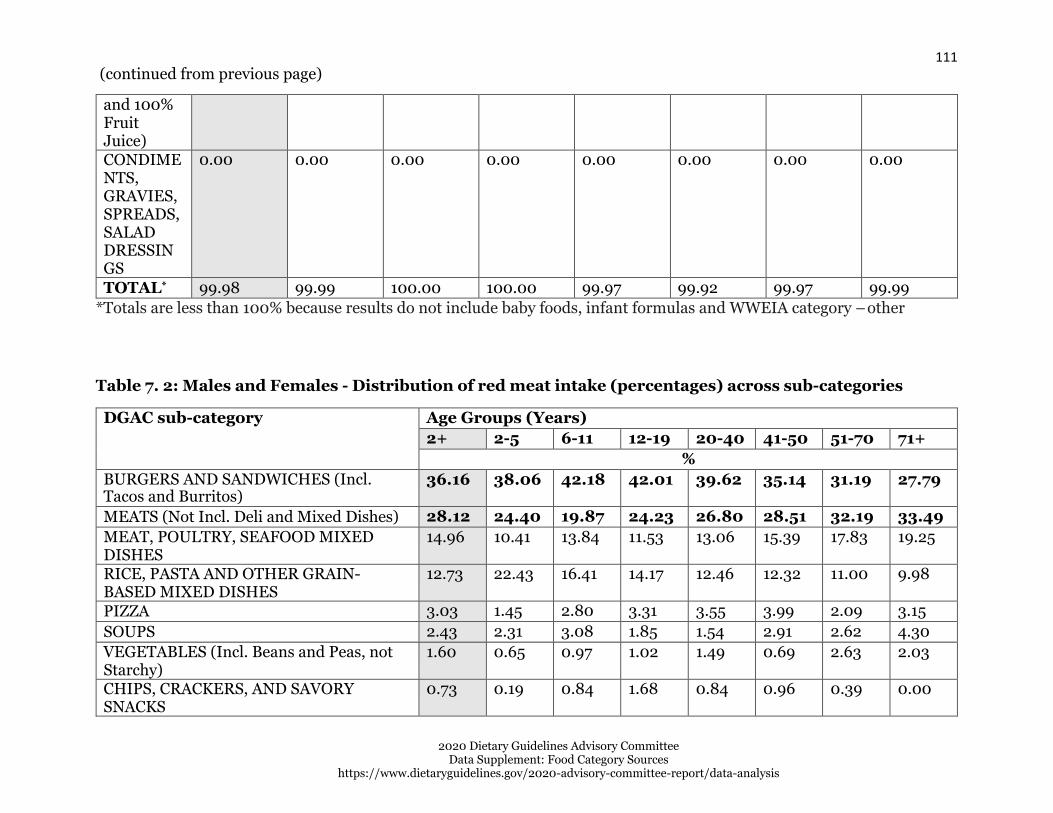
111
2020 Dietary Guidelines Advisory Committee Data Supplement: Food Category Sources
https://www.dietaryguidelines.gov/2020-advisory-committee-report/data-analysis
and 100% Fruit Juice) CONDIME NTS, GRAVIES, SPREADS, SALAD DRESSIN GS
0.00 0.00 0.00 0.00 0.00 0.00 0.00 0.00
TOTAL* 99.98 99.99 100.00 100.00 99.97 99.92 99.97 99.99
*Totals are less than 100% because results do not include baby foods, infant formulas and WWEIA category – other
Table 7. 2: Males and Females - Distribution of red meat intake (percentages) across sub-categories
DGAC sub-category Age Groups (Years)
2+ 2-5 6-11 12-19 20-40 41-50 51-70 71+
%
BURGERS AND SANDWICHES (Incl. Tacos and Burritos)
36.16 38.06 42.18 42.01 39.62 35.14 31.19 27.79
MEATS (Not Incl. Deli and Mixed Dishes) 28.12 24.40 19.87 24.23 26.80 28.51 32.19 33.49
MEAT, POULTRY, SEAFOOD MIXED DISHES
14.96 10.41 13.84 11.53 13.06 15.39 17.83 19.25
RICE, PASTA AND OTHER GRAIN- BASED MIXED DISHES
12.73 22.43 16.41 14.17 12.46 12.32 11.00 9.98
PIZZA 3.03 1.45 2.80 3.31 3.55 3.99 2.09 3.15
SOUPS 2.43 2.31 3.08 1.85 1.54 2.91 2.62 4.30
VEGETABLES (Incl. Beans and Peas, not Starchy)
1.60 0.65 0.97 1.02 1.49 0.69 2.63 2.03
CHIPS, CRACKERS, AND SAVORY SNACKS
0.73 0.19 0.84 1.68 0.84 0.96 0.39 0.00
(continued from previous page)

112
2020 Dietary Guidelines Advisory Committee Data Supplement: Food Category Sources
https://www.dietaryguidelines.gov/2020-advisory-committee-report/data-analysis
STARCHY VEGETABLES 0.22 0.08 0.07 0.25 0.62 0.00 0.02 0.00
ALCOHOLIC BEVERAGES 0.00 0.00 0.00 0.00 0.00 0.00 0.00 0.00
BREAKFAST CEREALS AND BARS 0.00 0.00 0.00 0.00 0.00 0.00 0.00 0.00
CANDY AND SUGARS 0.00 0.00 0.00 0.00 0.00 0.00 0.00 0.00
CHEESE 0.00 0.00 0.00 0.00 0.00 0.00 0.00 0.00
COFFEE AND TEA 0.00 0.00 0.00 0.00 0.00 0.00 0.00 0.00
CONDIMENTS AND GRAVIES 0.00 0.00 0.00 0.00 0.00 0.00 0.00 0.00
DELI/CURED PRODUCTS (Meat and Poultry)
0.00 0.00 0.00 0.00 0.00 0.00 0.00 0.00
DESSERTS AND SWEET SNACKS 0.00 0.00 0.00 0.00 0.00 0.00 0.00 0.00
EGGS 0.00 0.00 0.00 0.00 0.00 0.00 0.00 0.00
FRUIT (Non-Juice) 0.00 0.00 0.00 0.00 0.00 0.00 0.00 0.00
HIGHER FAT MILK/YOGURT 0.00 0.00 0.00 0.00 0.00 0.00 0.00 0.00
100% FRUIT JUICE 0.00 0.00 0.00 0.00 0.00 0.00 0.00 0.00
LOW-FAT MILK/YOGURT 0.00 0.00 0.00 0.00 0.00 0.00 0.00 0.00
NUTS, SEEDS, AND SOY 0.00 0.00 0.00 0.00 0.00 0.00 0.00 0.00
POULTRY (Not Incl. Deli and Mixed Dishes)
0.00 0.00 0.00 0.00 0.00 0.00 0.00 0.00
QUICK BREADS (Biscuits, Muffins, Pancakes, Waffles)
0.00 0.00 0.00 0.00 0.00 0.00 0.00 0.00
RICE AND PASTA 0.00 0.00 0.00 0.00 0.00 0.00 0.00 0.00
SALAD DRESSINGS 0.00 0.00 0.00 0.00 0.00 0.00 0.00 0.00
SEAFOOD (Not Incl. Mixed Dishes) 0.00 0.00 0.00 0.00 0.00 0.00 0.00 0.00
SPREADS 0.00 0.00 0.00 0.00 0.00 0.00 0.00 0.00
SUGAR-SWEETENED AND DIET BEVERAGES
0.00 0.00 0.00 0.00 0.00 0.00 0.00 0.00
WATERS 0.00 0.00 0.00 0.00 0.00 0.00 0.00 0.00
YEAST BREADS AND TORTILLAS 0.00 0.00 0.00 0.00 0.00 0.00 0.00 0.00
TOTAL* 99.98 99.99 100.00 100.00 99.97 99.92 99.97 99.99
*Totals are less than 100% because results do not include baby foods, infant formulas and WWEIA category - other
(continued from previous page)

113
2020 Dietary Guidelines Advisory Committee Data Supplement: Food Category Sources
https://www.dietaryguidelines.gov/2020-advisory-committee-report/data-analysis
MALES
Table 7. 3: Males - Distribution of red meat intake (percentages) across major categories
DGAC major category Age Groups (Years)
2+ 2-5 6-11 12-19 20-40 41-50 51-70 71+
%
MIXED DISHES 70.48 78.65 81.33 74.55 71.41 70.22 65.92 62.04
PROTEIN FOODS 27.52 20.01 16.49 22.85 26.57 27.37 32.96 35.28
VEGETABLES 1.31 1.25 1.40 1.21 1.48 0.77 0.96 2.67
SNACKS AND SWEETS 0.66 0.21 0.91 1.45 0.53 1.64 0.14 0.00
DAIRY 0.00 0.00 0.00 0.00 0.00 0.00 0.00 0.00
GRAINS 0.00 0.00 0.00 0.00 0.00 0.00 0.00 0.00
FRUITS+FRUIT JUICE 0.00 0.00 0.00 0.00 0.00 0.00 0.00 0.00
BEVERAGES (Not Incl. Milk and 100% Fruit Juice)
0.00 0.00 0.00 0.00 0.00 0.00 0.00 0.00
CONDIMENTS, GRAVIES, SPREADS, SALAD DRESSINGS
0.00 0.00 0.00 0.00 0.00 0.00 0.00 0.00
TOTAL* 99.97 100.00 100.00 100.00 99.99 100.00 99.99 100.00
*Totals are less than 100% because results do not include baby foods, infant formulas and WWEIA category - other
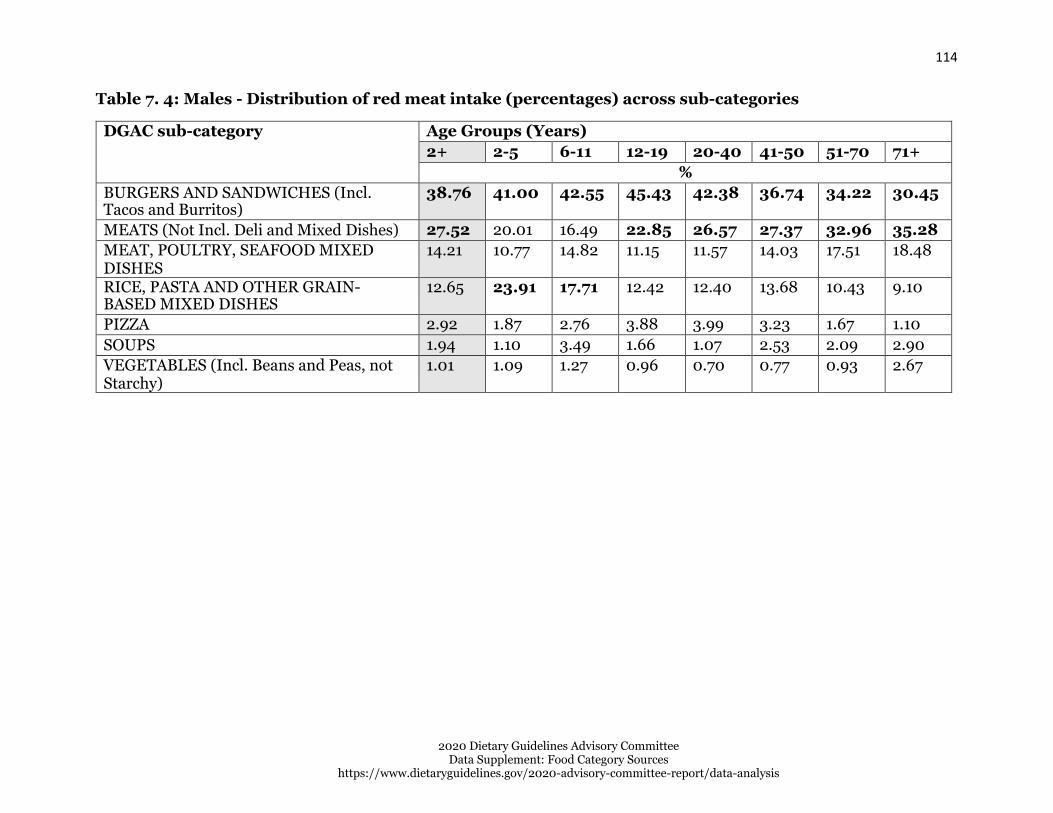
114
2020 Dietary Guidelines Advisory Committee Data Supplement: Food Category Sources
https://www.dietaryguidelines.gov/2020-advisory-committee-report/data-analysis
Table 7. 4: Males - Distribution of red meat intake (percentages) across sub-categories
DGAC sub-category Age Groups (Years)
2+ 2-5 6-11 12-19 20-40 41-50 51-70 71+
%
BURGERS AND SANDWICHES (Incl. Tacos and Burritos)
38.76 41.00 42.55 45.43 42.38 36.74 34.22 30.45
MEATS (Not Incl. Deli and Mixed Dishes) 27.52 20.01 16.49 22.85 26.57 27.37 32.96 35.28
MEAT, POULTRY, SEAFOOD MIXED DISHES
14.21 10.77 14.82 11.15 11.57 14.03 17.51 18.48
RICE, PASTA AND OTHER GRAIN- BASED MIXED DISHES
12.65 23.91 17.71 12.42 12.40 13.68 10.43 9.10
PIZZA 2.92 1.87 2.76 3.88 3.99 3.23 1.67 1.10
SOUPS 1.94 1.10 3.49 1.66 1.07 2.53 2.09 2.90
VEGETABLES (Incl. Beans and Peas, not Starchy)
1.01 1.09 1.27 0.96 0.70 0.77 0.93 2.67

115
2020 Dietary Guidelines Advisory Committee Data Supplement: Food Category Sources
https://www.dietaryguidelines.gov/2020-advisory-committee-report/data-analysis
CHIPS, CRACKERS, AND SAVORY SNACKS
0.66 0.21 0.91 1.45 0.53 1.64 0.14 0.00
STARCHY VEGETABLES 0.29 0.17 0.13 0.25 0.79 0.00 0.03 0.00
ALCOHOLIC BEVERAGES 0.00 0.00 0.00 0.00 0.00 0.00 0.00 0.00
BREAKFAST CEREALS AND BARS 0.00 0.00 0.00 0.00 0.00 0.00 0.00 0.00
CANDY AND SUGARS 0.00 0.00 0.00 0.00 0.00 0.00 0.00 0.00
CHEESE 0.00 0.00 0.00 0.00 0.00 0.00 0.00 0.00
COFFEE AND TEA 0.00 0.00 0.00 0.00 0.00 0.00 0.00 0.00
CONDIMENTS AND GRAVIES 0.00 0.00 0.00 0.00 0.00 0.00 0.00 0.00
DELI/CURED PRODUCTS (Meat and Poultry)
0.00 0.00 0.00 0.00 0.00 0.00 0.00 0.00
DESSERTS AND SWEET SNACKS 0.00 0.00 0.00 0.00 0.00 0.00 0.00 0.00
EGGS 0.00 0.00 0.00 0.00 0.00 0.00 0.00 0.00
FRUIT (Non-Juice) 0.00 0.00 0.00 0.00 0.00 0.00 0.00 0.00
HIGHER FAT MILK/YOGURT 0.00 0.00 0.00 0.00 0.00 0.00 0.00 0.00
100 FRUIT JUICE 0.00 0.00 0.00 0.00 0.00 0.00 0.00 0.00
LOW-FAT MILK/YOGURT 0.00 0.00 0.00 0.00 0.00 0.00 0.00 0.00
NUTS, SEEDS, AND SOY 0.00 0.00 0.00 0.00 0.00 0.00 0.00 0.00
POULTRY (Not Incl. Deli and Mixed Dishes)
0.00 0.00 0.00 0.00 0.00 0.00 0.00 0.00
QUICK BREADS (Biscuits, Muffins, Pancakes, Waffles)
0.00 0.00 0.00 0.00 0.00 0.00 0.00 0.00
RICE AND PASTA 0.00 0.00 0.00 0.00 0.00 0.00 0.00 0.00
SALAD DRESSINGS 0.00 0.00 0.00 0.00 0.00 0.00 0.00 0.00
SEAFOOD (Not Incl. Mixed Dishes) 0.00 0.00 0.00 0.00 0.00 0.00 0.00 0.00
SPREADS 0.00 0.00 0.00 0.00 0.00 0.00 0.00 0.00
SUGAR-SWEETENED AND DIET BEVERAGES
0.00 0.00 0.00 0.00 0.00 0.00 0.00 0.00
WATERS 0.00 0.00 0.00 0.00 0.00 0.00 0.00 0.00
YEAST BREADS AND TORTILLAS 0.00 0.00 0.00 0.00 0.00 0.00 0.00 0.00
TOTAL* 99.97 100.00 100.00 100.00 99.99 100.00 99.99 100.00
*Totals are less than 100% because results do not include baby foods, infant formulas and WWEIA category - other
(continued from previous page)

117
2020 Dietary Guidelines Advisory Committee Data Supplement: Food Category Sources
https://www.dietaryguidelines.gov/2020-advisory-committee-report/data-analysis
FEMALES
Table 7. 5: Females - Distribution of red meat intake (percentages) across major categories
DGAC major category Age Groups (Years)
2+ 2-5 6-11 12-19 20-40 41-50 51-70 71+
%
MIXED DISHES 67.85 71.38 74.67 70.62 68.58 69.27 63.44 66.40
PROTEIN FOODS 28.80 28.04 23.96 26.05 27.11 29.73 31.34 32.06
VEGETABLES 2.40 0.29 0.60 1.37 2.98 0.60 4.51 1.52
SNACKS AND SWEETS 0.80 0.17 0.75 1.98 1.27 0.24 0.66 0.00
DAIRY 0.00 0.00 0.00 0.00 0.00 0.00 0.00 0.00
GRAINS 0.00 0.00 0.00 0.00 0.00 0.00 0.00 0.00
FRUITS+FRUIT JUICE 0.00 0.00 0.00 0.00 0.00 0.00 0.00 0.00
BEVERAGES (Not Incl. Milk and 100% Fruit Juice)
0.00 0.00 0.00 0.00 0.00 0.00 0.00 0.00
CONDIMENTS, GRAVIES, SPREADS, SALAD DRESSINGS
0.00 0.00 0.00 0.00 0.00 0.00 0.00 0.00
TOTAL* 99.85 99.88 99.98 100.00 99.94 99.84 99.95 99.98
*Totals are less than 100% because results do not include baby foods, infant formulas and WWEIA category - other

118
2020 Dietary Guidelines Advisory Committee Data Supplement: Food Category Sources
https://www.dietaryguidelines.gov/2020-advisory-committee-report/data-analysis
Table 7. 6: Females- Distribution of red meat intake (percentages) across sub-categories
DGAC sub-category Age Groups (Years)
2+ 2-5 6-11 12-19 20-40 41-50 51-70 71+
%
BURGERS AND SANDWICHES (Incl. Tacos and Burritos)
32.71 35.64 41.73 37.45 35.76 33.42 27.86 25.67
MEATS (Not Incl. Deli and Mixed Dishes) 28.80 28.04 23.96 26.05 27.11 29.73 31.34 32.06
MEAT, POULTRY, SEAFOOD MIXED DISHES
16.08 10.11 12.66 12.03 15.14 16.85 18.19 19.87
RICE, PASTA AND OTHER GRAIN- BASED MIXED DISHES
12.93 21.21 14.84 16.50 12.54 10.86 11.63 10.68
PIZZA 3.13 1.11 2.86 2.55 2.94 4.82 2.55 4.77
SOUPS 3.00 3.32 2.58 2.09 2.20 3.32 3.21 5.40
VEGETABLES (Incl. Beans and Peas, not Starchy)
2.27 0.29 0.60 1.11 2.59 0.60 4.50 1.52

119
2020 Dietary Guidelines Advisory Committee Data Supplement: Food Category Sources
https://www.dietaryguidelines.gov/2020-advisory-committee-report/data-analysis
CHIPS, CRACKERS, AND SAVORY SNACKS
0.80 0.17 0.75 1.98 1.27 0.24 0.66 0.00
STARCHY VEGETABLES 0.13 0.00 0.00 0.26 0.39 0.00 0.02 0.00
ALCOHOLIC BEVERAGES 0.00 0.00 0.00 0.00 0.00 0.00 0.00 0.00
BREAKFAST CEREALS AND BARS 0.00 0.00 0.00 0.00 0.00 0.00 0.00 0.00
CANDY AND SUGARS 0.00 0.00 0.00 0.00 0.00 0.00 0.00 0.00
CHEESE 0.00 0.00 0.00 0.00 0.00 0.00 0.00 0.00
COFFEE AND TEA 0.00 0.00 0.00 0.00 0.00 0.00 0.00 0.00
CONDIMENTS AND GRAVIES 0.00 0.00 0.00 0.00 0.00 0.00 0.00 0.00
DELI/CURED PRODUCTS (Meat and Poultry)
0.00 0.00 0.00 0.00 0.00 0.00 0.00 0.00
DESSERTS AND SWEET SNACKS 0.00 0.00 0.00 0.00 0.00 0.00 0.00 0.00
EGGS 0.00 0.00 0.00 0.00 0.00 0.00 0.00 0.00
FRUIT (Non-Juice) 0.00 0.00 0.00 0.00 0.00 0.00 0.00 0.00
HIGHER FAT MILK/YOGURT 0.00 0.00 0.00 0.00 0.00 0.00 0.00 0.00
100% FRUIT JUICE 0.00 0.00 0.00 0.00 0.00 0.00 0.00 0.00
LOW-FAT MILK/YOGURT 0.00 0.00 0.00 0.00 0.00 0.00 0.00 0.00
NUTS, SEEDS, AND SOY 0.00 0.00 0.00 0.00 0.00 0.00 0.00 0.00
POULTRY (Not Incl. Deli and Mixed Dishes)
0.00 0.00 0.00 0.00 0.00 0.00 0.00 0.00
QUICK BREADS (Biscuits, Muffins, Pancakes, Waffles)
0.00 0.00 0.00 0.00 0.00 0.00 0.00 0.00
RICE AND PASTA 0.00 0.00 0.00 0.00 0.00 0.00 0.00 0.00
SALAD DRESSINGS 0.00 0.00 0.00 0.00 0.00 0.00 0.00 0.00
SEAFOOD (Not Incl. Mixed Dishes) 0.00 0.00 0.00 0.00 0.00 0.00 0.00 0.00
SPREADS 0.00 0.00 0.00 0.00 0.00 0.00 0.00 0.00
SUGAR-SWEETENED AND DIET BEVERAGES
0.00 0.00 0.00 0.00 0.00 0.00 0.00 0.00
WATERS 0.00 0.00 0.00 0.00 0.00 0.00 0.00 0.00
YEAST BREADS AND TORTILLAS 0.00 0.00 0.00 0.00 0.00 0.00 0.00 0.00
TOTAL* 99.85 99.88 99.98 100.00 99.94 99.84 99.95 99.98
*Totals are less than 100% because results do not include baby foods, infant formulas and WWEIA category - other
(continued from previous page)

120
2020 Dietary Guidelines Advisory Committee Data Supplement: Food Category Sources
https://www.dietaryguidelines.gov/2020-advisory-committee-report/data-analysis
Figure 7. 1: Males and Females - Distribution of red meat intake (percentages) across major categories
100
90
80
70
60
50
40
30
20
10
0 2+
DAIRY
MIXED DISHES
2-5 years 6-11 years 12-19 years 20-40 years 41-50 years 51-70 years
PROTEIN FOODS
GRAINS
71+
SNACKS AND SWEETS FRUITS+FRUIT JUICE
VEGETABLES BEVERAGES (Not incl. Milk and 100% Fruit Juice)
CONDIMENTS, GRAVIES, SPREADS, SALAD DRESSINGS
%

121
2020 Dietary Guidelines Advisory Committee Data Supplement: Food Category Sources
https://www.dietaryguidelines.gov/2020-advisory-committee-report/data-analysis
Figure 7. 2: Males and Females - Distribution of red meat intake (percentages) across top 10 sub- categories
100
90
80
70
60
50
40
30
20
10
0
2+ 2-5 years 6-11 years 12-19 years 20-40 years 41-50 years 51-70 years 71+
BURGERS AND SANDWICHES (incl. tacos and burritos) MEATS (Not incl. Deli and Mixed Dishes)
MEAT, POULTRY, SEAFOOD MIXED DISHES RICE, PASTA AND OTHER GRAIN-BASED MIXED DISHEs
PIZZA SOUPS
VEGETABLES (Incl. Beans and Peas, not Starchy) CHIPS, CRACKERS, AND SAVORY SNACKS
STARCHY VEGETABLES ALCOHOLIC BEVERAGES
%

122
2020 Dietary Guidelines Advisory Committee Data Supplement: Food Category Sources
https://www.dietaryguidelines.gov/2020-advisory-committee-report/data-analysis
Figure 7. 3: Males - Distribution of red meat intake (percentages) across major categories
100
90
80
70
60
50
40
30
20
10
0 2+
DAIRY
MIXED DISHES
2-5 years 6-11 years 12-19 years 20-40 years 41-50 years 51-70 years
PROTEIN FOODS
GRAINS
71+
SNACKS AND SWEETS FRUITS+FRUIT JUICE
VEGETABLES BEVERAGES (Not incl. Milk and 100% Fruit Juice)
CONDIMENTS, GRAVIES, SPREADS, SALAD DRESSINGS
%

123
2020 Dietary Guidelines Advisory Committee Data Supplement: Food Category Sources
https://www.dietaryguidelines.gov/2020-advisory-committee-report/data-analysis
Figure 7. 4: Males - Distribution of red meat intake (percentages) across top 10 sub-categories
100
90
80
70
60
50
40
30
20
10
0 2+ 2-5 years 6-11 years 12-19 years 20-40 years 41-50 years 51-70 years 71+
BURGERS AND SANDWICHES (incl. tacos and burritos) MEATS (Not incl. Deli and Mixed Dishes)
MEAT, POULTRY, SEAFOOD MIXED DISHES RICE, PASTA AND OTHER GRAIN-BASED MIXED DISHEs
PIZZA SOUPS
VEGETABLES (Incl. Beans and Peas, not Starchy) CHIPS, CRACKERS, AND SAVORY SNACKS
STARCHY VEGETABLES ALCOHOLIC BEVERAGES
%

124
2020 Dietary Guidelines Advisory Committee Data Supplement: Food Category Sources
https://www.dietaryguidelines.gov/2020-advisory-committee-report/data-analysis
Figure 7. 5: Females - Distribution of red meat intake (percentages) across major categories
100
90
80
70
60
50
40
30
20
10
0 2+
DAIRY
MIXED DISHES
2-5 years 6-11 years 12-19 years 20-40 years 41-50 years 51-70 years
PROTEIN FOODS
GRAINS
71+
SNACKS AND SWEETS FRUITS+FRUIT JUICE
VEGETABLES BEVERAGES (Not incl. Milk and 100% Fruit Juice)
CONDIMENTS, GRAVIES, SPREADS, SALAD DRESSINGS
%

125
2020 Dietary Guidelines Advisory Committee Data Supplement: Food Category Sources
https://www.dietaryguidelines.gov/2020-advisory-committee-report/data-analysis
Figure 7. 6: Females - Distribution of red meat intake (percentages) across top 10 sub-categories
100
90
80
70
60
50
40
30
20
10
0 2+ 2-5 years 6-11 years 12-19 years 20-40 years 41-50 years 51-70 years 71+
BURGERS AND SANDWICHES (incl. tacos and burritos) MEATS (Not incl. Deli and Mixed Dishes)
MEAT, POULTRY, SEAFOOD MIXED DISHES RICE, PASTA AND OTHER GRAIN-BASED MIXED DISHES
PIZZA SOUPS
VEGETABLES (Incl. Beans and Peas, not Starchy) CHIPS, CRACKERS, AND SAVORY SNACKS
STARCHY VEGETABLES ALCOHOLIC BEVERAGES
%

126
2020 Dietary Guidelines Advisory Committee Data Supplement: Food Category Sources
https://www.dietaryguidelines.gov/2020-advisory-committee-report/data-analysis
Percent of cured meats intake, 2013-16, for U.S. population ages 2 years and
older, from WWEIA Food Categories
These data are estimates of the percent of cured meats from WWEIA Food Categories, re-grouped into DGAC major categories and sub-categories as described elsewhere, for individuals 2 years and older based on the day 1 dietary recalls from WWEIA, NHANES 2013-16. Breastfed children, and pregnant and lactating women have been excluded. The sample size is 15,807.
WHOLE SAMPLE (MALES + FEMALES)
Table 8. 1: Males and Females- Distribution of cured meats intake (percentages) across major categories
DGAC major category
Age Groups (Years)
2+ 2-5 6-11 12-19 20-40 41-50 51-70 71+
%
MIXED DISHES
68.42 53.42 70.29 77.63 72.08 69.51 63.93 62.86
PROTEIN FOODS
28.55 44.86 27.13 18.76 24.72 27.97 32.90 33.73
VEGETAB LES
3.00 1.71 2.55 3.50 3.28 2.40 3.15 3.13
DAIRY 0.06 0.00 0.00 0.00 0.00 0.00 0.15 0.24
FRUITS+F RUIT JUICE
0.00 0.00 0.00 0.00 0.00 0.00 0.00 0.03
CONDIME NTS, GRAVIES, SPREADS, SALAD DRESSIN GS
0.00 0.00 0.00 0.00 0.00 0.00 0.00 0.01

127
2020 Dietary Guidelines Advisory Committee Data Supplement: Food Category Sources
https://www.dietaryguidelines.gov/2020-advisory-committee-report/data-analysis
GRAINS 0.00 0.00 0.00 0.00 0.00 0.00 0.00 0.00
SNACKS AND SWEETS
0.00 0.00 0.00 0.00 0.00 0.00 0.00 0.00
BEVERAG ES (Not Incl. Milk and 100% Fruit Juice)
0.00 0.00 0.00 0.00 0.00 0.00 0.00 0.00
TOTAL* 100.00 99.99 99.98 99.89 100.00 99.89 100.00 99.99
*Totals are less than 100% because results do not include baby foods, infant formulas and WWEIA category – other
Table 8. 2: Males and Females - Distribution of cured meats intake (percentages) across sub-categories
DGAC sub-category Age Groups (Years)
2+ 2-5 6-11 12-19 20-40 41-50 51-70 71+
%
BURGERS AND SANDWICHES (Incl. Tacos and Burritos)
48.38 37.46 45.78 48.29 48.86 50.25 49.58 50.30
DELI/CURED PRODUCTS (Meat and Poultry)
25.60 41.05 25.54 16.87 21.24 24.82 30.09 30.11
PIZZA 14.41 11.31 19.58 24.14 17.22 14.37 7.88 7.46
RICE, PASTA AND OTHER GRAIN- BASED MIXED DISHEs
2.95 3.03 2.93 4.41 3.84 2.35 1.83 2.14
EGGS 2.84 3.60 1.54 1.83 3.47 3.07 2.60 3.39
VEGETABLES (Incl. Beans and Peas, not Starchy)
2.45 1.34 0.90 2.87 3.00 2.15 2.40 3.01
MEAT, POULTRY, SEAFOOD MIXED DISHES
1.47 0.85 1.76 0.60 1.05 1.05 2.58 1.50

128
2020 Dietary Guidelines Advisory Committee Data Supplement: Food Category Sources
https://www.dietaryguidelines.gov/2020-advisory-committee-report/data-analysis
SOUPS 1.22 0.77 0.25 0.18 1.11 1.50 2.06 1.46
STARCHY VEGETABLES 0.55 0.37 1.65 0.62 0.28 0.25 0.75 0.12
MEATS (Not Incl. Deli and Mixed Dishes) 0.07 0.20 0.06 0.01 0.01 0.08 0.13 0.06
CHEESE 0.06 0.00 0.00 0.00 0.00 0.00 0.15 0.24
POULTRY (Not Incl. Deli and Mixed Dishes)
0.04 0.00 0.00 0.05 0.00 0.00 0.08 0.16
FRUIT (Non-Juice) 0.00 0.00 0.00 0.00 0.00 0.00 0.00 0.03
CONDIMENTS AND GRAVIES 0.00 0.00 0.00 0.00 0.00 0.00 0.00 0.01
ALCOHOLIC BEVERAGES 0.00 0.00 0.00 0.00 0.00 0.00 0.00 0.00
BREAKFAST CEREALS AND BARS 0.00 0.00 0.00 0.00 0.00 0.00 0.00 0.00
CANDY AND SUGARS 0.00 0.00 0.00 0.00 0.00 0.00 0.00 0.00
CHIPS, CRACKERS, AND SAVORY SNACKS
0.00 0.00 0.00 0.00 0.00 0.00 0.00 0.00
COFFEE AND TEA 0.00 0.00 0.00 0.00 0.00 0.00 0.00 0.00
DESSERTS AND SWEET SNACKS 0.00 0.00 0.00 0.00 0.00 0.00 0.00 0.00
HIGHER FAT MILK/YOGURT 0.00 0.00 0.00 0.00 0.00 0.00 0.00 0.00
100% FRUIT JUICE 0.00 0.00 0.00 0.00 0.00 0.00 0.00 0.00
LOW-FAT MILK/YOGURT 0.00 0.00 0.00 0.00 0.00 0.00 0.00 0.00
NUTS, SEEDS, AND SOY 0.00 0.00 0.00 0.00 0.00 0.00 0.00 0.00
QUICK BREADS (Biscuits, Muffins, Pancakes, Waffles)
0.00 0.00 0.00 0.00 0.00 0.00 0.00 0.00
RICE AND PASTA 0.00 0.00 0.00 0.00 0.00 0.00 0.00 0.00
SALAD DRESSINGS 0.00 0.00 0.00 0.00 0.00 0.00 0.00 0.00
SEAFOOD (Not Incl. Mixed Dishes) 0.00 0.00 0.00 0.00 0.00 0.00 0.00 0.00
SPREADS 0.00 0.00 0.00 0.00 0.00 0.00 0.00 0.00
SUGAR-SWEETENED AND DIET BEVERAGES
0.00 0.00 0.00 0.00 0.00 0.00 0.00 0.00
WATERS 0.00 0.00 0.00 0.00 0.00 0.00 0.00 0.00
YEAST BREADS AND TORTILLAS 0.00 0.00 0.00 0.00 0.00 0.00 0.00 0.00
TOTAL* 100.00 99.99 99.98 99.89 100.00 99.89 100.00 99.99
*Totals are less than 100% because results do not include baby foods, infant formulas and WWEIA category - other
(continued from previous page)

129
2020 Dietary Guidelines Advisory Committee Data Supplement: Food Category Sources
https://www.dietaryguidelines.gov/2020-advisory-committee-report/data-analysis
MALES
Table 8. 3: Males - Distribution of cured meats intake (percentages) across major categories
DGAC major category Age Groups (Years)
2+ 2-5 6-11 12-19 20-40 41-50 51-70 71+
%
MIXED DISHES 70.17 54.09 71.51 80.69 76.44 71.92 63.27 63.99
PROTEIN FOODS 27.25 45.27 25.48 17.07 20.83 26.19 33.43 33.70
VEGETABLES 2.61 0.69 3.04 2.13 2.77 1.88 3.45 2.27
FRUITS+FRUIT JUICE 0.00 0.00 0.00 0.00 0.00 0.00 0.00 0.05
DAIRY 0.00 0.00 0.01 0.01 0.00 0.00 0.00 0.01
GRAINS 0.00 0.00 0.00 0.00 0.00 0.00 0.00 0.00
SNACKS AND SWEETS 0.00 0.00 0.00 0.00 0.00 0.00 0.00 0.00
BEVERAGES (Not Incl. Milk and 100% Fruit Juice)
0.00 0.00 0.00 0.00 0.00 0.00 0.00 0.00
CONDIMENTS, GRAVIES, SPREADS, SALAD DRESSINGS
0.00 0.00 0.00 0.00 0.00 0.00 0.00 0.00
TOTAL* 100.00 100.00 100.00 99.89 100.00 99.99 100.00 100.00
*Totals are less than 100% because results do not include baby foods, infant formulas and WWEIA category -other

130
2020 Dietary Guidelines Advisory Committee Data Supplement: Food Category Sources
https://www.dietaryguidelines.gov/2020-advisory-committee-report/data-analysis
Table 8. 4: Males - Distribution of cured meats intake (percentages) across sub-categories
DGAC sub-category Age Groups (Years)
2+ 2-5 6-11 12-19 20-40 41-50 51-70 71+
%
BURGERS AND SANDWICHES (Incl. Tacos and Burritos)
50.27 38.43 46.66 48.08 52.34 56.28 50.01 55.64
DELI/CURED PRODUCTS (Meat and Poultry)
24.44 40.69 23.98 15.10 17.80 23.62 31.00 29.11
PIZZA 14.51 10.97 20.31 26.43 17.91 11.73 7.96 4.00
RICE, PASTA AND OTHER GRAIN- BASED MIXED DISHES
3.06 3.47 2.72 5.51 3.97 2.34 1.44 1.24
EGGS 2.75 4.27 1.46 1.86 3.02 2.57 2.42 4.44
VEGETABLES (Incl. Beans and Peas, not Starchy)
2.06 0.69 0.82 1.87 2.48 1.85 2.57 2.26
MEAT, POULTRY, SEAFOOD MIXED DISHES
1.42 0.63 1.58 0.56 1.28 0.32 2.50 1.97
SOUPS 0.91 0.59 0.24 0.11 0.95 1.25 1.36 1.13
STARCHY VEGETABLES 0.55 0.00 2.22 0.25 0.29 0.03 0.88 0.01
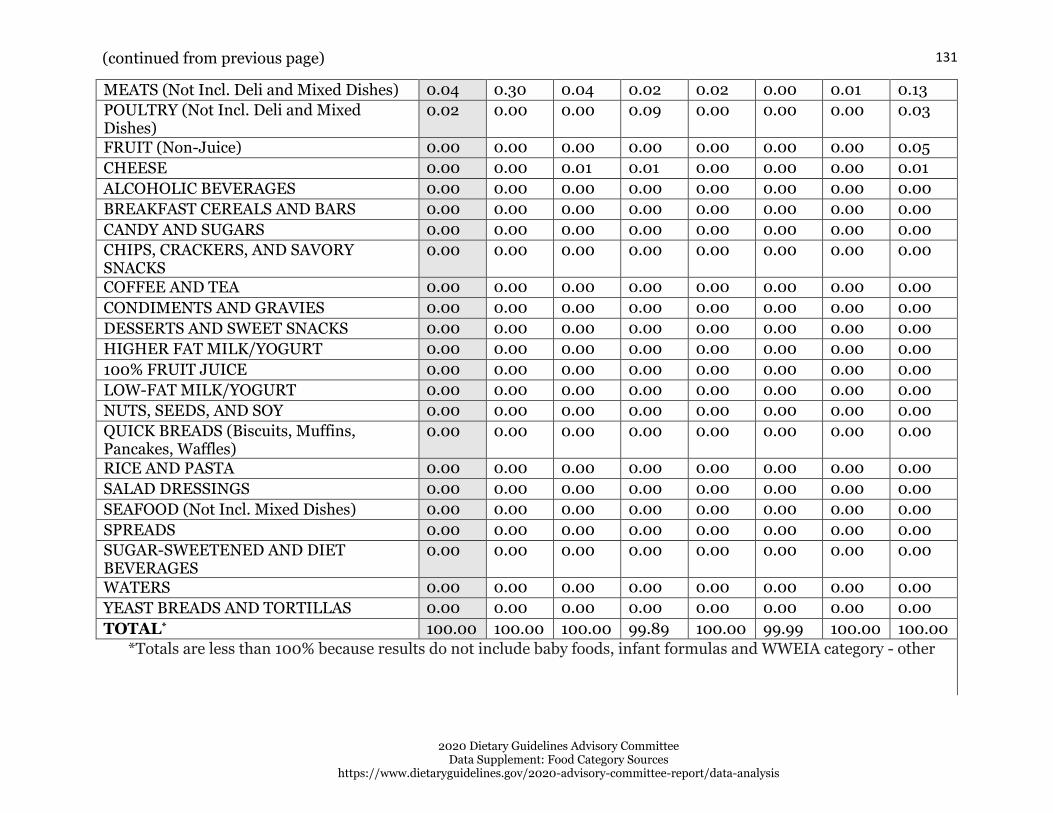
131
2020 Dietary Guidelines Advisory Committee Data Supplement: Food Category Sources
https://www.dietaryguidelines.gov/2020-advisory-committee-report/data-analysis
MEATS (Not Incl. Deli and Mixed Dishes) 0.04 0.30 0.04 0.02 0.02 0.00 0.01 0.13
POULTRY (Not Incl. Deli and Mixed Dishes)
0.02 0.00 0.00 0.09 0.00 0.00 0.00 0.03
FRUIT (Non-Juice) 0.00 0.00 0.00 0.00 0.00 0.00 0.00 0.05
CHEESE 0.00 0.00 0.01 0.01 0.00 0.00 0.00 0.01
ALCOHOLIC BEVERAGES 0.00 0.00 0.00 0.00 0.00 0.00 0.00 0.00
BREAKFAST CEREALS AND BARS 0.00 0.00 0.00 0.00 0.00 0.00 0.00 0.00
CANDY AND SUGARS 0.00 0.00 0.00 0.00 0.00 0.00 0.00 0.00
CHIPS, CRACKERS, AND SAVORY SNACKS
0.00 0.00 0.00 0.00 0.00 0.00 0.00 0.00
COFFEE AND TEA 0.00 0.00 0.00 0.00 0.00 0.00 0.00 0.00
CONDIMENTS AND GRAVIES 0.00 0.00 0.00 0.00 0.00 0.00 0.00 0.00
DESSERTS AND SWEET SNACKS 0.00 0.00 0.00 0.00 0.00 0.00 0.00 0.00
HIGHER FAT MILK/YOGURT 0.00 0.00 0.00 0.00 0.00 0.00 0.00 0.00
100% FRUIT JUICE 0.00 0.00 0.00 0.00 0.00 0.00 0.00 0.00
LOW-FAT MILK/YOGURT 0.00 0.00 0.00 0.00 0.00 0.00 0.00 0.00
NUTS, SEEDS, AND SOY 0.00 0.00 0.00 0.00 0.00 0.00 0.00 0.00
QUICK BREADS (Biscuits, Muffins, Pancakes, Waffles)
0.00 0.00 0.00 0.00 0.00 0.00 0.00 0.00
RICE AND PASTA 0.00 0.00 0.00 0.00 0.00 0.00 0.00 0.00
SALAD DRESSINGS 0.00 0.00 0.00 0.00 0.00 0.00 0.00 0.00
SEAFOOD (Not Incl. Mixed Dishes) 0.00 0.00 0.00 0.00 0.00 0.00 0.00 0.00
SPREADS 0.00 0.00 0.00 0.00 0.00 0.00 0.00 0.00
SUGAR-SWEETENED AND DIET BEVERAGES
0.00 0.00 0.00 0.00 0.00 0.00 0.00 0.00
WATERS 0.00 0.00 0.00 0.00 0.00 0.00 0.00 0.00
YEAST BREADS AND TORTILLAS 0.00 0.00 0.00 0.00 0.00 0.00 0.00 0.00
TOTAL* 100.00 100.00 100.00 99.89 100.00 99.99 100.00 100.00
*Totals are less than 100% because results do not include baby foods, infant formulas and WWEIA category - other
(continued from previous page)
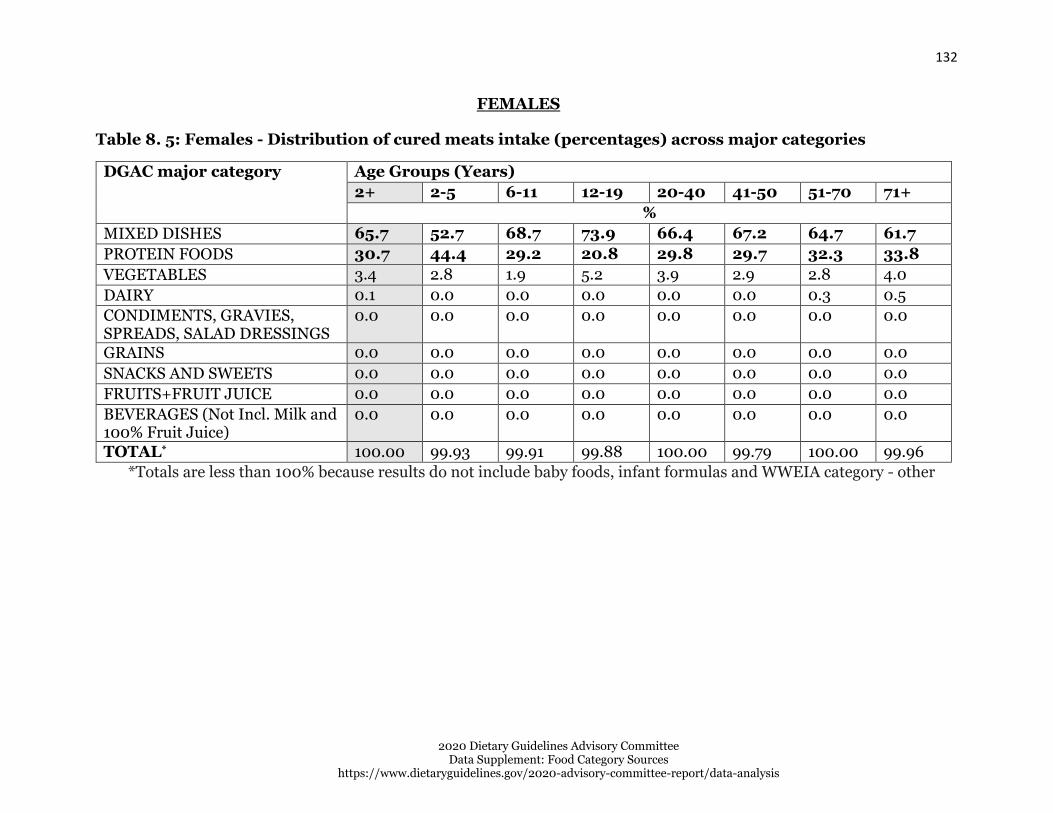
132
2020 Dietary Guidelines Advisory Committee Data Supplement: Food Category Sources
https://www.dietaryguidelines.gov/2020-advisory-committee-report/data-analysis
FEMALES
Table 8. 5: Females - Distribution of cured meats intake (percentages) across major categories
DGAC major category Age Groups (Years)
2+ 2-5 6-11 12-19 20-40 41-50 51-70 71+
%
MIXED DISHES 65.7 52.7 68.7 73.9 66.4 67.2 64.7 61.7
PROTEIN FOODS 30.7 44.4 29.2 20.8 29.8 29.7 32.3 33.8
VEGETABLES 3.4 2.8 1.9 5.2 3.9 2.9 2.8 4.0
DAIRY 0.1 0.0 0.0 0.0 0.0 0.0 0.3 0.5
CONDIMENTS, GRAVIES, SPREADS, SALAD DRESSINGS
0.0 0.0 0.0 0.0 0.0 0.0 0.0 0.0
GRAINS 0.0 0.0 0.0 0.0 0.0 0.0 0.0 0.0
SNACKS AND SWEETS 0.0 0.0 0.0 0.0 0.0 0.0 0.0 0.0
FRUITS+FRUIT JUICE 0.0 0.0 0.0 0.0 0.0 0.0 0.0 0.0
BEVERAGES (Not Incl. Milk and 100% Fruit Juice)
0.0 0.0 0.0 0.0 0.0 0.0 0.0 0.0
TOTAL* 100.00 99.93 99.91 99.88 100.00 99.79 100.00 99.96
*Totals are less than 100% because results do not include baby foods, infant formulas and WWEIA category - other
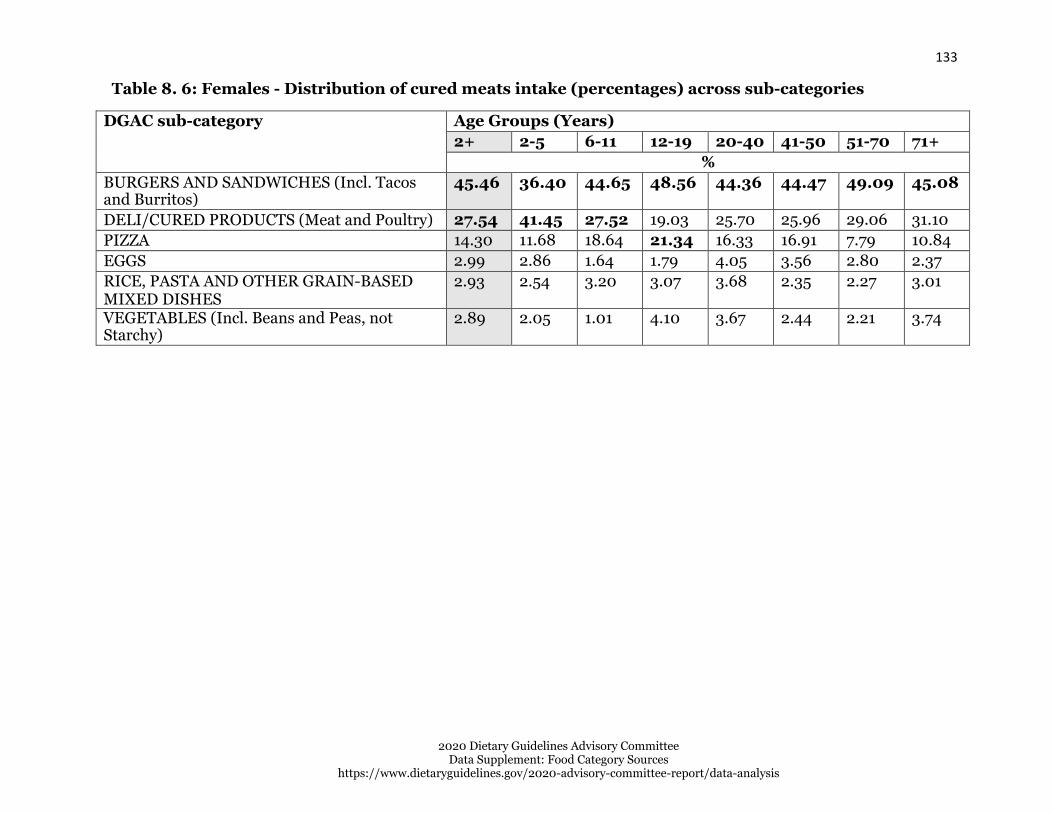
133
2020 Dietary Guidelines Advisory Committee Data Supplement: Food Category Sources
https://www.dietaryguidelines.gov/2020-advisory-committee-report/data-analysis
Table 8. 6: Females - Distribution of cured meats intake (percentages) across sub-categories
DGAC sub-category Age Groups (Years)
2+ 2-5 6-11 12-19 20-40 41-50 51-70 71+
%
BURGERS AND SANDWICHES (Incl. Tacos and Burritos)
45.46 36.40 44.65 48.56 44.36 44.47 49.09 45.08
DELI/CURED PRODUCTS (Meat and Poultry) 27.54 41.45 27.52 19.03 25.70 25.96 29.06 31.10
PIZZA 14.30 11.68 18.64 21.34 16.33 16.91 7.79 10.84
EGGS 2.99 2.86 1.64 1.79 4.05 3.56 2.80 2.37
RICE, PASTA AND OTHER GRAIN-BASED MIXED DISHES
2.93 2.54 3.20 3.07 3.68 2.35 2.27 3.01
VEGETABLES (Incl. Beans and Peas, not Starchy)
2.89 2.05 1.01 4.10 3.67 2.44 2.21 3.74

134
2020 Dietary Guidelines Advisory Committee Data Supplement: Food Category Sources
https://www.dietaryguidelines.gov/2020-advisory-committee-report/data-analysis
SOUPS 1.56 0.97 0.26 0.28 1.32 1.73 2.86 1.77
MEAT, POULTRY, SEAFOOD MIXED DISHES 1.49 1.09 1.99 0.65 0.75 1.75 2.66 1.04
STARCHY VEGETABLES 0.54 0.78 0.91 1.07 0.26 0.47 0.60 0.23
CHEESE 0.13 0.00 0.00 0.00 0.00 0.00 0.32 0.46
MEATS (Not Incl. Deli and Mixed Dishes) 0.10 0.10 0.09 0.00 0.00 0.16 0.25 0.00
POULTRY (Not Incl. Deli and Mixed Dishes) 0.07 0.00 0.00 0.00 0.00 0.00 0.17 0.30
CONDIMENTS AND GRAVIES 0.00 0.00 0.00 0.00 0.00 0.00 0.00 0.02
ALCOHOLIC BEVERAGES 0.00 0.00 0.00 0.00 0.00 0.00 0.00 0.00
BREAKFAST CEREALS AND BARS 0.00 0.00 0.00 0.00 0.00 0.00 0.00 0.00
CANDY AND SUGARS 0.00 0.00 0.00 0.00 0.00 0.00 0.00 0.00
CHIPS, CRACKERS, AND SAVORY SNACKS 0.00 0.00 0.00 0.00 0.00 0.00 0.00 0.00
COFFEE AND TEA 0.00 0.00 0.00 0.00 0.00 0.00 0.00 0.00
DESSERTS AND SWEET SNACKS 0.00 0.00 0.00 0.00 0.00 0.00 0.00 0.00
FRUIT (Non-Juice) 0.00 0.00 0.00 0.00 0.00 0.00 0.00 0.00
HIGHER FAT MILK/YOGURT 0.00 0.00 0.00 0.00 0.00 0.00 0.00 0.00
100% FRUIT JUICE 0.00 0.00 0.00 0.00 0.00 0.00 0.00 0.00
LOW-FAT MILK/YOGURT 0.00 0.00 0.00 0.00 0.00 0.00 0.00 0.00
NUTS, SEEDS, AND SOY 0.00 0.00 0.00 0.00 0.00 0.00 0.00 0.00
QUICK BREADS (Biscuits, Muffins, Pancakes, Waffles)
0.00 0.00 0.00 0.00 0.00 0.00 0.00 0.00
RICE AND PASTA 0.00 0.00 0.00 0.00 0.00 0.00 0.00 0.00
SALAD DRESSINGS 0.00 0.00 0.00 0.00 0.00 0.00 0.00 0.00
SEAFOOD (Not Incl. Mixed Dishes) 0.00 0.00 0.00 0.00 0.00 0.00 0.00 0.00
SPREADS 0.00 0.00 0.00 0.00 0.00 0.00 0.00 0.00
SUGAR-SWEETENED AND DIET BEVERAGES
0.00 0.00 0.00 0.00 0.00 0.00 0.00 0.00
WATERS 0.00 0.00 0.00 0.00 0.00 0.00 0.00 0.00
YEAST BREADS AND TORTILLAS 0.00 0.00 0.00 0.00 0.00 0.00 0.00 0.00
TOTAL* 100.0 99.93 99.91 99.88 100.00 99.79 100.00 99.96
*Totals are less than 100% because results do not include baby foods, infant formulas and WWEIA category - othe
(continued from previous page)

135
2020 Dietary Guidelines Advisory Committee Data Supplement: Food Category Sources
https://www.dietaryguidelines.gov/2020-advisory-committee-report/data-analysis
Figure 8. 1: Males and Females - Distribution of cured meats intake (percentages) across major categories
71+ 12-19 years 20-40 years 41-50 years 51-70 years6-11 years2-5 years2+
DAIRY
MIXED DISHES
100
90
80
70
60
50
40
30
20
10
0
PROTEIN FOODS
GRAINS
FRUITS+FRUIT JUICE
BEVERAGES (Not incl. Milk and 100% Fruit Juice)
SNACKS AND SWEETS
VEGETABLES
CONDIMENTS, GRAVIES, SPREADS, SALAD DRESSINGS
%

136
2020 Dietary Guidelines Advisory Committee Data Supplement: Food Category Sources
https://www.dietaryguidelines.gov/2020-advisory-committee-report/data-analysis
Figure 8. 2: Males and Females - Distribution of cured meats intake (percentages) across top 10 sub- categories
DELI/CURED PRODUCTS (Meat and Poultry)
RICE, PASTA AND OTHER GRAIN-BASED MIXED DISHEs
VEGETABLES (Incl. Beans and Peas, not Starchy)
SOUPS
MEATS (Not incl. Deli and Mixed Dishes)
BURGERS AND SANDWICHES (incl. tacos and burritos)
PIZZA
EGGS
MEAT, POULTRY, SEAFOOD MIXED DISHES
STARCHY VEGETABLES
71+ 12-19 years 20-40 years 41-50 years 51-70 years6-11 years 2-5 years 2+
100
90
80
70
60
50
40
30
20
10
0
%

137
2020 Dietary Guidelines Advisory Committee Data Supplement: Food Category Sources
https://www.dietaryguidelines.gov/2020-advisory-committee-report/data-analysis
Figure 8. 3: Males - Distribution of cured meats intake (percentages) across major categories
100
90
80
70
60
50
40
30
20
10
0
2+
DAIRY
MIXED DISHES
2-5 years 6-11 years 12-19 years 20-40 years 41-50 years 51-70 years
PROTEIN FOODS
GRAINS
71+
SNACKS AND SWEETS FRUITS+FRUIT JUICE
VEGETABLES BEVERAGES (Not incl. Milk and 100% Fruit Juice)
CONDIMENTS, GRAVIES, SPREADS, SALAD DRESSINGS
%

138
2020 Dietary Guidelines Advisory Committee Data Supplement: Food Category Sources
https://www.dietaryguidelines.gov/2020-advisory-committee-report/data-analysis
Figure 8. 4: Males - Distribution of cured meats intake (percentages) across top 10 sub-categories
100
90
80
70
60
50
40
30
20
10
0 2+ 2-5 years 6-11 years 12-19 years 20-40 years 41-50 years 51-70 years 71+
BURGERS AND SANDWICHES (incl. tacos and burritos) DELI/CURED PRODUCTS (Meat and Poultry)
PIZZA RICE, PASTA AND OTHER GRAIN-BASED MIXED DISHEs
EGGS VEGETABLES (Incl. Beans and Peas, not Starchy)
MEAT, POULTRY, SEAFOOD MIXED DISHES SOUPS
STARCHY VEGETABLES MEATS (Not incl. Deli and Mixed Dishes)
%

140
2020 Dietary Guidelines Advisory Committee Data Supplement: Food Category Sources
https://www.dietaryguidelines.gov/2020-advisory-committee-report/data-analysis
Figure 8. 5: Females - Distribution of cured meats intake (percentages) across major categories
100
90
80
70
60
50
40
30
20
10
0 2+
DAIRY
MIXED DISHES
2-5 years 6-11 years 12-19 years 20-40 years 41-50 years 51-70 years
PROTEIN FOODS
GRAINS
71+
SNACKS AND SWEETS FRUITS+FRUIT JUICE
VEGETABLES BEVERAGES (Not incl. Milk and 100% Fruit Juice)
CONDIMENTS, GRAVIES, SPREADS, SALAD DRESSINGS
%
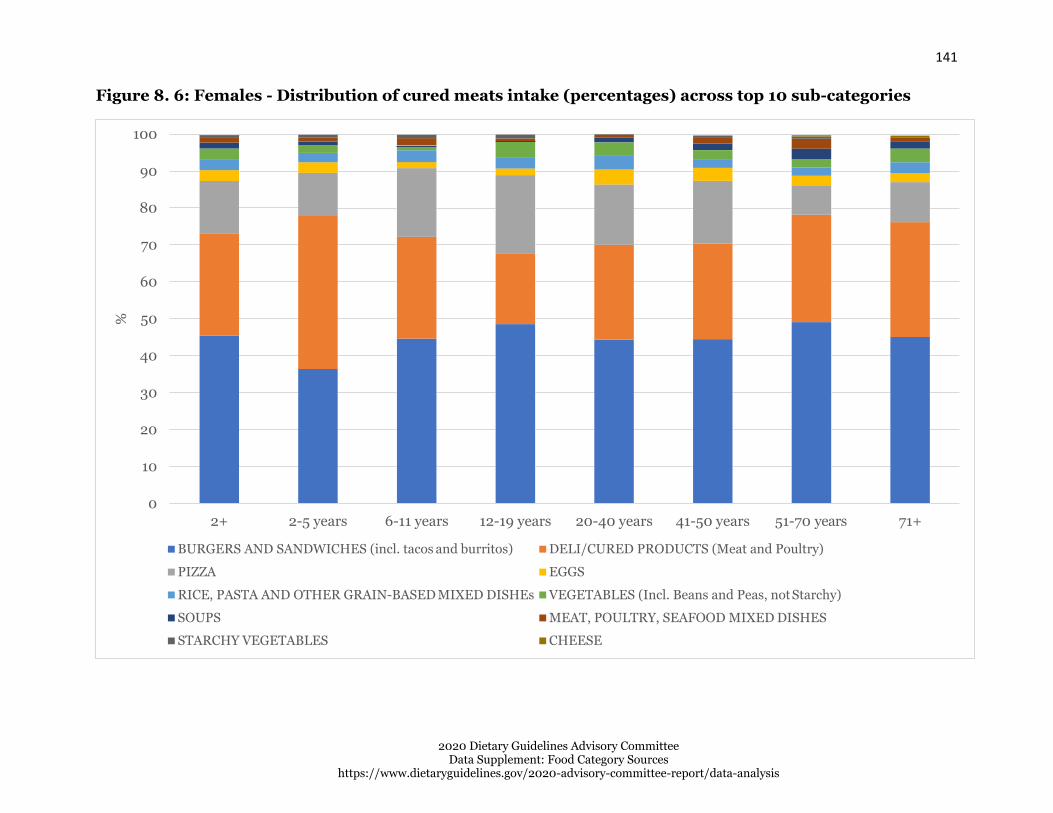
141
2020 Dietary Guidelines Advisory Committee Data Supplement: Food Category Sources
https://www.dietaryguidelines.gov/2020-advisory-committee-report/data-analysis
Figure 8. 6: Females - Distribution of cured meats intake (percentages) across top 10 sub-categories
100
90
80
70
60
50
40
30
20
10
0 2+ 2-5 years 6-11 years 12-19 years 20-40 years 41-50 years 51-70 years 71+
BURGERS AND SANDWICHES (incl. tacos and burritos) DELI/CURED PRODUCTS (Meat and Poultry)
PIZZA EGGS
RICE, PASTA AND OTHER GRAIN-BASED MIXED DISHEs VEGETABLES (Incl. Beans and Peas, not Starchy)
SOUPS MEAT, POULTRY, SEAFOOD MIXED DISHES
STARCHY VEGETABLES CHEESE
%

Percent of total dairy intake, 2013-16, for U.S. population ages 2 years and older, from WWEIA Food Categories
These data are estimates of the percent of dairy from WWEIA Food Categories, re-grouped into DGAC major categories and sub-categories as described elsewhere, for individuals 2 years and older based on the day 1 dietary recalls from WWEIA, NHANES 2013-16. Breastfed children, and pregnant and lactating women have been excluded. The sample size is 15,807.
WHOLE SAMPLE (MALES + FEMALES)
Table 9. 1: Males and Females - Distribution of total dairy intake (percentages) across major categories
DGAC major category Age Groups (Years) 2+ 2-5 6-11 12-19 20-40 41-50 51-70 71+
% DAIRY 37.10 67.41 53.76 42.13 27.11 29.18 36.62 40.69 MIXED DISHES 32.26 19.40 28.34 35.11 40.98 34.55 27.81 22.51 SNACKS AND SWEETS 10.18 5.82 9.06 9.23 9.06 10.60 11.47 14.19 BEVERAGES (Not Incl. Milk and 100% Fruit Juice)
8.04 0.93 1.20 3.69 9.82 11.44 9.96 8.22
VEGETABLES 4.33 1.01 1.47 3.45 4.98 5.22 5.08 4.65 GRAINS 4.16 2.67 3.72 3.72 3.60 4.61 4.95 4.83 PROTEIN FOODS 3.16 2.43 1.72 1.98 3.71 3.69 3.31 3.62 CONDIMENTS, GRAVIES, SPREADS, SALAD DRESSINGS
0.62 0.14 0.44 0.59 0.67 0.68 0.66 0.73
FRUITS+FRUIT JUICE 0.02 0.00 0.00 0.01 0.01 0.00 0.01 0.13
TOTAL* 99.86 99.80 99.71 99.91 99.94 99.96 99.87 99.56 *Totals are less than 100% because results do not include baby foods, infant formulas and WWEIA category – other
2020 Dietary Guidelines Advisory Committee Data Supplement: Food Category Sources
https://www.dietaryguidelines.gov/2020-advisory-committee-report/data-analysis
142

143
2020 Dietary Guidelines Advisory Committee Data Supplement: Food Category Sources
https://www.dietaryguidelines.gov/2020-advisory-committee-report/data-analysis
Table 9. 2: Males and Females - Distribution of total dairy intake (percentages) across sub-categories
DGAC sub-category Age Groups (Years)
2+ 2-5 6-11 12-19 20-40 41-50 51-70 71+
%
HIGHER FAT MILK/YOGURT 20.45 44.82 31.18 25.28 14.29 16.56 18.04 21.31
BURGERS AND SANDWICHES (Incl. Tacos and Burritos)
17.39 8.09 11.97 16.13 23.00 19.32 16.38 12.38
CHEESE 8.80 9.41 6.90 6.83 8.98 6.84 11.01 8.73
LOW-FAT MILK/YOGURT 7.39 12.73 15.45 9.78 3.44 5.25 6.94 10.21
PIZZA 7.34 6.38 9.38 11.23 9.33 7.20 4.55 3.16
DESSERTS AND SWEET SNACKS 6.94 3.94 6.08 5.86 6.32 6.46 7.68 11.38
RICE, PASTA AND OTHER GRAIN-BASED MIXED DISHES
5.35 4.67 6.08 6.41 6.55 4.96 4.06 4.32
COFFEE AND TEA 5.31 0.18 0.40 2.57 5.86 8.02 7.22 5.33
SUGAR-SWEETENED AND DIET BEVERAGES
2.72 0.75 0.80 1.13 3.95 3.39 2.73 2.89
VEGETABLES (Incl. Beans and Peas, not Starchy)
2.67 0.39 0.58 1.73 3.23 3.34 3.26 2.78
EGGS 2.47 2.17 1.57 1.57 2.87 2.80 2.49 2.83
QUICK BREADS (Biscuits, Muffins, Pancakes, Waffles)
2.34 1.76 2.47 2.64 1.78 2.67 2.74 2.30
CANDY AND SUGARS 2.13 0.99 1.59 2.02 1.75 2.38 2.73 2.58
STARCHY VEGETABLES 1.66 0.62 0.89 1.72 1.74 1.87 1.82 1.87
MEAT, POULTRY, SEAFOOD MIXED DISHES
1.48 0.22 0.58 1.11 1.32 2.04 2.03 1.60
BREAKFAST CEREALS AND BARS 1.45 0.77 0.88 0.83 1.35 1.68 1.80 2.11
CHIPS, CRACKERS, AND SAVORY SNACKS 1.11 0.89 1.39 1.34 0.98 1.76 1.06 0.23
SOUPS 0.70 0.03 0.32 0.23 0.78 1.02 0.79 1.05
CONDIMENTS AND GRAVIES 0.48 0.13 0.42 0.56 0.58 0.54 0.40 0.43

144
2020 Dietary Guidelines Advisory Committee Data Supplement: Food Category Sources
https://www.dietaryguidelines.gov/2020-advisory-committee-report/data-analysis
POULTRY (Not Incl. Deli and Mixed Dishes) 0.45 0.16 0.08 0.35 0.52 0.59 0.50 0.48
YEAST BREADS AND TORTILLAS 0.35 0.14 0.31 0.19 0.47 0.26 0.39 0.39
SEAFOOD (Not Incl. Mixed Dishes) 0.15 0.05 0.04 0.02 0.10 0.25 0.24 0.26
SALAD DRESSINGS 0.08 0.00 0.02 0.01 0.06 0.06 0.20 0.01
SPREADS 0.06 0.01 0.01 0.02 0.03 0.08 0.06 0.29
MEATS (Not Incl. Deli and Mixed Dishes) 0.03 0.00 0.01 0.02 0.06 0.00 0.04 0.03
NUTS, SEEDS, AND SOY 0.03 0.02 0.02 0.02 0.06 0.04 0.02 0.01
DELI/CURED PRODUCTS (Meat and Poultry)
0.03 0.02 0.00 0.00 0.10 0.00 0.01 0.00
RICE AND PASTA 0.02 0.00 0.05 0.07 0.00 0.00 0.02 0.03
FRUIT (Non-Juice) 0.02 0.00 0.00 0.01 0.01 0.00 0.00 0.13
ALCOHOLIC BEVERAGES 0.01 0.00 0.00 0.00 0.01 0.03 0.00 0.00
100% FRUIT JUICE 0.00 0.00 0.00 0.00 0.00 0.00 0.01 0.00
WATERS 0.00 0.00 0.00 0.00 0.00 0.00 0.00 0.00
TOTAL* 99.86 99.80 99.71 99.91 99.94 99.96 99.87 99.56
*Totals are less than 100% because results do not include baby foods, infant formulas and WWEIA category – other
(continued from previous page)

145
2020 Dietary Guidelines Advisory Committee Data Supplement: Food Category Sources
https://www.dietaryguidelines.gov/2020-advisory-committee-report/data-analysis
MALES
Table 9. 3: Males - Distribution of total dairy intake (percentages) across major categories
DGAC major category Age Groups (Years)
2+ 2-5 6-11 12-19 20-40 41-50 51-70 71+
%
DAIRY 36.89 65.84 54.47 43.52 26.85 27.60 34.16 40.82
MIXED DISHES 34.80 21.30 28.71 36.16 45.41 36.45 31.18 23.40
SNACKS AND SWEETS 9.71 5.66 8.31 9.38 7.81 11.52 12.10 12.65
BEVERAGES (Not Incl. Milk and 100% Fruit Juice)
7.00 1.05 1.31 2.36 8.37 9.65 9.32 8.82
GRAINS 4.04 2.70 3.39 3.76 3.39 4.56 5.36 3.96
VEGETABLES 3.72 0.80 1.64 2.72 3.60 5.56 4.51 4.76
PROTEIN FOODS 3.22 2.39 1.52 1.65 3.94 4.40 2.96 4.57
CONDIMENTS, GRAVIES, SPREADS, SALAD DRESSINGS
0.41 0.08 0.38 0.35 0.53 0.33 0.42 0.45
FRUITS+FRUIT JUICE 0.01 0.00 0.00 0.00 0.00 0.00 0.02 0.09
TOTAL* 99.78 99.82 99.72 99.90 99.91 100.06 100.01 99.53
*Totals are less than 100% because results do not include baby foods, infant formulas and WWEIA category – other

146
2020 Dietary Guidelines Advisory Committee Data Supplement: Food Category Sources
https://www.dietaryguidelines.gov/2020-advisory-committee-report/data-analysis
Table 9. 4: Males - Distribution of total dairy intake (percentages) across sub-categories
DGAC sub-category Age Groups (Years)
2+ 2-5 6-11 12-19 20-40 41-50 51-70 71+
%
HIGHER FAT MILK/YOGURT 21.32 44.52 31.33 27.64 15.04 16.15 16.99 21.76
BURGERS AND SANDWICHES (Incl. Tacos and Burritos)
19.86 9.08 12.12 17.48 26.95 22.95 19.30 14.03
CHEESE 7.75 8.80 6.31 5.59 7.92 5.77 10.04 7.72
PIZZA 7.58 7.85 9.80 11.23 10.05 5.92 4.94 2.20
LOW-FAT MILK/YOGURT 7.38 12.11 16.69 10.05 3.42 5.43 6.49 10.76
DESSERTS AND SWEET SNACKS 6.55 3.48 5.38 6.30 5.72 6.96 7.43 11.10
RICE, PASTA AND OTHER GRAIN-BASED MIXED DISHEs
5.23 4.12 5.86 6.04 6.59 4.62 3.86 4.29
COFFEE AND TEA 4.53 0.23 0.35 1.18 4.78 7.08 6.89 5.79
QUICK BREADS (Biscuits, Muffins, Pancakes, Waffles)
2.48 2.25 2.33 2.87 1.89 2.67 3.20 2.18
SUGAR-SWEETENED AND DIET BEVERAGES
2.45 0.83 0.96 1.18 3.57 2.50 2.44 3.03
EGGS 2.41 2.07 1.35 1.39 2.88 3.19 2.02 3.72
VEGETABLES (Incl. Beans and Peas, not Starchy)
2.07 0.40 0.59 1.30 1.90 3.70 2.48 3.02
CANDY AND SUGARS 1.96 0.99 1.77 1.85 1.34 2.35 3.13 1.37
STARCHY VEGETABLES 1.64 0.40 1.05 1.42 1.70 1.86 2.03 1.74
MEAT, POULTRY, SEAFOOD MIXED DISHES
1.44 0.23 0.39 1.25 1.21 1.60 2.29 1.75
CHIPS, CRACKERS, AND SAVORY SNACKS 1.20 1.19 1.16 1.22 0.75 2.21 1.54 0.18
BREAKFAST CEREALS AND BARS 1.16 0.31 0.77 0.71 0.92 1.63 1.70 1.36
SOUPS 0.69 0.02 0.54 0.16 0.61 1.36 0.79 1.12
POULTRY (Not Incl. Deli and Mixed Dishes) 0.50 0.25 0.09 0.20 0.59 0.78 0.56 0.77

147
2020 Dietary Guidelines Advisory Committee Data Supplement: Food Category Sources
https://www.dietaryguidelines.gov/2020-advisory-committee-report/data-analysis
YEAST BREADS AND TORTILLAS 0.39 0.13 0.28 0.18 0.59 0.25 0.46 0.34
CONDIMENTS AND GRAVIES 0.33 0.08 0.35 0.34 0.50 0.20 0.31 0.20
SEAFOOD (Not Incl. Mixed Dishes) 0.17 0.03 0.05 0.01 0.12 0.38 0.33 0.04
DELI/CURED PRODUCTS (Meat and Poultry)
0.06 0.02 0.00 0.00 0.18 0.00 0.01 0.00
SPREADS 0.05 0.00 0.01 0.01 0.01 0.01 0.09 0.23
MEATS (Not Incl. Deli and Mixed Dishes) 0.04 0.00 0.00 0.02 0.11 0.00 0.02 0.01
NUTS, SEEDS, AND SOY 0.04 0.00 0.03 0.03 0.06 0.05 0.02 0.03
SALAD DRESSINGS 0.03 0.00 0.03 0.00 0.02 0.12 0.02 0.02
ALCOHOLIC BEVERAGES 0.01 0.00 0.00 0.00 0.02 0.07 0.00 0.00
FRUIT (Non-Juice) 0.01 0.00 0.00 0.00 0.00 0.00 0.00 0.09
RICE AND PASTA 0.01 0.00 0.00 0.00 0.00 0.00 0.00 0.08
100% FRUIT JUICE 0.00 0.00 0.00 0.00 0.00 0.00 0.02 0.00
WATERS 0.00 0.00 0.00 0.00 0.00 0.00 0.00 0.00
TOTAL* 99.78 99.82 99.72 99.90 99.91 100.06 100.01 99.53
*Totals are less than 100% because results do not include baby foods, infant formulas and WWEIA category – other
(continued from previous page)

148
2020 Dietary Guidelines Advisory Committee Data Supplement: Food Category Sources
https://www.dietaryguidelines.gov/2020-advisory-committee-report/data-analysis
FEMALES
Table 9. 5: Females - Distribution of total dairy intake (percentages) across major categories
DGAC major category Age Groups (Years)
2+ 2-5 6-11 12-19 20-40 41-50 51-70 71+
%
DAIRY 38.33 68.86 52.95 40.68 27.40 30.59 38.86 40.59
MIXED DISHES 29.13 17.64 27.92 34.02 36.10 32.86 24.75 21.80
SNACKS AND SWEETS 10.42 5.97 9.92 9.07 10.43 9.78 10.91 15.39
BEVERAGES (Not Incl. Milk and 100% Fruit Juice)
8.85 0.81 1.07 5.09 11.42 13.03 10.53 7.75
VEGETABLES 4.87 1.21 1.27 4.22 6.50 4.91 5.60 4.56
GRAINS 4.23 2.65 4.09 3.68 3.83 4.66 4.58 5.52
PROTEIN FOODS 3.07 2.46 1.95 2.33 3.45 3.05 3.63 2.86
CONDIMENTS, GRAVIES, SPREADS, SALAD DRESSINGS
0.81 0.19 0.52 0.84 0.82 1.00 0.88 0.95
FRUITS+FRUIT JUICE 0.03 0.00 0.00 0.01 0.02 0.01 0.00 0.17
TOTAL* 99.74 99.79 99.70 99.93 99.97 99.88 99.74 99.59
*Totals are less than 100% because results do not include baby foods, infant formulas and WWEIA category – other

149
2020 Dietary Guidelines Advisory Committee Data Supplement: Food Category Sources
https://www.dietaryguidelines.gov/2020-advisory-committee-report/data-analysis
Table 9. 6: Females - Distribution of total dairy intake (percentages) across sub-categories
DGAC sub-category Age Groups (Years)
2+ 2-5 6-11 12-19 20-40 41-50 51-70 71+
%
HIGHER FAT MILK/YOGURT 20.80 45.09 30.99 22.79 13.45 16.92 18.98 20.96
BURGERS AND SANDWICHES (Incl. Tacos and Burritos)
14.50 7.18 11.80 14.72 18.64 16.09 13.73 11.08
CHEESE 9.73 9.97 7.58 8.13 10.14 7.80 11.89 9.52
LOW-FAT MILK/YOGURT 7.28 13.30 14.03 9.50 3.45 5.08 7.35 9.79
DESSERTS AND SWEET SNACKS 7.15 4.36 6.88 5.40 6.98 6.01 7.91 11.59
PIZZA 6.97 5.03 8.90 11.23 8.54 8.34 4.19 3.91
COFFEE AND TEA 5.92 0.13 0.47 4.02 7.06 8.86 7.53 4.98
RICE, PASTA AND OTHER GRAIN- BASED MIXED DISHES
5.46 5.18 6.34 6.80 6.51 5.27 4.24 4.34
VEGETABLES (Incl. Beans and Peas, not Starchy)
3.19 0.39 0.57 2.17 4.70 3.03 3.97 2.59
SUGAR-SWEETENED AND DIET BEVERAGES
2.93 0.69 0.60 1.07 4.36 4.18 3.00 2.77
EGGS 2.50 2.26 1.82 1.76 2.86 2.45 2.93 2.14
CANDY AND SUGARS 2.25 0.99 1.38 2.20 2.21 2.41 2.37 3.53
QUICK BREADS (Biscuits, Muffins, Pancakes, Waffles)
2.17 1.31 2.63 2.40 1.66 2.67 2.32 2.40
BREAKFAST CEREALS AND BARS 1.71 1.19 1.00 0.95 1.82 1.72 1.90 2.69
STARCHY VEGETABLES 1.67 0.82 0.71 2.05 1.80 1.88 1.64 1.97
MEAT, POULTRY, SEAFOOD MIXED DISHES
1.50 0.21 0.81 0.96 1.45 2.44 1.79 1.49
CHIPS, CRACKERS, AND SAVORY SNACKS
1.02 0.62 1.66 1.47 1.24 1.36 0.63 0.27
SOUPS 0.69 0.04 0.07 0.31 0.96 0.72 0.80 0.99
CONDIMENTS AND GRAVIES 0.60 0.17 0.50 0.79 0.67 0.86 0.48 0.60

150
2020 Dietary Guidelines Advisory Committee Data Supplement: Food Category Sources
https://www.dietaryguidelines.gov/2020-advisory-committee-report/data-analysis
POULTRY (Not Incl. Deli and Mixed Dishes)
0.38 0.07 0.07 0.52 0.44 0.43 0.45 0.26
YEAST BREADS AND TORTILLAS 0.31 0.15 0.35 0.20 0.35 0.27 0.34 0.42
SEAFOOD (Not Incl. Mixed Dishes) 0.13 0.06 0.03 0.02 0.08 0.13 0.16 0.42
SALAD DRESSINGS 0.13 0.00 0.00 0.02 0.11 0.02 0.36 0.01
SPREADS 0.08 0.01 0.02 0.03 0.04 0.13 0.03 0.34
RICE AND PASTA 0.03 0.00 0.11 0.14 0.01 0.00 0.03 0.00
MEATS (Not Incl. Deli and Mixed Dishes) 0.03 0.00 0.03 0.02 0.01 0.01 0.06 0.04
NUTS, SEEDS, AND SOY 0.03 0.04 0.01 0.01 0.05 0.03 0.03 0.00
FRUIT (Non-Juice) 0.03 0.00 0.00 0.01 0.02 0.01 0.00 0.17
DELI/CURED PRODUCTS (Meat and Poultry)
0.00 0.01 0.00 0.00 0.00 0.00 0.00 0.00
ALCOHOLIC BEVERAGES 0.00 0.00 0.00 0.00 0.00 0.00 0.00 0.00
100% FRUIT JUICE 0.00 0.00 0.00 0.00 0.00 0.00 0.00 0.00
WATERS 0.00 0.00 0.00 0.00 0.00 0.00 0.00 0.00
TOTAL* 99.74 99.79 99.70 99.93 99.97 99.88 99.74 99.59
*Totals are less than 100% because results do not include baby foods, infant formulas and WWEIA category – other
(continued from previous page)

151
2020 Dietary Guidelines Advisory Committee Data Supplement: Food Category Sources
https://www.dietaryguidelines.gov/2020-advisory-committee-report/data-analysis
Figure 9. 1: Males and Females - Distribution of total dairy intake (percentages) across major categories
100
90
80
70
60
50
40
30
20
10
0 2+
DAIRY
MIXED DISHES
2-5 years 6-11 years 12-19 years 20-40 years 41-50 years 51-70 years
PROTEIN FOODS
GRAINS
71+
SNACKS AND SWEETS FRUITS+FRUIT JUICE
VEGETABLES BEVERAGES (Not incl. Milk and 100% Fruit Juice)
CONDIMENTS, GRAVIES, SPREADS, SALAD DRESSINGS
%

152
2020 Dietary Guidelines Advisory Committee Data Supplement: Food Category Sources
https://www.dietaryguidelines.gov/2020-advisory-committee-report/data-analysis
Figure 9. 2: Males and Females - Distribution of total dairy intake (percentages) across top 10 sub- categories
100
90
80
70
60
50
40
30
20
10
0 2+ 2-5 years 6-11 years 12-19 years 20-40 years 41-50 years 51-70 years 71+
HIGHER FAT MILK/YOGURT BURGERS AND SANDWICHES (incl. tacos and burritos)
CHEESE LOWFAT MILK/YOGURT
PIZZA DESSERTS AND SWEET SNACKS
RICE, PASTA AND OTHER GRAIN-BASED MIXED DISHEs COFFEE AND TEA
SUGAR-SWEETENED AND DIET BEVERAGES VEGETABLES (Incl. Beans and Peas, not Starchy)
%

153
2020 Dietary Guidelines Advisory Committee Data Supplement: Food Category Sources
https://www.dietaryguidelines.gov/2020-advisory-committee-report/data-analysis
Figure 9. 3: Males - Distribution of total dairy intake (percentages) across major categories
100
90
80
70
60
50
40
30
20
10
0
2+
DAIRY
MIXED DISHES
2-5 years 6-11 years 12-19 years 20-40 years 41-50 years 51-70 years
PROTEIN FOODS
GRAINS
71+
SNACKS AND SWEETS FRUITS+FRUIT JUICE
VEGETABLES BEVERAGES (Not incl. Milk and 100% Fruit Juice)
CONDIMENTS, GRAVIES, SPREADS, SALAD DRESSINGS
%

154
2020 Dietary Guidelines Advisory Committee Data Supplement: Food Category Sources
https://www.dietaryguidelines.gov/2020-advisory-committee-report/data-analysis
Figure 9. 4: Males - Distribution of total dairy intake (percentages) across top 10 sub-categories
100
90
80
70
60
50
40
30
20
10
0 2+ 2-5 years 6-11 years 12-19 years 20-40 years 41-50 years 51-70 years 71+
HIGHER FAT MILK/YOGURT BURGERS AND SANDWICHES (incl. tacos and burritos)
CHEESE PIZZA
LOWFAT MILK/YOGURT DESSERTS AND SWEET SNACKS
RICE, PASTA AND OTHER GRAIN-BASED MIXED DISHEs COFFEE AND TEA
QUICK BREADS (Biscuits, Muffins, Pancakes, Waffles) SUGAR-SWEETENED AND DIET BEVERAGES
%

155
2020 Dietary Guidelines Advisory Committee Data Supplement: Food Category Sources
https://www.dietaryguidelines.gov/2020-advisory-committee-report/data-analysis
Figure 9. 5: Females - Distribution of total dairy intake (percentages) across major categories
100
90
80
70
60
50
40
30
20
10
0 2+
DAIRY
MIXED DISHES
2-5 years 6-11 years 12-19 years 20-40 years 41-50 years 51-70 years
PROTEIN FOODS
GRAINS
71+
SNACKS AND SWEETS FRUITS+FRUIT JUICE
VEGETABLES BEVERAGES (Not incl. Milk and 100% Fruit Juice)
CONDIMENTS, GRAVIES, SPREADS, SALAD DRESSINGS
%

156
2020 Dietary Guidelines Advisory Committee Data Supplement: Food Category Sources
https://www.dietaryguidelines.gov/2020-advisory-committee-report/data-analysis
Figure 9. 6: Females - Distribution of total dairy intake (percentages) across top 10 sub-categories
100
90
80
70
60
50
40
30
20
10
0
2+ 2-5 years 6-11 years 12-19 years 20-40 years 41-50 years 51-70 years 71+
HIGHER FAT MILK/YOGURT BURGERS AND SANDWICHES (incl. tacos and burritos)
CHEESE LOWFAT MILK/YOGURT
DESSERTS AND SWEET SNACKS PIZZA
COFFEE AND TEA RICE, PASTA AND OTHER GRAIN-BASED MIXED DISHEs
VEGETABLES (Incl. Beans and Peas, not Starchy) SUGAR-SWEETENED AND DIET BEVERAGES
%

157
2020 Dietary Guidelines Advisory Committee Data Supplement: Food Category Sources
https://www.dietaryguidelines.gov/2020-advisory-committee-report/data-analysis
Percent of milk intake, 2013-16, for U.S. population ages 2 years and older,
from WWEIA Food Categories
These data are estimates of the percent of milk from WWEIA Food Categories, re-grouped into DGAC major categories and sub-categories as described elsewhere, for individuals 2 years and older based on the day 1 dietary recalls from WWEIA, NHANES 2013-16. Breastfed children, and pregnant and lactating women have been excluded. The sample size is 15,807.
WHOLE SAMPLE (MALES + FEMALES)
Table 10. 1: Males and Females- Distribution of milk intake (percentages) across major categories
DGAC major category Age Groups (Years)
2+ 2-5 6-11 12-19 20-40 41-50 51-70 71+
%
DAIRY 39.68 76.30 66.68 54.67 27.53 29.62 31.87 40.65
BEVERAGES (Not Incl. Milk and 100% Fruit Juice)
13.52 1.09 1.96 5.73 17.41 20.16 17.71 10.79
SNACKS AND SWEETS 12.58 5.00 7.51 9.81 15.40 13.32 14.04 12.88
MIXED DISHES 8.47 2.01 4.21 7.45 11.73 9.41 8.84 6.74
GRAINS 8.20 5.83 7.37 7.60 8.40 8.03 9.25 8.00
PROTEIN FOODS 5.73 4.13 2.89 3.81 7.43 7.33 5.67 5.15
VEGETABLES 2.81 0.76 1.25 2.78 3.49 3.61 2.86 2.53
CONDIMENTS, GRAVIES, SPREADS, SALAD DRESSINGS
1.05 0.12 0.48 0.85 1.53 1.27 0.89 1.22
FRUITS+FRUIT JUICE 0.01 0.00 0.00 0.00 0.03 0.00 0.01 0.04
TOTAL* 92.05 95.24 92.34 92.71 92.94 92.75 91.15 88.00
*Totals are less than 100% because results do not include baby foods, infant formulas and WWEIA category – other

158
2020 Dietary Guidelines Advisory Committee Data Supplement: Food Category Sources
https://www.dietaryguidelines.gov/2020-advisory-committee-report/data-analysis
Table 10. 2: Males and Females- Distribution of milk intake (percentages) across sub-categories
DGAC sub-category Age Groups (Years)
2+ 2-5 6-11 12-19 20-40 41-50 51-70 71+
%
HIGHER FAT MILK/YOGURT 26.62 56.82 42.65 37.91 19.65 20.46 19.82 24.51
LOW-FAT MILK/YOGURT 13.06 19.48 24.03 16.75 7.88 9.15 12.05 16.14
COFFEE AND TEA 10.75 0.28 0.78 4.37 12.93 16.85 15.08 8.65
DESSERTS AND SWEET SNACKS 6.66 2.88 3.98 5.55 8.08 7.04 6.86 8.00
CANDY AND SUGARS 5.56 2.10 3.09 3.94 6.78 5.51 7.03 4.87
QUICK BREADS (Biscuits, Muffins, Pancakes, Waffles)
5.07 4.25 4.94 5.53 5.07 4.85 5.38 4.60
EGGS 4.18 3.54 2.41 2.79 5.30 4.95 4.12 4.00
BURGERS AND SANDWICHES (Incl. Tacos and Burritos)
3.28 0.55 1.21 2.66 5.24 3.75 3.18 2.07
BREAKFAST CEREALS AND BARS 2.79 1.56 2.20 1.71 3.01 2.83 3.54 2.72
SUGAR-SWEETENED AND DIET BEVERAGES
2.76 0.81 1.18 1.37 4.48 3.27 2.64 2.13
RICE, PASTA AND OTHER GRAIN-BASED MIXED DISHEs
2.24 1.14 1.84 3.38 3.40 1.77 1.61 1.14
STARCHY VEGETABLES 2.17 0.63 1.09 2.17 2.70 2.64 2.25 1.89
MEAT, POULTRY, SEAFOOD MIXED DISHES
2.05 0.28 0.87 1.11 1.99 2.42 3.08 2.26
POULTRY (Not Incl. Deli and Mixed Dishes) 1.06 0.28 0.18 0.77 1.56 1.88 0.91 0.73
SOUPS 0.90 0.04 0.29 0.29 1.09 1.48 0.97 1.26
CONDIMENTS AND GRAVIES 0.80 0.11 0.45 0.76 1.23 1.09 0.64 0.46
VEGETABLES (Incl. Beans and Peas, not Starchy)
0.64 0.14 0.15 0.62 0.79 0.97 0.61 0.64
CHIPS, CRACKERS, AND SAVORY SNACKS 0.36 0.02 0.44 0.33 0.54 0.76 0.15 0.02
YEAST BREADS AND TORTILLAS 0.29 0.02 0.16 0.19 0.29 0.35 0.28 0.64
SEAFOOD (Not Incl. Mixed Dishes) 0.27 0.07 0.16 0.07 0.21 0.38 0.45 0.29

159
2020 Dietary Guidelines Advisory Committee Data Supplement: Food Category Sources
https://www.dietaryguidelines.gov/2020-advisory-committee-report/data-analysis
SPREADS 0.24 0.01 0.02 0.07 0.29 0.18 0.24 0.77
NUTS, SEEDS, AND SOY 0.14 0.23 0.06 0.16 0.19 0.11 0.14 0.06
MEATS (Not Incl. Deli and Mixed Dishes) 0.07 0.01 0.03 0.02 0.16 0.01 0.05 0.06
RICE AND PASTA 0.05 0.00 0.06 0.17 0.03 0.00 0.05 0.04
FRUIT (Non-Juice) 0.01 0.00 0.00 0.00 0.03 0.00 0.00 0.04
SALAD DRESSINGS 0.01 0.00 0.00 0.03 0.01 0.00 0.01 0.00
ALCOHOLIC BEVERAGES 0.01 0.00 0.00 0.00 0.01 0.04 0.00 0.00
DELI/CURED PRODUCTS (Meat and Poultry)
0.00 0.00 0.05 0.00 0.00 0.00 0.00 0.00
CHEESE 0.00 0.00 0.00 0.01 0.00 0.00 0.01 0.01
100% FRUIT JUICE 0.00 0.00 0.00 0.00 0.00 0.00 0.01 0.00
PIZZA 0.00 0.00 0.00 0.00 0.00 0.00 0.00 0.00
WATERS 0.00 0.00 0.00 0.00 0.00 0.00 0.00 0.00
TOTAL* 92.05 95.24 92.34 92.71 92.94 92.75 91.15 88.00
*Totals are less than 100% because results do not include baby foods, infant formulas and WWEIA category - other
(continued from previous page)

160
2020 Dietary Guidelines Advisory Committee Data Supplement: Food Category Sources
https://www.dietaryguidelines.gov/2020-advisory-committee-report/data-analysis
MALES
Table 10. 3: Males - Distribution of milk intake (percentages) across major categories
DGAC major category Age Groups (Years)
2+ 2-5 6-11 12-19 20-40 41-50 51-70 71+
%
DAIRY 43.29 75.62 69.33 59.53 31.12 33.02 33.01 43.58
BEVERAGES (Not Incl. Milk and 100% Fruit Juice)
12.01 1.13 2.17 3.91 16.00 17.03 16.67 11.04
SNACKS AND SWEETS 11.79 5.29 7.78 9.33 13.36 13.05 15.37 9.46
MIXED DISHES 8.18 2.29 3.73 6.95 11.51 9.20 8.70 6.85
GRAINS 7.84 6.98 6.43 7.27 8.18 7.40 9.40 6.89
PROTEIN FOODS 5.79 3.92 2.47 3.77 7.92 9.00 4.64 6.56
VEGETABLES 2.88 0.52 1.11 2.31 3.40 4.28 3.29 2.44
CONDIMENTS, GRAVIES, SPREADS, SALAD DRESSINGS
0.81 0.06 0.44 0.64 1.51 0.52 0.70 0.68
FRUITS+FRUIT JUICE 0.02 0.00 0.00 0.00 0.02 0.00 0.02 0.08
TOTAL* 92.62 95.81 93.47 93.72 93.01 93.49 91.80 87.58
*Totals are less than 100% because results do not include baby foods, infant formulas and WWEIA category - other

161
2020 Dietary Guidelines Advisory Committee Data Supplement: Food Category Sources
https://www.dietaryguidelines.gov/2020-advisory-committee-report/data-analysis
Table 10. 4: Males - Distribution of milk intake (percentages) across sub-categories
DGAC sub-category Age Groups (Years)
2+ 2-5 6-11 12-19 20-40 41-50 51-70 71+
%
HIGHER FAT MILK/YOGURT 29.84 57.02 43.20 42.44 22.59 23.27 21.18 27.09
LOW-FAT MILK/YOGURT 13.44 18.59 26.13 17.09 8.53 9.75 11.83 16.48
COFFEE AND TEA 9.51 0.30 0.82 2.62 11.50 14.53 14.72 9.13
DESSERTS AND SWEET SNACKS 6.48 3.68 3.48 5.51 7.62 7.05 7.56 6.87
QUICK BREADS (Biscuits, Muffins, Pancakes, Waffles)
5.21 5.52 4.63 5.83 5.10 5.33 5.63 4.44
CANDY AND SUGARS 5.07 1.58 3.77 3.48 5.55 5.77 7.51 2.59
EGGS 4.12 3.50 1.99 2.96 5.44 5.60 3.24 5.36
BURGERS AND SANDWICHES (Incl. Tacos and Burritos)
3.27 0.69 0.98 2.28 5.58 3.43 3.36 2.07
SUGAR-SWEETENED AND DIET BEVERAGES
2.48 0.82 1.35 1.29 4.48 2.41 1.95 1.91
BREAKFAST CEREALS AND BARS 2.39 1.43 1.76 1.25 2.79 1.83 3.46 2.06
STARCHY VEGETABLES 2.27 0.36 1.00 1.75 2.63 3.05 2.93 1.66
RICE, PASTA AND OTHER GRAIN-BASED MIXED DISHEs
2.08 1.29 1.65 3.35 3.16 1.69 1.27 1.00
MEAT, POULTRY, SEAFOOD MIXED DISHES
2.00 0.30 0.62 1.16 2.03 2.13 3.12 2.57
POULTRY (Not Incl. Deli and Mixed Dishes)
1.24 0.36 0.26 0.68 1.78 2.82 0.92 0.96
SOUPS 0.83 0.02 0.47 0.16 0.74 1.95 0.95 1.21
CONDIMENTS AND GRAVIES 0.63 0.06 0.42 0.57 1.22 0.48 0.48 0.22
VEGETABLES (Incl. Beans and Peas, not Starchy)
0.61 0.16 0.11 0.56 0.77 1.23 0.36 0.78
CHIPS, CRACKERS, AND SAVORY SNACKS
0.25 0.04 0.53 0.34 0.20 0.23 0.30 0.00

162
2020 Dietary Guidelines Advisory Committee Data Supplement: Food Category Sources
https://www.dietaryguidelines.gov/2020-advisory-committee-report/data-analysis
SEAFOOD (Not Incl. Mixed Dishes) 0.25 0.05 0.10 0.07 0.23 0.52 0.40 0.05
YEAST BREADS AND TORTILLAS 0.24 0.04 0.04 0.19 0.30 0.24 0.30 0.30
SPREADS 0.17 0.00 0.02 0.07 0.26 0.04 0.20 0.45
NUTS, SEEDS, AND SOY 0.09 0.00 0.03 0.04 0.18 0.06 0.06 0.14
MEATS (Not Incl. Deli and Mixed Dishes) 0.09 0.01 0.00 0.02 0.29 0.00 0.02 0.04
ALCOHOLIC BEVERAGES 0.02 0.00 0.00 0.00 0.02 0.09 0.00 0.00
FRUIT (Non-Juice) 0.01 0.00 0.00 0.00 0.02 0.00 0.00 0.08
SALAD DRESSINGS 0.01 0.00 0.01 0.00 0.02 0.00 0.02 0.00
RICE AND PASTA 0.01 0.00 0.00 0.00 0.00 0.00 0.01 0.08
DELI/CURED PRODUCTS (Meat and Poultry)
0.01 0.00 0.09 0.00 0.00 0.00 0.00 0.00
100% FRUIT JUICE 0.00 0.00 0.00 0.00 0.00 0.00 0.02 0.00
CHEESE 0.00 0.00 0.00 0.01 0.00 0.00 0.00 0.00
PIZZA 0.00 0.00 0.00 0.00 0.00 0.00 0.00 0.00
WATERS 0.00 0.00 0.00 0.00 0.00 0.00 0.00 0.00
TOTAL* 92.62 95.81 93.47 93.72 93.01 93.49 91.80 87.58
*Totals are less than 100% because results do not include baby foods, infant formulas and WWEIA category - other
(continued from previous page)

163
2020 Dietary Guidelines Advisory Committee Data Supplement: Food Category Sources
https://www.dietaryguidelines.gov/2020-advisory-committee-report/data-analysis
FEMALES
Table 10. 5: Females- Distribution of milk intake (percentages) across major categories
DGAC major category Age Groups (Years)
2+ 2-5 6-11 12-19 20-40 41-50 51-70 71+
%
DAIRY 37.44 76.91 63.59 49.45 23.75 26.70 30.84 38.31
BEVERAGES (Not Incl. Milk and 100% Fruit Juice)
14.59 1.06 1.71 7.68 18.91 22.85 18.66 10.58
SNACKS AND SWEETS 12.99 4.74 7.19 10.33 17.55 13.54 12.84 15.62
MIXED DISHES 8.58 1.76 4.77 7.99 11.95 9.60 8.97 6.64
GRAINS 8.38 4.78 8.46 7.95 8.62 8.57 9.12 8.89
PROTEIN FOODS 5.59 4.32 3.39 3.85 6.91 5.89 6.59 4.02
VEGETABLES 2.73 0.99 1.40 3.29 3.59 3.04 2.48 2.61
CONDIMENTS, GRAVIES, SPREADS, SALAD DRESSINGS
1.25 0.17 0.52 1.08 1.56 1.91 1.06 1.66
FRUITS+FRUIT JUICE 0.01 0.00 0.00 0.01 0.03 0.01 0.00 0.00
TOTAL* 91.55 94.73 91.03 91.63 92.88 92.11 90.56 88.33
*Totals are less than 100% because results do not include baby foods, infant formulas and WWEIA category - other

164
2020 Dietary Guidelines Advisory Committee Data Supplement: Food Category Sources
https://www.dietaryguidelines.gov/2020-advisory-committee-report/data-analysis
Table 10. 6: Females- Distribution of milk intake (percentages) across sub-categories
DGAC sub-category Age Groups (Years)
2+ 2-5 6-11 12-19 20-40 41-50 51-70 71+
%
HIGHER FAT MILK/YOGURT 24.91 56.63 42.01 33.06 16.55 18.05 18.58 22.45
LOW-FAT MILK/YOGURT 12.52 20.28 21.58 16.39 7.20 8.64 12.25 15.86
COFFEE AND TEA 11.60 0.25 0.72 6.23 14.44 18.84 15.40 8.27
DESSERTS AND SWEET SNACKS 6.66 2.16 4.57 5.59 8.57 7.04 6.22 8.90
CANDY AND SUGARS 5.88 2.57 2.29 4.43 8.08 5.29 6.60 6.69
QUICK BREADS (Biscuits, Muffins, Pancakes, Waffles)
4.83 3.10 5.30 5.22 5.04 4.43 5.15 4.72
EGGS 4.20 3.57 2.91 2.61 5.16 4.39 4.91 2.91
BURGERS AND SANDWICHES (Incl. Tacos and Burritos)
3.19 0.43 1.47 3.07 4.89 4.02 3.02 2.07
BREAKFAST CEREALS AND BARS 3.13 1.68 2.72 2.19 3.24 3.70 3.61 3.25
SUGAR-SWEETENED AND DIET BEVERAGES
2.99 0.81 0.99 1.45 4.47 4.01 3.26 2.32
RICE, PASTA AND OTHER GRAIN-BASED MIXED DISHEs
2.38 1.01 2.06 3.42 3.66 1.84 1.92 1.25
MEAT, POULTRY, SEAFOOD MIXED DISHES
2.06 0.27 1.16 1.07 1.94 2.67 3.04 2.02
STARCHY VEGETABLES 2.06 0.87 1.20 2.61 2.76 2.29 1.64 2.07
SOUPS 0.94 0.06 0.09 0.44 1.46 1.06 0.99 1.30
CONDIMENTS AND GRAVIES 0.94 0.15 0.49 0.97 1.23 1.62 0.78 0.65
POULTRY (Not Incl. Deli and Mixed Dishes)
0.86 0.21 0.09 0.86 1.33 1.07 0.89 0.54
VEGETABLES (Incl. Beans and Peas, not Starchy)
0.67 0.11 0.20 0.68 0.82 0.75 0.84 0.53
CHIPS, CRACKERS, AND SAVORY SNACKS
0.45 0.01 0.33 0.31 0.91 1.22 0.02 0.03
YEAST BREADS AND TORTILLAS 0.33 0.01 0.31 0.19 0.28 0.43 0.27 0.92

165
2020 Dietary Guidelines Advisory Committee Data Supplement: Food Category Sources
https://www.dietaryguidelines.gov/2020-advisory-committee-report/data-analysis
SPREADS 0.31 0.01 0.03 0.06 0.32 0.30 0.27 1.02
SEAFOOD (Not Incl. Mixed Dishes) 0.29 0.09 0.23 0.07 0.19 0.26 0.50 0.49
NUTS, SEEDS, AND SOY 0.19 0.44 0.08 0.28 0.20 0.16 0.22 0.00
RICE AND PASTA 0.09 0.00 0.13 0.36 0.06 0.00 0.09 0.00
MEATS (Not Incl. Deli and Mixed Dishes) 0.04 0.01 0.07 0.02 0.02 0.02 0.07 0.07
FRUIT (Non-Juice) 0.01 0.00 0.00 0.01 0.03 0.01 0.00 0.00
SALAD DRESSINGS 0.01 0.00 0.00 0.05 0.01 0.00 0.01 0.00
CHEESE 0.00 0.00 0.00 0.00 0.00 0.00 0.01 0.01
DELI/CURED PRODUCTS (Meat and Poultry)
0.00 0.01 0.00 0.00 0.00 0.00 0.00 0.00
ALCOHOLIC BEVERAGES 0.00 0.00 0.00 0.00 0.00 0.00 0.00 0.00
100% FRUIT JUICE 0.00 0.00 0.00 0.00 0.00 0.00 0.00 0.00
PIZZA 0.00 0.00 0.00 0.00 0.00 0.00 0.00 0.00
WATERS 0.00 0.00 0.00 0.00 0.00 0.00 0.00 0.00
TOTAL* 91.55 94.73 91.03 91.63 92.88 92.11 90.56 88.33
*Totals are less than 100% because results do not include baby foods, infant formulas and WWEIA category - other
(continued from previous page)

166
2020 Dietary Guidelines Advisory Committee Data Supplement: Food Category Sources
https://www.dietaryguidelines.gov/2020-advisory-committee-report/data-analysis
Figure 10. 1: Males and Females- Distribution of milk intake (percentages) across major categories
100
90
80
70
60
50
40
30
20
10
0 2+
DAIRY
MIXED DISHES
2-5 years 6-11 years 12-19 years 20-40 years 41-50 years 51-70 years
PROTEIN FOODS
GRAINS
71+
SNACKS AND SWEETS FRUITS+FRUIT JUICE
VEGETABLES BEVERAGES (Not incl. Milk and 100% Fruit Juice)
CONDIMENTS, GRAVIES, SPREADS, SALAD DRESSINGS
%
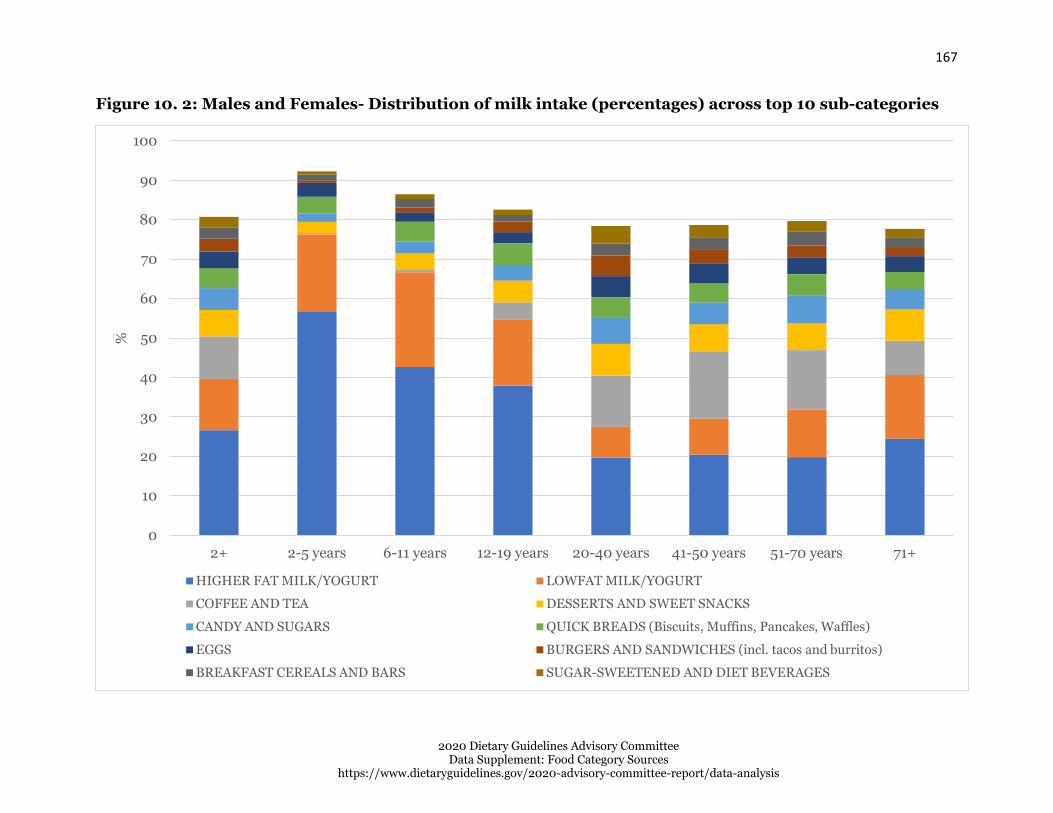
167
2020 Dietary Guidelines Advisory Committee Data Supplement: Food Category Sources
https://www.dietaryguidelines.gov/2020-advisory-committee-report/data-analysis
Figure 10. 2: Males and Females- Distribution of milk intake (percentages) across top 10 sub-categories
100
90
80
70
60
50
40
30
20
10
0 2+ 2-5 years 6-11 years 12-19 years 20-40 years 41-50 years 51-70 years 71+
HIGHER FAT MILK/YOGURT LOWFAT MILK/YOGURT
COFFEE AND TEA DESSERTS AND SWEET SNACKS
CANDY AND SUGARS QUICK BREADS (Biscuits, Muffins, Pancakes, Waffles)
EGGS BURGERS AND SANDWICHES (incl. tacos and burritos)
BREAKFAST CEREALS AND BARS SUGAR-SWEETENED AND DIET BEVERAGES
%

168
2020 Dietary Guidelines Advisory Committee Data Supplement: Food Category Sources
https://www.dietaryguidelines.gov/2020-advisory-committee-report/data-analysis
100
90
80
70
60
50
40
30
20
10
0
Figure 10. 3: Males - Distribution of milk intake (percentages) across major categories
71+ 12-19 years 20-40 years 41-50 years 51-70 years6-11 years 2-5 years 2+
DAIRY
MIXED DISHES
PROTEIN FOODS
GRAINS
FRUITS+FRUIT JUICE
BEVERAGES (Not incl. Milk and 100% Fruit Juice)
SNACKS AND SWEETS
VEGETABLES
CONDIMENTS, GRAVIES, SPREADS, SALAD DRESSINGS
%

169
2020 Dietary Guidelines Advisory Committee Data Supplement: Food Category Sources
https://www.dietaryguidelines.gov/2020-advisory-committee-report/data-analysis
Figure 10. 4: Males - Distribution of milk intake (percentages) across top 10 sub-categories
100
90
80
70
60
50
40
30
20
10
0
2+ 2-5 years 6-11 years 12-19 years 20-40 years 41-50 years 51-70 years 71+
HIGHER FAT MILK/YOGURT LOWFAT MILK/YOGURT
COFFEE AND TEA DESSERTS AND SWEET SNACKS
QUICK BREADS (Biscuits, Muffins, Pancakes, Waffles) CANDY AND SUGARS
EGGS BURGERS AND SANDWICHES (incl. tacos and burritos)
SUGAR-SWEETENED AND DIET BEVERAGES BREAKFAST CEREALS AND BARS
%

170
2020 Dietary Guidelines Advisory Committee Data Supplement: Food Category Sources
https://www.dietaryguidelines.gov/2020-advisory-committee-report/data-analysis
Figure 10. 5: Females- Distribution of milk intake (percentages) across major categories
100
90
80
70
60
50
40
30
20
10
0 2+
DAIRY
MIXED DISHES
2-5 years 6-11 years 12-19 years 20-40 years 41-50 years 51-70 years
PROTEIN FOODS
GRAINS
71+
SNACKS AND SWEETS FRUITS+FRUIT JUICE
VEGETABLES BEVERAGES (Not incl. Milk and 100% Fruit Juice)
CONDIMENTS, GRAVIES, SPREADS, SALAD DRESSINGS
%

171
2020 Dietary Guidelines Advisory Committee Data Supplement: Food Category Sources
https://www.dietaryguidelines.gov/2020-advisory-committee-report/data-analysis
Figure 10. 6: Females- Distribution of milk intake (percentages) across top 10 sub-categories
100
90
80
70
60
50
40
30
20
10
0 2+ 2-5 years 6-11 years 12-19 years 20-40 years 41-50 years 51-70 years 71+
HIGHER FAT MILK/YOGURT LOWFAT MILK/YOGURT
COFFEE AND TEA DESSERTS AND SWEET SNACKS
CANDY AND SUGARS QUICK BREADS (Biscuits, Muffins, Pancakes, Waffles)
EGGS BURGERS AND SANDWICHES (incl. tacos and burritos)
BREAKFAST CEREALS AND BARS SUGAR-SWEETENED AND DIET BEVERAGES
%
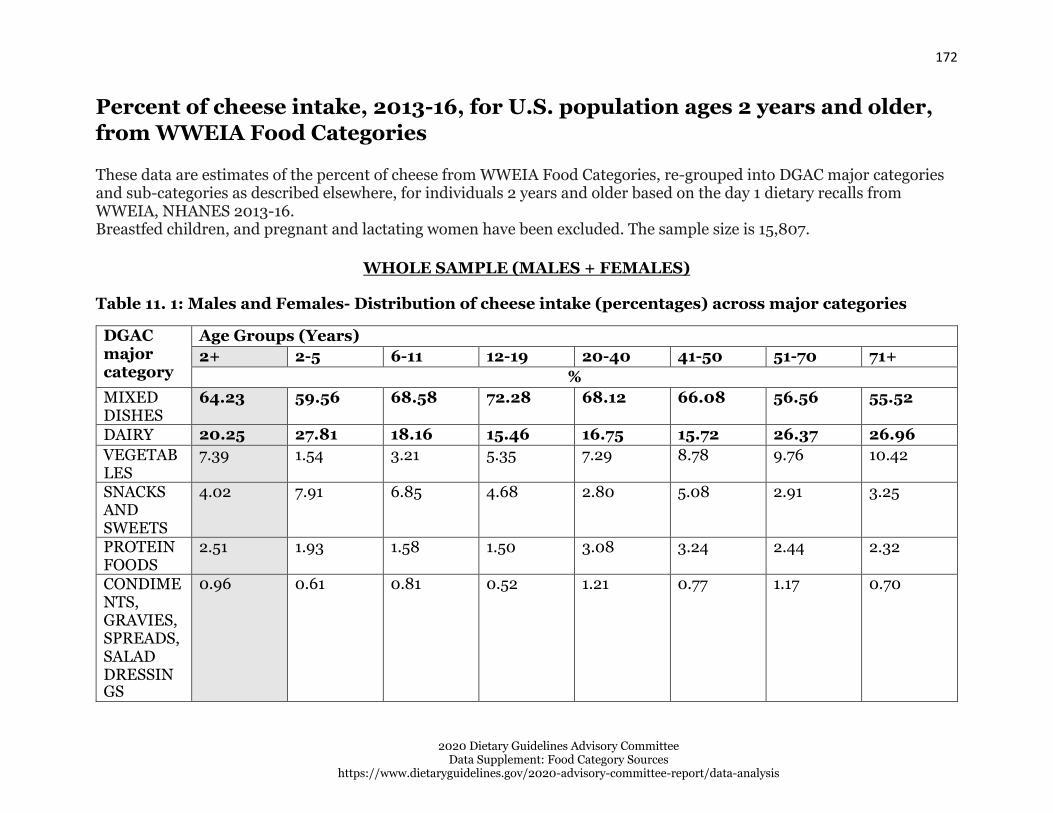
172
2020 Dietary Guidelines Advisory Committee Data Supplement: Food Category Sources
https://www.dietaryguidelines.gov/2020-advisory-committee-report/data-analysis
Percent of cheese intake, 2013-16, for U.S. population ages 2 years and older,
from WWEIA Food Categories
These data are estimates of the percent of cheese from WWEIA Food Categories, re-grouped into DGAC major categories and sub-categories as described elsewhere, for individuals 2 years and older based on the day 1 dietary recalls from WWEIA, NHANES 2013-16. Breastfed children, and pregnant and lactating women have been excluded. The sample size is 15,807.
WHOLE SAMPLE (MALES + FEMALES)
Table 11. 1: Males and Females- Distribution of cheese intake (percentages) across major categories
DGAC major category
Age Groups (Years)
2+ 2-5 6-11 12-19 20-40 41-50 51-70 71+
%
MIXED DISHES
64.23 59.56 68.58 72.28 68.12 66.08 56.56 55.52
DAIRY 20.25 27.81 18.16 15.46 16.75 15.72 26.37 26.96
VEGETAB LES
7.39 1.54 3.21 5.35 7.29 8.78 9.76 10.42
SNACKS AND SWEETS
4.02 7.91 6.85 4.68 2.80 5.08 2.91 3.25
PROTEIN FOODS
2.51 1.93 1.58 1.50 3.08 3.24 2.44 2.32
CONDIME NTS, GRAVIES, SPREADS, SALAD DRESSIN GS
0.96 0.61 0.81 0.52 1.21 0.77 1.17 0.70
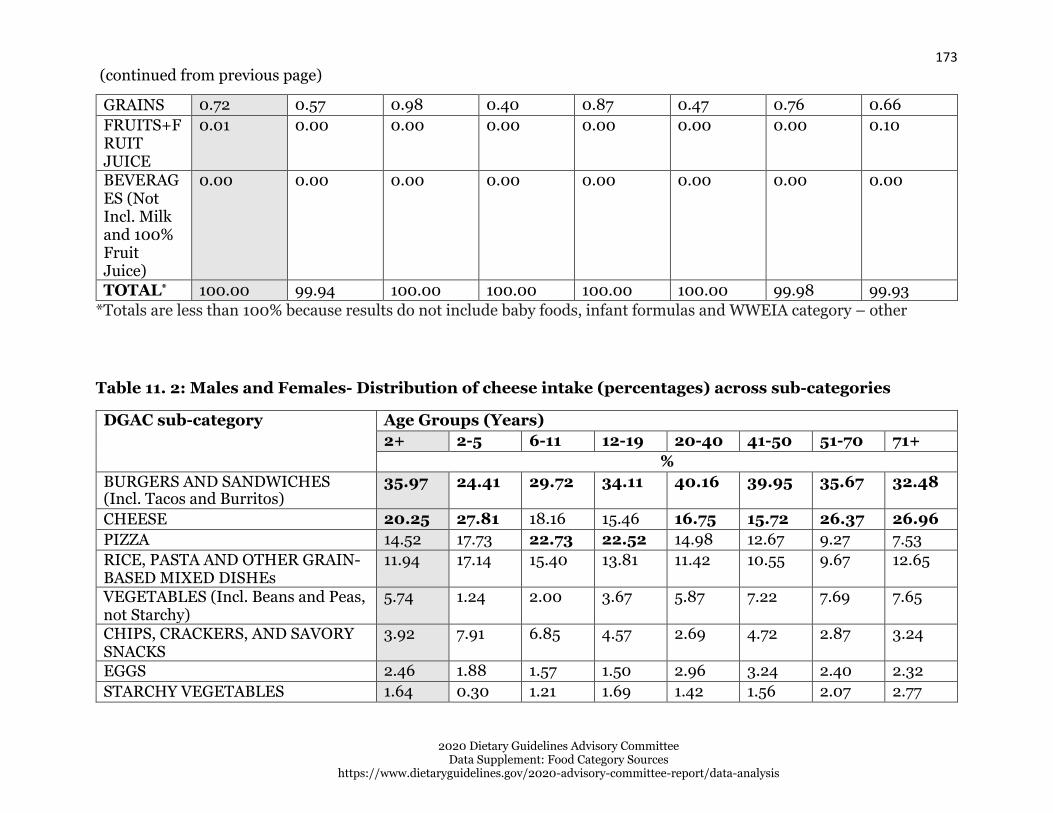
173
2020 Dietary Guidelines Advisory Committee Data Supplement: Food Category Sources
https://www.dietaryguidelines.gov/2020-advisory-committee-report/data-analysis
GRAINS 0.72 0.57 0.98 0.40 0.87 0.47 0.76 0.66
FRUITS+F RUIT JUICE
0.01 0.00 0.00 0.00 0.00 0.00 0.00 0.10
BEVERAG ES (Not Incl. Milk and 100% Fruit Juice)
0.00 0.00 0.00 0.00 0.00 0.00 0.00 0.00
TOTAL* 100.00 99.94 100.00 100.00 100.00 100.00 99.98 99.93
*Totals are less than 100% because results do not include baby foods, infant formulas and WWEIA category – other
Table 11. 2: Males and Females- Distribution of cheese intake (percentages) across sub-categories
DGAC sub-category Age Groups (Years)
2+ 2-5 6-11 12-19 20-40 41-50 51-70 71+
%
BURGERS AND SANDWICHES (Incl. Tacos and Burritos)
35.97 24.41 29.72 34.11 40.16 39.95 35.67 32.48
CHEESE 20.25 27.81 18.16 15.46 16.75 15.72 26.37 26.96
PIZZA 14.52 17.73 22.73 22.52 14.98 12.67 9.27 7.53
RICE, PASTA AND OTHER GRAIN- BASED MIXED DISHEs
11.94 17.14 15.40 13.81 11.42 10.55 9.67 12.65
VEGETABLES (Incl. Beans and Peas, not Starchy)
5.74 1.24 2.00 3.67 5.87 7.22 7.69 7.65
CHIPS, CRACKERS, AND SAVORY SNACKS
3.92 7.91 6.85 4.57 2.69 4.72 2.87 3.24
EGGS 2.46 1.88 1.57 1.50 2.96 3.24 2.40 2.32
STARCHY VEGETABLES 1.64 0.30 1.21 1.69 1.42 1.56 2.07 2.77
(continued from previous page)

174
2020 Dietary Guidelines Advisory Committee Data Supplement: Food Category Sources
https://www.dietaryguidelines.gov/2020-advisory-committee-report/data-analysis
MEAT, POULTRY, SEAFOOD MIXED DISHES
1.26 0.23 0.47 1.42 0.89 2.33 1.41 1.87
CONDIMENTS AND GRAVIES 0.83 0.61 0.79 0.51 1.14 0.69 0.79 0.69
YEAST BREADS AND TORTILLAS 0.55 0.55 0.86 0.34 0.71 0.37 0.51 0.31
SOUPS 0.55 0.04 0.25 0.41 0.67 0.58 0.53 0.99
SALAD DRESSINGS 0.13 0.00 0.02 0.01 0.07 0.08 0.39 0.01
DESSERTS AND SWEET SNACKS 0.10 0.00 0.00 0.11 0.11 0.36 0.05 0.02
QUICK BREADS (Biscuits, Muffins, Pancakes, Waffles)
0.10 0.01 0.02 0.05 0.02 0.08 0.20 0.34
BREAKFAST CEREALS AND BARS 0.06 0.01 0.10 0.01 0.14 0.02 0.04 0.00
DELI/CURED PRODUCTS (Meat and Poultry)
0.05 0.05 0.00 0.00 0.12 0.00 0.04 0.00
FRUIT (Non-Juice) 0.01 0.00 0.00 0.00 0.00 0.00 0.00 0.10
ALCOHOLIC BEVERAGES 0.00 0.00 0.00 0.00 0.00 0.00 0.00 0.00
CANDY AND SUGARS 0.00 0.00 0.00 0.00 0.00 0.00 0.00 0.00
COFFEE AND TEA 0.00 0.00 0.00 0.00 0.00 0.00 0.00 0.00
HIGHER FAT MILK/YOGURT 0.00 0.00 0.00 0.00 0.00 0.00 0.00 0.00
100% FRUIT JUICE 0.00 0.00 0.00 0.00 0.00 0.00 0.00 0.00
LOW-FAT MILK/YOGURT 0.00 0.00 0.00 0.00 0.00 0.00 0.00 0.00
MEATS (Not Incl. Deli and Mixed Dishes)
0.00 0.00 0.00 0.00 0.00 0.00 0.00 0.00
NUTS, SEEDS, AND SOY 0.00 0.00 0.00 0.00 0.00 0.00 0.00 0.00
POULTRY (Not Incl. Deli and Mixed Dishes)
0.00 0.00 0.00 0.00 0.00 0.00 0.00 0.00
RICE AND PASTA 0.00 0.00 0.00 0.00 0.00 0.00 0.00 0.00
SEAFOOD (Not Incl. Mixed Dishes) 0.00 0.00 0.00 0.00 0.00 0.00 0.00 0.00
SPREADS 0.00 0.00 0.00 0.00 0.00 0.00 0.00 0.00
SUGAR-SWEETENED AND DIET BEVERAGES
0.00 0.00 0.00 0.00 0.00 0.00 0.00 0.00
WATERS 0.00 0.00 0.00 0.00 0.00 0.00 0.00 0.00
TOTAL* 100.00 99.94 100.00 100.00 100.00 100.00 99.98 99.93
*Totals are less than 100% because results do not include baby foods, infant formulas and WWEIA category – other
(continued from previous page)

176
2020 Dietary Guidelines Advisory Committee Data Supplement: Food Category Sources
https://www.dietaryguidelines.gov/2020-advisory-committee-report/data-analysis
MALES
Table 11. 3: Males - Distribution of cheese intake (percentages) across major categories
DGAC major category Age Groups (Years)
2+ 2-5 6-11 12-19 20-40 41-50 51-70 71+
%
MIXED DISHES 68.99 62.65 70.83 77.68 73.90 69.83 61.86 59.48
DAIRY 17.74 24.98 17.34 12.81 14.61 13.85 23.36 21.76
VEGETABLES 5.61 2.03 3.30 3.33 4.82 7.96 7.25 10.51
SNACKS AND SWEETS 3.76 7.52 5.64 4.13 1.86 4.29 3.55 3.56
PROTEIN FOODS 2.57 1.61 1.35 1.33 3.16 3.53 2.55 3.21
GRAINS 0.72 0.68 0.90 0.34 1.05 0.36 0.60 0.68
CONDIMENTS, GRAVIES, SPREADS, SALAD DRESSINGS
0.56 0.63 0.55 0.44 0.61 0.25 0.82 0.25
FRUITS+FRUIT JUICE 0.00 0.00 0.00 0.00 0.00 0.00 0.00 0.02
BEVERAGES (Not Incl. Milk and 100% Fruit Juice)
0.00 0.00 0.00 0.00 0.00 0.00 0.00 0.00
TOTAL* 99.96 100.00 99.91 100.00 100.00 100.00 99.99 99.49 *Totals are less than 100% because results do not include baby foods, infant formulas and WWEIA category – other

177
2020 Dietary Guidelines Advisory Committee Data Supplement: Food Category Sources
https://www.dietaryguidelines.gov/2020-advisory-committee-report/data-analysis
Table 11. 4: Males - Distribution of cheese intake (percentages) across sub-categories
DGAC sub-category Age Groups (Years)
2+ 2-5 6-11 12-19 20-40 41-50 51-70 71+
%
BURGERS AND SANDWICHES (Incl. Tacos and Burritos)
40.23 26.95 30.40 38.99 45.27 46.39 40.89 36.72
CHEESE 17.74 24.98 17.34 12.81 14.61 13.85 23.36 21.76
PIZZA 15.39 19.41 24.83 23.49 15.97 11.01 10.39 6.04
RICE, PASTA AND OTHER GRAIN- BASED MIXED DISHES
11.76 16.02 14.81 13.01 11.27 10.33 9.01 13.66
VEGETABLES (Incl. Beans and Peas, not Starchy)
4.14 1.68 1.74 2.10 3.45 7.03 5.45 7.49
CHIPS, CRACKERS, AND SAVORY SNACKS
3.66 7.52 5.64 4.02 1.76 3.91 3.51 3.53
EGGS 2.48 1.53 1.35 1.33 2.93 3.53 2.47 3.21
STARCHY VEGETABLES 1.47 0.36 1.56 1.22 1.37 0.93 1.81 3.02
MEAT, POULTRY, SEAFOOD MIXED DISHES
0.99 0.18 0.32 1.74 0.55 1.13 1.22 2.17
YEAST BREADS AND TORTILLAS 0.64 0.67 0.88 0.34 0.89 0.36 0.59 0.26
SOUPS 0.62 0.08 0.47 0.46 0.84 0.97 0.35 0.90
CONDIMENTS AND GRAVIES 0.51 0.63 0.51 0.44 0.61 0.10 0.72 0.22

178
2020 Dietary Guidelines Advisory Committee Data Supplement: Food Category Sources
https://www.dietaryguidelines.gov/2020-advisory-committee-report/data-analysis
DESSERTS AND SWEET SNACKS 0.10 0.00 0.00 0.12 0.10 0.39 0.04 0.03
DELI/CURED PRODUCTS (Meat and Poultry)
0.09 0.07 0.00 0.00 0.23 0.00 0.08 0.00
BREAKFAST CEREALS AND BARS 0.05 0.00 0.02 0.00 0.16 0.00 0.00 0.00
SALAD DRESSINGS 0.05 0.00 0.04 0.00 0.00 0.16 0.10 0.03
QUICK BREADS (Biscuits, Muffins, Pancakes, Waffles)
0.03 0.01 0.00 0.01 0.00 0.00 0.01 0.42
FRUIT (Non-Juice) 0.00 0.00 0.00 0.00 0.00 0.00 0.00 0.02
ALCOHOLIC BEVERAGES 0.00 0.00 0.00 0.00 0.00 0.00 0.00 0.00
CANDY AND SUGARS 0.00 0.00 0.00 0.00 0.00 0.00 0.00 0.00
COFFEE AND TEA 0.00 0.00 0.00 0.00 0.00 0.00 0.00 0.00
HIGHER FAT MILK/YOGURT 0.00 0.00 0.00 0.00 0.00 0.00 0.00 0.00
100% FRUIT JUICE 0.00 0.00 0.00 0.00 0.00 0.00 0.00 0.00
LOW-FAT MILK/YOGURT 0.00 0.00 0.00 0.00 0.00 0.00 0.00 0.00
MEATS (Not Incl. Deli and Mixed Dishes)
0.00 0.00 0.00 0.00 0.00 0.00 0.00 0.00
NUTS, SEEDS, AND SOY 0.00 0.00 0.00 0.00 0.00 0.00 0.00 0.00
POULTRY (Not Incl. Deli and Mixed Dishes)
0.00 0.00 0.00 0.00 0.00 0.00 0.00 0.00
RICE AND PASTA 0.00 0.00 0.00 0.00 0.00 0.00 0.00 0.00
SEAFOOD (Not Incl. Mixed Dishes) 0.00 0.00 0.00 0.00 0.00 0.00 0.00 0.00
SPREADS 0.00 0.00 0.00 0.00 0.00 0.00 0.00 0.00
SUGAR-SWEETENED AND DIET BEVERAGES
0.00 0.00 0.00 0.00 0.00 0.00 0.00 0.00
WATERS 0.00 0.00 0.00 0.00 0.00 0.00 0.00 0.00
TOTAL* 99.96 100.00 99.91 100.00 100.00 100.00 99.99 99.49 *Totals are less than 100% because results do not include baby foods, infant formulas and WWEIA category – other
(continued from previous page)

179
2020 Dietary Guidelines Advisory Committee Data Supplement: Food Category Sources
https://www.dietaryguidelines.gov/2020-advisory-committee-report/data-analysis
FEMALES
Table 11. 5: Females - Distribution of cheese intake (percentages) across major categories
DGAC major category Age Groups (Years)
2+ 2-5 6-11 12-19 20-40 41-50 51-70 71+
%
MIXED DISHES 59.16 56.68 65.97 66.79 61.59 62.66 51.82 52.35
DAIRY 22.98 30.46 19.12 18.16 19.18 17.42 29.07 31.10
VEGETABLES 9.05 1.07 3.11 7.42 10.08 9.53 12.01 10.35
SNACKS AND SWEETS 4.49 8.28 8.27 5.24 3.86 5.80 2.34 3.01
PROTEIN FOODS 2.41 2.24 1.84 1.67 2.99 2.98 2.34 1.62
CONDIMENTS, GRAVIES, SPREADS, SALAD DRESSINGS
1.33 0.60 1.12 0.59 1.89 1.24 1.48 1.06
GRAINS 0.71 0.48 1.07 0.46 0.67 0.58 0.89 0.63
FRUITS+FRUIT JUICE 0.01 0.00 0.00 0.00 0.00 0.00 0.01 0.16
BEVERAGES (Not Incl. Milk and 100% Fruit Juice)
0.00 0.00 0.00 0.00 0.00 0.00 0.00 0.00
TOTAL* 100.00 99.80 100.00 100.00 100.00 100.00 99.96 100.28
*Totals are less than 100% because results do not include baby foods, infant formulas and WWEIA category –other

180
2020 Dietary Guidelines Advisory Committee Data Supplement: Food Category Sources
https://www.dietaryguidelines.gov/2020-advisory-committee-report/data-analysis
Table 11. 6: Females - Distribution of cheese intake (percentages) across sub-categories
DGAC sub-category Age Groups (Years)
2+ 2-5 6-11 12-19 20-40 41-50 51-70 71+
%
BURGERS AND SANDWICHES (Incl. Tacos and Burritos)
31.12 22.04 28.94 29.15 34.38 34.07 31.00 29.10
CHEESE 22.98 30.46 19.12 18.16 19.18 17.42 29.07 31.10
PIZZA 13.64 16.17 20.29 21.54 13.86 14.19 8.27 8.72
RICE, PASTA AND OTHER GRAIN- BASED MIXED DISHES
12.40 18.19 16.09 14.63 11.60 10.75 10.26 11.84
VEGETABLES (Incl. Beans and Peas, not Starchy)
7.22 0.83 2.30 5.26 8.61 7.40 9.70 7.78
CHIPS, CRACKERS, AND SAVORY SNACKS
4.39 8.28 8.27 5.13 3.74 5.46 2.29 3.01
EGGS 2.41 2.21 1.83 1.67 2.99 2.98 2.34 1.62
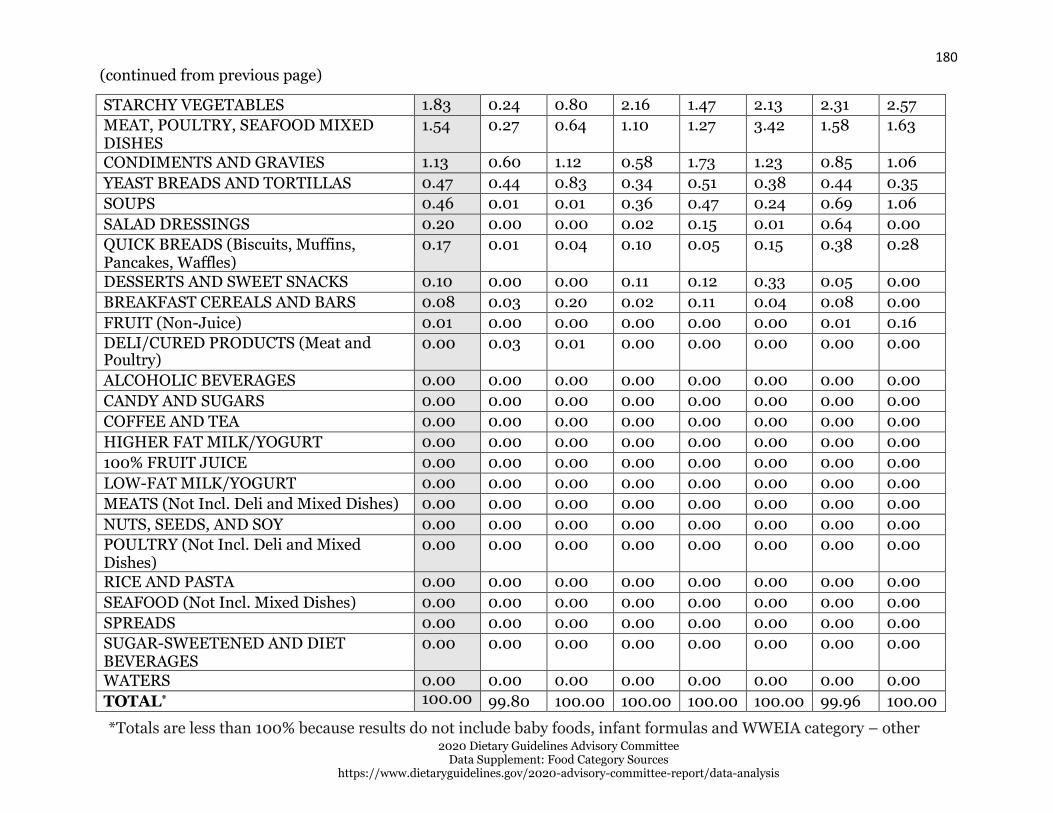
180
2020 Dietary Guidelines Advisory Committee Data Supplement: Food Category Sources
https://www.dietaryguidelines.gov/2020-advisory-committee-report/data-analysis
STARCHY VEGETABLES 1.83 0.24 0.80 2.16 1.47 2.13 2.31 2.57
MEAT, POULTRY, SEAFOOD MIXED DISHES
1.54 0.27 0.64 1.10 1.27 3.42 1.58 1.63
CONDIMENTS AND GRAVIES 1.13 0.60 1.12 0.58 1.73 1.23 0.85 1.06
YEAST BREADS AND TORTILLAS 0.47 0.44 0.83 0.34 0.51 0.38 0.44 0.35
SOUPS 0.46 0.01 0.01 0.36 0.47 0.24 0.69 1.06
SALAD DRESSINGS 0.20 0.00 0.00 0.02 0.15 0.01 0.64 0.00
QUICK BREADS (Biscuits, Muffins, Pancakes, Waffles)
0.17 0.01 0.04 0.10 0.05 0.15 0.38 0.28
DESSERTS AND SWEET SNACKS 0.10 0.00 0.00 0.11 0.12 0.33 0.05 0.00
BREAKFAST CEREALS AND BARS 0.08 0.03 0.20 0.02 0.11 0.04 0.08 0.00
FRUIT (Non-Juice) 0.01 0.00 0.00 0.00 0.00 0.00 0.01 0.16
DELI/CURED PRODUCTS (Meat and Poultry)
0.00 0.03 0.01 0.00 0.00 0.00 0.00 0.00
ALCOHOLIC BEVERAGES 0.00 0.00 0.00 0.00 0.00 0.00 0.00 0.00
CANDY AND SUGARS 0.00 0.00 0.00 0.00 0.00 0.00 0.00 0.00
COFFEE AND TEA 0.00 0.00 0.00 0.00 0.00 0.00 0.00 0.00
HIGHER FAT MILK/YOGURT 0.00 0.00 0.00 0.00 0.00 0.00 0.00 0.00
100% FRUIT JUICE 0.00 0.00 0.00 0.00 0.00 0.00 0.00 0.00
LOW-FAT MILK/YOGURT 0.00 0.00 0.00 0.00 0.00 0.00 0.00 0.00
MEATS (Not Incl. Deli and Mixed Dishes) 0.00 0.00 0.00 0.00 0.00 0.00 0.00 0.00
NUTS, SEEDS, AND SOY 0.00 0.00 0.00 0.00 0.00 0.00 0.00 0.00
POULTRY (Not Incl. Deli and Mixed Dishes)
0.00 0.00 0.00 0.00 0.00 0.00 0.00 0.00
RICE AND PASTA 0.00 0.00 0.00 0.00 0.00 0.00 0.00 0.00
SEAFOOD (Not Incl. Mixed Dishes) 0.00 0.00 0.00 0.00 0.00 0.00 0.00 0.00
SPREADS 0.00 0.00 0.00 0.00 0.00 0.00 0.00 0.00
SUGAR-SWEETENED AND DIET BEVERAGES
0.00 0.00 0.00 0.00 0.00 0.00 0.00 0.00
WATERS 0.00 0.00 0.00 0.00 0.00 0.00 0.00 0.00
TOTAL* 100.00 99.80 100.00 100.00 100.00 100.00 99.96 100.00
(continued from previous page)
*Totals are less than 100% because results do not include baby foods, infant formulas and WWEIA category – other

181
2020 Dietary Guidelines Advisory Committee Data Supplement: Food Category Sources
https://www.dietaryguidelines.gov/2020-advisory-committee-report/data-analysis
Figure 11. 1: Males and Females - Distribution of cheese intake (percentages) across major categories
100
90
80
70
60
50
40
30
20
10
0
2+
DAIRY
MIXED DISHES
2-5 years 6-11 years 12-19 years 20-40 years 41-50 years 51-70 years
PROTEIN FOODS
GRAINS
71+
SNACKS AND SWEETS FRUITS+FRUIT JUICE
VEGETABLES BEVERAGES (Not incl. Milk and 100% Fruit Juice)
CONDIMENTS, GRAVIES, SPREADS, SALAD DRESSINGS
%

183
2020 Dietary Guidelines Advisory Committee Data Supplement: Food Category Sources
https://www.dietaryguidelines.gov/2020-advisory-committee-report/data-analysis
Figure 11. 2: Males and Females - Distribution of cheese intake (percentages) across top 10 sub-categories
100
90
80
70
60
50
40
30
20
10
0 2+ 2-5 years 6-11 years 12-19 years 20-40 years 41-50 years 51-70 years 71+
BURGERS AND SANDWICHES (incl. tacos and burritos) CHEESE
PIZZA RICE, PASTA AND OTHER GRAIN-BASED MIXED DISHEs
VEGETABLES (Incl. Beans and Peas, not Starchy) CHIPS, CRACKERS, AND SAVORY SNACKS
EGGS STARCHY VEGETABLES
MEAT, POULTRY, SEAFOOD MIXED DISHES CONDIMENTS AND GRAVIES
%

184
2020 Dietary Guidelines Advisory Committee Data Supplement: Food Category Sources
https://www.dietaryguidelines.gov/2020-advisory-committee-report/data-analysis
Figure 11. 3: Males - Distribution of cheese intake (percentages) across major categories
100
90
80
70
60
50
40
30
20
10
0
2+
DAIRY
2-5 years 6-11 years 12-19 years 20-40 years 41-50 years 51-70 years
PROTEIN FOODS
71+
MIXED DISHES GRAINS
SNACKS AND SWEETS FRUITS+FRUIT JUICE
VEGETABLES BEVERAGES (Not incl. Milk and 100% Fruit Juice)
CONDIMENTS, GRAVIES, SPREADS, SALAD DRESSINGS
%

185
2020 Dietary Guidelines Advisory Committee Data Supplement: Food Category Sources
https://www.dietaryguidelines.gov/2020-advisory-committee-report/data-analysis
Figure 11. 4: Males - Distribution of cheese intake (percentages) across top 10 sub-categories
100
90
80
70
60
50
40
30
20
10
0 2+ 2-5 years 6-11 years 12-19 years 20-40 years 41-50 years 51-70 years 71+
BURGERS AND SANDWICHES (incl. tacos and burritos) CHEESE
PIZZA RICE, PASTA AND OTHER GRAIN-BASED MIXED DISHEs
VEGETABLES (Incl. Beans and Peas, not Starchy) CHIPS, CRACKERS, AND SAVORY SNACKS
EGGS STARCHY VEGETABLES
MEAT, POULTRY, SEAFOOD MIXED DISHES YEAST BREADS AND TORTILLAS
%

186
2020 Dietary Guidelines Advisory Committee Data Supplement: Food Category Sources
https://www.dietaryguidelines.gov/2020-advisory-committee-report/data-analysis
Figure 11. 5: Females - Distribution of cheese intake (percentages) across major categories
100
90
80
70
60
50
40
30
20
10
0 2+
DAIRY
2-5 years 6-11 years 12-19 years 20-40 years 41-50 years 51-70 years
PROTEIN FOODS
71+
MIXED DISHES GRAINS
SNACKS AND SWEETS FRUITS+FRUIT JUICE
VEGETABLES BEVERAGES (Not incl. Milk and 100% Fruit Juice)
CONDIMENTS, GRAVIES, SPREADS, SALAD DRESSINGS
%

187
2020 Dietary Guidelines Advisory Committee Data Supplement: Food Category Sources
https://www.dietaryguidelines.gov/2020-advisory-committee-report/data-analysis
BURGERS AND SANDWICHES (incl. tacos and burritos)
PIZZA
VEGETABLES (Incl. Beans and Peas, not Starchy)
EGGS
MEAT, POULTRY, SEAFOOD MIXED DISHES
CHEESE
RICE, PASTA AND OTHER GRAIN-BASED MIXED DISHEs
CHIPS, CRACKERS, AND SAVORY SNACKS
STARCHY VEGETABLES
CONDIMENTS AND GRAVIES
Figure 11. 6: Females - Distribution of cheese intake (percentages) across top 10 sub-categories
71+ 12-19 years 20-40 years 41-50 years 51-70 years6-11 years2-5 years2+
100
90
80
70
60
50
40
30
20
10
0
%

188
2020 Dietary Guidelines Advisory Committee Data Supplement: Food Category Sources
https://www.dietaryguidelines.gov/2020-advisory-committee-report/data-analysis
Percent of oils intake, 2013-16, for U.S. population ages 2 years and older,
from WWEIA Food Categories
These data are estimates of the percent of oils from WWEIA Food Categories, re-grouped into DGAC major categories and sub-categories as described elsewhere, for individuals 2 years and older based on the day 1 dietary recalls from WWEIA, NHANES 2013-16. Breastfed children, and pregnant and lactating women have been excluded. The sample size is 15,807.
WHOLE SAMPLE (MALES + FEMALES)
Table 12. 1: Males and Females - Distribution of oils intake (percentages) across major categories
DGAC major category
Age Groups (Years)
2+ 2-5 6-11 12-19 20-40 41-50 51-70 71+
%
MIXED DISHES
33.09 30.86 33.20 37.10 35.71 30.61 31.01 30.82
SNACKS AND SWEETS
19.35 30.74 26.87 23.23 17.22 18.14 17.35 15.22
VEGETAB LES
17.35 9.16 11.43 13.04 18.03 20.81 19.19 20.31
PROTEIN FOODS
15.82 15.18 13.03 12.55 15.41 17.23 17.69 16.66
GRAINS 9.10 11.09 11.94 10.27 8.18 7.86 8.82 9.41
CONDIME NTS, GRAVIES, SPREADS, SALAD DRESSIN GS
3.89 2.10 2.96 2.70 3.97 4.38 4.19 5.35

189
2020 Dietary Guidelines Advisory Committee Data Supplement: Food Category Sources
https://www.dietaryguidelines.gov/2020-advisory-committee-report/data-analysis
BEVERAG ES (Not Incl. Milk and 100% Fruit Juice)
0.77 0.22 0.04 0.13 0.90 0.61 1.00 1.71
DAIRY 0.49 0.49 0.47 0.95 0.44 0.24 0.55 0.29
FRUITS+F RUIT JUICE
0.10 0.09 0.05 0.00 0.12 0.08 0.12 0.22
TOTAL* 99.96 99.92 99.98 99.97 99.98 99.95 99.93 99.98
*Totals are less than 100% because results do not include baby foods, infant formulas and WWEIA category – other
Table 12. 2: Males and Females - Distribution of oils intake (percentages) across sub-categories
DGAC sub-category Age Groups (Years)
2+ 2-5 6-11 12-19 20-40 41-50 51-70 71+
%
BURGERS AND SANDWICHES (Incl. Tacos and Burritos)
17.09 15.73 16.39 19.45 18.73 15.05 15.85 16.98
CHIPS, CRACKERS, AND SAVORY SNACKS 14.44 23.11 21.19 18.86 13.41 13.63 11.91 9.46
VEGETABLES (Incl. Beans and Peas, not Starchy) 10.16 2.74 5.14 6.27 9.83 13.27 12.27 14.28
STARCHY VEGETABLES 7.19 6.41 6.29 6.78 8.21 7.54 6.92 6.03
RICE, PASTA AND OTHER GRAIN-BASED MIXED DISHES
6.91 7.78 7.19 6.88 7.50 7.43 6.32 5.35
NUTS, SEEDS, AND SOY 6.23 2.69 3.12 2.93 5.03 7.42 9.25 8.46
POULTRY (Not Incl. Deli and Mixed Dishes) 4.87 8.02 6.52 6.97 5.21 4.28 3.57 2.45
MEAT, POULTRY, SEAFOOD MIXED DISHES 4.19 2.55 3.05 3.24 4.14 4.26 5.12 4.69
DESSERTS AND SWEET SNACKS 3.95 7.12 4.61 3.32 2.93 3.62 4.34 4.88
PIZZA 3.80 3.91 5.71 6.80 4.31 2.56 2.49 2.19
(continued from previous page)

190
2020 Dietary Guidelines Advisory Committee Data Supplement: Food Category Sources
https://www.dietaryguidelines.gov/2020-advisory-committee-report/data-analysis
YEAST BREADS AND TORTILLAS 3.40 3.09 3.12 3.30 2.94 3.07 3.78 4.83
QUICK BREADS (Biscuits, Muffins, Pancakes, Waffles)
2.84 5.50 5.51 3.72 1.82 2.19 2.75 2.18
EGGS 2.52 2.68 1.90 1.44 3.06 3.00 2.20 2.88
BREAKFAST CEREALS AND BARS 1.96 1.71 2.30 2.51 2.39 1.58 1.51 1.57
SEAFOOD (Not Incl. Mixed Dishes) 1.90 1.25 1.19 1.02 1.94 2.37 2.18 2.41
SALAD DRESSINGS 1.42 1.30 1.47 1.42 1.57 1.37 1.39 1.14
CONDIMENTS AND GRAVIES 1.41 0.61 0.95 1.00 1.86 1.86 1.36 0.91
SOUPS 1.11 0.90 0.86 0.72 1.02 1.30 1.23 1.60
SPREADS 1.05 0.19 0.54 0.28 0.54 1.15 1.44 3.30
CANDY AND SUGARS 0.95 0.52 1.07 1.04 0.88 0.88 1.10 0.88
RICE AND PASTA 0.90 0.80 1.01 0.74 1.03 1.02 0.77 0.82
SUGAR-SWEETENED AND DIET BEVERAGES 0.67 0.22 0.03 0.11 0.80 0.54 0.76 1.67
MEATS (Not Incl. Deli and Mixed Dishes) 0.26 0.52 0.29 0.19 0.16 0.16 0.40 0.18
LOW-FAT MILK/YOGURT 0.24 0.42 0.10 0.15 0.24 0.19 0.31 0.24
CHEESE 0.23 0.06 0.38 0.79 0.20 0.04 0.18 0.04
FRUIT (Non-Juice) 0.10 0.09 0.05 0.00 0.12 0.08 0.10 0.22
COFFEE AND TEA 0.09 0.00 0.00 0.01 0.07 0.06 0.21 0.04
DELI/CURED PRODUCTS (Meat and Poultry) 0.05 0.02 0.02 0.00 0.01 0.01 0.08 0.27
HIGHER FAT MILK/YOGURT 0.02 0.01 0.00 0.00 0.00 0.01 0.06 0.01
WATERS 0.01 0.00 0.00 0.00 0.02 0.02 0.01 0.00
ALCOHOLIC BEVERAGES 0.01 0.00 0.00 0.00 0.00 0.00 0.02 0.00
100% FRUIT JUICE 0.00 0.00 0.00 0.00 0.00 0.00 0.02 0.00
TOTAL* 99.96 99.92 99.98 99.97 99.98 99.95 99.93 99.98
*Totals are less than 100% because results do not include baby foods, infant formulas and WWEIA category – other
(continued from previous page)

191
2020 Dietary Guidelines Advisory Committee Data Supplement: Food Category Sources
https://www.dietaryguidelines.gov/2020-advisory-committee-report/data-analysis
MALES
Table 12. 3: Males - Distribution of oils intake (percentages) across major categories
DGAC major category Age Groups (Years)
2+ 2-5 6-11 12-19 20-40 41-50 51-70 71+
%
MIXED DISHES 35.74 30.98 36.02 40.15 40.24 32.94 32.35 31.29
SNACKS AND SWEETS 19.45 32.59 26.86 23.11 16.50 17.76 17.77 15.14
VEGETABLES 15.95 8.61 10.64 11.70 15.48 19.97 18.39 21.37
PROTEIN FOODS 15.44 12.47 12.29 12.29 15.24 17.46 17.28 18.08
GRAINS 8.69 12.17 10.80 9.97 7.65 7.34 8.71 7.85
CONDIMENTS, GRAVIES, SPREADS, SALAD DRESSINGS
3.54 2.18 2.80 2.02 3.60 3.87 4.21 4.84
BEVERAGES (Not Incl. Milk and 100% Fruit Juice)
0.62 0.35 0.03 0.13 0.82 0.39 0.83 1.16
DAIRY 0.38 0.59 0.49 0.62 0.33 0.21 0.36 0.13
FRUITS+FRUIT JUICE 0.07 0.03 0.05 0.00 0.10 0.05 0.07 0.12
TOTAL* 99.87 99.97 99.99 100.00 99.97 99.99 99.96 99.99
*Totals are less than 100% because results do not include baby foods, infant formulas and WWEIA category – other

192
2020 Dietary Guidelines Advisory Committee Data Supplement: Food Category Sources
https://www.dietaryguidelines.gov/2020-advisory-committee-report/data-analysis
Table 12. 4: Males - Distribution of oils intake (percentages) across sub-categories
DGAC sub-category Age Groups (Years)
2+ 2-5 6-11 12-19 20-40 41-50 51-70 71+
%
BURGERS AND SANDWICHES (Incl. Tacos and Burritos)
19.26 17.18 18.18 21.35 21.79 17.00 17.94 19.05
CHIPS, CRACKERS, AND SAVORY SNACKS 14.89 24.61 21.74 18.38 13.27 13.28 12.68 10.15
VEGETABLES (Incl. Beans and Peas, not Starchy)
8.38 1.96 4.35 5.06 7.07 11.47 10.87 14.72
STARCHY VEGETABLES 7.56 6.65 6.29 6.65 8.41 8.50 7.52 6.65
RICE, PASTA AND OTHER GRAIN-BASED MIXED DISHES
7.00 6.94 7.12 6.20 7.82 8.10 6.21 5.12
NUTS, SEEDS, AND SOY 5.73 1.68 2.86 2.43 4.41 7.41 9.12 8.78
POULTRY (Not Incl. Deli and Mixed Dishes) 5.24 6.47 6.58 7.29 5.90 4.66 3.79 2.94
MEAT, POULTRY, SEAFOOD MIXED DISHES
4.30 2.04 3.38 4.35 4.74 3.96 4.54 4.49

193
2020 Dietary Guidelines Advisory Committee Data Supplement: Food Category Sources
https://www.dietaryguidelines.gov/2020-advisory-committee-report/data-analysis
PIZZA 4.25 4.10 6.48 7.54 5.13 2.61 2.75 1.31
DESSERTS AND SWEET SNACKS 3.64 7.51 3.96 3.55 2.49 3.41 4.06 4.16
YEAST BREADS AND TORTILLAS 3.29 3.77 2.68 3.12 2.98 2.85 3.83 4.05
QUICK BREADS (Biscuits, Muffins, Pancakes, Waffles)
2.79 6.10 5.30 4.13 1.45 1.96 2.75 2.07
EGGS 2.44 2.90 1.50 1.46 2.97 2.66 1.98 3.56
BREAKFAST CEREALS AND BARS 1.82 1.48 2.23 2.04 2.43 1.45 1.34 1.24
SEAFOOD (Not Incl. Mixed Dishes) 1.74 1.30 1.03 0.92 1.80 2.61 1.84 2.32
CONDIMENTS AND GRAVIES 1.39 0.58 0.85 0.77 1.80 1.85 1.43 1.01
SALAD DRESSINGS 1.20 1.37 1.34 1.01 1.26 1.17 1.38 0.55
SPREADS 0.96 0.23 0.60 0.24 0.54 0.85 1.40 3.28
SOUPS 0.92 0.72 0.86 0.72 0.76 1.27 0.91 1.32
CANDY AND SUGARS 0.92 0.47 1.17 1.18 0.75 1.07 1.03 0.84
RICE AND PASTA 0.78 0.82 0.59 0.67 0.79 1.07 0.79 0.50
SUGAR-SWEETENED AND DIET BEVERAGES
0.57 0.35 0.03 0.12 0.79 0.36 0.69 1.16
MEATS (Not Incl. Deli and Mixed Dishes) 0.23 0.10 0.31 0.20 0.16 0.11 0.48 0.03
LOW-FAT MILK/YOGURT 0.18 0.54 0.06 0.19 0.11 0.13 0.23 0.09
CHEESE 0.17 0.03 0.43 0.43 0.22 0.05 0.06 0.01
FRUIT (Non-Juice) 0.06 0.03 0.05 0.00 0.10 0.05 0.04 0.12
DELI/CURED PRODUCTS (Meat and Poultry)
0.06 0.03 0.01 0.00 0.01 0.00 0.07 0.44
COFFEE AND TEA 0.04 0.00 0.00 0.01 0.03 0.03 0.09 0.00
HIGHER FAT MILK/YOGURT 0.02 0.02 0.00 0.00 0.00 0.02 0.07 0.02
ALCOHOLIC BEVERAGES 0.01 0.00 0.00 0.00 0.00 0.00 0.04 0.00
100% FRUIT JUICE 0.01 0.00 0.00 0.00 0.00 0.00 0.03 0.00
WATERS 0.00 0.00 0.00 0.00 0.00 0.00 0.00 0.00
TOTAL* 99.87 99.97 99.99 100.00 99.97 99.99 99.96 99.99
*Totals are less than 100% because results do not include baby foods, infant formulas and WWEIA category – other
(continued from previous page)

194
2020 Dietary Guidelines Advisory Committee Data Supplement: Food Category Sources
https://www.dietaryguidelines.gov/2020-advisory-committee-report/data-analysis
FEMALES
Table 12. 5: Females - Distribution of oils intake (percentages) across major categories
DGAC major category Age Groups (Years)
2+ 2-5 6-11 12-19 20-40 41-50 51-70 71+
%
MIXED DISHES 30.32 30.75 29.98 33.99 30.60 28.50 29.80 30.44
SNACKS AND SWEETS 19.47 29.04 26.87 23.35 18.02 18.47 16.97 15.28
VEGETABLES 18.54 9.66 12.33 14.41 20.91 21.58 19.92 19.46
PROTEIN FOODS 16.09 17.68 13.88 12.82 15.60 17.03 18.06 15.53
GRAINS 9.52 10.10 13.24 10.58 8.78 8.32 8.92 10.65
CONDIMENTS, GRAVIES, SPREADS, SALAD DRESSINGS
4.17 2.02 3.15 3.39 4.39 4.83 4.18 5.76
BEVERAGES (Not Incl. Milk and 100% Fruit Juice)
0.90 0.09 0.04 0.12 0.98 0.81 1.16 2.14
DAIRY 0.63 0.40 0.45 1.28 0.57 0.27 0.72 0.42
FRUITS+FRUIT JUICE 0.13 0.14 0.05 0.00 0.14 0.10 0.16 0.30
TOTAL* 99.79 99.87 99.97 99.94 99.99 99.91 99.89 99.98 *Totals are less than 100% because results do not include baby foods, infant formulas and WWEIA category – other

195
2020 Dietary Guidelines Advisory Committee Data Supplement: Food Category Sources
https://www.dietaryguidelines.gov/2020-advisory-committee-report/data-analysis
Table 12. 6: Females - Distribution of oils intake (percentages) across sub-categories
DGAC sub-category Age Groups (Years)
2+ 2-5 6-11 12-19 20-40 41-50 51-70 71+
%
BURGERS AND SANDWICHES (Incl. Tacos and Burritos)
14.70 14.38 14.35 17.52 15.29 13.29 13.96 15.34
CHIPS, CRACKERS, AND SAVORY SNACKS 14.21 21.72 20.56 19.35 13.57 13.96 11.22 8.91
VEGETABLES (Incl. Beans and Peas, not Starchy)
11.75 3.46 6.04 7.50 12.93 14.91 13.54 13.93
RICE, PASTA AND OTHER GRAIN-BASED MIXED DISHES
6.90 8.55 7.27 7.57 7.13 6.82 6.41 5.53
STARCHY VEGETABLES 6.80 6.19 6.28 6.91 7.98 6.68 6.38 5.53
NUTS, SEEDS, AND SOY 6.57 3.63 3.41 3.45 5.74 7.43 9.37 8.21
POULTRY (Not Incl. Deli and Mixed Dishes) 4.54 9.46 6.46 6.65 4.42 3.93 3.37 2.07
DESSERTS AND SWEET SNACKS 4.31 6.76 5.36 3.09 3.43 3.80 4.59 5.45

196
2020 Dietary Guidelines Advisory Committee Data Supplement: Food Category Sources
https://www.dietaryguidelines.gov/2020-advisory-committee-report/data-analysis
MEAT, POULTRY, SEAFOOD MIXED DISHES 4.09 3.01 2.66 2.12 3.47 4.53 5.64 4.85
YEAST BREADS AND TORTILLAS 3.51 2.45 3.62 3.49 2.89 3.26 3.74 5.45
PIZZA 3.31 3.73 4.83 6.05 3.39 2.51 2.26 2.89
QUICK BREADS (Biscuits, Muffins, Pancakes, Waffles)
2.91 4.95 5.74 3.31 2.24 2.40 2.76 2.27
EGGS 2.65 2.47 2.35 1.43 3.17 3.31 2.41 2.34
BREAKFAST CEREALS AND BARS 2.07 1.92 2.39 2.99 2.34 1.69 1.67 1.84
SEAFOOD (Not Incl. Mixed Dishes) 2.02 1.20 1.37 1.12 2.09 2.15 2.49 2.49
SALAD DRESSINGS 1.62 1.24 1.63 1.83 1.92 1.54 1.40 1.61
CONDIMENTS AND GRAVIES 1.43 0.63 1.06 1.23 1.94 1.86 1.31 0.84
SOUPS 1.32 1.07 0.86 0.72 1.32 1.33 1.53 1.83
SPREADS 1.13 0.15 0.47 0.33 0.54 1.42 1.48 3.31
RICE AND PASTA 1.04 0.78 1.49 0.80 1.30 0.97 0.75 1.08
CANDY AND SUGARS 0.95 0.56 0.95 0.91 1.02 0.71 1.16 0.91
SUGAR-SWEETENED AND DIET BEVERAGES 0.74 0.09 0.04 0.10 0.82 0.70 0.83 2.07
LOW-FAT MILK/YOGURT 0.33 0.32 0.14 0.12 0.38 0.24 0.38 0.36
CHEESE 0.29 0.08 0.32 1.15 0.19 0.03 0.29 0.06
MEATS (Not Incl. Deli and Mixed Dishes) 0.27 0.90 0.27 0.17 0.17 0.20 0.33 0.30
COFFEE AND TEA 0.13 0.00 0.00 0.02 0.12 0.08 0.32 0.07
FRUIT (Non-Juice) 0.13 0.14 0.05 0.00 0.14 0.10 0.16 0.30
DELI/CURED PRODUCTS (Meat and Poultry) 0.04 0.01 0.02 0.00 0.01 0.02 0.10 0.13
WATERS 0.02 0.00 0.00 0.00 0.05 0.03 0.01 0.01
HIGHER FAT MILK/YOGURT 0.01 0.00 0.00 0.01 0.00 0.00 0.04 0.01
100% FRUIT JUICE 0.00 0.00 0.00 0.00 0.00 0.00 0.00 0.00
ALCOHOLIC BEVERAGES 0.00 0.00 0.00 0.00 0.00 0.00 0.00 0.00
TOTAL* 99.79 99.87 99.97 99.94 99.99 99.91 99.89 99.98
*Totals are less than 100% because results do not include baby foods, infant formulas and WWEIA category – other
(continued from previous page)

197
2020 Dietary Guidelines Advisory Committee Data Supplement: Food Category Sources
https://www.dietaryguidelines.gov/2020-advisory-committee-report/data-analysis
Figure 12. 1: Males and Females - Distribution of oils intake (percentages) across major categories
71+ 12-19 years 20-40 years 41-50 years 51-70 years6-11 years 2-5 years 2+
DAIRY
MIXED DISHES
100
90
80
70
60
50
40
30
20
10
0
PROTEIN FOODS
GRAINS
FRUITS+FRUIT JUICE
BEVERAGES (Not incl. Milk and 100% Fruit Juice)
SNACKS AND SWEETS
VEGETABLES
CONDIMENTS, GRAVIES, SPREADS, SALAD DRESSINGS
%

198
2020 Dietary Guidelines Advisory Committee Data Supplement: Food Category Sources
https://www.dietaryguidelines.gov/2020-advisory-committee-report/data-analysis
BURGERS AND SANDWICHES (incl. tacos and burritos) CHIPS, CRACKERS, AND SAVORY SNACKS
VEGETABLES (Incl. Beans and Peas, not Starchy) STARCHY VEGETABLES
RICE, PASTA AND OTHER GRAIN-BASED MIXED DISHES NUTS, SEEDS, AND SOY
POULTRY (Not incl. Deli and Mixed Dishes) MEAT, POULTRY, SEAFOOD MIXED DISHES
DESSERTS AND SWEET SNACKS PIZZA
Figure 12. 2: Males and Females - Distribution of oils intake (percentages) across top 10 sub-categories
71+ 6-11 years 12-19 years 20-40 years 41-50 years 51-70 years2-5 years2+
100
90
80
70
60
50
40
30
20
10
0
%

199
2020 Dietary Guidelines Advisory Committee Data Supplement: Food Category Sources
https://www.dietaryguidelines.gov/2020-advisory-committee-report/data-analysis
80
70
60
50
40
30
20
10
0
Figure 12. 3: Males - Distribution of oils intake (percentages) across major categories
71+ 12-19 years 20-40 years 41-50 years 51-70 years6-11 years 2-5 years 2+
DAIRY
MIXED DISHES
100
90
PROTEIN FOODS
GRAINS
FRUITS+FRUIT JUICE
BEVERAGES (Not incl. Milk and 100% Fruit Juice)
SNACKS AND SWEETS
VEGETABLES
CONDIMENTS, GRAVIES, SPREADS, SALAD DRESSINGS
%

200
2020 Dietary Guidelines Advisory Committee Data Supplement: Food Category Sources
https://www.dietaryguidelines.gov/2020-advisory-committee-report/data-analysis
Figure 12. 4: Males - Distribution of oils intake (percentages) across top 10 sub-categories
100
90
80
70
60
50
40
30
20
10
0 2+ 2-5 years 6-11 years 12-19 years 20-40 years 41-50 years 51-70 years 71+
BURGERS AND SANDWICHES (incl. tacos and burritos) CHIPS, CRACKERS, AND SAVORY SNACKS
VEGETABLES (Incl. Beans and Peas, not Starchy) STARCHY VEGETABLES
RICE, PASTA AND OTHER GRAIN-BASED MIXED DISHES NUTS, SEEDS, AND SOY
POULTRY (Not incl. Deli and Mixed Dishes) MEAT, POULTRY, SEAFOOD MIXED DISHES
PIZZA DESSERTS AND SWEET SNACKS
%

201
2020 Dietary Guidelines Advisory Committee Data Supplement: Food Category Sources
https://www.dietaryguidelines.gov/2020-advisory-committee-report/data-analysis
Figure 12. 5: Females - Distribution of oils intake (percentages) across major categories
100
90
80
70
60
50
40
30
20
10
0 2+
DAIRY
MIXED DISHES
2-5 years 6-11 years 12-19 years 20-40 years 41-50 years 51-70 years
PROTEIN FOODS
GRAINS
71+
SNACKS AND SWEETS FRUITS+FRUIT JUICE
VEGETABLES BEVERAGES (Not incl. Milk and 100% Fruit Juice)
CONDIMENTS, GRAVIES, SPREADS, SALAD DRESSINGS
%

202
2020 Dietary Guidelines Advisory Committee Data Supplement: Food Category Sources
https://www.dietaryguidelines.gov/2020-advisory-committee-report/data-analysis
Figure 12. 6: Females - Distribution of oils intake (percentages) across top 10 sub-categories
100
90
80
70
60
50
40
30
20
10
0 2+ 2-5 years 6-11 years 12-19 years 20-40 years 41-50 years 51-70 years 71+
BURGERS AND SANDWICHES (incl. tacos and burritos) CHIPS, CRACKERS, AND SAVORY SNACKS
VEGETABLES (Incl. Beans and Peas, not Starchy) RICE, PASTA AND OTHER GRAIN-BASED MIXED DISHES
STARCHY VEGETABLES NUTS, SEEDS, AND SOY
POULTRY (Not incl. Deli and Mixed Dishes) DESSERTS AND SWEET SNACKS
MEAT, POULTRY, SEAFOOD MIXED DISHES YEAST BREADS AND TORTILLAS
%

203
2020 Dietary Guidelines Advisory Committee Data Supplement: Food Category Sources
https://www.dietaryguidelines.gov/2020-advisory-committee-report/data-analysis
Percent of solid fats intake, 2013-16, for U.S. population ages 2 years and
older, from WWEIA Food Categories
These data are estimates of the percent of solid fats from WWEIA Food Categories, re-grouped into DGAC major categories and sub-categories as described elsewhere, for individuals 2 years and older based on the day 1 dietary recalls from WWEIA, NHANES 2013-16. Breastfed children, and pregnant and lactating women have been excluded. The sample size is 15,807.
WHOLE SAMPLE (MALES + FEMALES)
Table 13. 1: Males and Females - Distribution of solid fats intake (percentages) across major categories
DGAC major category
Age Groups (Years)
2+ 2-5 6-11 12-19 20-40 41-50 51-70 71+
%
MIXED DISHES
35.34 28.01 36.98 39.66 41.00 35.56 31.11 27.01
SNACKS AND SWEETS
22.06 22.29 25.61 22.96 18.83 20.98 22.65 27.39
PROTEIN FOODS
11.96 13.07 9.05 8.64 13.27 12.67 12.57 11.25
DAIRY 11.63 26.47 15.95 13.84 9.33 9.05 10.43 10.80
VEGETAB LES
5.72 2.99 3.23 5.40 6.35 5.66 6.47 6.02
CONDIME NTS, GRAVIES, SPREADS, SALAD DRESSIN GS
5.08 2.78 4.11 3.30 3.51 5.01 6.80 9.48

204
2020 Dietary Guidelines Advisory Committee Data Supplement: Food Category Sources
https://www.dietaryguidelines.gov/2020-advisory-committee-report/data-analysis
BEVERAG ES (Not Incl. Milk and 100% Fruit Juice)
4.26 0.37 0.40 1.46 4.39 6.35 6.41 3.86
GRAINS 3.84 3.90 4.62 4.70 3.20 4.55 3.46 4.04
FRUITS+F RUIT JUICE
0.08 0.03 0.05 0.01 0.08 0.16 0.09 0.09
TOTAL* 99.97 99.92 99.99 99.97 99.95 99.98 99.98 99.94
*Totals are less than 100% because results do not include baby foods, infant formulas and WWEIA category – other
Table 13. 2: Males and Females - Distribution of solid fats intake (percentages) across sub-categories
DGAC sub-category Age Groups (Years)
2+ 2-5 6-11 12-19 20-40 41-50 51-70 71+
%
BURGERS AND SANDWICHES (Incl. Tacos and Burritos)
18.51 12.01 16.90 19.14 22.32 19.67 16.97 13.89
DESSERTS AND SWEET SNACKS 16.61 15.73 19.23 17.12 13.84 15.30 17.17 22.93
RICE, PASTA AND OTHER GRAIN- BASED MIXED DISHES
6.85 7.93 8.22 7.92 7.80 6.33 5.63 4.97
HIGHER FAT MILK/YOGURT 6.66 18.85 10.95 9.07 4.70 5.20 4.93 5.94
PIZZA 5.55 5.54 8.13 9.01 6.72 4.85 3.44 2.37
CHEESE 4.34 6.33 3.88 3.62 4.35 3.35 4.96 4.18
SPREADS 4.20 2.38 3.33 2.35 2.72 4.27 5.58 8.80
EGGS 3.84 3.78 2.54 2.37 4.37 4.02 3.99 4.56
COFFEE AND TEA 3.70 0.12 0.22 1.18 3.66 5.52 5.86 3.35
(continued from previous page)

205
2020 Dietary Guidelines Advisory Committee Data Supplement: Food Category Sources
https://www.dietaryguidelines.gov/2020-advisory-committee-report/data-analysis
DELI/CURED PRODUCTS (Meat and Poultry)
3.21 5.66 3.60 2.30 2.94 2.79 3.57 3.04
CANDY AND SUGARS 3.10 2.89 3.15 3.30 2.85 3.01 3.43 2.88
STARCHY VEGETABLES 3.10 2.11 2.36 3.64 3.54 2.55 3.14 3.01
MEAT, POULTRY, SEAFOOD MIXED DISHES
2.91 0.74 2.23 2.00 2.64 3.21 3.68 4.07
VEGETABLES (Incl. Beans and Peas, not Starchy)
2.62 0.88 0.87 1.76 2.80 3.11 3.33 3.00
CHIPS, CRACKERS, AND SAVORY SNACKS
2.35 3.67 3.22 2.53 2.14 2.67 2.05 1.58
MEATS (Not Incl. Deli and Mixed Dishes) 2.12 0.61 0.87 1.42 2.46 2.53 2.68 1.78
POULTRY (Not Incl. Deli and Mixed Dishes)
2.09 2.35 1.71 2.13 2.68 2.32 1.62 1.37
QUICK BREADS (Biscuits, Muffins, Pancakes, Waffles)
1.72 2.06 2.43 2.54 1.27 1.92 1.35 1.99
SOUPS 1.52 1.80 1.49 1.59 1.51 1.50 1.39 1.71
BREAKFAST CEREALS AND BARS 1.23 1.13 1.30 1.05 0.95 1.74 1.24 1.50
CONDIMENTS AND GRAVIES 0.80 0.36 0.71 0.86 0.69 0.70 1.13 0.61
YEAST BREADS AND TORTILLAS 0.72 0.54 0.74 1.00 0.76 0.78 0.65 0.44
LOW-FAT MILK/YOGURT 0.63 1.29 1.12 1.16 0.29 0.51 0.54 0.68
SUGAR-SWEETENED AND DIET BEVERAGES
0.52 0.25 0.18 0.28 0.66 0.78 0.50 0.51
NUTS, SEEDS, AND SOY 0.37 0.26 0.20 0.25 0.43 0.48 0.43 0.21
SEAFOOD (Not Incl. Mixed Dishes) 0.33 0.40 0.13 0.18 0.39 0.54 0.27 0.29
RICE AND PASTA 0.17 0.18 0.14 0.11 0.22 0.11 0.22 0.11
SALAD DRESSINGS 0.08 0.04 0.07 0.09 0.11 0.04 0.09 0.07
FRUIT (Non-Juice) 0.08 0.03 0.05 0.01 0.08 0.16 0.09 0.09
ALCOHOLIC BEVERAGES 0.04 0.00 0.00 0.00 0.07 0.04 0.04 0.00
WATERS 0.00 0.00 0.00 0.00 0.01 0.00 0.00 0.00
100% FRUIT JUICE 0.00 0.00 0.00 0.00 0.00 0.00 0.00 0.00
TOTAL* 99.97 99.92 99.99 99.97 99.95 99.98 99.98 99.94
*Totals are less than 100% because results do not include baby foods, infant formulas and WWEIA category - other
(continued from previous page)

207
2020 Dietary Guidelines Advisory Committee Data Supplement: Food Category Sources
https://www.dietaryguidelines.gov/2020-advisory-committee-report/data-analysis
MALES
Table 13. 3: Males - Distribution of solid fats intake (percentages) across major categories
DGAC major category Age Groups (Years)
2+ 2-5 6-11 12-19 20-40 41-50 51-70 71+
%
MIXED DISHES 37.79 28.75 38.60 41.59 44.93 37.54 33.74 27.99
SNACKS AND SWEETS 20.60 22.65 24.50 21.91 16.14 20.05 22.49 26.31
PROTEIN FOODS 12.94 14.16 9.27 9.11 14.18 13.33 13.80 14.12
DAIRY 11.71 24.13 16.54 13.77 9.39 8.18 9.38 10.92
VEGETABLES 5.36 2.89 3.19 4.72 5.68 5.62 6.13 6.00
CONDIMENTS, GRAVIES, SPREADS, SALAD DRESSINGS
4.37 2.50 2.82 2.80 2.86 4.91 6.50 8.21
GRAINS 3.76 4.32 4.73 5.14 3.13 4.41 3.22 3.66
BEVERAGES (Not Incl. Milk and 100% Fruit Juice)
3.29 0.46 0.30 0.90 3.60 5.88 4.68 2.62
FRUITS+FRUIT JUICE 0.04 0.06 0.05 0.01 0.02 0.07 0.05 0.05
TOTAL* 99.85 99.92 99.99 99.96 99.93 99.99 99.99 99.88
*Totals are less than 100% because results do not include baby foods, infant formulas and WWEIA category - other

208
2020 Dietary Guidelines Advisory Committee Data Supplement: Food Category Sources
https://www.dietaryguidelines.gov/2020-advisory-committee-report/data-analysis
Table 13. 4: Males - Distribution of solid fats intake (percentages) across sub-categories
DGAC sub-category Age Groups (Years)
2+ 2-5years
6-11years
12-19years
20-40years
41-50years
51-70years
71+
%
BURGERS AND SANDWICHES (Incl. Tacos and Burritos)
20.75 13.38 17.64 21.34 25.81 22.86 19.03 15.02
DESSERTS AND SWEET SNACKS 15.52 15.58 17.67 16.45 12.14 14.99 16.85 22.80
HIGHER FAT MILK/YOGURT 7.38 17.76 11.26 10.07 5.26 5.00 4.76 6.45
RICE, PASTA AND OTHER GRAIN- BASED MIXED DISHES
6.68 7.13 8.09 7.46 7.61 6.28 5.37 4.84
PIZZA 5.86 6.27 8.79 9.32 7.40 3.95 3.88 1.48
EGGS 3.76 3.81 2.42 2.57 3.97 3.95 3.85 5.28
CHEESE 3.74 5.35 4.12 2.69 3.84 2.63 4.18 3.67

209
2020 Dietary Guidelines Advisory Committee Data Supplement: Food Category Sources
https://www.dietaryguidelines.gov/2020-advisory-committee-report/data-analysis
SPREADS 3.61 2.22 2.02 1.82 2.26 4.27 5.43 7.64
DELI/CURED PRODUCTS (Meat and Poultry)
3.53 6.23 3.89 2.19 2.96 2.81 4.42 3.76
STARCHY VEGETABLES 3.11 1.83 2.37 3.32 3.53 2.33 3.46 2.86
MEAT, POULTRY, SEAFOOD MIXED DISHES
3.05 0.72 2.44 1.90 2.90 2.67 4.16 4.70
COFFEE AND TEA 2.83 0.18 0.15 0.60 3.03 4.95 4.42 2.25
CANDY AND SUGARS 2.72 2.69 3.62 2.96 2.16 2.87 3.32 1.69
MEATS (Not Incl. Deli and Mixed Dishes)
2.52 0.52 0.76 1.61 3.22 2.47 3.30 2.59
POULTRY (Not Incl. Deli and Mixed Dishes)
2.47 2.66 1.87 2.26 3.14 3.27 1.72 1.96
CHIPS, CRACKERS, AND SAVORY SNACKS
2.36 4.38 3.20 2.50 1.84 2.19 2.32 1.81
VEGETABLES (Incl. Beans and Peas, not Starchy)
2.26 1.05 0.81 1.41 2.14 3.29 2.68 3.15
QUICK BREADS (Biscuits, Muffins, Pancakes, Waffles)
1.82 2.61 2.64 2.88 1.28 1.81 1.57 1.82
SOUPS 1.44 1.25 1.65 1.58 1.22 1.79 1.31 1.95
BREAKFAST CEREALS AND BARS 1.07 1.03 1.29 1.04 0.82 1.80 0.90 1.22
YEAST BREADS AND TORTILLAS 0.74 0.48 0.72 1.16 0.90 0.75 0.49 0.53
CONDIMENTS AND GRAVIES 0.70 0.25 0.73 0.97 0.51 0.62 1.02 0.44
LOW-FAT MILK/YOGURT 0.59 1.02 1.16 1.01 0.29 0.55 0.43 0.80
SUGAR-SWEETENED AND DIET BEVERAGES
0.43 0.28 0.15 0.29 0.50 0.86 0.25 0.37
SEAFOOD (Not Incl. Mixed Dishes) 0.36 0.64 0.15 0.14 0.50 0.68 0.18 0.34
NUTS, SEEDS, AND SOY 0.29 0.31 0.17 0.34 0.38 0.15 0.33 0.19
RICE AND PASTA 0.14 0.20 0.09 0.07 0.13 0.04 0.25 0.10
SALAD DRESSINGS 0.06 0.03 0.06 0.02 0.09 0.02 0.06 0.13
FRUIT (Non-Juice) 0.03 0.06 0.05 0.01 0.02 0.07 0.04 0.05
ALCOHOLIC BEVERAGES 0.03 0.00 0.00 0.01 0.07 0.07 0.01 0.00
(continued from previous page)

210
2020 Dietary Guidelines Advisory Committee Data Supplement: Food Category Sources
https://www.dietaryguidelines.gov/2020-advisory-committee-report/data-analysis
100% FRUIT JUICE 0.00 0.00 0.00 0.00 0.00 0.00 0.01 0.00
WATERS 0.00 0.00 0.00 0.00 0.00 0.00 0.00 0.00
TOTAL* 99.85 99.92 99.99 99.96 99.93 99.99 99.99 99.88
*Totals are less than 100% because results do not include baby foods, infant formulas and WWEIA category - other
FEMALES
Table 13. 5: Females - Distribution of solid fats intake (percentages) across major categories
DGAC sub-category Age Groups (Years)
2+ 2-5 6-11 12-19 20-40 41-50 51-70 71+
%
MIXED DISHES 32.35 27.33 35.11 37.66 36.53 33.76 28.71 26.24
SNACKS AND SWEETS 23.26 21.97 26.88 24.04 21.87 21.83 22.80 28.23
DAIRY 12.47 28.65 15.28 13.91 9.27 9.84 11.38 10.70
PROTEIN FOODS 10.95 12.05 8.79 8.15 12.24 12.08 11.44 9.00
VEGETABLES 6.08 3.08 3.28 6.10 7.11 5.69 6.77 6.02
CONDIMENTS, GRAVIES, SPREADS, SALAD DRESSINGS
5.68 3.03 5.59 3.83 4.26 5.10 7.07 10.48
BEVERAGES (Not Incl. Milk and 100% Fruit Juice)
5.12 0.29 0.52 2.05 5.29 6.78 7.99 4.84
(continued from previous page)

211
2020 Dietary Guidelines Advisory Committee Data Supplement: Food Category Sources
https://www.dietaryguidelines.gov/2020-advisory-committee-report/data-analysis
GRAINS 3.87 3.52 4.48 4.23 3.28 4.68 3.68 4.35
FRUITS+FRUIT JUICE 0.12 0.00 0.05 0.01 0.15 0.24 0.13 0.12
TOTAL* 99.90 99.91 99.99 99.98 99.99 99.98 99.98 99.98
*Totals are less than 100% because results do not include baby foods, infant formulas and WWEIA category - other
Table 13. 6: Females - Distribution of solid fats intake (percentages) across sub-categories
DGAC sub-categories Age Groups (Years)
2+ 2-5 6-11 12-19 20-40 41-50 51-70 71+
%
DESSERTS AND SWEET SNACKS 17.44 15.87 21.01 17.83 15.78 15.58 17.47 23.02
BURGERS AND SANDWICHES (Incl. Tacos and Burritos)
15.83 10.74 16.06 16.86 18.37 16.77 15.09 13.00
RICE, PASTA AND OTHER GRAIN-BASED MIXED DISHES
7.02 8.66 8.37 8.40 8.01 6.37 5.86 5.07
HIGHER FAT MILK/YOGURT 6.86 19.87 10.60 8.03 4.06 5.37 5.08 5.54
PIZZA 5.16 4.85 7.38 8.70 5.96 5.67 3.03 3.07
CHEESE 4.93 7.24 3.60 4.58 4.93 4.00 5.66 4.57
SPREADS 4.70 2.52 4.83 2.91 3.24 4.27 5.72 9.72
COFFEE AND TEA 4.45 0.06 0.30 1.79 4.38 6.04 7.18 4.22
(continued from previous page)
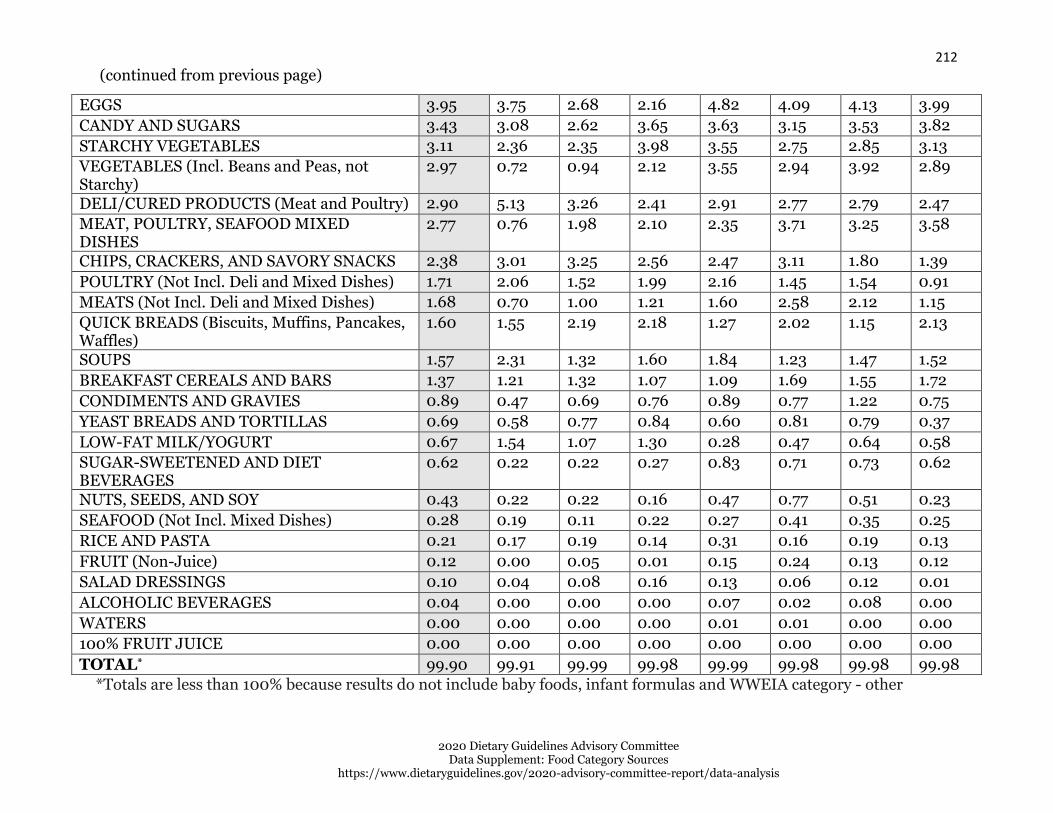
212
2020 Dietary Guidelines Advisory Committee Data Supplement: Food Category Sources
https://www.dietaryguidelines.gov/2020-advisory-committee-report/data-analysis
EGGS 3.95 3.75 2.68 2.16 4.82 4.09 4.13 3.99
CANDY AND SUGARS 3.43 3.08 2.62 3.65 3.63 3.15 3.53 3.82
STARCHY VEGETABLES 3.11 2.36 2.35 3.98 3.55 2.75 2.85 3.13
VEGETABLES (Incl. Beans and Peas, not Starchy)
2.97 0.72 0.94 2.12 3.55 2.94 3.92 2.89
DELI/CURED PRODUCTS (Meat and Poultry) 2.90 5.13 3.26 2.41 2.91 2.77 2.79 2.47
MEAT, POULTRY, SEAFOOD MIXED DISHES
2.77 0.76 1.98 2.10 2.35 3.71 3.25 3.58
CHIPS, CRACKERS, AND SAVORY SNACKS 2.38 3.01 3.25 2.56 2.47 3.11 1.80 1.39
POULTRY (Not Incl. Deli and Mixed Dishes) 1.71 2.06 1.52 1.99 2.16 1.45 1.54 0.91
MEATS (Not Incl. Deli and Mixed Dishes) 1.68 0.70 1.00 1.21 1.60 2.58 2.12 1.15
QUICK BREADS (Biscuits, Muffins, Pancakes, Waffles)
1.60 1.55 2.19 2.18 1.27 2.02 1.15 2.13
SOUPS 1.57 2.31 1.32 1.60 1.84 1.23 1.47 1.52
BREAKFAST CEREALS AND BARS 1.37 1.21 1.32 1.07 1.09 1.69 1.55 1.72
CONDIMENTS AND GRAVIES 0.89 0.47 0.69 0.76 0.89 0.77 1.22 0.75
YEAST BREADS AND TORTILLAS 0.69 0.58 0.77 0.84 0.60 0.81 0.79 0.37
LOW-FAT MILK/YOGURT 0.67 1.54 1.07 1.30 0.28 0.47 0.64 0.58
SUGAR-SWEETENED AND DIET BEVERAGES
0.62 0.22 0.22 0.27 0.83 0.71 0.73 0.62
NUTS, SEEDS, AND SOY 0.43 0.22 0.22 0.16 0.47 0.77 0.51 0.23
SEAFOOD (Not Incl. Mixed Dishes) 0.28 0.19 0.11 0.22 0.27 0.41 0.35 0.25
RICE AND PASTA 0.21 0.17 0.19 0.14 0.31 0.16 0.19 0.13
FRUIT (Non-Juice) 0.12 0.00 0.05 0.01 0.15 0.24 0.13 0.12
SALAD DRESSINGS 0.10 0.04 0.08 0.16 0.13 0.06 0.12 0.01
ALCOHOLIC BEVERAGES 0.04 0.00 0.00 0.00 0.07 0.02 0.08 0.00
WATERS 0.00 0.00 0.00 0.00 0.01 0.01 0.00 0.00
100% FRUIT JUICE 0.00 0.00 0.00 0.00 0.00 0.00 0.00 0.00
TOTAL* 99.90 99.91 99.99 99.98 99.99 99.98 99.98 99.98
*Totals are less than 100% because results do not include baby foods, infant formulas and WWEIA category - other
(continued from previous page)

213
2020 Dietary Guidelines Advisory Committee Data Supplement: Food Category Sources
https://www.dietaryguidelines.gov/2020-advisory-committee-report/data-analysis
Figure 13. 1: Males and Females - Distribution of solid fats intake (percentages) across major categories
71+ 12-19 years 20-40 years 41-50 years 51-70 years6-11 years 2-5 years 2+
DAIRY
MIXED DISHES
100
90
80
70
60
50
40
30
20
10
0
PROTEIN FOODS
GRAINS
FRUITS+FRUIT JUICE
BEVERAGES (Not incl. Milk and 100% Fruit Juice)
SNACKS AND SWEETS
VEGETABLES
CONDIMENTS, GRAVIES, SPREADS, SALAD DRESSINGS
%

214
2020 Dietary Guidelines Advisory Committee Data Supplement: Food Category Sources
https://www.dietaryguidelines.gov/2020-advisory-committee-report/data-analysis
Figure 13. 2: Males and Females - Distribution of solid fats intake (percentages) across top 10 sub- categories
100
90
80
70
60
50
40
30
20
10
0 2+ 2-5 years 6-11 years 12-19 years 20-40 years 41-50 years 51-70 years 71+
BURGERS AND SANDWICHES (incl. tacos and burritos) DESSERTS AND SWEET SNACKS
RICE, PASTA AND OTHER GRAIN-BASED MIXED DISHES HIGHER FAT MILK/YOGURT
PIZZA CHEESE
SPREADS EGGS
COFFEE AND TEA DELI/CURED PRODUCTS (Meat and Poultry)
%

215
2020 Dietary Guidelines Advisory Committee Data Supplement: Food Category Sources
https://www.dietaryguidelines.gov/2020-advisory-committee-report/data-analysis
Figure 13. 3: Males - Distribution of solid fats intake (percentages) across major categories
100
90
80
70
60
50
40
30
20
10
0 2+
DAIRY
MIXED DISHES
2-5 years 6-11 years 12-19 years 20-40 years 41-50 years 51-70 years
PROTEIN FOODS
GRAINS
71+
SNACKS AND SWEETS FRUITS+FRUIT JUICE
VEGETABLES BEVERAGES (Not incl. Milk and 100% Fruit Juice)
CONDIMENTS, GRAVIES, SPREADS, SALAD DRESSINGS
%

216
2020 Dietary Guidelines Advisory Committee Data Supplement: Food Category Sources
https://www.dietaryguidelines.gov/2020-advisory-committee-report/data-analysis
Figure 13. 4: Males - Distribution of solid fats intake (percentages) across top 10 sub-categories
100
90
80
70
60
50
40
30
20
10
0 2+ 2-5 years 6-11 years 12-19 years 20-40 years 41-50 years 51-70 years 71+
BURGERS AND SANDWICHES (incl. tacos and burritos) DESSERTS AND SWEET SNACKS
HIGHER FAT MILK/YOGURT RICE, PASTA AND OTHER GRAIN-BASED MIXED DISHES
PIZZA EGGS
CHEESE SPREADS
DELI/CURED PRODUCTS (Meat and Poultry) STARCHY VEGETABLES
%

219
2020 Dietary Guidelines Advisory Committee Data Supplement: Food Category Sources
https://www.dietaryguidelines.gov/2020-advisory-committee-report/data-analysis
DESSERTS AND SWEET SNACKS BURGERS AND SANDWICHES (incl. tacos and burritos)
RICE, PASTA AND OTHER GRAIN-BASED MIXED DISHES HIGHER FAT MILK/YOGURT
PIZZA CHEESE
SPREADS COFFEE AND TEA
EGGS CANDY AND SUGARS
Figure 13. 6: Females - Distribution of solid fats intake (percentages) across top 10 sub-categories
71+ 12-19 years 20-40 years 41-50 years 51-70 years6-11 years2-5 years2+
100
90
80
70
60
50
40
30
20
10
0
%

220
2020 Dietary Guidelines Advisory Committee Data Supplement: Food Category Sources
https://www.dietaryguidelines.gov/2020-advisory-committee-report/data-analysis
Percent of added sugars intake, 2013-16, for U.S. population ages 2 years and
older, from WWEIA Food Categories
These data are estimates of the percent of added sugars from WWEIA Food Categories, re-grouped into DGAC major categories and sub-categories as described elsewhere, for individuals 2 years and older based on the day 1 dietary recalls from WWEIA, NHANES 2013-16. Breastfed children, and pregnant and lactating women have been excluded. The sample size is 15,807.
WHOLE SAMPLE (MALES + FEMALES)
Table 14. 1: Males and Females- Distribution of added sugars intake (percentages) across major categories
DGAC major category
Age Groups (Years)
2+ 2-5 6-11 12-19 20-40 41-50 51-70 71+
%
BEVERAG ES (Not Incl. Milk and 100% Fruit Juice)
37.11 18.95 28.34 39.96 47.02 42.40 33.03 25.35
SNACKS AND SWEETS
28.81 37.95 35.17 25.67 22.44 25.37 31.82 37.74
GRAINS 12.24 16.69 14.27 14.27 10.08 10.62 12.28 14.16
MIXED DISHES
10.26 9.80 9.32 10.36 10.53 9.40 10.59 10.74
DAIRY 4.80 11.03 8.68 5.00 3.39 4.62 4.10 3.97
VEGETAB LES
2.39 0.45 0.61 1.16 2.02 3.70 3.23 3.48

221
2020 Dietary Guidelines Advisory Committee Data Supplement: Food Category Sources
https://www.dietaryguidelines.gov/2020-advisory-committee-report/data-analysis
CONDIME NTS, GRAVIES, SPREADS, SALAD DRESSIN GS
1.58 1.47 1.41 1.58 1.77 1.57 1.55 1.26
PROTEIN FOODS
1.57 1.53 1.05 0.80 1.84 1.40 1.95 1.38
FRUITS+F RUIT JUICE
0.97 1.73 0.99 1.02 0.51 0.63 1.16 1.82
TOTAL* 99.72 99.60 99.82 99.82 99.61 99.71 99.72 99.90
*Totals are less than 100% because results do not include baby foods, infant formulas and WWEIA category – other
Table 14. 2: Males and Females- Distribution of added sugars intake (percentages) across sub-categories
DGAC sub-category Age Groups (Years)
2+ 2-5 6-11 12-19 20-40 41-50 51-70 71+
%
SUGAR-SWEETENED AND DIET BEVERAGES
24.11 16.41 25.17 32.14 32.09 25.31 16.54 12.84
DESSERTS AND SWEET SNACKS 18.80 23.33 22.21 16.05 14.25 17.43 20.50 27.72
COFFEE AND TEA 11.10 1.97 3.02 7.30 11.94 14.90 14.33 11.13
CANDY AND SUGARS 8.97 12.63 12.14 8.78 7.33 7.34 9.86 9.02
BREAKFAST CEREALS AND BARS 7.40 11.67 9.61 10.09 6.39 6.23 6.48 7.00
BURGERS AND SANDWICHES (Incl. Tacos and Burritos)
7.29 7.53 6.88 7.08 7.30 6.40 7.79 7.60
HIGHER FAT MILK/YOGURT 3.64 8.50 5.80 2.95 2.89 3.58 3.32 3.07
(continued from previous page)

222
2020 Dietary Guidelines Advisory Committee Data Supplement: Food Category Sources
https://www.dietaryguidelines.gov/2020-advisory-committee-report/data-analysis
YEAST BREADS AND TORTILLAS 2.73 1.48 1.61 1.54 2.43 2.51 3.63 4.66
VEGETABLES (Incl. Beans and Peas, not Starchy)
2.32 0.44 0.59 0.96 1.97 3.66 3.17 3.37
QUICK BREADS (Biscuits, Muffins, Pancakes, Waffles)
2.09 3.54 3.04 2.65 1.26 1.87 2.15 2.43
ALCOHOLIC BEVERAGES 1.72 0.00 0.07 0.44 2.81 1.95 2.00 1.29
CONDIMENTS AND GRAVIES 1.23 1.37 1.19 1.22 1.39 1.31 1.15 0.77
RICE, PASTA AND OTHER GRAIN- BASED MIXED DISHES
1.18 1.05 0.73 0.98 1.48 1.52 0.98 1.04
LOW-FAT MILK/YOGURT 1.15 2.53 2.88 2.05 0.50 1.04 0.78 0.90
CHIPS, CRACKERS, AND SAVORY SNACKS
1.04 1.98 0.81 0.84 0.86 0.60 1.46 1.00
FRUIT (Non-Juice) 0.89 1.72 0.95 1.01 0.39 0.54 1.07 1.71
PIZZA 0.80 0.85 1.19 1.34 0.82 0.57 0.59 0.64
MEAT, POULTRY, SEAFOOD MIXED DISHES
0.78 0.21 0.41 0.93 0.77 0.66 1.00 0.81
NUTS, SEEDS, AND SOY 0.61 0.53 0.44 0.28 0.64 0.63 0.80 0.60
POULTRY (Not Incl. Deli and Mixed Dishes)
0.44 0.32 0.31 0.22 0.69 0.37 0.39 0.36
DELI/CURED PRODUCTS (Meat and Poultry)
0.25 0.58 0.19 0.13 0.28 0.11 0.30 0.22
SALAD DRESSINGS 0.24 0.09 0.15 0.28 0.34 0.22 0.25 0.06
SOUPS 0.22 0.16 0.10 0.03 0.16 0.25 0.23 0.65
WATERS 0.18 0.57 0.07 0.08 0.18 0.24 0.16 0.10
SEAFOOD (Not Incl. Mixed Dishes) 0.15 0.06 0.07 0.13 0.12 0.18 0.24 0.10
SPREADS 0.11 0.01 0.08 0.08 0.04 0.04 0.16 0.43
MEATS (Not Incl. Deli and Mixed Dishes) 0.10 0.04 0.04 0.03 0.09 0.11 0.16 0.10
100% FRUIT JUICE 0.08 0.01 0.04 0.01 0.11 0.08 0.10 0.11
STARCHY VEGETABLES 0.07 0.01 0.02 0.20 0.05 0.04 0.06 0.11
EGGS 0.02 0.00 0.00 0.00 0.02 0.00 0.07 0.00
(continued from previous page)

223
2020 Dietary Guidelines Advisory Committee Data Supplement: Food Category Sources
https://www.dietaryguidelines.gov/2020-advisory-committee-report/data-analysis
RICE AND PASTA 0.02 0.00 0.00 0.00 0.01 0.01 0.02 0.07
CHEESE 0.00 0.00 0.00 0.00 0.00 0.00 0.00 0.00
TOTAL* 99.72 99.60 99.82 99.82 99.61 99.71 99.72 99.90
*Totals are less than 100% because results do not include baby foods, infant formulas and WWEIA category – other
Table 14. 3: Males and Females - Distribution of added sugars intake (percentages) across beverage categories
Beverage category Age Groups (Years)
2+ 2-5 6-11 12-19 20-40 41-50 51-70 71+
%
SUGAR-SWEETENED AND DIET BEVERAGES
24.11 16.41 25.17 32.14 32.09 25.31 16.54 12.84
COFFEE AND TEA 11.10 1.97 3.02 7.30 11.94 14.90 14.33 11.13
HIGHER FAT MILK/YOGURT 3.64 8.50 5.80 2.95 2.89 3.58 3.32 3.07
ALCOHOLIC BEVERAGES 1.72 0.00 0.07 0.44 2.81 1.95 2.00 1.29
LOW-FAT MILK/YOGURT 1.15 2.53 2.88 2.05 0.50 1.04 0.78 0.90
WATERS 0.18 0.57 0.07 0.08 0.18 0.24 0.16 0.10
(continued from previous page)

224
2020 Dietary Guidelines Advisory Committee Data Supplement: Food Category Sources
https://www.dietaryguidelines.gov/2020-advisory-committee-report/data-analysis
100% FRUIT JUICE 0.08 0.01 0.04 0.01 0.11 0.08 0.10 0.11
TOTAL* 41.99 29.98 37.06 44.97 50.53 47.10 37.22 29.43
*Results do not include baby foods, infant formulas and WWEIA category – other
MALES
Table 14. 4: Males - Distribution of added sugars intake (percentages) across major categories
DGAC major category Age Groups (Years)
2+ 2-5 6-11 12-19 20-40 41-50 51-70 71+
%
BEVERAGES (Not Incl. Milk and 100% Fruit Juice)
38.37 19.66 29.66 40.06 49.69 44.83 33.66 25.02
SNACKS AND SWEETS 26.97 36.91 34.25 24.73 20.03 23.06 30.84 35.46
GRAINS 12.24 15.92 13.53 14.65 9.33 10.15 12.78 15.82
MIXED DISHES 11.39 10.75 9.61 11.45 12.04 10.67 11.91 12.00
DAIRY 4.59 10.99 9.02 4.81 3.32 5.04 2.72 3.19
(continued from previous page)
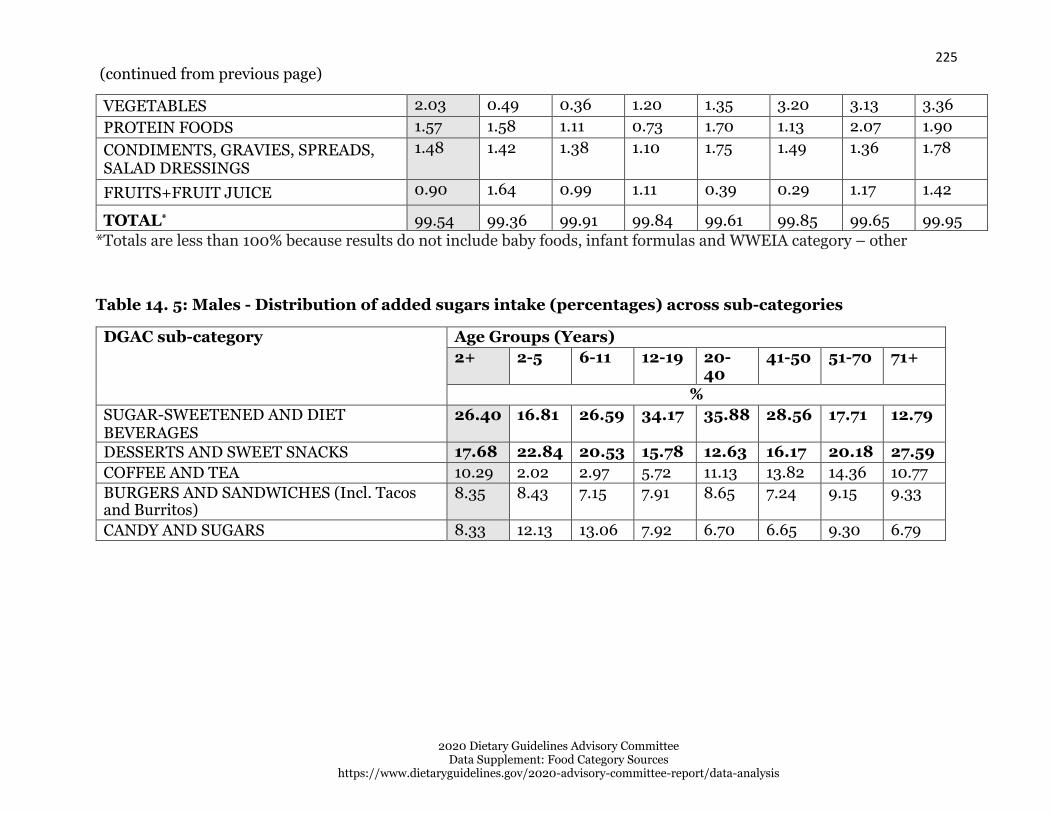
225
2020 Dietary Guidelines Advisory Committee Data Supplement: Food Category Sources
https://www.dietaryguidelines.gov/2020-advisory-committee-report/data-analysis
VEGETABLES 2.03 0.49 0.36 1.20 1.35 3.20 3.13 3.36
PROTEIN FOODS 1.57 1.58 1.11 0.73 1.70 1.13 2.07 1.90
CONDIMENTS, GRAVIES, SPREADS, SALAD DRESSINGS
1.48 1.42 1.38 1.10 1.75 1.49 1.36 1.78
FRUITS+FRUIT JUICE 0.90 1.64 0.99 1.11 0.39 0.29 1.17 1.42
TOTAL* 99.54 99.36 99.91 99.84 99.61 99.85 99.65 99.95
*Totals are less than 100% because results do not include baby foods, infant formulas and WWEIA category – other
Table 14. 5: Males - Distribution of added sugars intake (percentages) across sub-categories
DGAC sub-category Age Groups (Years)
2+ 2-5 6-11 12-19 20- 40
41-50 51-70 71+
%
SUGAR-SWEETENED AND DIET BEVERAGES
26.40 16.81 26.59 34.17 35.88 28.56 17.71 12.79
DESSERTS AND SWEET SNACKS 17.68 22.84 20.53 15.78 12.63 16.17 20.18 27.59
COFFEE AND TEA 10.29 2.02 2.97 5.72 11.13 13.82 14.36 10.77
BURGERS AND SANDWICHES (Incl. Tacos and Burritos)
8.35 8.43 7.15 7.91 8.65 7.24 9.15 9.33
CANDY AND SUGARS 8.33 12.13 13.06 7.92 6.70 6.65 9.30 6.79
(continued from previous page)

226
2020 Dietary Guidelines Advisory Committee Data Supplement: Food Category Sources
https://www.dietaryguidelines.gov/2020-advisory-committee-report/data-analysis
BREAKFAST CEREALS AND BARS 7.35 10.92 9.53 10.36 6.09 6.03 6.15 7.91
HIGHER FAT MILK/YOGURT 3.42 8.20 5.84 2.46 2.87 3.65 2.33 2.44
YEAST BREADS AND TORTILLAS 2.82 1.54 1.18 1.41 2.17 2.45 4.31 5.62
QUICK BREADS (Biscuits, Muffins, Pancakes, Waffles)
2.05 3.45 2.82 2.88 1.08 1.66 2.29 2.13
VEGETABLES (Incl. Beans and Peas, not Starchy)
1.96 0.49 0.36 0.90 1.31 3.18 3.08 3.25
ALCOHOLIC BEVERAGES 1.48 0.00 0.05 0.12 2.60 2.13 1.41 1.40
RICE, PASTA AND OTHER GRAIN-BASED MIXED DISHES
1.25 0.99 0.73 0.82 1.60 1.71 1.01 1.34
CONDIMENTS AND GRAVIES 1.23 1.32 1.20 1.00 1.51 1.28 1.06 1.14
LOW-FAT MILK/YOGURT 1.17 2.80 3.18 2.35 0.45 1.38 0.39 0.75
CHIPS, CRACKERS, AND SAVORY SNACKS 0.96 1.94 0.66 1.03 0.69 0.25 1.36 1.08
FRUIT (Non-Juice) 0.82 1.64 0.97 1.10 0.24 0.29 1.06 1.32
MEAT, POULTRY, SEAFOOD MIXED DISHES 0.81 0.26 0.38 1.32 0.75 0.82 1.02 0.64
PIZZA 0.80 0.87 1.21 1.37 0.93 0.47 0.55 0.28
POULTRY (Not Incl. Deli and Mixed Dishes) 0.53 0.42 0.34 0.19 0.76 0.47 0.51 0.68
NUTS, SEEDS, AND SOY 0.50 0.34 0.50 0.15 0.48 0.35 0.76 0.76
DELI/CURED PRODUCTS (Meat and Poultry) 0.29 0.73 0.20 0.18 0.21 0.15 0.43 0.27
WATERS 0.19 0.83 0.05 0.06 0.08 0.31 0.18 0.07
SOUPS 0.18 0.19 0.14 0.04 0.11 0.42 0.17 0.41
SALAD DRESSINGS 0.15 0.08 0.15 0.09 0.21 0.17 0.14 0.06
SEAFOOD (Not Incl. Mixed Dishes) 0.14 0.07 0.03 0.17 0.14 0.10 0.22 0.10
SPREADS 0.11 0.01 0.04 0.01 0.03 0.03 0.17 0.59
MEATS (Not Incl. Deli and Mixed Dishes) 0.09 0.02 0.04 0.05 0.08 0.06 0.16 0.09
100% FRUIT JUICE 0.08 0.00 0.02 0.00 0.15 0.00 0.11 0.10
STARCHY VEGETABLES 0.07 0.00 0.00 0.30 0.04 0.02 0.06 0.10
RICE AND PASTA 0.02 0.00 0.00 0.00 0.00 0.00 0.03 0.16
EGGS 0.01 0.00 0.00 0.00 0.03 0.00 0.00 0.00
CHEESE 0.00 0.00 0.00 0.00 0.00 0.00 0.00 0.00
TOTAL* 99.54 99.36 99.91 99.84 99.61 99.85 99.65 99.95 *Totals are less than 100% because results do not include baby foods, infant formulas and WWEIA category – other
(continued from previous page)

227
2020 Dietary Guidelines Advisory Committee Data Supplement: Food Category Sources
https://www.dietaryguidelines.gov/2020-advisory-committee-report/data-analysis
Table 14. 6: Males - Distribution of added sugars intake (percentages) across beverage categories
Beverage category Age Groups (Years)
2+ 2-5 6-11 12-19 20- 40
41-50 51-70 71+
%
SUGAR-SWEETENED AND DIET BEVERAGES
26.40 16.81 26.59 34.17 35.88 28.56 17.71 12.79
COFFEE AND TEA 10.29 2.02 2.97 5.72 11.13 13.82 14.36 10.77
HIGHER FAT MILK/YOGURT 3.42 8.20 5.84 2.46 2.87 3.65 2.33 2.44
ALCOHOLIC BEVERAGES 1.48 0.00 0.05 0.12 2.60 2.13 1.41 1.40
LOW-FAT MILK/YOGURT 1.17 2.80 3.18 2.35 0.45 1.38 0.39 0.75
WATERS 0.19 0.83 0.05 0.06 0.08 0.31 0.18 0.07
100% FRUIT JUICE 0.08 0.00 0.02 0.00 0.15 0.00 0.11 0.10
TOTAL* 43.04 30.65 38.70 44.87 53.15 49.87 36.49 28.31
*Results do not include baby foods, infant formulas and WWEIA category – other

228
2020 Dietary Guidelines Advisory Committee Data Supplement: Food Category Sources
https://www.dietaryguidelines.gov/2020-advisory-committee-report/data-analysis
FEMALES
Table 14. 7: Females - Distribution of added sugars intake (percentages) across major categories
DGAC major category Age Groups (Years)
2+ 2-5 6-11 12-19 20- 40
41-50 51-70 71+
%
BEVERAGES (Not Incl. Milk and 100% Fruit Juice)
35.17 18.29 26.83 39.86 44.07 40.18 32.45 25.61
SNACKS AND SWEETS 30.67 38.91 36.21 26.62 25.11 27.47 32.72 39.53
GRAINS 12.43 17.40 15.11 13.89 10.91 11.05 11.82 12.86
MIXED DISHES 9.00 8.93 8.98 9.26 8.87 8.25 9.39 9.75
DAIRY 5.24 11.06 8.29 5.21 3.47 4.24 5.36 4.58
VEGETABLES 2.71 0.42 0.88 1.12 2.76 4.15 3.32 3.57
CONDIMENTS, GRAVIES, SPREADS, SALAD DRESSINGS
1.63 1.52 1.45 2.06 1.79 1.64 1.73 0.85
PROTEIN FOODS 1.57 1.48 0.98 0.86 1.99 1.66 1.85 0.97
FRUITS+FRUIT JUICE 1.10 1.80 0.98 0.93 0.64 0.93 1.15 2.14
TOTAL* 99.51 99.82 99.72 99.81 99.60 99.58 99.79 99.86
*Totals are less than 100% because results do not include baby foods, infant formulas and WWEIA category – other

229
2020 Dietary Guidelines Advisory Committee Data Supplement: Food Category Sources
https://www.dietaryguidelines.gov/2020-advisory-committee-report/data-analysis
Table 14. 8: Females - Distribution of added sugars intake (percentages) across sub-categories
DGAC sub-category Age Groups (Years0
2+ 2-5 6-11 12-19 20-40 41-50 51-70 71+
%
SUGAR-SWEETENED AND DIET BEVERAGES
21.47 16.04 23.55 30.07 27.86 22.34 15.48 12.88
DESSERTS AND SWEET SNACKS 19.91 23.79 24.14 16.32 16.04 18.58 20.80 27.82
COFFEE AND TEA 11.61 1.93 3.08 8.92 12.85 15.88 14.30 11.41
CANDY AND SUGARS 9.58 13.10 11.09 9.66 8.03 7.96 10.37 10.78
BREAKFAST CEREALS AND BARS 7.59 12.37 9.69 9.81 6.73 6.42 6.79 6.29
BURGERS AND SANDWICHES (Incl. Tacos and Burritos)
6.12 6.71 6.56 6.24 5.80 5.63 6.55 6.24

230
2020 Dietary Guidelines Advisory Committee Data Supplement: Food Category Sources
https://www.dietaryguidelines.gov/2020-advisory-committee-report/data-analysis
HIGHER FAT MILK/YOGURT 4.06 8.77 5.75 3.46 2.91 3.51 4.21 3.56
YEAST BREADS AND TORTILLAS 2.67 1.43 2.11 1.67 2.71 2.56 3.00 3.90
VEGETABLES (Incl. Beans and Peas, not Starchy)
2.64 0.40 0.85 1.02 2.70 4.10 3.25 3.46
QUICK BREADS (Biscuits, Muffins, Pancakes, Waffles)
2.16 3.61 3.31 2.41 1.45 2.06 2.03 2.66
ALCOHOLIC BEVERAGES 1.89 0.00 0.10 0.77 3.05 1.79 2.53 1.20
CONDIMENTS AND GRAVIES 1.20 1.42 1.18 1.44 1.26 1.34 1.24 0.48
CHIPS, CRACKERS, AND SAVORY SNACKS
1.18 2.02 0.98 0.65 1.05 0.93 1.55 0.93
LOW-FAT MILK/YOGURT 1.17 2.29 2.54 1.75 0.56 0.72 1.14 1.02
RICE, PASTA AND OTHER GRAIN- BASED MIXED DISHES
1.11 1.10 0.74 1.15 1.36 1.35 0.94 0.81
FRUIT (Non-Juice) 1.02 1.79 0.92 0.91 0.57 0.77 1.07 2.01
PIZZA 0.80 0.82 1.17 1.32 0.70 0.65 0.63 0.92
MEAT, POULTRY, SEAFOOD MIXED DISHES
0.72 0.17 0.45 0.53 0.79 0.52 0.98 0.95
NUTS, SEEDS, AND SOY 0.71 0.70 0.37 0.42 0.83 0.89 0.84 0.47
POULTRY (Not Incl. Deli and Mixed Dishes)
0.34 0.23 0.27 0.25 0.61 0.29 0.28 0.10
SALAD DRESSINGS 0.32 0.10 0.14 0.47 0.48 0.26 0.35 0.07
SOUPS 0.24 0.14 0.07 0.02 0.21 0.10 0.29 0.83
DELI/CURED PRODUCTS (Meat and Poultry)
0.22 0.44 0.18 0.08 0.36 0.08 0.17 0.19
WATERS 0.20 0.32 0.10 0.09 0.30 0.17 0.14 0.12
SEAFOOD (Not Incl. Mixed Dishes) 0.16 0.06 0.12 0.09 0.09 0.24 0.26 0.09
SPREADS 0.11 0.00 0.13 0.15 0.05 0.04 0.14 0.30
MEATS (Not Incl. Deli and Mixed Dishes) 0.10 0.05 0.04 0.02 0.09 0.15 0.16 0.11
100% FRUIT JUICE 0.08 0.01 0.07 0.02 0.07 0.16 0.08 0.12
STARCHY VEGETABLES 0.07 0.02 0.03 0.10 0.06 0.06 0.07 0.12
EGGS 0.04 0.00 0.00 0.00 0.01 0.00 0.13 0.00
(continued from previous page)

231
2020 Dietary Guidelines Advisory Committee Data Supplement: Food Category Sources
https://www.dietaryguidelines.gov/2020-advisory-committee-report/data-analysis
RICE AND PASTA 0.01 0.00 0.00 0.00 0.02 0.02 0.00 0.00
CHEESE 0.00 0.00 0.00 0.00 0.00 0.00 0.01 0.01
TOTAL* 99.51 99.82 99.72 99.81 99.60 99.58 99.79 99.86
*Totals are less than 100% because results do not include baby foods, infant formulas and WWEIA category – other
Table 14. 9: Females - Distribution of added sugars intake (percentages) across beverage categories
Beverage category Age Groups (Years)
2+ 2-5 6-11 12-19 20-40 41-50 51-70 71+
%
SUGAR-SWEETENED AND DIET BEVERAGES
21.47 16.04 23.55 30.07 27.86 22.34 15.48 12.88
COFFEE AND TEA 11.61 1.93 3.08 8.92 12.85 15.88 14.30 11.41
HIGHER FAT MILK/YOGURT 4.06 8.77 5.75 3.46 2.91 3.51 4.21 3.56
ALCOHOLIC BEVERAGES 1.89 0.00 0.10 0.77 3.05 1.79 2.53 1.20
LOW-FAT MILK/YOGURT 1.17 2.29 2.54 1.75 0.56 0.72 1.14 1.02
WATERS 0.20 0.32 0.10 0.09 0.30 0.17 0.14 0.12
100 FRUIT JUICE 0.08 0.01 0.07 0.02 0.07 0.16 0.08 0.12
TOTAL* 40.49 29.36 35.18 45.08 47.61 44.58 37.88 30.31
*Results do not include baby foods, infant formulas and WWEIA category – other
(continued from previous page)

234
2020 Dietary Guidelines Advisory Committee Data Supplement: Food Category Sources
https://www.dietaryguidelines.gov/2020-advisory-committee-report/data-analysis
Figure 14. 2: Males and Females - Distribution of added sugars intake (percentages) across top 10 sub- categories
100
90
80
70
60
50
40
30
20
10
0 2+ 2-5 years 6-11 years 12-19 years 20-40 years 41-50 years 51-70 years 71+
SUGAR-SWEETENED AND DIET BEVERAGES DESSERTS AND SWEET SNACKS
COFFEE AND TEA CANDY AND SUGARS
BREAKFAST CEREALS AND BARS BURGERS AND SANDWICHES (incl. tacos and burritos)
HIGHER FAT MILK/YOGURT YEAST BREADS AND TORTILLAS
VEGETABLES (Incl. Beans and Peas, not Starchy) QUICK BREADS (Biscuits, Muffins, Pancakes, Waffles)
%

235
2020 Dietary Guidelines Advisory Committee Data Supplement: Food Category Sources
https://www.dietaryguidelines.gov/2020-advisory-committee-report/data-analysis
Figure 14. 3: Males and Females - Distribution of added sugars intake (percentages) across beverage categories
SUGAR-SWEETENED AND DIET BEVERAGES COFFEE AND TEA
HIGHER FAT MILK/YOGURT ALCOHOLIC BEVERAGES
LOWFAT MILK/YOGURT WATERS
HUNDRED % FRUIT JUICE
71+ 6-11 years 12-19 years 20-40 years 41-50 years 51-70 years2-5 years 2+
100
90
80
70
60
50
40
30
20
10
0
%

236
2020 Dietary Guidelines Advisory Committee Data Supplement: Food Category Sources
https://www.dietaryguidelines.gov/2020-advisory-committee-report/data-analysis
Figure 14. 4: Males - Distribution of added sugars intake (percentages) across major categories
100
90
80
70
60
50
40
30
20
10
0 2+
DAIRY
MIXED DISHES
2-5 years 6-11 years 12-19 years 20-40 years 41-50 years 51-70 years
PROTEIN FOODS
GRAINS
71+
SNACKS AND SWEETS FRUITS+FRUIT JUICE
VEGETABLES BEVERAGES (Not incl. Milk and 100% Fruit Juice)
CONDIMENTS, GRAVIES, SPREADS, SALAD DRESSINGS
%

237
2020 Dietary Guidelines Advisory Committee Data Supplement: Food Category Sources
https://www.dietaryguidelines.gov/2020-advisory-committee-report/data-analysis
Figure 14. 5: Males - Distribution of added sugars intake (percentages) across top 10 sub-categories
100
90
80
70
60
50
40
30
20
10
0 2+ 2-5 years 6-11 years 12-19 years 20-40 years 41-50 years 51-70 years 71+
SUGAR-SWEETENED AND DIET BEVERAGES DESSERTS AND SWEET SNACKS
COFFEE AND TEA BURGERS AND SANDWICHES (incl. tacos and burritos)
CANDY AND SUGARS BREAKFAST CEREALS AND BARS
HIGHER FAT MILK/YOGURT YEAST BREADS AND TORTILLAS
QUICK BREADS (Biscuits, Muffins, Pancakes, Waffles) VEGETABLES (Incl. Beans and Peas, not Starchy)
%

238
2020 Dietary Guidelines Advisory Committee Data Supplement: Food Category Sources
https://www.dietaryguidelines.gov/2020-advisory-committee-report/data-analysis
SUGAR-SWEETENED AND DIET BEVERAGES COFFEE AND TEA
HIGHER FAT MILK/YOGURT ALCOHOLIC BEVERAGES
LOWFAT MILK/YOGURT WATERS
HUNDRED FRUIT JUICE
Figure 14. 6: Males - Distribution of added sugars intake (percentages) across beverage categories
71+ 6-11 years 12-19 years 20-40 years 41-50 years 51-70 years2-5 years2+
100
90
80
70
60
50
40
30
20
10
0
%

239
2020 Dietary Guidelines Advisory Committee Data Supplement: Food Category Sources
https://www.dietaryguidelines.gov/2020-advisory-committee-report/data-analysis
Figure 14. 7: Females - Distribution of added sugars intake (percentages) across major categories
100
90
80
70
60
50
40
30
20
10
0 2+
DAIRY
MIXED DISHES
2-5 years 6-11 years 12-19 years 20-40 years 41-50 years 51-70 years
PROTEIN FOODS
GRAINS
71+
SNACKS AND SWEETS FRUITS+FRUIT JUICE
VEGETABLES BEVERAGES (Not incl. Milk and 100% Fruit Juice)
CONDIMENTS, GRAVIES, SPREADS, SALAD DRESSINGS
%

240
2020 Dietary Guidelines Advisory Committee Data Supplement: Food Category Sources
https://www.dietaryguidelines.gov/2020-advisory-committee-report/data-analysis
SUGAR-SWEETENED AND DIET BEVERAGES
COFFEE AND TEA
BREAKFAST CEREALS AND BARS
HIGHER FAT MILK/YOGURT
VEGETABLES (Incl. Beans and Peas, not Starchy)
DESSERTS AND SWEET SNACKS
CANDY AND SUGARS
BURGERS AND SANDWICHES (incl. tacos and burritos)
YEAST BREADS AND TORTILLAS
QUICK BREADS (Biscuits, Muffins, Pancakes, Waffles)
Figure 14. 8: Females - Distribution of added sugars intake (percentages) across top 10 sub-categories
71+ 12-19 years 20-40 years 41-50 years 51-70 years6-11 years2-5 years2+
100
90
80
70
60
50
40
30
20
10
0
%

241
2020 Dietary Guidelines Advisory Committee Data Supplement: Food Category Sources
https://www.dietaryguidelines.gov/2020-advisory-committee-report/data-analysis
SUGAR-SWEETENED AND DIET BEVERAGES COFFEE AND TEA
HIGHER FAT MILK/YOGURT ALCOHOLIC BEVERAGES
LOWFAT MILK/YOGURT WATERS
HUNDRED FRUIT JUICE
Figure 14. 9: Females - Distribution of added sugars intake (percentages) across beverage categories
71+ 12-19 years 20-40 years 41-50 years 51-70 years6-11 years2-5 years2+
100
90
80
70
60
50
40
30
20
10
0
%

2020 Dietary Guidelines Advisory Committee Data Supplement: Food Category Sources
https://www.dietaryguidelines.gov/2020-advisory-committee-report/data-analysis
242
References
1. Centers for Disease Prevention and Control. National Health and NutritionExamination Survey: Survey Methods and Analytic Guidelines. Centers forDisease Prevention and Control Website:https://wwwn.cdc.gov/nchs/nhanes/AnalyticGuidelines.aspx#analytic- guidelines . Accessed March 22, 2019.
2. Agricultural Research Service, United States Department of Agriculture.WWEIA/NHANES Overview. Agricultural Research Service website:https://www.ars.usda.gov/northeast-area/beltsville-md-bhnrc/beltsville- human-nutrition-research-center/food-surveys-research- group/docs/wweianhanes-overview/. Updated July 31, 2018. Accessed March22, 2019.
3. Bowman SA, Clemens JC, Friday JE, Lynch KL, and Moshfegh AJ. 2017. FoodPatterns Equivalents Database 2013-14: Methodology and User Guide. U.S.Department of Agriculture, Agricultural Research Service, Food SurveysResearch Group website: http://www.ars.usda.gov/nea/bhnrc/fsrg. AccessedMarch 22, 2019.

SOURCES OF NUTRIENTS
NHANES 2013-16
Acknowledgements The following individuals represent the team who produced this analysis: Edwina Wambogo1
Jill Reedy1
Marissa Shams-White1
National Cancer Institute, NIH
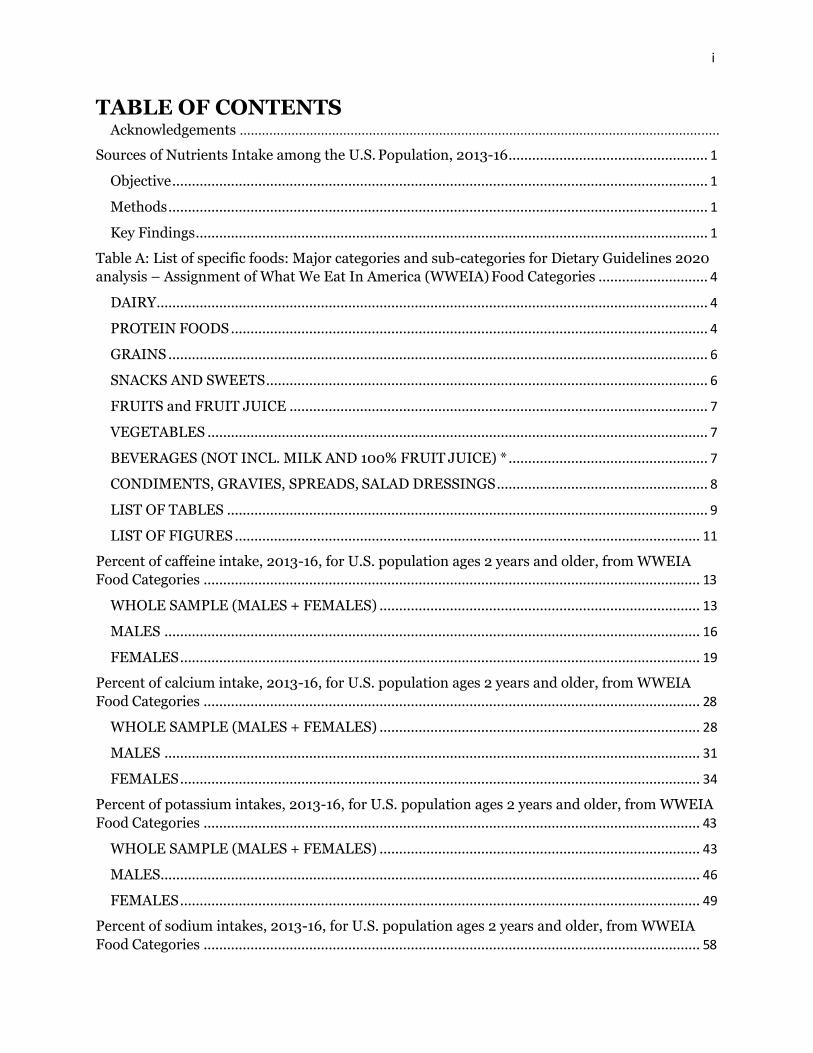
i
TABLE OF CONTENTS Acknowledgements ..................................................................................................................................
Sources of Nutrients Intake among the U.S. Population, 2013-16 ................................................... 1
Objective ......................................................................................................................................... 1
Methods .......................................................................................................................................... 1
Key Findings ................................................................................................................................... 1
Table A: List of specific foods: Major categories and sub-categories for Dietary Guidelines 2020
analysis – Assignment of What We Eat In America (WWEIA) Food Categories ............................ 4
DAIRY ............................................................................................................................................. 4
PROTEIN FOODS .......................................................................................................................... 4
GRAINS .......................................................................................................................................... 6
SNACKS AND SWEETS ................................................................................................................. 6
FRUITS and FRUIT JUICE ........................................................................................................... 7
VEGETABLES ................................................................................................................................ 7
BEVERAGES (NOT INCL. MILK AND 100% FRUIT JUICE) * ................................................... 7
CONDIMENTS, GRAVIES, SPREADS, SALAD DRESSINGS ...................................................... 8
LIST OF TABLES ........................................................................................................................... 9
LIST OF FIGURES ....................................................................................................................... 11
Percent of caffeine intake, 2013-16, for U.S. population ages 2 years and older, from WWEIA
Food Categories ............................................................................................................................... 13
WHOLE SAMPLE (MALES + FEMALES) .................................................................................. 13
MALES ......................................................................................................................................... 16
FEMALES ..................................................................................................................................... 19
Percent of calcium intake, 2013-16, for U.S. population ages 2 years and older, from WWEIA
Food Categories ............................................................................................................................... 28
WHOLE SAMPLE (MALES + FEMALES) .................................................................................. 28
MALES ......................................................................................................................................... 31
FEMALES ..................................................................................................................................... 34
Percent of potassium intakes, 2013-16, for U.S. population ages 2 years and older, from WWEIA
Food Categories ............................................................................................................................... 43
WHOLE SAMPLE (MALES + FEMALES) .................................................................................. 43
MALES.......................................................................................................................................... 46
FEMALES ..................................................................................................................................... 49
Percent of sodium intakes, 2013-16, for U.S. population ages 2 years and older, from WWEIA
Food Categories ............................................................................................................................... 58

ii
WHOLE SAMPLE (MALES + FEMALES) .................................................................................. 58
MALES.......................................................................................................................................... 61
FEMALES ..................................................................................................................................... 64
Percent of dietary fiber intakes, 2013-16, for U.S. population ages 2 years and older, from
WWEIA Food Categories ................................................................................................................. 73
WHOLE SAMPLE (MALES + FEMALES) .................................................................................. 73
MALES.......................................................................................................................................... 76
FEMALES ..................................................................................................................................... 79
Percent of vitamin D intakes, 2013-16, for U.S. population ages 2 years and older, from WWEIA
Food Categories ............................................................................................................................... 88
WHOLE SAMPLE (MALES + FEMALES) .................................................................................. 88
MALES.......................................................................................................................................... 91
FEMALES ..................................................................................................................................... 94
References ...................................................................................................................................... 103

1
2020 Dietary Guidelines Advisory Committee Data Supplement: Food Category Sources
https://www.dietaryguidelines.gov/2020-advisory-committee-report/data-analysis
Sources of nutrient intakes among the U.S. population,
2013-16
Objective
The purpose of this research was to identify the major contributors to caffeine, calcium,
potassium, sodium, dietary fiber, and vitamin D intake among the U.S. population.
Methods
We used the 2013-16 National Health and Nutrition Examination Survey (NHANES) data to determine the weighted population contribution of food categories to energy intake. We categorized the NHANES dietary data into 150 mutually exclusive What We Eat In America (WWEIA) Food Categories [1]. We further regrouped these 150 food categories into 9 major categories and 36 sub-categories. The focus of the food categorization system is to group similar foods and beverages on the basis of usage and nutrient content. Each food within the categories is linked to the food codes in the Food and Nutrient Database for Dietary Studies (FNDDS), which provides ingredient proportions and nutrient values [2]. Additionally, the Food Patterns Equivalents Database (FPED) data [3], was used to determine food groupings.

1
Table A.
List of specific foods: Major categories and sub-categories for Dietary Guidelines 2020
analysis – Assignment of What We Eat In America (WWEIA) Food Categories.
Table 1.1 – 6.6
There are 36 tables for the percentage contribution of various food groups to caffeine, calcium, potassium, sodium, dietary fiber, and vitamin D intake.
Figure 1.1 – 6.6
There are 36 figures for the percentage contribution of various food groups to caffeine, calcium, potassium, sodium, dietary fiber, and vitamin D intake.
Note
Rankings depend in part on how ubiquitously the specific food is consumed. Foods that are the richest sources of a nutrient are not necessarily the major contributors. Because some foods are commonly consumed in the population they result in a significant contribution to the total intake.
Selected Key Findings
Caffeine:
By major category: Beverages, not including milk and 100% juice, contributed the most
caffeine for those 12 years and older. For children 2-11 years, the major source of
caffeine was snacks and sweets. Dairy also contributed significantly more caffeine for
children 2-11 years, compared to other age groups. Similar findings were seen in
stratified analyses by sex.
By sub-category: The top source of caffeine for adults 20 years and older was coffee and
tea; the top source for children 2-11 years was desserts and sweet snacks; and the top
source for adolescents 12-19 years was sugar-sweetened and diet beverages. Findings
were similar by sex, except the major contributor for females 12-19 years was coffee and
tea, not sugar-sweetened and diet beverages.
2020 Dietary Guidelines Advisory Committee Data Supplement: Food Category Sources
https://www.dietaryguidelines.gov/2020-advisory-committee-report/data-analysis

2
Calcium:
By major category: There were some differences in top sources of calcium by age group.
Although dairy provided the highest proportion of calcium for children 2-11 years,
mixed dishes was the top source of calcium for those 12 years and older. Nevertheless,
dairy as a source of calcium was higher with older age groups from 20 years on, and
provided the second largest proportion of calcium for adults 71 years and older.
Beverages, not including milk and 100% juice, was the second top source of calcium for
adults 20-50 years. Similar findings were seen for males in stratified analyses, but dairy
was the second source of calcium for those 51-70 years. For females, beverages, not
including milk and 100% juice, was the second top source of calcium for those 20-70
years. Mixed dishes category was still the top source of calcium for females 12 years and
older, and dairy for females 2-11 years.
By sub-category: Burgers and sandwiches was the top source of calcium for those 12
years and older. For children 2-11 years, higher fat milk/yogurt was the top source of
calcium, but burgers and sandwiches sub-category was also a major contributor to
calcium intake for this age group. Higher fat milk/yogurt also contributed more to
calcium intake for adolescents 12-19 years and adults 71 years and older. Pizza
contributed more to calcium intake in the younger age groups, while non-starchy
vegetables, including beans and peas, contributed more to calcium intake for adults 41
years and older. Similar findings were seen in stratified analyses by sex.
Potassium:
By major category: Mixed dishes was the top source of potassium for all age groups,
followed by dairy for children and adolescents 2-19 years, and vegetables for adults 20-
40 years and 71 years and older. Beverages, not including milk and 100% juice, was the
second top source of potassium for adults 41-70 years. Similar findings were seen for
males and females. Mixed dishes remained the top source of potassium for most age
groups, except for children 2-5 years, for whom dairy was the top source of potassium.
By sub-category: Burgers and sandwiches was the top source of potassium for those 6-
50 years; higher fat milk/yogurt was the top source for children 2-5 years; and coffee
and tea was the top source for adults 51 years and older.
Sodium:
By major category: The top source of sodium for all age groups was mixed dishes,
followed by protein foods. Compared to other age groups, dairy provided more sodium
for children 2-5 years. Similar findings were seen among males and females, except
grains provided more sodium for females 6-11 years, compared to protein foods.
2020 Dietary Guidelines Advisory Committee Data Supplement: Food Category Sources
https://www.dietaryguidelines.gov/2020-advisory-committee-report/data-analysis

3
By sub-category: For all age groups, burgers and sandwiches provided the highest
proportion of sodium intake, followed by rice, pasta, and other grain-based mixed
dishes for those 2-40 years, and non-starchy vegetables, including beans and peas, for
adults 41 years and older. For males, pizza was the second top source of sodium for
children and adolescents 6-19 years, and non-starchy vegetables, including beans and
peas, for adults 51 years and older. For females, burgers and sandwiches remained the
top source of sodium intake, and rice, pasta, and grain-based mixed dishes was the
second top source of sodium until age 40 years, after which, the second top source of
sodium was non-starchy vegetables, including beans and peas. Pizza was a top three
source of sodium for females 6-19 years.
Dietary fiber:
By major category: Mixed dishes was the top source of dietary fiber for all age groups.
The second top source of dietary fiber for children and adolescents 2-19 years was
grains, while vegetables was the second top source for adults 20 years and older. Similar
findings were seen among males and females.
By sub-category: Although fruits (non-juice) contributed the most to dietary fiber
among children 2-5 years, burgers and sandwiches was the top source of dietary fiber
for those 6-40 years. Non-starchy vegetables, including beans and peas, contributed the
most for adults 41 years and older.
Vitamin D:
By major category: The contribution of dairy to vitamin D intake went down with age
until age 40 years and then began to increase with age. Dairy contributed significantly
more to vitamin D intake for children 2-5 years and 6-11 years. The second top source of
vitamin D for most age groups was mixed dishes, except for children 2-5 years and
adults 71 years and older, whose second top source of vitamin D was protein foods. For
females, protein foods and grains contributed an equal proportion to vitamin D intake
for children 2-5 years, and mixed dishes was the second top source of vitamin D for
those 6 years and older.
By sub-category: Higher fat milk/yogurt was the top source of vitamin D for children
and adolescents 2-18 years, and for adults 71 years and older. Burgers and sandwiches
was the major contributor of vitamin D for adults 20-70 years. Similar findings were
also seen among males and females, except burgers and sandwiches was only a top
source of vitamin D for females 20-50 years, and higher fat milk/yogurt for all other
females.
2020 Dietary Guidelines Advisory Committee Data Supplement: Food Category Sources
https://www.dietaryguidelines.gov/2020-advisory-committee-report/data-analysis

4
2020 Dietary Guidelines Advisory Committee Data Supplement: Food Category Sources
https://www.dietaryguidelines.gov/2020-advisory-committee-report/data-analysis
Table A: List of specific foods: Major categories and sub-
categories for Dietary Guidelines 2020 analysis –
Assignment of What We Eat In America (WWEIA) Food
Categories
Major categories (n=9) and sub-categories (n=36) for DGAC analyses of contributions of
food category intake to energy intake.
MAJOR CATEGORY
SUB- CATEGORY
WWEIA CATEGORY
SPECIFIC CATEGORY FROM WWEIA
DAIRY
LOW-FAT MILK/YOGURT 1006 Milk, low-fat
1008 Milk, nonfat
1206 Flavored milk, low-fat
1208 Flavored milk, nonfat
1404 Milk substitutes
HIGHER FAT MILK/YOGURT 1002 Milk, whole
1004 Milk, reduced fat
1202 Flavored milk, whole
1204 Flavored milk, reduced fat
1402 Milk shakes and other dairy drinks
1820 Yogurt, regular
1822 Yogurt, Greek
CHEESE
1602 Cheese
1604 Cottage/ricotta cheese
PROTEIN FOODS
MEATS (Not Incl. Deli and Mixed Dishes)
2002 Beef, excludes ground
2004 Ground beef
2006 Pork
2008 Lamb, goat, game
2010 Liver and organ meats
DELI/CURED PRODUCTS (Meat and Poultry)
2602 Cold cuts and cured meats
2604 Bacon
2606 Frankfurters
2608 Sausages POULTRY (Not Incl. Deli and Mixed Dishes)

5
2020 Dietary Guidelines Advisory Committee Data Supplement: Food Category Sources
https://www.dietaryguidelines.gov/2020-advisory-committee-report/data-analysis
2202 Chicken, whole pieces
2204 Chicken patties, nuggets and tenders
2206 Turkey, duck, other poultry
SEAFOOD (Not Incl. Mixed Dishes)
2402 Fish
2404 Shellfish
EGGS
2502 Eggs and omelets NUTS, SEEDS, AND SOY
2804 Nuts and seeds
2806 Processed soy products
MIXED DISHES PIZZA
3602 Pizza BURGERS AND SANDWICHES (Incl. Tacos and Burritos)
3702 Burgers (single code)
3704 Chicken/turkey sandwiches (single code)
3706 Egg/breakfast sandwiches (single code)
3708 Other sandwiches (single code+ combo codes)
3502 Burritos and Tacos
3703 Frankfurter sandwiches (single code + combo codes)
3720 Cheese sandwiches (single code +combo codes)
3722 Peanut butter and jelly sandwiches(single code + combo codes)
MEAT, POULTRY, SEAFOOD MIXED DISHES 3002 Meat mixed dishes
3004 Poultry mixed dishes
3006 Seafood mixed dishes
3404 Stir-fry and soy-based sauce mixtures
RICE, PASTA AND OTHER GRAIN-BASED MIXED DISHES 3202 Rice mixed dishes
3204 Pasta mixed dishes, excludes macaroni and cheese
3206 Macaroni and cheese
3208 Turnovers and other grain-based items
3402 Fried rice and lo/chow mein
3406 Egg rolls, dumplings, sushi 3506 Other Mexican mixed dishes

6
2020 Dietary Guidelines Advisory Committee Data Supplement: Food Category Sources
https://www.dietaryguidelines.gov/2020-advisory-committee-report/data-analysis
SOUPS 3802 Soups
GRAINS
RICE AND PASTA 4002 Rice
4004 Pasta, noodles, cooked grains
YEAST BREADS AND TORTILLAS 4202 Yeast breads
4204 Rolls and buns
4206 Bagels and English muffins
4208 Tortillas
QUICK BREADS (Biscuits, Muffins, Pancakes, Waffles) 4402 Biscuits, muffins, quick breads
4404 Pancakes, waffles, French toast
BREAKFAST CEREALS AND BARS 4602 Ready-to-eat cereal, higher sugar
(>21.2g/100g) 4604 Ready-to-eat cereal, lower sugar
(≤21.2g/100g) 4802 Oatmeal
4804 Grits and other cooked cereals
5402 Cereal bars
5404 Nutrition bars
SNACKS AND SWEETS
CHIPS, CRACKERS, AND SAVORY SNACKS 5002 Potato chips
5004 Tortilla, corn, other chips
5006 Popcorn
5008 Pretzels/snack mix
5202 Crackers, excludes saltines
5204 Saltine crackers
3504 Nachos
DESSERTS AND SWEET SNACKS 5502 Cakes and pies
5504 Cookies and brownies
5506 Doughnuts, sweet rolls, pastries
5802 Ice cream and frozen dairy desserts
5804 Pudding
5806 Gelatins, ices, sorbets
CANDY AND SUGARS 5702 Candy containing chocolate
5704 Candy not containing chocolate 8802 Sugars and honey

7
2020 Dietary Guidelines Advisory Committee Data Supplement: Food Category Sources
https://www.dietaryguidelines.gov/2020-advisory-committee-report/data-analysis
8804 Sugar substitutes
8806 Jams, syrups, toppings
FRUITS and FRUIT JUICE
FRUIT (Non-Juice) 6002 Apples
6004 Bananas
6006 Grapes
6008 Peaches and nectarines
6010 Berries
6012 Citrus fruits
6014 Melons
6016 Dried fruits
6018 Other fruits and fruit salads
100% FRUIT JUICE 7002 Citrus juice
7004 Apple juice
7006 Other fruit juice
VEGETABLES
VEGETABLES (Incl. Beans and Peas, not Starchy) 6402 Tomatoes 6404 Carrots
6406 Other red and orange vegetables
6408 Dark green vegetables, excludes lettuce
6410 Lettuce and lettuce salads (Incl. combo codes)
6412 String beans
6414 Onions
8410 Pasta sauces, tomato-based
6420 Other vegetables and combinations
6422 Vegetable mixed dishes
7008 Vegetable juice
2802 Beans, peas, legumes
STARCHY VEGETABLES
6416 Corn
6418 Other starchy vegetables
6802 White potatoes, baked or boiled
6804 French fries and other fried white potatoes
6806 Mashed potatoes and white potato mixtures
BEVERAGES (NOT INCL. MILK AND 100% FRUIT JUICE) *
SUGAR-SWEETENED AND DIET BEVERAGES

8
2020 Dietary Guidelines Advisory Committee Data Supplement: Food Category Sources
https://www.dietaryguidelines.gov/2020-advisory-committee-report/data-analysis
7102 Diet soft drinks
7104 Diet sport and energy drinks
7106 Other diet drinks
7202 Soft drinks
7204 Fruit drinks
7206 Sport and energy drinks
7208 Nutritional beverages
7802 Flavored or carbonated water
7220 Smoothies and grain drinks
COFFEE AND TEA
7302 Coffee
7304 Tea ALCOHOLIC BEVERAGES
7502 Beer
7504 Wine
7506 Liquor and cocktails
WATERS 7702 Tap water
7704 Bottled water
7804 Enhanced or fortified water
CONDIMENTS, GRAVIES, SPREADS, SALAD DRESSINGS
CONDIMENTS AND GRAVIES 8402 Tomato-based condiments
8404 Soy-based condiments
8406 Mustard and other condiments
8408 Olives, pickles, pickled vegetables
8412 Dips, gravies, other sauces
SPREADS 8002 Butter and animal fats
8004 Margarine
8006 Cream cheese, sour cream, whipped cream
8008 Cream and cream substitutes
SALAD DRESSINGS 8010 Mayonnaise
8012 Salad dressings and vegetable oils
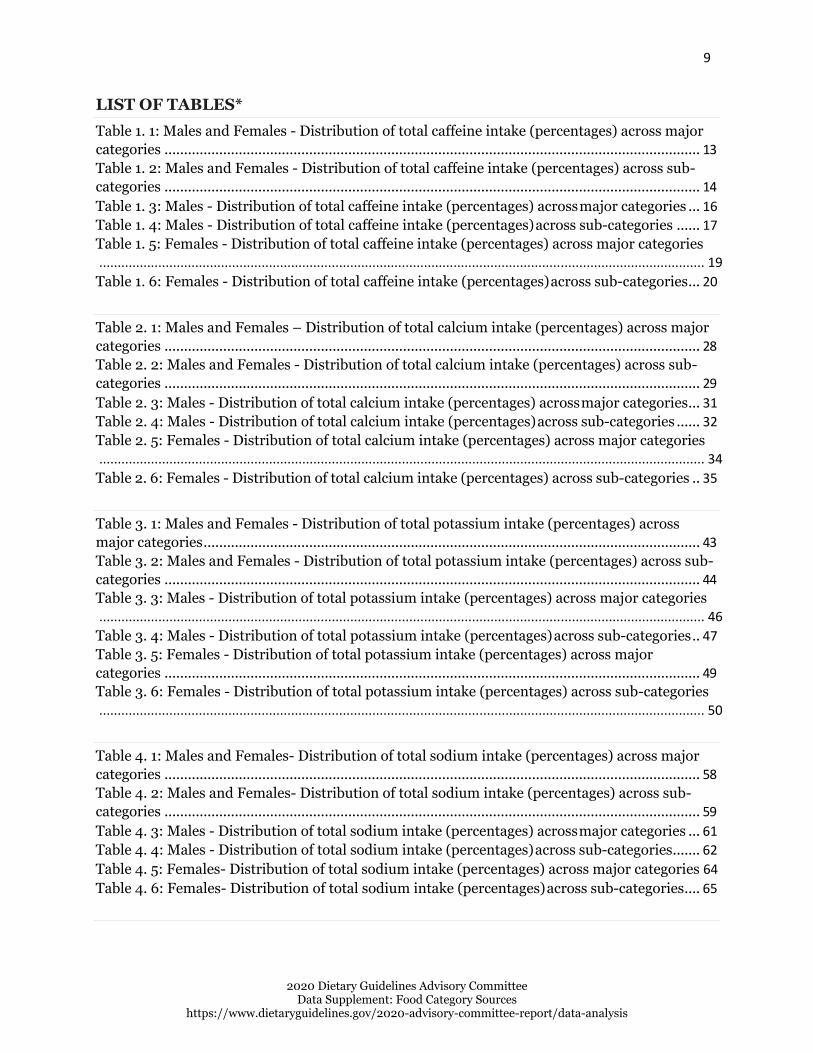
9
2020 Dietary Guidelines Advisory Committee Data Supplement: Food Category Sources
https://www.dietaryguidelines.gov/2020-advisory-committee-report/data-analysis
LIST OF TABLES*
Table 1. 1: Males and Females - Distribution of total caffeine intake (percentages) across major
categories ......................................................................................................................................... 13
Table 1. 2: Males and Females - Distribution of total caffeine intake (percentages) across sub-
categories ......................................................................................................................................... 14
Table 1. 3: Males - Distribution of total caffeine intake (percentages) across major categories ... 16
Table 1. 4: Males - Distribution of total caffeine intake (percentages) across sub-categories ...... 17
Table 1. 5: Females - Distribution of total caffeine intake (percentages) across major categories
.................................................................................................................................................................... 19
Table 1. 6: Females - Distribution of total caffeine intake (percentages) across sub-categories ... 20
Table 2. 1: Males and Females – Distribution of total calcium intake (percentages) across major
categories ......................................................................................................................................... 28
Table 2. 2: Males and Females - Distribution of total calcium intake (percentages) across sub-
categories ......................................................................................................................................... 29
Table 2. 3: Males - Distribution of total calcium intake (percentages) across major categories ... 31
Table 2. 4: Males - Distribution of total calcium intake (percentages) across sub-categories ...... 32
Table 2. 5: Females - Distribution of total calcium intake (percentages) across major categories
.................................................................................................................................................................... 34
Table 2. 6: Females - Distribution of total calcium intake (percentages) across sub-categories .. 35
Table 3. 1: Males and Females - Distribution of total potassium intake (percentages) across
major categories ............................................................................................................................... 43
Table 3. 2: Males and Females - Distribution of total potassium intake (percentages) across sub-
categories ......................................................................................................................................... 44
Table 3. 3: Males - Distribution of total potassium intake (percentages) across major categories
.................................................................................................................................................................... 46
Table 3. 4: Males - Distribution of total potassium intake (percentages) across sub-categories .. 47
Table 3. 5: Females - Distribution of total potassium intake (percentages) across major
categories ......................................................................................................................................... 49
Table 3. 6: Females - Distribution of total potassium intake (percentages) across sub-categories
.................................................................................................................................................................... 50
Table 4. 1: Males and Females- Distribution of total sodium intake (percentages) across major
categories ......................................................................................................................................... 58
Table 4. 2: Males and Females- Distribution of total sodium intake (percentages) across sub-
categories ......................................................................................................................................... 59
Table 4. 3: Males - Distribution of total sodium intake (percentages) across major categories ... 61
Table 4. 4: Males - Distribution of total sodium intake (percentages) across sub-categories ....... 62
Table 4. 5: Females- Distribution of total sodium intake (percentages) across major categories 64
Table 4. 6: Females- Distribution of total sodium intake (percentages) across sub-categories .... 65

10
2020 Dietary Guidelines Advisory Committee Data Supplement: Food Category Sources
https://www.dietaryguidelines.gov/2020-advisory-committee-report/data-analysis
Table 5. 1: Males and Females- Distribution of total dietary fiber intake (percentages) across
major categories ............................................................................................................................... 73
Table 5. 2: Males and Females- Distribution of total dietary fiber intake (percentages) across
sub-categories .................................................................................................................................. 74
Table 5. 3: Males - Distribution of total dietary fiber intake (percentages) across major
categories ......................................................................................................................................... 76
Table 5. 4: Males - Distribution of total dietary fiber intake (percentages) across sub-categories
.................................................................................................................................................................... 77
Table 5. 5: Females- Distribution of total dietary fiber intake (percentages) across major
categories ......................................................................................................................................... 79
Table 5. 6: Females- Distribution of total dietary fiber intake (percentages) across sub-categories
.................................................................................................................................................................... 80
Table 6. 1: Males and Females- Distribution of total vitamin D intake (percentages) across major
categories ......................................................................................................................................... 88
Table 6. 2: Males and Females- Distribution of total vitamin D intake (percentages) across sub-
categories ......................................................................................................................................... 89
Table 6. 3: Males - Distribution of total vitamin D intake (percentages) across major categories
.................................................................................................................................................................... 91
Table 6. 4: Males - Distribution of total vitamin D intake (percentages) across sub-categories .. 92
Table 6. 5: Females- Distribution of total vitamin D intake (percentages) across major categories
.................................................................................................................................................................... 94
Table 6. 6: Females- Distribution of total vitamin D intake (percentages) across sub-categories95
*Note: Each data table in this section has a figure that directly corresponds with the data in thetable. Figures do not include a description as it would be a direct repetition of the data in thepreceding tables.

11
LIST OF FIGURES*
Figure 1. 1: Males and Females - Distribution of total caffeine intake (percentages) across major
categories ......................................................................................................................................... 22
Figure 1. 2: Males and Females - Distribution of total caffeine intake (percentages) across top 10
sub-categories .................................................................................................................................. 23
Figure 1. 3: Males - Distribution of total caffeine intake (percentages) across major categories . 24
Figure 1. 4: Males - Distribution of total caffeine intake (percentages) across top 10 sub-
categories ......................................................................................................................................... 25
Figure 1. 5: Females - Distribution of total caffeine intake (percentages) across major categories
.................................................................................................................................................................... 26
Figure 1. 6: Females - Distribution of total caffeine intake (percentages) across top 10 sub-
categories ......................................................................................................................................... 27
Figure 2. 1: Males and Females - Distribution of total calcium intake (percentages) across major
categories ......................................................................................................................................... 37
Figure 2. 2: Males and Females – Distribution of total calcium intake (percentages) across top
10 sub-categories ............................................................................................................................. 38
Figure 2. 3: Males - Distribution of total calcium intake (percentages) across major categories. 39
Figure 2. 4: Males- Distribution of total calcium intake (percentages) across top 10 sub-
categories ......................................................................................................................................... 40
Figure 2. 5: Females – Distribution of total calcium intake (percentages) across major categories
.................................................................................................................................................................... 41
Figure 2. 6: Females - Distribution of total calcium intake (percentages) across top 10 sub-
categories ......................................................................................................................................... 42
Figure 3. 1: Males and Females – Distribution of total potassium intake (percentages) across
major categories ............................................................................................................................... 52
Figure 3. 2: Males and Females – Distribution of total potassium intake (percentages) top 10
across sub-categories ....................................................................................................................... 53
Figure 3. 3: Males - Distribution of total potassium intake (percentages) across major categories
.................................................................................................................................................................... 54
Figure 3. 4: Males - Distribution of total potassium intake (percentages) across top 10 sub-
categories ......................................................................................................................................... 55
Figure 3. 5: Females - Distribution of total potassium intake (percentages) across major
categories ......................................................................................................................................... 56
Figure 3. 6: Females – Distribution of total potassium intake (percentages) across top 10 sub-
categories ......................................................................................................................................... 57
Figure 4. 1: Males and Females- Distribution of total sodium intake (percentages) across major
categories ......................................................................................................................................... 67
Figure 4. 2: Males and Females- Distribution of total sodium intake (percentages) across top 10
sub-categories .................................................................................................................................. 68
Figure 4. 3: Males - Distribution of total sodium intake (percentages) across major categories . 69
2020 Dietary Guidelines Advisory Committee Data Supplement: Food Category Sources
https://www.dietaryguidelines.gov/2020-advisory-committee-report/data-analysis

12
2020 Dietary Guidelines Advisory Committee Data Supplement: Food Category Sources
https://www.dietaryguidelines.gov/2020-advisory-committee-report/data-analysis
Figure 4. 4: Males - Distribution of total sodium intake (percentages) across top 10 sub-
categories ......................................................................................................................................... 70
Figure 4. 5: Females- Distribution of total sodium intake (percentages) across major categories
.................................................................................................................................................................... 71
Figure 4. 6: Females- Distribution of total sodium intake (percentages) across top 10 sub-
categories ......................................................................................................................................... 72
Figure 5. 1: Males and Females- Distribution of total dietary fiber intake (percentages) across
major categories ............................................................................................................................... 82
Figure 5. 2: Males and Females- Distribution of total dietary fiber intake (percentages) across
top 10 sub-categories ....................................................................................................................... 83
Figure 5. 3: Males - Distribution of total dietary fiber intake (percentages) across major
categories ......................................................................................................................................... 84
Figure 5. 4: Males - Distribution of total dietary fiber intake (percentages) across top 10 sub-
categories ......................................................................................................................................... 85
Figure 5. 5: Females- Distribution of total dietary fiber intake (percentages) across major
categories ......................................................................................................................................... 86
Figure 5. 6: Females- Distribution of total dietary fiber intake (percentages) across top 10 sub-
categories ......................................................................................................................................... 87
Figure 6. 1: Males and Females- Distribution of total vitamin D intake (percentages) across
major categories ............................................................................................................................... 97
Figure 6. 2: Males and Females- Distribution of total vitamin D intake (percentages) across top
10 sub-categories ............................................................................................................................. 98
Figure 6. 3: Males - Distribution of total vitamin D intake (percentages) across major categories
.................................................................................................................................................................... 99
Figure 6. 4: Males - Distribution of total vitamin D intake (percentages) across top 10 sub-
categories ....................................................................................................................................... 100
Figure 6. 5: Females- Distribution of total vitamin D intake (percentages) across major
categories ....................................................................................................................................... 101
Figure 6. 6: Females- Distribution of total vitamin D intake (percentages) across top 10 sub-
categories ....................................................................................................................................... 102
*Note: Each data table in this section has a figure that directly corresponds with the data in thetable. Figures do not include a description as it would be a direct repetition of the data in thepreceding tables.

13
2020 Dietary Guidelines Advisory Committee Data Supplement: Food Category Sources
https://www.dietaryguidelines.gov/2020-advisory-committee-report/data-analysis
Percent of caffeine intake, 2013-16, for U.S. population ages 2 years and older,
from WWEIA Food Categories
These data are estimates of the percent of caffeine from WWEIA Food Categories, re-grouped into DGAC major categories and sub-categories as described elsewhere, for individuals 2 years and older based on the day 1 dietary recalls from What We Eat in America, NHANES 2013-16. Breastfed children, and pregnant and lactating women have been excluded. The sample size is 15,807.
WHOLE SAMPLE (MALES + FEMALES)
Table 1. 1: Males and Females - Distribution of total caffeine intake (percentages) across major categories
DGAC major category Age Groups (Years)
2+ 2-5 6-11 12-19 20-40 41-50 51-70 71+
%
BEVERAGES (Not incl. Milk and 100% Fruit Juice)
81.24 26.08 32.05 61.32 87.07 90.66 92.88 90.78
SNACKS AND SWEETS 12.91 46.60 39.33 26.59 9.99 7.30 5.57 6.86
DAIRY 3.58 20.64 19.65 6.91 1.02 1.28 0.86 1.50
GRAINS 1.88 5.03 8.21 4.63 1.52 0.44 0.57 0.56
PROTEIN FOODS 0.19 0.79 0.41 0.21 0.35 0.01 0.07 0.01
MIXED DISHES 0.08 0.28 0.20 0.26 0.05 0.07 0.00 0.10
FRUITS+FRUIT JUICE 0.06 0.25 0.13 0.00 0.01 0.23 0.01 0.01
CONDIMENTS, GRAVIES, SPREADS, SALAD DRESSINGS
0.00 0.00 0.00 0.00 0.00 0.00 0.00 0.00
VEGETABLES 0.00 0.00 0.00 0.00 0.00 0.00 0.00 0.00
TOTAL* 99.95 99.68 99.99 99.93 100.00 99.99 99.97 99.83
*Totals are less than 100% because results do not include baby foods, infant formulas and WWEIA category – other

14
2020 Dietary Guidelines Advisory Committee Data Supplement: Food Category Sources
https://www.dietaryguidelines.gov/2020-advisory-committee-report/data-analysis
Table 1. 2: Males and Females - Distribution of total caffeine intake (percentages) across sub-categories
DGAC sub-category Age Groups (Years)
2+ 2-5 6-11 12-19 20-40 41-50 51-70 71+
%
COFFEE AND TEA 58.75 14.41 13.20 29.18 55.30 67.78 75.92 81.99
SUGAR-SWEETENED AND DIET BEVERAGES
21.91 11.67 18.86 32.07 30.63 22.18 16.53 8.39
DESSERTS AND SWEET SNACKS 8.19 32.71 27.40 17.53 6.03 4.80 2.52 4.40
CANDY AND SUGARS 4.68 13.87 11.68 8.92 3.92 2.50 3.04 2.46
HIGHER FAT MILK/YOGURT 2.06 14.51 9.80 3.66 0.79 0.75 0.49 0.69
LOWFAT MILK/YOGURT 1.52 6.13 9.84 3.25 0.23 0.53 0.37 0.81
BREAKFAST CEREALS AND BARS 1.37 3.67 5.02 2.52 1.39 0.42 0.56 0.56
ALCOHOLIC BEVERAGES 0.57 0.00 0.00 0.08 1.14 0.70 0.41 0.37
QUICK BREADS (Biscuits, Muffins, Pancakes, Waffles)
0.51 1.37 3.19 2.11 0.12 0.02 0.00 0.00
NUTS, SEEDS, AND SOY 0.19 0.79 0.41 0.21 0.35 0.01 0.07 0.01
BURGERS AND SANDWICHES (incl. Tacos and Burritos)
0.05 0.17 0.11 0.26 0.00 0.00 0.00 0.08
CHIPS, CRACKERS, AND SAVORY SNACKS
0.04 0.02 0.26 0.14 0.04 0.00 0.01 0.00
MEAT, POULTRY, SEAFOOD MIXED DISHES
0.04 0.11 0.09 0.00 0.05 0.07 0.00 0.02
FRUIT (Non-Juice) 0.03 0.25 0.13 0.00 0.01 0.08 0.00 0.01
100 % FRUIT JUICE 0.02 0.00 0.00 0.00 0.00 0.15 0.01 0.00
WATERS 0.01 0.00 0.00 0.00 0.00 0.00 0.02 0.03
CONDIMENTS AND GRAVIES 0.00 0.00 0.00 0.00 0.00 0.00 0.00 0.00
CHEESE 0.00 0.00 0.00 0.00 0.00 0.00 0.00 0.00
DELI/CURED PRODUCTS (Meat and Poultry)
0.00 0.00 0.00 0.00 0.00 0.00 0.00 0.00
EGGS 0.00 0.00 0.00 0.00 0.00 0.00 0.00 0.00

15
2020 Dietary Guidelines Advisory Committee Data Supplement: Food Category Sources
https://www.dietaryguidelines.gov/2020-advisory-committee-report/data-analysis
MEATS (Not incl. Deli and Mixed Dishes)
0.00 0.00 0.00 0.00 0.00 0.00 0.00 0.00
PIZZA 0.00 0.00 0.00 0.00 0.00 0.00 0.00 0.00
POULTRY (Not incl. Deli and Mixed Dishes)
0.00 0.00 0.00 0.00 0.00 0.00 0.00 0.00
RICE AND PASTA 0.00 0.00 0.00 0.00 0.00 0.00 0.00 0.00
RICE, PASTA AND OTHER GRAIN- BASED MIXED DISHEs
0.00 0.00 0.00 0.00 0.00 0.00 0.00 0.00
SALAD DRESSINGS 0.00 0.00 0.00 0.00 0.00 0.00 0.00 0.00
SEAFOOD (Not incl. Mixed Dishes) 0.00 0.00 0.00 0.00 0.00 0.00 0.00 0.00
SOUPS 0.00 0.00 0.00 0.00 0.00 0.00 0.00 0.00
SPREADS 0.00 0.00 0.00 0.00 0.00 0.00 0.00 0.00
STARCHY VEGETABLES 0.00 0.00 0.00 0.00 0.00 0.00 0.00 0.00
VEGETABLES (Incl. Beans and Peas, not Starchy)
0.00 0.00 0.00 0.00 0.00 0.00 0.00 0.00
YEAST BREADS AND TORTILLAS 0.00 0.00 0.00 0.00 0.00 0.00 0.00 0.00
TOTAL* 99.95 99.68 99.99 99.93 100.00 99.99 99.97 99.83
*Totals are less than 100% because results do not include baby foods, infant formulas and WWEIA category – other
(continued from previous page)

16
2020 Dietary Guidelines Advisory Committee Data Supplement: Food Category Sources
https://www.dietaryguidelines.gov/2020-advisory-committee-report/data-analysis
MALES
Table 1. 3: Males - Distribution of total caffeine intake (percentages) across major categories
DGAC major category Age Groups (Years)
2+ 2-5 6-11 12-19 20-40 41-50 51-70 71+
%
BEVERAGES (Not incl. Milk and 100% Fruit Juice)
80.82 24.75 32.19 59.65 88.30 91.30 93.75 89.75
SNACKS AND SWEETS 12.72 45.08 38.78 27.00 8.93 6.10 4.64 7.38
DAIRY 4.15 21.94 21.04 7.28 1.43 1.85 0.77 1.72
GRAINS 1.91 7.11 6.99 5.46 0.99 0.57 0.59 0.75
PROTEIN FOODS 0.21 0.00 0.75 0.11 0.33 0.01 0.15 0.01
MIXED DISHES 0.10 0.30 0.24 0.50 0.01 0.15 0.00 0.00
FRUITS+FRUIT JUICE 0.02 0.43 0.00 0.00 0.00 0.02 0.02 0.00
CONDIMENTS, GRAVIES, SPREADS, SALAD DRESSINGS
0.00 0.00 0.00 0.00 0.00 0.00 0.00 0.00
VEGETABLES 0.00 0.00 0.00 0.00 0.00 0.00 0.00 0.00
TOTAL* 99.93 99.60 99.98 100.00 100.00 100.00 99.94 99.62
*Totals are less than 100% because results do not include baby foods, infant formulas and WWEIA category – other

17
2020 Dietary Guidelines Advisory Committee Data Supplement: Food Category Sources
https://www.dietaryguidelines.gov/2020-advisory-committee-report/data-analysis
Table 1. 4: Males - Distribution of total caffeine intake (percentages) across sub-categories
DGAC sub-category Age Groups (Years)
2+ 2-5 6-11 12-19 20-40 41-50 51-70 71+
%
COFFEE AND TEA 55.86 13.94 11.64 24.13 53.80 65.08 74.82 81.09
SUGAR-SWEETENED AND DIET BEVERAGES
24.26 10.81 20.55 35.46 33.37 25.20 18.35 7.94
DESSERTS AND SWEET SNACKS 8.47 29.68 27.29 19.18 5.74 3.79 2.45 4.97
CANDY AND SUGARS 4.20 15.37 11.34 7.60 3.14 2.31 2.18 2.42
HIGHER FAT MILK/YOGURT 2.35 15.66 9.27 3.61 1.20 0.89 0.61 0.76
LOWFAT MILK/YOGURT 1.80 6.28 11.78 3.67 0.22 0.96 0.17 0.96
BREAKFAST CEREALS AND BARS 1.29 5.50 3.53 2.83 0.81 0.55 0.59 0.74
ALCOHOLIC BEVERAGES 0.69 0.00 0.00 0.06 1.12 1.02 0.58 0.71
QUICK BREADS (Biscuits, Muffins, Pancakes, Waffles)
0.63 1.61 3.46 2.63 0.18 0.02 0.01 0.00
NUTS, SEEDS, AND SOY 0.21 0.00 0.75 0.11 0.33 0.01 0.15 0.01
BURGERS AND SANDWICHES (incl. Tacos and Burritos)
0.06 0.15 0.07 0.50 0.00 0.00 0.00 0.00
CHIPS, CRACKERS, AND SAVORY SNACKS
0.05 0.03 0.15 0.22 0.05 0.00 0.01 0.00
MEAT, POULTRY, SEAFOOD MIXED DISHES
0.04 0.15 0.17 0.00 0.01 0.15 0.00 0.00
FRUIT (Non-Juice) 0.02 0.43 0.00 0.00 0.00 0.02 0.00 0.00
100 % FRUIT JUICE 0.01 0.00 0.00 0.00 0.00 0.00 0.02 0.00
WATERS 0.00 0.00 0.00 0.00 0.01 0.00 0.01 0.00
CONDIMENTS AND GRAVIES 0.00 0.00 0.00 0.00 0.00 0.00 0.00 0.00
CHEESE 0.00 0.00 0.00 0.00 0.00 0.00 0.00 0.00
DELI/CURED PRODUCTS (Meat and Poultry)
0.00 0.00 0.00 0.00 0.00 0.00 0.00 0.00
EGGS 0.00 0.00 0.00 0.00 0.00 0.00 0.00 0.00

18
2020 Dietary Guidelines Advisory Committee Data Supplement: Food Category Sources
https://www.dietaryguidelines.gov/2020-advisory-committee-report/data-analysis
MEATS (Not incl. Deli and Mixed Dishes)
0.00 0.00 0.00 0.00 0.00 0.00 0.00 0.00
PIZZA 0.00 0.00 0.00 0.00 0.00 0.00 0.00 0.00
POULTRY (Not incl. Deli and Mixed Dishes)
0.00 0.00 0.00 0.00 0.00 0.00 0.00 0.00
RICE AND PASTA 0.00 0.00 0.00 0.00 0.00 0.00 0.00 0.00
RICE, PASTA AND OTHER GRAIN- BASED MIXED DISHEs
0.00 0.00 0.00 0.00 0.00 0.00 0.00 0.00
SALAD DRESSINGS 0.00 0.00 0.00 0.00 0.00 0.00 0.00 0.00
SEAFOOD (Not incl. Mixed Dishes) 0.00 0.00 0.00 0.00 0.00 0.00 0.00 0.00
SOUPS 0.00 0.00 0.00 0.00 0.00 0.00 0.00 0.00
SPREADS 0.00 0.00 0.00 0.00 0.00 0.00 0.00 0.00
STARCHY VEGETABLES 0.00 0.00 0.00 0.00 0.00 0.00 0.00 0.00
VEGETABLES (Incl. Beans and Peas, not Starchy)
0.00 0.00 0.00 0.00 0.00 0.00 0.00 0.00
YEAST BREADS AND TORTILLAS 0.00 0.00 0.00 0.00 0.00 0.00 0.00 0.00
TOTAL* 99.93 99.60 99.98 100.00 100.00 100.00 99.94 99.62
*Totals are less than 100% because results do not include baby foods, infant formulas and WWEIA category – other
(continued from previous page)

19
2020 Dietary Guidelines Advisory Committee Data Supplement: Food Category Sources
https://www.dietaryguidelines.gov/2020-advisory-committee-report/data-analysis
FEMALES
Table 1. 5: Females - Distribution of total caffeine intake (percentages) across major categories
DGAC major category Age Groups (Years)
2+ 2-5 6-11 12-19 20-40 41-50 51-70 71+
%
BEVERAGES (Not incl. Milk and 100% Fruit Juice)
81.08 27.35 31.89 63.05 85.72 90.07 92.08 91.61
SNACKS AND SWEETS 13.53 48.02 39.99 26.16 11.13 8.41 6.44 6.44
DAIRY 3.17 19.42 18.00 6.54 0.58 0.75 0.94 1.33
GRAINS 1.86 3.08 9.65 3.77 2.09 0.32 0.54 0.41
PROTEIN FOODS 0.18 1.54 0.02 0.30 0.36 0.01 0.00 0.00
FRUITS+FRUIT JUICE 0.09 0.08 0.28 0.00 0.01 0.42 0.00 0.03
MIXED DISHES 0.07 0.26 0.16 0.02 0.10 0.00 0.00 0.18
CONDIMENTS, GRAVIES, SPREADS, SALAD DRESSINGS
0.00 0.00 0.00 0.00 0.01 0.00 0.00 0.00
VEGETABLES 0.00 0.00 0.00 0.00 0.00 0.00 0.00 0.00
TOTAL* 99.97 99.75 100.00 99.85 100.00 99.98 100.00 100.00
*Totals are less than 100% because results do not include baby foods, infant formulas and WWEIA category – other

20
2020 Dietary Guidelines Advisory Committee Data Supplement: Food Category Sources
https://www.dietaryguidelines.gov/2020-advisory-committee-report/data-analysis
Table 1. 6: Females - Distribution of total caffeine intake (percentages) across sub-categories
DGAC sub-category Age Groups (Years)
2+ 2-5 6-11 12-19 20-40 41-50 51-70 71+
%
COFFEE AND TEA 61.14 14.86 15.04 34.40 56.93 70.26 76.93 82.71
SUGAR-SWEETENED AND DIET BEVERAGES
19.46 12.49 16.85 28.55 27.64 19.39 14.85 8.76
DESSERTS AND SWEET SNACKS 8.28 35.56 27.53 15.83 6.34 5.73 2.60 3.95
CANDY AND SUGARS 5.21 12.46 12.08 10.28 4.77 2.68 3.84 2.49
HIGHER FAT MILK/YOGURT 1.89 13.43 10.44 3.72 0.35 0.63 0.39 0.64
BREAKFAST CEREALS AND BARS 1.48 1.94 6.78 2.21 2.03 0.30 0.54 0.41
LOWFAT MILK/YOGURT 1.28 5.99 7.57 2.82 0.23 0.13 0.55 0.69
ALCOHOLIC BEVERAGES 0.46 0.00 0.00 0.10 1.16 0.41 0.26 0.09
QUICK BREADS (Biscuits, Muffins, Pancakes, Waffles)
0.38 1.14 2.88 1.56 0.06 0.01 0.00 0.00
NUTS, SEEDS, AND SOY 0.18 1.54 0.02 0.30 0.36 0.01 0.00 0.00
FRUIT (Non-Juice) 0.05 0.08 0.28 0.00 0.01 0.14 0.00 0.03
100 % FRUIT JUICE 0.04 0.00 0.00 0.00 0.00 0.28 0.00 0.00
CHIPS, CRACKERS, AND SAVORY SNACKS 0.04 0.00 0.38 0.05 0.02 0.01 0.00 0.00
BURGERS AND SANDWICHES (incl. Tacos and Burritos)
0.03 0.19 0.16 0.02 0.00 0.00 0.00 0.15
MEAT, POULTRY, SEAFOOD MIXED DISHES
0.03 0.07 0.01 0.00 0.10 0.00 0.00 0.03
WATERS 0.02 0.00 0.00 0.00 0.00 0.00 0.03 0.05
CONDIMENTS AND GRAVIES 0.00 0.00 0.00 0.00 0.01 0.00 0.00 0.00
CHEESE 0.00 0.00 0.00 0.00 0.00 0.00 0.00 0.00
DELI/CURED PRODUCTS (Meat and Poultry)
0.00 0.00 0.00 0.00 0.00 0.00 0.00 0.00
EGGS 0.00 0.00 0.00 0.00 0.00 0.00 0.00 0.00

21
2020 Dietary Guidelines Advisory Committee Data Supplement: Food Category Sources
https://www.dietaryguidelines.gov/2020-advisory-committee-report/data-analysis
MEATS (Not incl. Deli and Mixed Dishes) 0.00 0.00 0.00 0.00 0.00 0.00 0.00 0.00
PIZZA 0.00 0.00 0.00 0.00 0.00 0.00 0.00 0.00
POULTRY (Not incl. Deli and Mixed Dishes) 0.00 0.00 0.00 0.00 0.00 0.00 0.00 0.00
RICE AND PASTA 0.00 0.00 0.00 0.00 0.00 0.00 0.00 0.00
RICE, PASTA AND OTHER GRAIN-BASED MIXED DISHES
0.00 0.00 0.00 0.00 0.00 0.00 0.00 0.00
SALAD DRESSINGS 0.00 0.00 0.00 0.00 0.00 0.00 0.00 0.00
SEAFOOD (Not incl. Mixed Dishes) 0.00 0.00 0.00 0.00 0.00 0.00 0.00 0.00
SOUPS 0.00 0.00 0.00 0.00 0.00 0.00 0.00 0.00
SPREADS 0.00 0.00 0.00 0.00 0.00 0.00 0.00 0.00
STARCHY VEGETABLES 0.00 0.00 0.00 0.00 0.00 0.00 0.00 0.00
VEGETABLES (Incl. Beans and Peas, not Starchy)
0.00 0.00 0.00 0.00 0.00 0.00 0.00 0.00
YEAST BREADS AND TORTILLAS 0.00 0.00 0.00 0.00 0.00 0.00 0.00 0.00
TOTAL* 99.97 99.75 100.00 99.85 100.00 99.98 100.00 100.00
*Totals are less than 100% because results do not include baby foods, infant formulas and WWEIA category – other
(continued from previous page)

22
2020 Dietary Guidelines Advisory Committee Data Supplement: Food Category Sources
https://www.dietaryguidelines.gov/2020-advisory-committee-report/data-analysis
100
90
80
70
60
50
40
30
20
10
0
Figure 1. 1: Males and Females - Distribution of total caffeine intake (percentages) across major categories
71+ 12-19 years 20-40 years 41-50 years 51-70 years6-11 years 2-5 years 2+
DAIRY
MIXED DISHES
PROTEIN FOODS
GRAINS
FRUITS+FRUIT JUICE
BEVERAGES (Not incl. Milk and 100% Fruit Juice)
SNACKS AND SWEETS
VEGETABLES
CONDIMENTS, GRAVIES, SPREADS, SALAD DRESSINGS
%

23
2020 Dietary Guidelines Advisory Committee Data Supplement: Food Category Sources
https://www.dietaryguidelines.gov/2020-advisory-committee-report/data-analysis
Figure 1. 2: Males and Females - Distribution of total caffeine intake (percentages) across top 10 sub- categories
100
90
80
70
60
50
40
30
20
10
0 2+ 2-5 years 6-11 years 12-19 years 20-40 years 41-50 years 51-70 years 71+
COFFEE AND TEA SUGAR-SWEETENED AND DIET BEVERAGES
DESSERTS AND SWEET SNACKS CANDY AND SUGARS
HIGHER FAT MILK/YOGURT LOWFAT MILK/YOGURT
BREAKFAST CEREALS AND BARS ALCOHOLIC BEVERAGES
QUICK BREADS (Biscuits, Muffins, Pancakes, Waffles) NUTS, SEEDS, AND SOY
%

24
2020 Dietary Guidelines Advisory Committee Data Supplement: Food Category Sources
https://www.dietaryguidelines.gov/2020-advisory-committee-report/data-analysis
Figure 1. 3: Males - Distribution of total caffeine intake (percentages) across major categories
100
90
80
70
60
50
40
30
20
10
0 2+
DAIRY
2-5 years 6-11 years 12-19 years 20-40 years 41-50 years 51-70 years
PROTEIN FOODS
71+
MIXED DISHES GRAINS
SNACKS AND SWEETS FRUITS+FRUIT JUICE
VEGETABLES BEVERAGES (Not incl. Milk and 100% Fruit Juice)
CONDIMENTS, GRAVIES, SPREADS, SALAD DRESSINGS
%
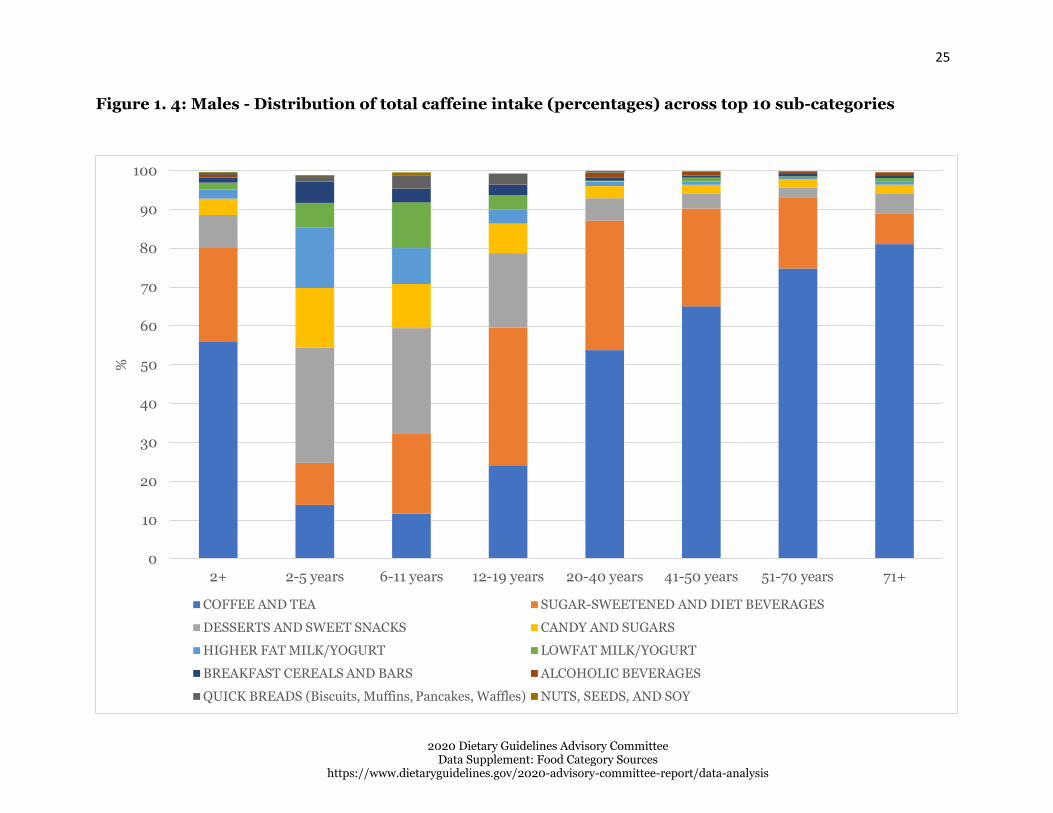
25
2020 Dietary Guidelines Advisory Committee Data Supplement: Food Category Sources
https://www.dietaryguidelines.gov/2020-advisory-committee-report/data-analysis
Figure 1. 4: Males - Distribution of total caffeine intake (percentages) across top 10 sub-categories
100
90
80
70
60
50
40
30
20
10
0 2+ 2-5 years 6-11 years 12-19 years 20-40 years 41-50 years 51-70 years 71+
COFFEE AND TEA SUGAR-SWEETENED AND DIET BEVERAGES
DESSERTS AND SWEET SNACKS CANDY AND SUGARS
HIGHER FAT MILK/YOGURT LOWFAT MILK/YOGURT
BREAKFAST CEREALS AND BARS ALCOHOLIC BEVERAGES
QUICK BREADS (Biscuits, Muffins, Pancakes, Waffles) NUTS, SEEDS, AND SOY
%

26
2020 Dietary Guidelines Advisory Committee Data Supplement: Food Category Sources
https://www.dietaryguidelines.gov/2020-advisory-committee-report/data-analysis
Figure 1. 5: Females - Distribution of total caffeine intake (percentages) across major categories
100
90
80
70
60
50
40
30
20
10
0 2+
DAIRY
MIXED DISHES
2-5 years 6-11 years 12-19 years 20-40 years 41-50 years 51-70 years
PROTEIN FOODS
GRAINS
71+
SNACKS AND SWEETS FRUITS+FRUIT JUICE
VEGETABLES BEVERAGES (Not incl. Milk and 100% Fruit Juice)
CONDIMENTS, GRAVIES, SPREADS, SALAD DRESSINGS
%

27
2020 Dietary Guidelines Advisory Committee Data Supplement: Food Category Sources
https://www.dietaryguidelines.gov/2020-advisory-committee-report/data-analysis
Figure 1. 6: Females - Distribution of total caffeine intake (percentages) across top 10 sub-categories
100
90
80
70
60
50
40
30
20
10
0 2+ 2-5 years 6-11 years 12-19 years 20-40 years 41-50 years 51-70 years 71+
COFFEE AND TEA SUGAR-SWEETENED AND DIET BEVERAGES
DESSERTS AND SWEET SNACKS CANDY AND SUGARS
HIGHER FAT MILK/YOGURT BREAKFAST CEREALS AND BARS
LOWFAT MILK/YOGURT ALCOHOLIC BEVERAGES
QUICK BREADS (Biscuits, Muffins, Pancakes, Waffles) NUTS, SEEDS, AND SOY
%

28
2020 Dietary Guidelines Advisory Committee Data Supplement: Food Category Sources
https://www.dietaryguidelines.gov/2020-advisory-committee-report/data-analysis
Percent of calcium intake, 2013-16, for U.S. population ages 2 years and older,
from WWEIA Food Categories
These data are estimates of the percent of calcium from WWEIA Food Categories, re-grouped into DGAC major categories and sub-categories as described elsewhere, for individuals 2 years and older based on the day 1 dietary recalls from What WWEIA, NHANES 2013-16. Breastfed children, and pregnant and lactating women have been excluded. The sample size is 15,807.
WHOLE SAMPLE (MALES + FEMALES)
Table 2. 1: Males and Females – Distribution of total calcium intake (percentages) across major categories
DGAC major category Age Groups (Years)
2+ 2-5 6-11 12-19 20-40 41-50 51-70 71+
%
MIXED DISHES 30.41 21.23 29.40 34.27 35.18 31.35 27.41 24.13
DAIRY 20.86 45.84 33.79 25.29 14.94 15.23 18.90 21.50
BEVERAGES (Not incl. Milk and 100% Fruit Juice)
16.34 4.90 6.37 11.03 19.86 20.97 18.60 14.42
GRAINS 8.81 8.70 10.58 9.12 7.15 8.21 9.44 11.08
SNACKS AND SWEETS 7.53 6.91 9.04 7.86 6.38 7.03 7.77 9.66
VEGETABLES 6.46 2.58 2.87 4.77 6.68 7.48 7.84 7.96
PROTEIN FOODS 5.30 3.68 3.26 3.97 5.66 6.12 5.92 5.62
FRUITS+FRUIT JUICE 2.52 4.04 3.05 2.23 2.12 2.17 2.36 3.76
CONDIMENTS, GRAVIES, SPREADS, SALAD DRESSINGS
0.96 0.46 0.80 0.88 1.14 0.95 0.98 0.94
TOTAL* 99.19 98.34 99.15 99.42 99.12 99.52 99.21 99.08
*Totals are less than 100% because results do not include baby foods, infant formulas and WWEIA category – other

29
2020 Dietary Guidelines Advisory Committee Data Supplement: Food Category Sources
https://www.dietaryguidelines.gov/2020-advisory-committee-report/data-analysis
Table 2. 2: Males and Females - Distribution of total calcium intake (percentages) across sub-categories
DGAC sub-category Age Groups (Years)
2+ 2-5 6-11 12-19 20-40 41-50 51-70 71+
%
BURGERS AND SANDWICHES (incl. Tacos and Burritos)
17.44 11.19 14.92 18.38 20.78 17.86 16.42 14.07
HIGHER FAT MILK/YOGURT 11.33 29.76 19.04 14.80 7.62 8.48 9.20 11.20
WATERS 8.35 3.34 4.12 7.18 10.21 10.04 9.00 6.35
RICE, PASTA AND OTHER GRAIN-BASED MIXED DISHES
4.95 4.56 5.85 5.60 5.49 5.36 4.08 3.80
VEGETABLES (Incl. Beans and Peas, not Starchy)
4.95 1.79 1.86 3.05 5.10 6.04 6.24 6.22
LOWFAT MILK/YOGURT 4.89 9.66 10.31 6.40 2.62 3.45 4.37 6.00
PIZZA 4.89 4.53 6.92 7.96 6.03 4.34 2.98 2.09
DESSERTS AND SWEET SNACKS 4.82 3.99 5.48 4.59 3.90 4.31 5.09 7.78
CHEESE 4.64 6.42 4.43 4.10 4.70 3.29 5.32 4.30
SUGAR-SWEETENED AND DIET BEVERAGES
3.71 1.43 1.94 2.31 4.69 4.66 3.75 3.76
COFFEE AND TEA 3.32 0.12 0.30 1.45 3.66 4.70 4.52 3.77
YEAST BREADS AND TORTILLAS 3.29 1.77 2.58 2.61 2.78 3.63 4.00 4.69
BREAKFAST CEREALS AND BARS 3.18 4.37 4.21 3.44 2.59 2.41 3.16 4.28
MEAT, POULTRY, SEAFOOD MIXED DISHES
2.03 0.46 1.01 1.66 1.93 2.35 2.60 2.54
QUICK BREADS (Biscuits, Muffins, Pancakes, Waffles)
1.94 2.34 3.49 2.70 1.32 1.73 1.88 1.77
EGGS 1.92 1.68 1.29 1.16 2.12 2.13 2.00 2.44
CHIPS, CRACKERS, AND SAVORY SNACKS
1.85 2.24 2.61 2.37 1.68 1.95 1.75 1.00
STARCHY VEGETABLES 1.51 0.79 1.01 1.72 1.58 1.44 1.59 1.75
100 % FRUIT JUICE 1.28 2.58 1.77 1.17 1.09 1.12 0.97 1.89
FRUIT (Non-Juice) 1.25 1.46 1.28 1.06 1.02 1.06 1.39 1.87

30
2020 Dietary Guidelines Advisory Committee Data Supplement: Food Category Sources
https://www.dietaryguidelines.gov/2020-advisory-committee-report/data-analysis
SOUPS 1.10 0.49 0.70 0.68 0.96 1.44 1.32 1.63
POULTRY (Not incl. Deli and Mixed Dishes)
1.00 0.75 0.83 1.32 1.22 1.02 0.87 0.58
ALCOHOLIC BEVERAGES 0.97 0.00 0.00 0.08 1.31 1.58 1.32 0.54
NUTS, SEEDS, AND SOY 0.91 0.23 0.30 0.44 0.84 1.16 1.39 0.98
CANDY AND SUGARS 0.85 0.69 0.95 0.91 0.80 0.77 0.93 0.89
CONDIMENTS AND GRAVIES 0.69 0.34 0.51 0.66 0.87 0.68 0.69 0.49
SEAFOOD (Not incl. Mixed Dishes) 0.66 0.21 0.22 0.32 0.66 1.01 0.78 0.86
MEATS (Not incl. Deli and Mixed Dishes) 0.55 0.20 0.28 0.50 0.62 0.61 0.63 0.49
RICE AND PASTA 0.40 0.21 0.30 0.37 0.47 0.45 0.40 0.34
DELI/CURED PRODUCTS (Meat and Poultry)
0.25 0.61 0.34 0.22 0.20 0.18 0.25 0.27
SPREADS 0.23 0.09 0.24 0.18 0.21 0.23 0.25 0.43
SALAD DRESSINGS 0.05 0.04 0.05 0.04 0.06 0.04 0.05 0.02
TOTAL* 99.19 98.34 99.15 99.42 99.12 99.52 99.21 99.08
*Totals are less than 100% because results do not include baby foods, infant formulas and WWEIA category – other
(continued from previous page)

31
2020 Dietary Guidelines Advisory Committee Data Supplement: Food Category Sources
https://www.dietaryguidelines.gov/2020-advisory-committee-report/data-analysis
MALES
Table 2. 3: Males - Distribution of total calcium intake (percentages) across major categories
DGAC major category Age Groups (Years)
2+ 2-5 6-11 12-19 20-40 41-50 51-70 71+
%
MIXED DISHES 32.58 22.62 30.43 35.98 38.85 34.46 30.11 24.60
DAIRY 21.01 43.78 34.70 26.54 14.83 14.94 17.92 21.18
BEVERAGES (Not incl. Milk and 100% Fruit Juice)
14.67 5.33 6.30 9.48 18.58 18.34 16.86 13.19
GRAINS 8.57 8.87 9.65 9.00 6.81 8.16 9.65 11.44
SNACKS AND SWEETS 7.04 6.77 8.64 7.54 5.57 6.76 8.06 8.93
VEGETABLES 5.74 2.53 2.70 3.96 5.55 7.33 7.27 8.25
PROTEIN FOODS 5.43 3.69 3.05 3.94 5.79 6.66 6.04 7.07
FRUITS+FRUIT JUICE 2.40 4.20 2.97 2.15 2.08 2.03 2.25 3.39
CONDIMENTS, GRAVIES, SPREADS, SALAD DRESSINGS
0.91 0.53 0.67 0.69 1.10 0.95 1.01 0.82
TOTAL* 98.35 98.32 99.11 99.27 99.17 99.63 99.18 98.87
*Totals are less than 100% because results do not include baby foods, infant formulas and WWEIA category – other

32
2020 Dietary Guidelines Advisory Committee Data Supplement: Food Category Sources
https://www.dietaryguidelines.gov/2020-advisory-committee-report/data-analysis
Table 2. 4: Males - Distribution of total calcium intake (percentages) across sub-categories
DGAC sub-category Age Groups (Years)
2+ 2-5 6-11 12-19 20-40 41-50 51-70 71+
%
BURGERS AND SANDWICHES (incl. Tacos and Burritos)
19.49 12.38 15.35 20.02 23.99 20.90 18.86 15.46
HIGHER FAT MILK/YOGURT 12.07 28.56 19.34 16.72 8.31 8.46 8.78 11.32
WATERS 7.13 3.51 3.95 6.41 9.29 8.62 7.16 5.02
PIZZA 5.12 5.29 7.55 8.28 6.59 3.60 3.26 1.41
RICE, PASTA AND OTHER GRAIN- BASED MIXED DISHEs
4.90 4.22 5.70 5.23 5.50 6.11 3.79 3.83
LOWFAT MILK/YOGURT 4.79 9.36 11.27 6.55 2.34 3.67 4.01 6.00
DESSERTS AND SWEET SNACKS 4.46 3.70 5.10 4.54 3.45 4.17 5.09 7.39
VEGETABLES (Incl. Beans and Peas, not Starchy)
4.23 1.87 1.60 2.45 4.00 5.86 5.54 6.30
CHEESE 4.15 5.86 4.08 3.26 4.18 2.81 5.13 3.87
SUGAR-SWEETENED AND DIET BEVERAGES
3.45 1.69 2.15 2.27 4.56 3.52 3.54 3.63
YEAST BREADS AND TORTILLAS 3.26 2.07 2.05 2.34 2.69 3.85 4.41 4.94
BREAKFAST CEREALS AND BARS 2.99 3.90 3.97 3.39 2.41 2.40 2.82 4.32
COFFEE AND TEA 2.79 0.13 0.20 0.68 3.09 3.78 4.30 3.71
MEAT, POULTRY, SEAFOOD MIXED DISHES
2.03 0.38 0.97 1.84 1.99 2.21 2.85 2.21
QUICK BREADS (Biscuits, Muffins, Pancakes, Waffles)
1.93 2.67 3.37 2.96 1.29 1.37 1.97 1.83
EGGS 1.89 1.62 1.17 1.20 2.00 2.22 1.87 3.20
CHIPS, CRACKERS, AND SAVORY SNACKS
1.82 2.38 2.48 2.09 1.49 1.92 2.07 0.87
STARCHY VEGETABLES 1.51 0.66 1.10 1.51 1.55 1.48 1.73 1.95
100 % FRUIT JUICE 1.32 2.80 1.72 1.20 1.22 1.14 1.04 1.79
ALCOHOLIC BEVERAGES 1.30 0.00 0.00 0.12 1.64 2.41 1.85 0.82

33
2020 Dietary Guidelines Advisory Committee Data Supplement: Food Category Sources
https://www.dietaryguidelines.gov/2020-advisory-committee-report/data-analysis
POULTRY (Not incl. Deli and Mixed Dishes)
1.13 0.82 0.90 1.39 1.41 1.27 0.96 0.77
FRUIT (Non-Juice) 1.07 1.40 1.24 0.95 0.86 0.88 1.21 1.59
SOUPS 1.05 0.36 0.86 0.61 0.77 1.64 1.34 1.70
NUTS, SEEDS, AND SOY 0.83 0.19 0.23 0.35 0.77 1.06 1.36 1.02
CANDY AND SUGARS 0.76 0.69 1.06 0.91 0.63 0.67 0.89 0.66
CONDIMENTS AND GRAVIES 0.66 0.41 0.45 0.55 0.85 0.66 0.73 0.44
SEAFOOD (Not incl. Mixed Dishes) 0.66 0.32 0.16 0.28 0.67 1.20 0.72 1.08
MEATS (Not incl. Deli and Mixed Dishes)
0.64 0.18 0.26 0.56 0.74 0.68 0.83 0.63
RICE AND PASTA 0.40 0.24 0.26 0.31 0.43 0.55 0.45 0.35
DELI/CURED PRODUCTS (Meat and Poultry)
0.27 0.57 0.32 0.16 0.20 0.22 0.31 0.37
SPREADS 0.20 0.07 0.16 0.11 0.18 0.25 0.25 0.36
SALAD DRESSINGS 0.04 0.05 0.06 0.02 0.06 0.04 0.03 0.02
TOTAL* 98.35 98.32 99.11 99.27 99.17 99.63 99.18 98.87
*Totals are less than 100% because results do not include baby foods, infant formulas and WWEIA category – other
(continued from previous page)

34
2020 Dietary Guidelines Advisory Committee Data Supplement: Food Category Sources
https://www.dietaryguidelines.gov/2020-advisory-committee-report/data-analysis
FEMALES
Table 2. 5: Females - Distribution of total calcium intake (percentages) across major categories
DGAC major category Age Groups (Years)
2+ 2-5 6-11 12-19 20-40 41-50 51-70 71+
%
MIXED DISHES 27.33 19.93 28.23 32.52 31.05 28.53 24.94 23.77
DAIRY 21.38 47.75 32.75 24.02 15.06 15.49 19.78 21.74
BEVERAGES (Not incl. Milk and 100% Fruit Juice)
17.45 4.50 6.44 12.61 21.31 23.37 20.18 15.39
GRAINS 8.86 8.54 11.64 9.25 7.54 8.25 9.25 10.79
SNACKS AND SWEETS 7.79 7.05 9.50 8.19 7.29 7.28 7.51 10.24
VEGETABLES 6.99 2.63 3.06 5.59 7.96 7.61 8.36 7.74
PROTEIN FOODS 5.03 3.67 3.50 4.00 5.51 5.63 5.81 4.48
FRUITS+FRUIT JUICE 2.61 3.89 3.15 2.32 2.16 2.31 2.46 4.06
CONDIMENTS, GRAVIES, SPREADS, SALAD DRESSINGS
0.99 0.40 0.94 1.07 1.18 0.95 0.96 1.03
TOTAL* 98.44 98.36 99.20 99.57 99.06 99.42 99.24 99.24
*Totals are less than 100% because results do not include baby foods, infant formulas and WWEIA category – other

35
2020 Dietary Guidelines Advisory Committee Data Supplement: Food Category Sources
https://www.dietaryguidelines.gov/2020-advisory-committee-report/data-analysis
Table 2. 6: Females - Distribution of total calcium intake (percentages) across sub-categories
DGAC sub-category Age Groups (Years)
2+ 2-5 6-11 12-19 20-40 41-50 51-70 71+
%
BURGERS AND SANDWICHES (incl. Tacos and Burritos)
14.80 10.07 14.43 16.71 17.14 15.10 14.19 12.99
HIGHER FAT MILK/YOGURT 11.44 30.89 18.70 12.82 6.84 8.51 9.59 11.12
WATERS 9.27 3.18 4.32 7.96 11.24 11.33 10.68 7.39
VEGETABLES (Incl. Beans and Peas, not Starchy) 5.51 1.72 2.15 3.66 6.34 6.20 6.88 6.15
CHEESE 5.03 6.93 4.84 4.96 5.29 3.74 5.49 4.63
DESSERTS AND SWEET SNACKS 5.02 4.25 5.92 4.64 4.42 4.43 5.09 8.08
LOWFAT MILK/YOGURT 4.92 9.93 9.22 6.24 2.93 3.25 4.69 5.99
RICE, PASTA AND OTHER GRAIN-BASED MIXED DISHEs
4.91 4.89 6.01 5.97 5.47 4.67 4.35 3.78
PIZZA 4.52 3.82 6.20 7.63 5.40 5.02 2.72 2.62
SUGAR-SWEETENED AND DIET BEVERAGES 3.86 1.20 1.70 2.36 4.85 5.69 3.94 3.86
COFFEE AND TEA 3.72 0.11 0.41 2.25 4.30 5.53 4.72 3.82
BREAKFAST CEREALS AND BARS 3.35 4.81 4.48 3.49 2.79 2.41 3.47 4.24
YEAST BREADS AND TORTILLAS 3.22 1.50 3.20 2.88 2.89 3.43 3.63 4.50
MEAT, POULTRY, SEAFOOD MIXED DISHES 1.98 0.54 1.06 1.47 1.86 2.49 2.37 2.81
EGGS 1.92 1.73 1.42 1.12 2.26 2.05 2.12 1.85
QUICK BREADS (Biscuits, Muffins, Pancakes, Waffles)
1.91 2.04 3.62 2.44 1.36 2.06 1.81 1.72
CHIPS, CRACKERS, AND SAVORY SNACKS 1.86 2.11 2.77 2.65 1.89 1.98 1.46 1.10
STARCHY VEGETABLES 1.48 0.90 0.91 1.92 1.62 1.42 1.47 1.59
FRUIT (Non-Juice) 1.39 1.52 1.32 1.17 1.21 1.21 1.56 2.09
100 % FRUIT JUICE 1.22 2.37 1.83 1.14 0.95 1.09 0.90 1.97
SOUPS 1.11 0.61 0.52 0.74 1.17 1.26 1.30 1.57
NUTS, SEEDS, AND SOY 0.96 0.27 0.38 0.53 0.91 1.26 1.41 0.94

36
2020 Dietary Guidelines Advisory Committee Data Supplement: Food Category Sources
https://www.dietaryguidelines.gov/2020-advisory-committee-report/data-analysis
CANDY AND SUGARS 0.92 0.69 0.82 0.90 0.98 0.86 0.96 1.06
POULTRY (Not incl. Deli and Mixed Dishes) 0.84 0.69 0.76 1.25 1.00 0.80 0.79 0.43
CONDIMENTS AND GRAVIES 0.68 0.27 0.58 0.78 0.90 0.69 0.65 0.52
SEAFOOD (Not incl. Mixed Dishes) 0.63 0.12 0.28 0.36 0.64 0.84 0.84 0.69
ALCOHOLIC BEVERAGES 0.60 0.00 0.00 0.05 0.93 0.82 0.84 0.31
MEATS (Not incl. Deli and Mixed Dishes) 0.44 0.21 0.31 0.44 0.49 0.55 0.45 0.38
RICE AND PASTA 0.38 0.19 0.34 0.44 0.51 0.36 0.34 0.33
SPREADS 0.25 0.10 0.32 0.24 0.23 0.22 0.24 0.48
DELI/CURED PRODUCTS (Meat and Poultry) 0.23 0.66 0.35 0.28 0.20 0.14 0.20 0.19
SALAD DRESSINGS 0.05 0.03 0.04 0.05 0.06 0.04 0.07 0.03
TOTAL* 98.44 98.36 99.20 99.57 99.06 99.42 99.24 99.24
*Totals are less than 100% because results do not include baby foods, infant formulas and WWEIA category – other
(continued from previous page)

37
2020 Dietary Guidelines Advisory Committee Data Supplement: Food Category Sources
https://www.dietaryguidelines.gov/2020-advisory-committee-report/data-analysis
Figure 2. 1: Males and Females - Distribution of total calcium intake (percentages) across major categories
100
90
80
70
60
50
40
30
20
10
0 2+
DAIRY
MIXED DISHES
2-5 years 6-11 years 12-19 years 20-40 years 41-50 years 51-70 years
PROTEIN FOODS
GRAINS
71+
SNACKS AND SWEETS FRUITS+FRUIT JUICE
VEGETABLES BEVERAGES (Not incl. Milk and 100% Fruit Juice)
CONDIMENTS, GRAVIES, SPREADS, SALAD DRESSINGS
%

38
2020 Dietary Guidelines Advisory Committee Data Supplement: Food Category Sources
https://www.dietaryguidelines.gov/2020-advisory-committee-report/data-analysis
Figure 2. 2: Males and Females – Distribution of total calcium intake (percentages) across top 10 sub-categories
100
90
80
70
60
50
40
30
20
10
0 2+ 2-5 years 6-11 years 12-19 years 20-40 years 41-50 years 51-70 years 71+
BURGERS AND SANDWICHES (incl. tacos and burritos) HIGHER FAT MILK/YOGURT
WATERS RICE, PASTA AND OTHER GRAIN-BASED MIXED DISHEs
VEGETABLES (Incl. Beans and Peas, not Starchy) LOWFAT MILK/YOGURT
PIZZA DESSERTS AND SWEET SNACKS
CHEESE SUGAR-SWEETENED AND DIET BEVERAGES
%

39
2020 Dietary Guidelines Advisory Committee Data Supplement: Food Category Sources
https://www.dietaryguidelines.gov/2020-advisory-committee-report/data-analysis
Figure 2. 3: Males - Distribution of total calcium intake (percentages) across major categories
100
90
80
70
60
50
40
30
20
10
0 2+
DAIRY
MIXED DISHES
2-5 years 6-11 years 12-19 years 20-40 years 41-50 years 51-70 years
PROTEIN FOODS
GRAINS
71+
SNACKS AND SWEETS FRUITS+FRUIT JUICE
VEGETABLES BEVERAGES (Not incl. Milk and 100% Fruit Juice)
CONDIMENTS, GRAVIES, SPREADS, SALAD DRESSINGS
%

40
2020 Dietary Guidelines Advisory Committee Data Supplement: Food Category Sources
https://www.dietaryguidelines.gov/2020-advisory-committee-report/data-analysis
Figure 2. 4: Males - Distribution of total calcium intake (percentages) across top 10 sub-categories
100
90
80
70
60
50
40
30
20
10
0 2+ 2-5 years 6-11 years 12-19 years 20-40 years 41-50 years 51-70 years 71+
BURGERS AND SANDWICHES (incl. tacos and burritos) HIGHER FAT MILK/YOGURT
WATERS PIZZA
RICE, PASTA AND OTHER GRAIN-BASED MIXED DISHEs LOWFAT MILK/YOGURT
DESSERTS AND SWEET SNACKS VEGETABLES (Incl. Beans and Peas, not Starchy)
CHEESE SUGAR-SWEETENED AND DIET BEVERAGES
%

41
2020 Dietary Guidelines Advisory Committee Data Supplement: Food Category Sources
https://www.dietaryguidelines.gov/2020-advisory-committee-report/data-analysis
Figure 2. 5: Females – Distribution of total calcium intake (percentages) across major categories
100
90
80
70
60
50
40
30
20
10
0 2+
DAIRY
MIXED DISHES
2-5 years 6-11 years 12-19 years 20-40 years 41-50 years 51-70 years
PROTEIN FOODS
GRAINS
71+
SNACKS AND SWEETS FRUITS+FRUIT JUICE
VEGETABLES BEVERAGES (Not incl. Milk and 100% Fruit Juice)
CONDIMENTS, GRAVIES, SPREADS, SALAD DRESSINGS
%

42
2020 Dietary Guidelines Advisory Committee Data Supplement: Food Category Sources
https://www.dietaryguidelines.gov/2020-advisory-committee-report/data-analysis
Figure 2. 6: Females - Distribution of total calcium intake (percentages) across top 10 sub-categories
100
90
80
70
60
50
40
30
20
10
0 2+ 2-5 years 6-11 years 12-19 years 20-40 years 41-50 years 51-70 years 71+
BURGERS AND SANDWICHES (incl. tacos and burritos) HIGHER FAT MILK/YOGURT
WATERS VEGETABLES (Incl. Beans and Peas, not Starchy)
CHEESE DESSERTS AND SWEET SNACKS
LOWFAT MILK/YOGURT RICE, PASTA AND OTHER GRAIN-BASED MIXED DISHEs
PIZZA SUGAR-SWEETENED AND DIET BEVERAGES
%

43
2020 Dietary Guidelines Advisory Committee Data Supplement: Food Category Sources
https://www.dietaryguidelines.gov/2020-advisory-committee-report/data-analysis
Percent of potassium intakes, 2013-16, for U.S. population ages 2 years and
older, from WWEIA Food Categories
These data are estimates of the percent of potassium from WWEIA Food Categories, re-grouped into DGAC major categories and sub-categories as described elsewhere, for individuals 2 years and older based on the day 1 dietary recalls from WWEIA, NHANES 2013-16. Breastfed children, and pregnant and lactating women have been excluded. The sample size is 15,807.
WHOLE SAMPLE (MALES + FEMALES)
Table 3. 1: Males and Females - Distribution of total potassium intake (percentages) across major categories
DGAC major category
Age Groups (Years)
2+ 2-5 6-11 12-19 20-40 41-50 51-70 71+
%
MIXED DISHES 26.29 18.52 26.12 30.51 29.65 26.58 23.86 21.65
VEGETABLES 14.35 8.7 9.49 11.74 14.89 15.53 16.24 16.45
BEVERAGES (Not incl. Milk and 100% Fruit Juice) 13.02 4.44 4.19 6.26 13.81 17.16 17.05 14.37
PROTEIN FOODS 12.05 9.91 9.58 10.76 13.22 12.84 12.56 10.86
DAIRY 9.52 24.89 19.5 13.52 6.03 6.43 7.21 8.66
SNACKS AND SWEETS 8.44 9.72 12.06 10.33 7.53 7.33 7.77 8.46
FRUITS+FRUIT JUICE 8.12 15.36 10.02 8.24 6.71 6.2 7.59 10.78
GRAINS 5.13 5.29 6.21 5.54 4.41 4.96 5.11 6.13
CONDIMENTS, GRAVIES, SPREADS, SALAD DRESSINGS
1.41 0.79 1.12 1.37 1.82 1.63 1.28 0.87
TOTAL* 98.34 97.61 98.30 98.28 98.08 98.65 98.67 98.23
*Totals are less than 100% because results do not include baby foods, infant formulas and WWEIA category – other

44
2020 Dietary Guidelines Advisory Committee Data Supplement: Food Category Sources
https://www.dietaryguidelines.gov/2020-advisory-committee-report/data-analysis
Table 3. 2: Males and Females - Distribution of total potassium intake (percentages) across sub- categories
DGAC sub-category
Age Groups (Years)
2+ 2-5 6-11 12-19 20-40 41-50 51-70 71+
%
BURGERS AND SANDWICHES (incl. Tacos and Burritos)
12.83 8.45 12.19 15.18 15.54 12.34 11.26 9.72
VEGETABLES (Incl. Beans and Peas, not Starchy)
8.16 4.21 4.23 5.24 8.25 9.58 9.98 10.09
COFFEE AND TEA 7.48 0.38 0.63 2.72 6.46 10.35 11.82 10.28
HIGHER FAT MILK/YOGURT 6.36 18.36 11.88 9.11 4.23 4.46 4.63 5.43
STARCHY VEGETABLES 6.19 4.49 5.26 6.51 6.64 5.95 6.26 6.36
FRUIT (Non-Juice) 6.01 9.95 6.74 5.68 4.89 4.73 6.19 8.32
RICE, PASTA AND OTHER GRAIN- BASED MIXED DISHEs
4.51 4.58 5 5.29 4.84 4.93 3.86 3.27
MEAT, POULTRY, SEAFOOD MIXED DISHES
3.94 1.48 2.68 3.31 3.84 4.6 4.7 4.4
DESSERTS AND SWEET SNACKS 3.82 4.09 5.49 4.35 3.03 3.29 3.56 5.48
POULTRY (Not incl. Deli and Mixed Dishes)
3.82 3.79 3.9 4.59 4.62 3.62 3.24 2.28
CHIPS, CRACKERS, AND SAVORY SNACKS
3.68 4.57 5.3 4.82 3.63 3.31 3.28 2.19
SUGAR-SWEETENED AND DIET BEVERAGES
3.4 2.91 3.39 3.17 4.33 3.6 2.72 2.75
PIZZA 2.95 2.68 4.51 5.37 3.64 2.29 1.64 1.23
LOWFAT MILK/YOGURT 2.58 5.67 7.02 3.86 1.25 1.61 1.89 2.69
MEATS (Not incl. Deli and Mixed Dishes)
2.38 1.01 1.57 2.56 2.76 2.52 2.44 2.13
BREAKFAST CEREALS AND BARS 2.37 2.88 2.89 2.63 1.91 2.02 2.44 3.04
100 FRUIT JUICE 2.11 5.41 3.28 2.57 1.83 1.47 1.4 2.45
SOUPS 2.06 1.33 1.74 1.36 1.79 2.41 2.39 3.02

45
2020 Dietary Guidelines Advisory Committee Data Supplement: Food Category Sources
https://www.dietaryguidelines.gov/2020-advisory-committee-report/data-analysis
ALCOHOLIC BEVERAGES 1.93 0 0.01 0.21 2.89 3.05 2.31 1.22
NUTS, SEEDS, AND SOY 1.68 0.72 0.8 0.82 1.43 2.17 2.47 1.88
SEAFOOD (Not incl. Mixed Dishes) 1.48 0.63 0.58 0.77 1.67 2.05 1.69 1.65
YEAST BREADS AND TORTILLAS 1.44 0.94 1.33 1.13 1.34 1.58 1.56 1.96
DELI/CURED PRODUCTS (Meat and Poultry)
1.35 2.35 1.66 1.08 1.22 1.13 1.41 1.39
EGGS 1.34 1.4 1.07 0.94 1.53 1.36 1.3 1.54
CONDIMENTS AND GRAVIES 1.25 0.7 0.92 1.21 1.66 1.48 1.13 0.64
CANDY AND SUGARS 0.94 1.05 1.28 1.16 0.88 0.72 0.93 0.79
QUICK BREADS (Biscuits, Muffins, Pancakes, Waffles)
0.83 1.11 1.56 1.26 0.59 0.81 0.64 0.72
CHEESE 0.58 0.86 0.6 0.56 0.54 0.36 0.69 0.55
RICE AND PASTA 0.5 0.37 0.43 0.52 0.57 0.54 0.47 0.41
WATERS 0.21 1.15 0.17 0.17 0.13 0.15 0.19 0.13
SPREADS 0.13 0.06 0.16 0.12 0.12 0.11 0.12 0.21
SALAD DRESSINGS 0.04 0.03 0.04 0.04 0.05 0.03 0.03 0.02
TOTAL* 98.34 97.61 98.30 98.28 98.08 98.65 98.67 98.23
*Totals are less than 100% because results do not include baby foods, infant formulas and WWEIA category – other
(continued from previous page)

46
2020 Dietary Guidelines Advisory Committee Data Supplement: Food Category Sources
https://www.dietaryguidelines.gov/2020-advisory-committee-report/data-analysis
MALES
Table 3. 3: Males - Distribution of total potassium intake (percentages) across major categories
DGAC major category Age Groups (Years)
2+ 2-5 6-11 12-19 20-40 41-50 51-70 71+
%
MIXED DISHES 27.65 19.22 27.36 32.15 32.18 28.79 25.10 21.49
VEGETABLES 12.88 8.36 8.47 10.22 12.87 14.15 15.22 17.03
BEVERAGES (Not incl. Milk and 100% Fruit Juice)
12.58 5.15 4.41 5.36 13.79 16.36 17.11 14.50
PROTEIN FOODS 12.42 9.69 9.03 10.97 13.89 13.79 13.02 12.44
DAIRY 10.01 23.57 20.60 15.03 6.36 6.81 6.37 8.74
SNACKS AND SWEETS 8.03 9.98 12.15 9.92 6.81 6.71 7.94 7.87
FRUITS+FRUIT JUICE 7.66 15.23 9.61 7.96 6.22 5.27 7.58 9.01
GRAINS 4.91 5.39 5.63 5.36 4.23 4.85 4.98 5.98
CONDIMENTS, GRAVIES, SPREADS, SALAD DRESSINGS
1.39 0.83 0.96 1.19 1.76 1.78 1.36 0.94
TOTAL* 97.53 97.43 98.23 98.15 98.12 98.51 98.68 98.00
*Totals are less than 100% because results do not include baby foods, infant formulas and WWEIA category – other

47
2020 Dietary Guidelines Advisory Committee Data Supplement: Food Category Sources
https://www.dietaryguidelines.gov/2020-advisory-committee-report/data-analysis
Table 3. 4: Males - Distribution of total potassium intake (percentages) across sub-categories
DGAC sub-category Age Groups (Years)
2+ 2-5 6-11 12-19 20-40 41-50 51-70 71+
%
BURGERS AND SANDWICHES (incl. Tacos and Burritos)
14.24 9.29 13.13 16.70 17.79 14.05 12.59 10.59
HIGHER FAT MILK/YOGURT 6.89 17.30 12.16 10.53 4.66 4.75 4.06 5.61
VEGETABLES (Incl. Beans and Peas, not Starchy)
6.81 4.10 3.61 4.06 6.63 8.11 8.64 9.87
COFFEE AND TEA 6.66 0.37 0.56 1.89 5.90 9.06 11.55 9.88
STARCHY VEGETABLES 6.07 4.26 4.87 6.15 6.25 6.04 6.58 7.16
FRUIT (Non-Juice) 5.44 9.40 6.42 5.25 4.27 3.84 6.01 6.80
RICE, PASTA AND OTHER GRAIN- BASED MIXED DISHEs
4.57 4.59 4.39 4.85 4.94 6.17 3.77 3.58
POULTRY (Not incl. Deli and Mixed Dishes)
4.06 3.81 3.96 4.94 4.99 4.02 3.30 2.62
MEAT, POULTRY, SEAFOOD MIXED DISHES
3.88 1.25 2.90 3.75 3.94 4.20 4.78 3.90
CHIPS, CRACKERS, AND SAVORY SNACKS
3.66 4.92 5.58 4.43 3.50 3.01 3.61 2.03
DESSERTS AND SWEET SNACKS 3.53 3.96 5.13 4.36 2.61 3.07 3.50 5.23
SUGAR-SWEETENED AND DIET BEVERAGES
3.34 3.41 3.68 3.02 4.42 2.90 2.53 2.76
PIZZA 3.10 3.03 4.94 5.65 4.04 1.87 1.73 0.72
MEATS (Not incl. Deli and Mixed Dishes)
2.66 0.76 1.30 2.72 3.27 2.89 2.93 2.39
LOWFAT MILK/YOGURT 2.64 5.51 7.91 4.10 1.20 1.81 1.73 2.70
ALCOHOLIC BEVERAGES 2.36 0.00 0.00 0.26 3.36 4.28 2.89 1.71
BREAKFAST CEREALS AND BARS 2.26 2.69 2.81 2.49 1.91 1.85 2.22 3.20
100 FRUIT JUICE 2.22 5.83 3.19 2.71 1.94 1.43 1.58 2.22
SOUPS 1.86 1.07 2.00 1.20 1.47 2.50 2.22 2.70

48
2020 Dietary Guidelines Advisory Committee Data Supplement: Food Category Sources
https://www.dietaryguidelines.gov/2020-advisory-committee-report/data-analysis
NUTS, SEEDS, AND SOY 1.57 0.48 0.66 0.67 1.35 2.23 2.45 1.93
SEAFOOD (Not incl. Mixed Dishes) 1.42 0.83 0.49 0.69 1.65 2.23 1.56 1.65
DELI/CURED PRODUCTS (Meat and Poultry)
1.41 2.40 1.69 0.98 1.18 1.19 1.57 1.81
YEAST BREADS AND TORTILLAS 1.37 1.07 0.97 1.04 1.28 1.69 1.62 1.79
EGGS 1.30 1.41 0.93 0.96 1.44 1.23 1.22 2.04
CONDIMENTS AND GRAVIES 1.25 0.76 0.80 1.10 1.62 1.63 1.23 0.71
CANDY AND SUGARS 0.84 1.11 1.45 1.14 0.70 0.64 0.83 0.61
QUICK BREADS (Biscuits, Muffins, Pancakes, Waffles)
0.80 1.22 1.48 1.33 0.55 0.69 0.68 0.59
CHEESE 0.49 0.76 0.53 0.41 0.50 0.25 0.59 0.43
RICE AND PASTA 0.48 0.41 0.38 0.49 0.49 0.63 0.46 0.40
WATERS 0.22 1.37 0.17 0.18 0.11 0.12 0.14 0.15
SPREADS 0.11 0.04 0.12 0.07 0.10 0.12 0.11 0.22
SALAD DRESSINGS 0.03 0.02 0.04 0.02 0.05 0.03 0.02 0.02
TOTAL* 97.53 97.43 98.23 98.15 98.12 98.51 98.68 98.00
*Totals are less than 100% because results do not include baby foods, infant formulas and WWEIA category – other
(continued from previous page)

49
2020 Dietary Guidelines Advisory Committee Data Supplement: Food Category Sources
https://www.dietaryguidelines.gov/2020-advisory-committee-report/data-analysis
FEMALES
Table 3. 5: Females - Distribution of total potassium intake (percentages) across major categories
DGAC major category Age Groups (Years)
2+ 2-5 6-11 12-19 20-40 41-50 51-70 71+
%
MIXED DISHES 24.18 17.87 24.70 28.84 26.80 24.58 22.74 21.78
VEGETABLES 15.48 9.01 10.66 13.30 17.17 16.78 17.18 15.99
BEVERAGES (Not incl. Milk and 100% Fruit Juice)
13.07 3.78 3.94 7.19 13.83 17.89 16.99 14.27
PROTEIN FOODS 11.40 10.11 10.22 10.54 12.47 11.97 12.13 9.62
DAIRY 9.62 26.11 18.24 11.99 5.66 6.09 7.98 8.59
SNACKS AND SWEETS 8.64 9.46 11.96 10.76 8.34 7.88 7.61 8.93
FRUITS+FRUIT JUICE 8.63 15.47 10.49 8.54 7.28 7.04 7.60 12.16
GRAINS 5.27 5.20 6.86 5.72 4.61 5.05 5.22 6.25
CONDIMENTS, GRAVIES, SPREADS, SALAD DRESSINGS
1.38 0.74 1.31 1.55 1.89 1.49 1.21 0.81
TOTAL* 97.67 97.77 98.37 98.42 98.04 98.78 98.66 98.41
*Totals are less than 100% because results do not include baby foods, infant formulas and WWEIA category – other

50
2020 Dietary Guidelines Advisory Committee Data Supplement: Food Category Sources
https://www.dietaryguidelines.gov/2020-advisory-committee-report/data-analysis
Table 3. 6: Females - Distribution of total potassium intake (percentages) across sub-categories
DGAC sub-category Age Groups (Years)
2+ 2-5 6-11 12-19 20-40 41-50 51-70 71+
%
BURGERS AND SANDWICHES (incl. Tacos and Burritos)
10.99 7.67 11.11 13.62 13.00 10.79 10.05 9.04
VEGETABLES (Incl. Beans and Peas, not Starchy)
9.31 4.32 4.94 6.44 10.07 10.91 11.21 10.27
COFFEE AND TEA 8.01 0.39 0.70 3.57 7.11 11.52 12.08 10.60
FRUIT (Non-Juice) 6.58 10.46 7.10 6.11 5.58 5.55 6.35 9.52
HIGHER FAT MILK/YOGURT 6.47 19.34 11.57 7.65 3.76 4.21 5.15 5.28
STARCHY VEGETABLES 6.17 4.70 5.71 6.87 7.09 5.87 5.97 5.73
RICE, PASTA AND OTHER GRAIN- BASED MIXED DISHEs
4.36 4.58 5.70 5.74 4.73 3.81 3.94 3.03
DESSERTS AND SWEET SNACKS 4.01 4.21 5.90 4.35 3.49 3.49 3.62 5.68
MEAT, POULTRY, SEAFOOD MIXED DISHES
3.89 1.69 2.43 2.86 3.71 4.97 4.63 4.80
CHIPS, CRACKERS, AND SAVORY SNACKS
3.62 4.25 4.98 5.22 3.77 3.60 2.97 2.32
POULTRY (Not incl. Deli and Mixed Dishes)
3.50 3.78 3.83 4.24 4.19 3.25 3.17 2.01
SUGAR-SWEETENED AND DIET BEVERAGES
3.40 2.44 3.07 3.32 4.22 4.24 2.89 2.74
PIZZA 2.72 2.35 4.03 5.08 3.20 2.68 1.56 1.63
LOWFAT MILK/YOGURT 2.48 5.82 6.00 3.62 1.30 1.42 2.04 2.67
BREAKFAST CEREALS AND BARS 2.46 3.05 2.97 2.76 1.91 2.19 2.64 2.91
SOUPS 2.22 1.57 1.44 1.54 2.16 2.33 2.55 3.27
100 FRUIT JUICE 2.05 5.02 3.39 2.42 1.69 1.50 1.24 2.64
MEATS (Not incl. Deli and Mixed Dishes) 2.03 1.25 1.88 2.39 2.19 2.18 2.00 1.92
NUTS, SEEDS, AND SOY 1.72 0.95 0.96 0.96 1.51 2.11 2.49 1.84
SEAFOOD (Not incl. Mixed Dishes) 1.49 0.44 0.69 0.85 1.69 1.89 1.82 1.66

51
2020 Dietary Guidelines Advisory Committee Data Supplement: Food Category Sources
https://www.dietaryguidelines.gov/2020-advisory-committee-report/data-analysis
YEAST BREADS AND TORTILLAS 1.47 0.83 1.74 1.23 1.42 1.48 1.51 2.10
ALCOHOLIC BEVERAGES 1.42 0.00 0.01 0.15 2.35 1.95 1.78 0.83
EGGS 1.37 1.39 1.24 0.93 1.63 1.48 1.38 1.14
DELI/CURED PRODUCTS (Meat and Poultry)
1.29 2.31 1.63 1.18 1.26 1.07 1.27 1.05
CONDIMENTS AND GRAVIES 1.20 0.64 1.05 1.32 1.70 1.35 1.04 0.59
CANDY AND SUGARS 1.01 1.00 1.08 1.19 1.08 0.79 1.02 0.93
QUICK BREADS (Biscuits, Muffins, Pancakes, Waffles)
0.83 1.00 1.65 1.18 0.63 0.92 0.61 0.83
CHEESE 0.66 0.96 0.67 0.71 0.60 0.46 0.78 0.64
RICE AND PASTA 0.51 0.33 0.49 0.55 0.65 0.46 0.47 0.41
WATERS 0.23 0.95 0.16 0.16 0.15 0.19 0.25 0.11
SPREADS 0.14 0.07 0.21 0.17 0.14 0.10 0.13 0.21
SALAD DRESSINGS 0.04 0.03 0.05 0.06 0.06 0.04 0.04 0.02
TOTAL* 97.67 97.77 98.37 98.42 98.04 98.78 98.66 98.41
*Totals are less than 100% because results do not include baby foods, infant formulas and WWEIA category – other
(continued from previous page)

52
2020 Dietary Guidelines Advisory Committee Data Supplement: Food Category Sources
https://www.dietaryguidelines.gov/2020-advisory-committee-report/data-analysis
Figure 3. 1: Males and Females – Distribution of total potassium intake (percentages) across major categories
100
90
80
70
60
50
40
30
20
10
0 2+
DAIRY
MIXED DISHES
2-5 years 6-11 years 12-19 years 20-40 years 41-50 years 51-70 years
PROTEIN FOODS
GRAINS
71+
SNACKS AND SWEETS FRUITS+FRUIT JUICE
VEGETABLES BEVERAGES (Not incl. Milk and 100% Fruit Juice)
CONDIMENTS, GRAVIES, SPREADS, SALAD DRESSINGS
%

53
2020 Dietary Guidelines Advisory Committee Data Supplement: Food Category Sources
https://www.dietaryguidelines.gov/2020-advisory-committee-report/data-analysis
Figure 3. 2: Males and Females – Distribution of total potassium intake (percentages) top 10 across sub- categories
100
90
80
70
60
50
40
30
20
10
0
2+ 2-5 years 6-11 years 12-19 years 20-40 years 41-50 years 51-70 years 71+
BURGERS AND SANDWICHES (incl. tacos and burritos) VEGETABLES (Incl. Beans and Peas, not Starchy)
COFFEE AND TEA HIGHER FAT MILK/YOGURT
STARCHY VEGETABLES FRUIT (non-juice)
RICE, PASTA AND OTHER GRAIN-BASED MIXED DISHEs MEAT, POULTRY, SEAFOOD MIXED DISHES
DESSERTS AND SWEET SNACKS POULTRY (Not incl. Deli and Mixed Dishes)
%

54
2020 Dietary Guidelines Advisory Committee Data Supplement: Food Category Sources
https://www.dietaryguidelines.gov/2020-advisory-committee-report/data-analysis
Figure 3. 3: Males - Distribution of total potassium intake (percentages) across major categories
100
90
80
70
60
50
40
30
20
10
0 2+
DAIRY
MIXED DISHES
2-5 years 6-11 years 12-19 years 20-40 years 41-50 years 51-70 years
PROTEIN FOODS
GRAINS
71+
SNACKS AND SWEETS FRUITS+FRUIT JUICE
VEGETABLES BEVERAGES (Not incl. Milk and 100% Fruit Juice)
CONDIMENTS, GRAVIES, SPREADS, SALAD DRESSINGS
%

55
2020 Dietary Guidelines Advisory Committee Data Supplement: Food Category Sources
https://www.dietaryguidelines.gov/2020-advisory-committee-report/data-analysis
Figure 3. 4: Males - Distribution of total potassium intake (percentages) across top 10 sub-categories
100
90
80
70
60
50
40
30
20
10
0 2+ 2-5 years 6-11 years 12-19 years 20-40 years 41-50 years 51-70 years 71+
BURGERS AND SANDWICHES (incl. tacos and burritos) HIGHER FAT MILK/YOGURT
VEGETABLES (Incl. Beans and Peas, not Starchy) COFFEE AND TEA
STARCHY VEGETABLES FRUIT (non-juice)
RICE, PASTA AND OTHER GRAIN-BASED MIXED DISHEs POULTRY (Not incl. Deli and Mixed Dishes)
MEAT, POULTRY, SEAFOOD MIXED DISHES CHIPS, CRACKERS, AND SAVORY SNACKS
%

56
2020 Dietary Guidelines Advisory Committee Data Supplement: Food Category Sources
https://www.dietaryguidelines.gov/2020-advisory-committee-report/data-analysis
Figure 3. 5: Females - Distribution of total potassium intake (percentages) across major categories
100
90
80
70
60
50
40
30
20
10
0 2+
MIXED DISHES
2-5 years 6-11 years 12-19 years 20-40 years 41-50 years 51-70 years
VEGETABLES
71+
BEVERAGES (Not incl. Milk and 100% Fruit Juice) PROTEIN FOODS
DAIRY SNACKS AND SWEETS
FRUITS+FRUIT JUICE GRAINS
CONDIMENTS, GRAVIES, SPREADS, SALAD DRESSINGS
%

57
2020 Dietary Guidelines Advisory Committee Data Supplement: Food Category Sources
https://www.dietaryguidelines.gov/2020-advisory-committee-report/data-analysis
Figure 3. 6: Females – Distribution of total potassium intake (percentages) across top 10 sub-categories
100
90
80
70
60
50
40
30
20
10
0 2+ 2-5 years 6-11 years 12-19 years 20-40 years 41-50 years 51-70 years 71+
BURGERS AND SANDWICHES (incl. tacos and burritos) VEGETABLES (Incl. Beans and Peas, not Starchy)
COFFEE AND TEA FRUIT (non-juice)
HIGHER FAT MILK/YOGURT STARCHY VEGETABLES
RICE, PASTA AND OTHER GRAIN-BASED MIXED DISHEs DESSERTS AND SWEET SNACKS
MEAT, POULTRY, SEAFOOD MIXED DISHES CHIPS, CRACKERS, AND SAVORY SNACKS
%

58
2020 Dietary Guidelines Advisory Committee Data Supplement: Food Category Sources
https://www.dietaryguidelines.gov/2020-advisory-committee-report/data-analysis
Percent of sodium intakes, 2013-16, for U.S. population ages 2 years and older,
from WWEIA Food Categories
These data are estimates of the percent of sodium from WWEIA Food Categories, re-grouped into DGAC major categories and sub-categories as described elsewhere, for individuals 2 years and older based on the day 1 dietary recalls from What WWEIA, NHANES 2013-16. Breastfed children, and pregnant and lactating women have been excluded. The sample size is 15,807.
WHOLE SAMPLE (MALES + FEMALES)
Table 4. 1: Males and Females- Distribution of total sodium intake (percentages) across major categories
DGAC major category Age Groups (Years)
2+ 2-5 6-11 12-19 20-40 41-50 51-70 71+
%
MIXED DISHES 42.52 35.69 43.58 46.46 45.47 42.39 40.02 38.66
PROTEIN FOODS 14.92 16.55 12.94 12.79 15.31 15.74 15.62 14.09
VEGETABLES 10.67 5.99 6.04 7.97 10.33 11.66 13.08 13.64
GRAINS 10.00 12.10 12.44 10.58 8.24 9.67 9.89 12.08
SNACKS AND SWEETS 8.75 13.08 12.03 9.74 7.24 7.55 8.40 9.49
DAIRY 4.76 11.51 7.60 5.45 3.40 3.29 4.43 4.78
BEVERAGES (Not incl. Milk and 100% Fruit Juice) 4.55 1.91 2.17 3.52 5.67 5.74 4.74 3.76
CONDIMENTS, GRAVIES, SPREADS, SALAD DRESSINGS
3.65 2.52 2.99 3.34 4.21 3.84 3.68 3.21
FRUITS+FRUIT JUICE 0.15 0.33 0.16 0.12 0.11 0.12 0.13 0.26
TOTAL* 99.96 99.67 99.94 99.98 99.99 99.99 99.98 99.98
*Totals are less than 100% because results do not include baby foods, infant formulas and WWEIA category – other

59
2020 Dietary Guidelines Advisory Committee Data Supplement: Food Category Sources
https://www.dietaryguidelines.gov/2020-advisory-committee-report/data-analysis
Table 4. 2: Males and Females - Distribution of total sodium intake (percentages) across sub-categories
DGAC sub-category Age Groups (Years)
2+ 2-5 6-11 12-19 20-40 41-50 51-70 71+
%
BURGERS AND SANDWICHES (incl. Tacos and Burritos)
21.12 16.03 20.20 22.91 23.38 21.09 19.86 19.21
RICE, PASTA AND OTHER GRAIN- BASED MIXED DISHES
7.84 8.72 8.75 8.42 8.54 8.00 6.88 6.06
VEGETABLES (Incl. Beans and Peas, not Starchy)
6.94 3.09 3.08 4.38 6.76 8.15 8.91 9.03
PIZZA 5.09 5.54 7.88 8.41 5.96 4.25 3.13 2.30
POULTRY (Not incl. Deli and Mixed Dishes)
4.99 6.27 5.47 5.71 5.55 5.02 4.36 2.98
MEAT, POULTRY, SEAFOOD MIXED DISHES
4.92 2.13 3.63 3.89 4.59 5.33 6.04 6.16
CHIPS, CRACKERS, AND SAVORY SNACKS
4.16 7.26 6.25 5.13 3.66 3.62 3.73 2.91
DESSERTS AND SWEET SNACKS 4.12 4.93 5.04 4.07 3.17 3.62 4.22 6.22
STARCHY VEGETABLES 3.73 2.90 2.96 3.59 3.57 3.50 4.17 4.61
SOUPS 3.56 3.26 3.11 2.83 3.00 3.72 4.11 4.94
YEAST BREADS AND TORTILLAS 3.42 2.73 3.31 2.87 2.76 3.57 3.92 4.95
CONDIMENTS AND GRAVIES 2.89 1.97 2.33 2.72 3.57 3.18 2.77 1.94
BREAKFAST CEREALS AND BARS 2.80 4.55 3.87 3.42 2.11 2.28 2.57 3.62
DELI/CURED PRODUCTS (Meat and Poultry)
2.69 4.90 3.07 1.96 2.22 2.51 2.97 2.89
EGGS 2.47 2.94 1.85 1.58 2.71 2.37 2.54 3.13
MEATS (Not incl. Deli and Mixed Dishes) 2.37 1.16 1.46 2.32 2.55 2.66 2.58 2.40
QUICK BREADS (Biscuits, Muffins, Pancakes, Waffles)
2.02 3.23 3.67 2.64 1.37 1.97 1.71 2.03
SUGAR-SWEETENED AND DIET BEVERAGES
1.98 1.11 1.41 1.98 2.65 2.39 1.60 1.40
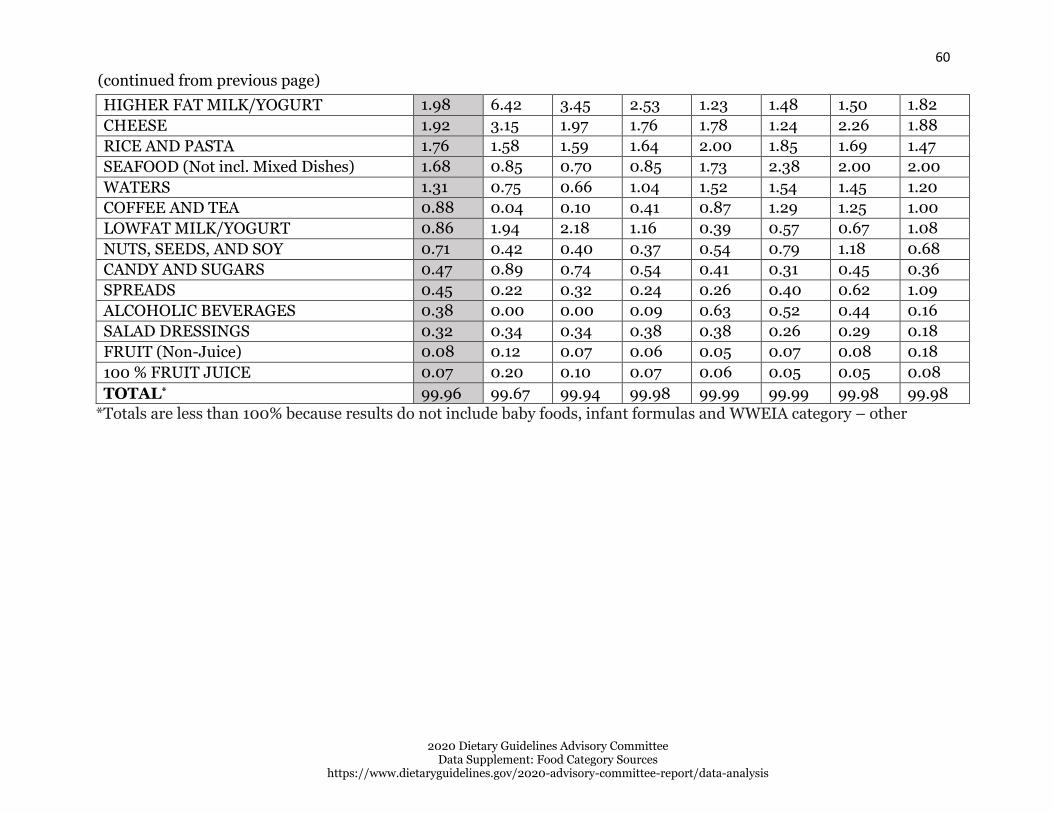
60
2020 Dietary Guidelines Advisory Committee Data Supplement: Food Category Sources
https://www.dietaryguidelines.gov/2020-advisory-committee-report/data-analysis
HIGHER FAT MILK/YOGURT 1.98 6.42 3.45 2.53 1.23 1.48 1.50 1.82
CHEESE 1.92 3.15 1.97 1.76 1.78 1.24 2.26 1.88
RICE AND PASTA 1.76 1.58 1.59 1.64 2.00 1.85 1.69 1.47
SEAFOOD (Not incl. Mixed Dishes) 1.68 0.85 0.70 0.85 1.73 2.38 2.00 2.00
WATERS 1.31 0.75 0.66 1.04 1.52 1.54 1.45 1.20
COFFEE AND TEA 0.88 0.04 0.10 0.41 0.87 1.29 1.25 1.00
LOWFAT MILK/YOGURT 0.86 1.94 2.18 1.16 0.39 0.57 0.67 1.08
NUTS, SEEDS, AND SOY 0.71 0.42 0.40 0.37 0.54 0.79 1.18 0.68
CANDY AND SUGARS 0.47 0.89 0.74 0.54 0.41 0.31 0.45 0.36
SPREADS 0.45 0.22 0.32 0.24 0.26 0.40 0.62 1.09
ALCOHOLIC BEVERAGES 0.38 0.00 0.00 0.09 0.63 0.52 0.44 0.16
SALAD DRESSINGS 0.32 0.34 0.34 0.38 0.38 0.26 0.29 0.18
FRUIT (Non-Juice) 0.08 0.12 0.07 0.06 0.05 0.07 0.08 0.18
100 % FRUIT JUICE 0.07 0.20 0.10 0.07 0.06 0.05 0.05 0.08
TOTAL* 99.96 99.67 99.94 99.98 99.99 99.99 99.98 99.98
*Totals are less than 100% because results do not include baby foods, infant formulas and WWEIA category – other
(continued from previous page)

61
2020 Dietary Guidelines Advisory Committee Data Supplement: Food Category Sources
https://www.dietaryguidelines.gov/2020-advisory-committee-report/data-analysis
MALES
Table 4. 3: Males - Distribution of total sodium intake (percentages) across major categories
DGAC major category Age Groups (Years)
2+ 2-5 6-11 12-19 20-40 41-50 51-70 71+
%
MIXED DISHES 44.25 36.31 45.83 48.33 48.61 44.50 41.85 39.22
PROTEIN FOODS 15.26 16.26 12.57 13.10 15.68 16.47 15.98 15.95
GRAINS 9.63 12.52 11.55 10.16 7.80 9.55 9.89 11.43
VEGETABLES 9.50 5.36 5.42 6.91 8.68 10.58 12.21 14.03
SNACKS AND SWEETS 8.11 13.67 11.61 9.41 6.19 6.73 8.16 8.26
DAIRY 4.64 10.40 7.76 5.45 3.23 3.23 3.73 4.53
BEVERAGES (Not incl. Milk and 100% Fruit Juice)
4.32 2.21 2.30 3.46 5.78 4.95 4.36 3.17
CONDIMENTS, GRAVIES, SPREADS, SALAD DRESSINGS
3.48 2.47 2.71 3.07 3.93 3.91 3.69 3.21
FRUITS+FRUIT JUICE 0.13 0.32 0.16 0.10 0.09 0.07 0.12 0.18
TOTAL* 99.30 99.53 99.91 99.99 99.99 99.99 99.99 99.98
*Totals are less than 100% because results do not include baby foods, infant formulas and WWEIA category – other
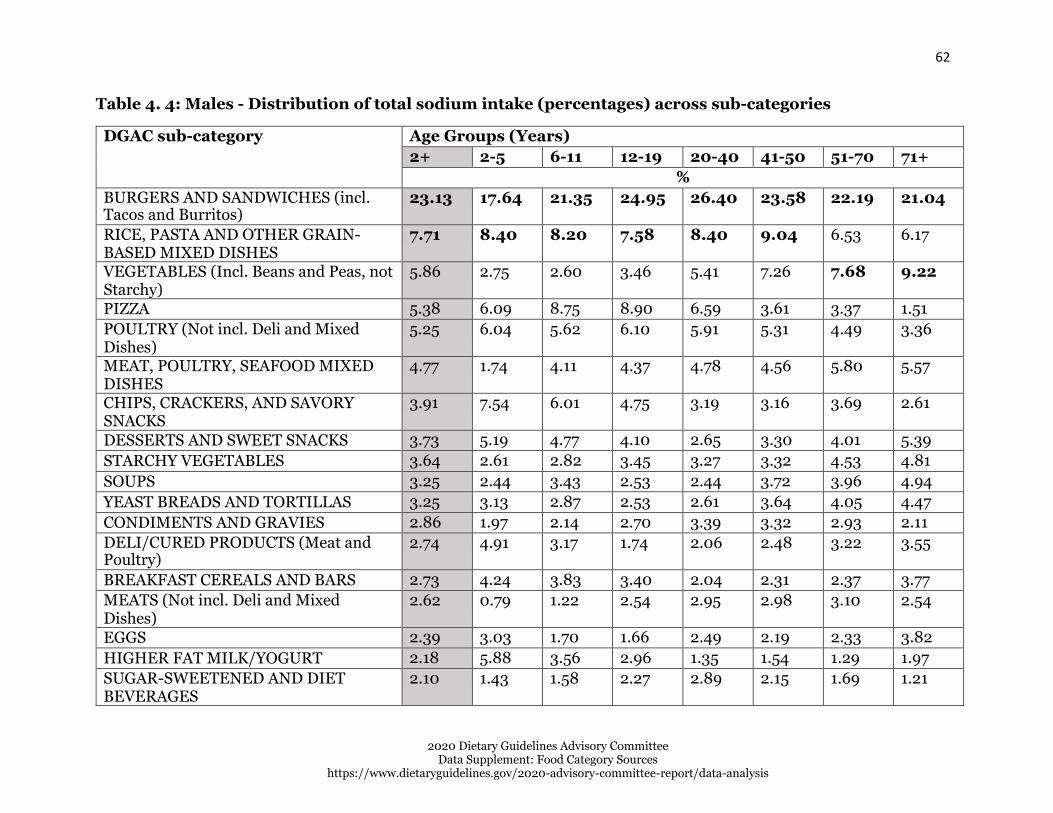
62
2020 Dietary Guidelines Advisory Committee Data Supplement: Food Category Sources
https://www.dietaryguidelines.gov/2020-advisory-committee-report/data-analysis
Table 4. 4: Males - Distribution of total sodium intake (percentages) across sub-categories
DGAC sub-category Age Groups (Years)
2+ 2-5 6-11 12-19 20-40 41-50 51-70 71+
%
BURGERS AND SANDWICHES (incl. Tacos and Burritos)
23.13 17.64 21.35 24.95 26.40 23.58 22.19 21.04
RICE, PASTA AND OTHER GRAIN- BASED MIXED DISHES
7.71 8.40 8.20 7.58 8.40 9.04 6.53 6.17
VEGETABLES (Incl. Beans and Peas, not Starchy)
5.86 2.75 2.60 3.46 5.41 7.26 7.68 9.22
PIZZA 5.38 6.09 8.75 8.90 6.59 3.61 3.37 1.51
POULTRY (Not incl. Deli and Mixed Dishes)
5.25 6.04 5.62 6.10 5.91 5.31 4.49 3.36
MEAT, POULTRY, SEAFOOD MIXED DISHES
4.77 1.74 4.11 4.37 4.78 4.56 5.80 5.57
CHIPS, CRACKERS, AND SAVORY SNACKS
3.91 7.54 6.01 4.75 3.19 3.16 3.69 2.61
DESSERTS AND SWEET SNACKS 3.73 5.19 4.77 4.10 2.65 3.30 4.01 5.39
STARCHY VEGETABLES 3.64 2.61 2.82 3.45 3.27 3.32 4.53 4.81
SOUPS 3.25 2.44 3.43 2.53 2.44 3.72 3.96 4.94
YEAST BREADS AND TORTILLAS 3.25 3.13 2.87 2.53 2.61 3.64 4.05 4.47
CONDIMENTS AND GRAVIES 2.86 1.97 2.14 2.70 3.39 3.32 2.93 2.11
DELI/CURED PRODUCTS (Meat and Poultry)
2.74 4.91 3.17 1.74 2.06 2.48 3.22 3.55
BREAKFAST CEREALS AND BARS 2.73 4.24 3.83 3.40 2.04 2.31 2.37 3.77
MEATS (Not incl. Deli and Mixed Dishes)
2.62 0.79 1.22 2.54 2.95 2.98 3.10 2.54
EGGS 2.39 3.03 1.70 1.66 2.49 2.19 2.33 3.82
HIGHER FAT MILK/YOGURT 2.18 5.88 3.56 2.96 1.35 1.54 1.29 1.97
SUGAR-SWEETENED AND DIET BEVERAGES
2.10 1.43 1.58 2.27 2.89 2.15 1.69 1.21

63
2020 Dietary Guidelines Advisory Committee Data Supplement: Food Category Sources
https://www.dietaryguidelines.gov/2020-advisory-committee-report/data-analysis
QUICK BREADS (Biscuits, Muffins, Pancakes, Waffles)
1.94 3.47 3.51 2.71 1.30 1.62 1.70 1.83
RICE AND PASTA 1.71 1.68 1.34 1.52 1.84 1.98 1.77 1.34
SEAFOOD (Not incl. Mixed Dishes) 1.62 1.12 0.57 0.79 1.78 2.64 1.74 2.06
CHEESE 1.61 2.71 1.79 1.28 1.52 0.99 1.86 1.57
WATERS 1.09 0.74 0.65 0.92 1.38 1.18 1.13 0.86
LOWFAT MILK/YOGURT 0.85 1.81 2.41 1.22 0.36 0.69 0.58 0.98
COFFEE AND TEA 0.70 0.05 0.07 0.23 0.78 0.95 1.07 0.87
NUTS, SEEDS, AND SOY 0.63 0.37 0.28 0.27 0.48 0.86 1.11 0.62
CANDY AND SUGARS 0.46 0.94 0.83 0.56 0.35 0.28 0.46 0.26
ALCOHOLIC BEVERAGES 0.43 0.00 0.00 0.05 0.73 0.67 0.47 0.23
SPREADS 0.37 0.20 0.21 0.20 0.19 0.39 0.56 0.97
SALAD DRESSINGS 0.25 0.30 0.36 0.17 0.34 0.19 0.20 0.13
100 % FRUIT JUICE 0.07 0.22 0.10 0.06 0.06 0.04 0.04 0.07
FRUIT (Non-Juice) 0.06 0.10 0.06 0.04 0.03 0.04 0.08 0.11
TOTAL* 99.30 99.53 99.91 99.99 99.99 99.99 99.99 99.98
*Totals are less than 100% because results do not include baby foods, infant formulas and WWEIA category – other
(continued from previous page)
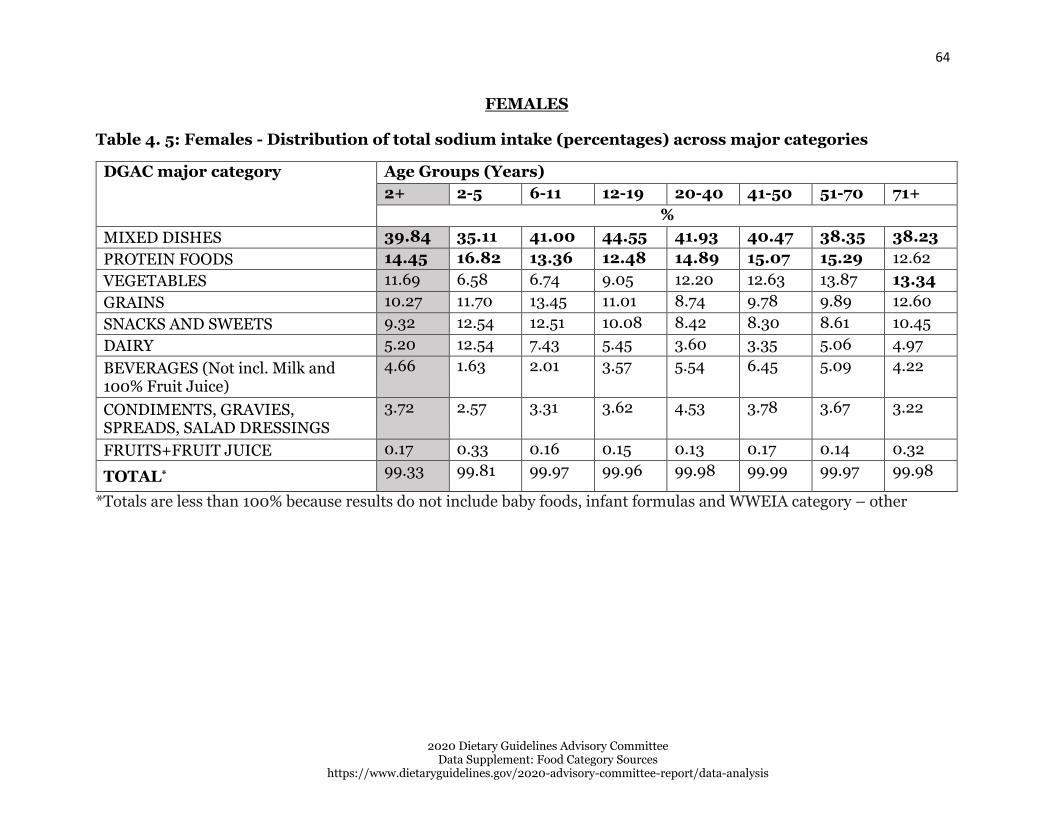
64
2020 Dietary Guidelines Advisory Committee Data Supplement: Food Category Sources
https://www.dietaryguidelines.gov/2020-advisory-committee-report/data-analysis
FEMALES
Table 4. 5: Females - Distribution of total sodium intake (percentages) across major categories
DGAC major category Age Groups (Years)
2+ 2-5 6-11 12-19 20-40 41-50 51-70 71+
%
MIXED DISHES 39.84 35.11 41.00 44.55 41.93 40.47 38.35 38.23
PROTEIN FOODS 14.45 16.82 13.36 12.48 14.89 15.07 15.29 12.62
VEGETABLES 11.69 6.58 6.74 9.05 12.20 12.63 13.87 13.34
GRAINS 10.27 11.70 13.45 11.01 8.74 9.78 9.89 12.60
SNACKS AND SWEETS 9.32 12.54 12.51 10.08 8.42 8.30 8.61 10.45
DAIRY 5.20 12.54 7.43 5.45 3.60 3.35 5.06 4.97
BEVERAGES (Not incl. Milk and 100% Fruit Juice)
4.66 1.63 2.01 3.57 5.54 6.45 5.09 4.22
CONDIMENTS, GRAVIES, SPREADS, SALAD DRESSINGS
3.72 2.57 3.31 3.62 4.53 3.78 3.67 3.22
FRUITS+FRUIT JUICE 0.17 0.33 0.16 0.15 0.13 0.17 0.14 0.32
TOTAL* 99.33 99.81 99.97 99.96 99.98 99.99 99.97 99.98
*Totals are less than 100% because results do not include baby foods, infant formulas and WWEIA category – other

65
2020 Dietary Guidelines Advisory Committee Data Supplement: Food Category Sources
https://www.dietaryguidelines.gov/2020-advisory-committee-report/data-analysis
Table 4. 6: Females - Distribution of total sodium intake (percentages) across sub-categories
DGAC sub-category Age Groups (Years)
2+ 2-5 6-11 12-19 20-40 41-50 51-70 71+
%
BURGERS AND SANDWICHES (incl. Tacos and Burritos)
18.47 14.54 18.89 20.83 19.97 18.83 17.74 17.78
VEGETABLES (Incl. Beans and Peas, not Starchy)
7.90 3.41 3.62 5.32 8.30 8.96 10.02 8.88
RICE, PASTA AND OTHER GRAIN- BASED MIXED DISHES
7.89 9.02 9.38 9.28 8.71 7.05 7.20 5.97
MEAT, POULTRY, SEAFOOD MIXED DISHES
4.98 2.49 3.09 3.41 4.36 6.03 6.26 6.63
POULTRY (Not incl. Deli and Mixed Dishes)
4.70 6.48 5.28 5.31 5.15 4.75 4.23 2.68
PIZZA 4.69 5.03 6.90 7.91 5.25 4.82 2.90 2.92
DESSERTS AND SWEET SNACKS 4.43 4.70 5.36 4.04 3.76 3.92 4.40 6.88
CHIPS, CRACKERS, AND SAVORY SNACKS
4.41 6.99 6.52 5.51 4.18 4.04 3.77 3.14
SOUPS 3.81 4.03 2.75 3.13 3.63 3.72 4.24 4.93
STARCHY VEGETABLES 3.79 3.16 3.12 3.73 3.90 3.67 3.85 4.46
YEAST BREADS AND TORTILLAS 3.52 2.36 3.81 3.23 2.93 3.50 3.81 5.33
BREAKFAST CEREALS AND BARS 2.88 4.84 3.91 3.43 2.18 2.25 2.75 3.50
CONDIMENTS AND GRAVIES 2.84 1.96 2.55 2.73 3.78 3.05 2.63 1.81
DELI/CURED PRODUCTS (Meat and Poultry)
2.65 4.90 2.95 2.19 2.40 2.54 2.74 2.37
EGGS 2.57 2.86 2.02 1.50 2.95 2.54 2.73 2.59
CHEESE 2.23 3.57 2.19 2.26 2.07 1.46 2.62 2.12
HIGHER FAT MILK/YOGURT 2.10 6.92 3.32 2.09 1.10 1.42 1.69 1.69
QUICK BREADS (Biscuits, Muffins, Pancakes, Waffles)
2.08 3.00 3.85 2.58 1.45 2.30 1.71 2.19

66
2020 Dietary Guidelines Advisory Committee Data Supplement: Food Category Sources
https://www.dietaryguidelines.gov/2020-advisory-committee-report/data-analysis
MEATS (Not incl. Deli and Mixed Dishes)
2.07 1.50 1.73 2.10 2.10 2.37 2.11 2.28
SUGAR-SWEETENED AND DIET BEVERAGES
1.83 0.82 1.22 1.68 2.38 2.61 1.51 1.56
RICE AND PASTA 1.80 1.49 1.88 1.77 2.19 1.73 1.61 1.58
SEAFOOD (Not incl. Mixed Dishes) 1.68 0.60 0.84 0.90 1.67 2.15 2.23 1.96
WATERS 1.50 0.76 0.67 1.17 1.67 1.86 1.73 1.47
COFFEE AND TEA 1.02 0.04 0.12 0.59 0.97 1.60 1.42 1.09
LOWFAT MILK/YOGURT 0.87 2.06 1.92 1.10 0.43 0.47 0.75 1.16
NUTS, SEEDS, AND SOY 0.77 0.48 0.53 0.48 0.62 0.73 1.25 0.74
SPREADS 0.51 0.23 0.46 0.28 0.33 0.40 0.68 1.19
CANDY AND SUGARS 0.48 0.84 0.62 0.53 0.48 0.34 0.44 0.43
SALAD DRESSINGS 0.38 0.38 0.31 0.60 0.43 0.33 0.36 0.22
ALCOHOLIC BEVERAGES 0.31 0.00 0.00 0.13 0.51 0.38 0.42 0.10
FRUIT (Non-Juice) 0.10 0.14 0.07 0.08 0.06 0.10 0.09 0.23
100 % FRUIT JUICE 0.08 0.19 0.10 0.07 0.07 0.07 0.05 0.10
TOTAL* 99.33 99.81 99.97 99.96 99.98 99.99 99.97 99.98
*Totals are less than 100% because results do not include baby foods, infant formulas and WWEIA category – other
(continued from previous page)

67
2020 Dietary Guidelines Advisory Committee Data Supplement: Food Category Sources
https://www.dietaryguidelines.gov/2020-advisory-committee-report/data-analysis
100
90
80
70
60
50
40
30
20
10
0
Figure 4. 1: Males and Females - Distribution of total sodium intake (percentages) across major categories
71+ 12-19 years 20-40 years 41-50 years 51-70 years6-11 years2-5 years2+
MIXED DISHES
VEGETABLES
PROTEIN FOODS
GRAINS
DAIRY
CONDIMENTS, GRAVIES, SPREADS, SALAD DRESSINGS
SNACKS AND SWEETS
BEVERAGES (Not incl. Milk and 100% Fruit Juice)
FRUITS+FRUIT JUICE
%

68
2020 Dietary Guidelines Advisory Committee Data Supplement: Food Category Sources
https://www.dietaryguidelines.gov/2020-advisory-committee-report/data-analysis
100
90
80
70
60
50
40
30
20
10
0
BURGERS AND SANDWICHES (incl. tacos and burritos)
VEGETABLES (Incl. Beans and Peas, not Starchy)
POULTRY (Not incl. Deli and Mixed Dishes)
CHIPS, CRACKERS, AND SAVORY SNACKS
STARCHY VEGETABLES
RICE, PASTA AND OTHER GRAIN-BASED MIXED DISHES
PIZZA
MEAT, POULTRY, SEAFOOD MIXED DISHES
DESSERTS AND SWEET SNACKS
SOUPS
Figure 4. 2: Males and Females - Distribution of total sodium intake (percentages) across top 10 sub- categories
71+ 12-19 years 20-40 years 41-50 years 51-70 years 6-11 years 2-5 years 2+
%

69
2020 Dietary Guidelines Advisory Committee Data Supplement: Food Category Sources
https://www.dietaryguidelines.gov/2020-advisory-committee-report/data-analysis
Figure 4. 3: Males - Distribution of total sodium intake (percentages) across major categories
100
90
80
70
60
50
40
30
20
10
0 2+
MIXED DISHES
GRAINS
2-5 years 6-11 years 12-19 years 20-40 years 41-50 years 51-70 years
PROTEIN FOODS
VEGETABLES
71+
SNACKS AND SWEETS DAIRY
BEVERAGES (Not incl. Milk and 100% Fruit Juice) CONDIMENTS, GRAVIES, SPREADS, SALAD DRESSINGS
FRUITS+FRUIT JUICE
%
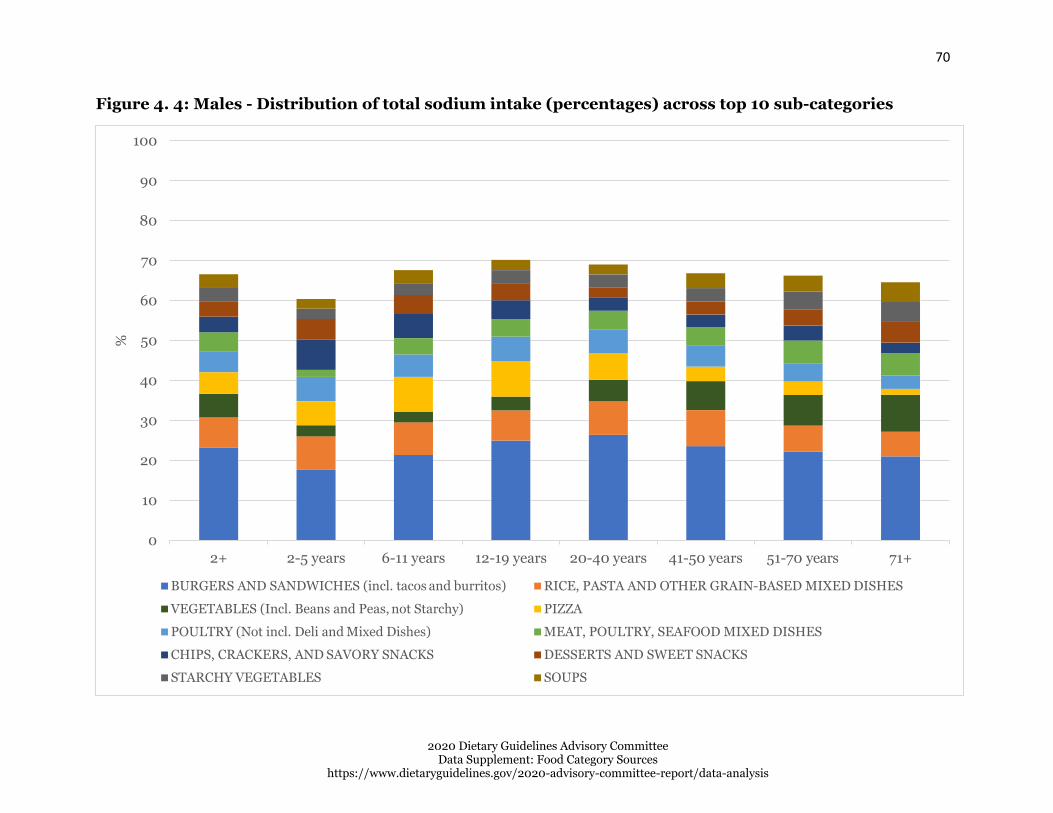
70
2020 Dietary Guidelines Advisory Committee Data Supplement: Food Category Sources
https://www.dietaryguidelines.gov/2020-advisory-committee-report/data-analysis
Figure 4. 4: Males - Distribution of total sodium intake (percentages) across top 10 sub-categories
100
90
80
70
60
50
40
30
20
10
0 2+ 2-5 years 6-11 years 12-19 years 20-40 years 41-50 years 51-70 years 71+
BURGERS AND SANDWICHES (incl. tacos and burritos) RICE, PASTA AND OTHER GRAIN-BASED MIXED DISHES
VEGETABLES (Incl. Beans and Peas, not Starchy) PIZZA
POULTRY (Not incl. Deli and Mixed Dishes) MEAT, POULTRY, SEAFOOD MIXED DISHES
CHIPS, CRACKERS, AND SAVORY SNACKS DESSERTS AND SWEET SNACKS
STARCHY VEGETABLES SOUPS
%

71
2020 Dietary Guidelines Advisory Committee Data Supplement: Food Category Sources
https://www.dietaryguidelines.gov/2020-advisory-committee-report/data-analysis
Figure 4. 5: Females - Distribution of total sodium intake (percentages) across major categories
100
90
80
70
60
50
40
30
20
10
0
2+
MIXED DISHES
VEGETABLES
2-5 years 6-11 years 12-19 years 20-40 years 41-50 years 51-70 years
PROTEIN FOODS
GRAINS
71+
SNACKS AND SWEETS DAIRY
BEVERAGES (Not incl. Milk and 100% Fruit Juice) CONDIMENTS, GRAVIES, SPREADS, SALAD DRESSINGS
FRUITS+FRUIT JUICE
%

72
2020 Dietary Guidelines Advisory Committee Data Supplement: Food Category Sources
https://www.dietaryguidelines.gov/2020-advisory-committee-report/data-analysis
Figure 4. 6: Females - Distribution of total sodium intake (percentages) across top 10 sub-categories
100
90
80
70
60
50
40
30
20
10
0 2+ 2-5 years 6-11 years 12-19 years 20-40 years 41-50 years 51-70 years 71+
BURGERS AND SANDWICHES (incl. tacos and burritos) VEGETABLES (Incl. Beans and Peas, not Starchy)
RICE, PASTA AND OTHER GRAIN-BASED MIXED DISHES MEAT, POULTRY, SEAFOOD MIXED DISHES
POULTRY (Not incl. Deli and Mixed Dishes) PIZZA
DESSERTS AND SWEET SNACKS CHIPS, CRACKERS, AND SAVORY SNACKS
SOUPS STARCHY VEGETABLES
%

73
2020 Dietary Guidelines Advisory Committee Data Supplement: Food Category Sources
https://www.dietaryguidelines.gov/2020-advisory-committee-report/data-analysis
Percent of dietary fiber intakes, 2013-16, for U.S. population ages 2 years and
older, from WWEIA Food Categories
These data are estimates of the percent of dietary fiber from WWEIA Food Categories, re-grouped into DGAC major categories and sub-categories as described elsewhere, for individuals 2 years and older based on the day 1 dietary recalls from WWEIA, NHANES 2013-16. Breastfed children, and pregnant and lactating women have been excluded. The sample size is 15,807.
WHOLE SAMPLE (MALES + FEMALES)
Table 5. 1: Males and Females- Distribution of total dietary fiber intake (percentages) across major categories
DGAC major category Age Groups (Years)
2+ 2-5 6-11 12-19 20-40 41-50 51-70 71+
%
MIXED DISHES 32.38 27.43 32.97 37.31 36.36 32.25 29.02 25.93
VEGETABLES 19.61 13.25 12.22 14.52 20.37 21.81 22.79 21.66
GRAINS 15.73 17.13 18.00 15.75 13.41 15.00 16.25 19.66
SNACKS AND SWEETS 12.88 15.32 17.05 14.49 11.84 12.01 12.26 11.88
FRUITS+FRUIT JUICE 10.22 18.86 12.02 10.25 8.32 8.10 9.99 13.26
PROTEIN FOODS 4.46 3.43 3.55 3.61 4.18 5.31 5.32 4.10
BEVERAGES (Not incl. Milk and 100% Fruit Juice)
1.89 1.10 1.13 1.06 2.37 2.28 1.93 1.93
CONDIMENTS, GRAVIES, SPREADS, SALAD DRESSINGS
1.31 0.54 0.63 1.01 1.90 1.54 1.31 0.62
DAIRY 1.16 2.19 2.14 1.66 0.84 1.46 0.84 0.53
TOTAL* 99.64 99.26 99.72 99.64 99.58 99.76 99.72 99.57
*Totals are less than 100% because results do not include baby foods, infant formulas and WWEIA category – other

74
2020 Dietary Guidelines Advisory Committee Data Supplement: Food Category Sources
https://www.dietaryguidelines.gov/2020-advisory-committee-report/data-analysis
Table 5. 2: Males and Females - Distribution of total dietary fiber intake (percentages) across sub- categories
DGAC sub-category Age Groups (Years)
2+ 2-5 6-11 12-19 20-40 41-50 51-70 71+
%
BURGERS AND SANDWICHES (incl. Tacos and Burritos)
14.42 11.01 13.54 16.22 17.00 13.79 13.15 11.46
VEGETABLES (Incl. Beans and Peas, not Starchy)
12.47 7.46 6.52 7.64 12.66 14.67 15.33 14.76
FRUIT (Non-Juice) 9.46 16.97 10.92 9.39 7.58 7.62 9.51 12.41
RICE, PASTA AND OTHER GRAIN- BASED MIXED DISHES
7.81 8.85 8.34 8.81 8.63 8.36 6.62 5.54
STARCHY VEGETABLES 7.14 5.79 5.70 6.87 7.71 7.14 7.46 6.90
BREAKFAST CEREALS AND BARS 7.11 9.13 8.93 7.83 5.53 5.93 7.37 9.37
CHIPS, CRACKERS, AND SAVORY SNACKS
6.18 7.95 8.83 7.56 6.25 6.01 5.43 3.23
YEAST BREADS AND TORTILLAS 5.53 4.21 4.80 4.24 5.07 6.01 6.15 7.53
DESSERTS AND SWEET SNACKS 5.44 6.44 6.89 5.61 4.53 4.87 5.28 7.40
PIZZA 4.69 4.66 7.06 8.13 5.64 3.98 2.74 1.94
MEAT, POULTRY, SEAFOOD MIXED DISHES
3.27 1.37 2.16 2.51 3.05 3.85 3.97 4.19
NUTS, SEEDS, AND SOY 2.79 1.16 1.28 1.32 2.41 3.63 4.08 3.15
SOUPS 2.18 1.54 1.86 1.65 2.03 2.28 2.54 2.81
QUICK BREADS (Biscuits, Muffins, Pancakes, Waffles)
1.78 2.63 3.23 2.42 1.28 1.76 1.45 1.67
SUGAR-SWEETENED AND DIET BEVERAGES
1.47 0.74 1.05 0.90 1.93 1.67 1.31 1.67
RICE AND PASTA 1.31 1.17 1.04 1.26 1.54 1.31 1.29 1.10
CONDIMENTS AND GRAVIES 1.30 0.54 0.62 1.00 1.87 1.53 1.29 0.60
CANDY AND SUGARS 1.26 0.93 1.34 1.32 1.06 1.13 1.56 1.24

75
2020 Dietary Guidelines Advisory Committee Data Supplement: Food Category Sources
https://www.dietaryguidelines.gov/2020-advisory-committee-report/data-analysis
POULTRY (Not incl. Deli and Mixed Dishes)
1.07 1.84 1.86 1.88 1.08 0.86 0.63 0.45
HIGHER FAT MILK/YOGURT 0.88 1.81 1.73 1.07 0.61 1.25 0.64 0.35
100 % FRUIT JUICE 0.75 1.88 1.10 0.86 0.74 0.48 0.49 0.85
SEAFOOD (Not incl. Mixed Dishes) 0.31 0.28 0.21 0.22 0.28 0.52 0.30 0.29
COFFEE AND TEA 0.30 0.02 0.04 0.13 0.31 0.47 0.45 0.17
LOWFAT MILK/YOGURT 0.17 0.35 0.24 0.21 0.12 0.16 0.14 0.17
EGGS 0.13 0.04 0.04 0.06 0.17 0.17 0.16 0.13
CHEESE 0.11 0.02 0.17 0.37 0.12 0.04 0.06 0.02
MEATS (Not incl. Deli and Mixed Dishes) 0.10 0.08 0.13 0.08 0.12 0.10 0.10 0.06
WATERS 0.07 0.35 0.04 0.01 0.05 0.06 0.08 0.07
DELI/CURED PRODUCTS (Meat and Poultry)
0.06 0.03 0.03 0.06 0.12 0.03 0.05 0.02
ALCOHOLIC BEVERAGES 0.06 0.00 0.00 0.02 0.08 0.08 0.08 0.03
SALAD DRESSINGS 0.02 0.00 0.01 0.01 0.02 0.01 0.02 0.01
SPREADS 0.00 0.00 0.00 0.00 0.00 0.00 0.00 0.00
TOTAL* 99.64 99.26 99.72 99.64 99.58 99.76 99.72 99.57
*Totals are less than 100% because results do not include baby foods, infant formulas and WWEIA category – other
(continued from previous page)

76
2020 Dietary Guidelines Advisory Committee Data Supplement: Food Category Sources
https://www.dietaryguidelines.gov/2020-advisory-committee-report/data-analysis
MALES
Table 5. 3: Males - Distribution of total dietary fiber intake (percentages) across major categories
DGAC major category Age Groups (Years)
2+ 2-5 6-11 12-19 20-40 41-50 51-70 71+
%
MIXED DISHES 34.60 28.41 35.47 39.42 39.81 35.15 30.74 26.64
VEGETABLES 18.32 12.25 11.29 12.60 18.51 20.69 22.18 22.69
GRAINS 15.49 17.21 16.60 15.83 13.14 14.90 16.26 20.64
SNACKS AND SWEETS 12.57 16.11 17.21 14.62 10.94 11.17 12.88 10.89
FRUITS+FRUIT JUICE 9.68 18.04 11.82 10.18 7.76 7.34 9.34 11.12
PROTEIN FOODS 4.37 2.96 3.29 3.67 4.29 5.62 5.06 4.32
BEVERAGES (Not incl. Milk and 100% Fruit Juice)
1.65 1.21 1.22 0.89 2.28 1.80 1.32 1.88
CONDIMENTS, GRAVIES, SPREADS, SALAD DRESSINGS
1.37 0.71 0.52 0.87 1.98 1.63 1.42 0.74
DAIRY 1.12 2.27 2.27 1.50 0.88 1.51 0.55 0.55
TOTAL* 99.15 99.16 99.70 99.59 99.58 99.82 99.75 99.48
*Totals are less than 100% because results do not include baby foods, infant formulas and WWEIA category – other

77
2020 Dietary Guidelines Advisory Committee Data Supplement: Food Category Sources
https://www.dietaryguidelines.gov/2020-advisory-committee-report/data-analysis
Table 5. 4: Males - Distribution of total dietary fiber intake (percentages) across sub-categories
DGAC sub-category Age Groups (Years)
2+ 2-5 6-11 12-19 20-40 41-50 51-70 71+
%
BURGERS AND SANDWICHES (incl. Tacos and Burritos)
16.10 12.06 15.11 18.00 19.49 15.71 14.42 13.10
VEGETABLES (Incl. Beans and Peas, not Starchy)
11.13 6.78 5.76 6.22 11.09 13.20 14.23 14.67
FRUIT (Non-Juice) 8.85 16.07 10.76 9.27 6.92 6.82 8.77 10.36
RICE, PASTA AND OTHER GRAIN-BASED MIXED DISHES
8.17 8.99 7.92 8.46 8.98 10.40 6.70 5.80
STARCHY VEGETABLES 7.19 5.47 5.53 6.38 7.42 7.50 7.95 8.02
BREAKFAST CEREALS AND BARS 6.91 8.63 8.86 7.75 5.53 5.28 6.80 10.39
CHIPS, CRACKERS, AND SAVORY SNACKS 6.20 8.84 9.19 7.30 6.09 5.46 5.77 2.94
YEAST BREADS AND TORTILLAS 5.50 4.48 3.69 4.27 4.98 6.61 6.57 7.36
DESSERTS AND SWEET SNACKS 5.20 6.35 6.53 6.01 3.97 4.70 5.52 6.97
PIZZA 5.05 5.14 7.93 8.87 6.28 3.49 3.00 1.28
MEAT, POULTRY, SEAFOOD MIXED DISHES
3.27 0.92 2.49 2.64 3.38 3.19 4.09 3.90
NUTS, SEEDS, AND SOY 2.57 0.70 1.03 1.14 2.33 3.76 3.82 3.24
SOUPS 2.02 1.30 2.02 1.46 1.67 2.36 2.54 2.55
QUICK BREADS (Biscuits, Muffins, Pancakes, Waffles)
1.75 2.83 3.14 2.57 1.23 1.38 1.51 1.73
CONDIMENTS AND GRAVIES 1.35 0.71 0.51 0.86 1.95 1.62 1.41 0.72
RICE AND PASTA 1.33 1.28 0.91 1.23 1.39 1.63 1.38 1.16
SUGAR-SWEETENED AND DIET BEVERAGES
1.30 0.81 1.15 0.75 1.88 1.45 0.86 1.61
POULTRY (Not incl. Deli and Mixed Dishes) 1.18 1.86 1.84 2.08 1.20 0.94 0.71 0.45
CANDY AND SUGARS 1.16 0.92 1.49 1.31 0.88 1.01 1.59 0.98
HIGHER FAT MILK/YOGURT 0.88 1.89 1.82 1.11 0.66 1.28 0.45 0.34

78
2020 Dietary Guidelines Advisory Committee Data Supplement: Food Category Sources
https://www.dietaryguidelines.gov/2020-advisory-committee-report/data-analysis
100 % FRUIT JUICE 0.83 1.97 1.06 0.91 0.84 0.52 0.57 0.76
SEAFOOD (Not incl. Mixed Dishes) 0.31 0.28 0.17 0.22 0.29 0.67 0.23 0.38
COFFEE AND TEA 0.21 0.02 0.03 0.13 0.29 0.24 0.27 0.17
LOWFAT MILK/YOGURT 0.16 0.34 0.26 0.24 0.09 0.21 0.08 0.20
MEATS (Not incl. Deli and Mixed Dishes) 0.12 0.05 0.19 0.09 0.15 0.11 0.13 0.03
EGGS 0.11 0.04 0.02 0.07 0.16 0.11 0.09 0.18
DELI/CURED PRODUCTS (Meat and Poultry)
0.09 0.03 0.05 0.07 0.16 0.02 0.09 0.02
CHEESE 0.08 0.03 0.18 0.15 0.13 0.02 0.01 0.01
WATERS 0.08 0.38 0.04 0.01 0.03 0.03 0.08 0.06
ALCOHOLIC BEVERAGES 0.06 0.00 0.00 0.01 0.08 0.09 0.10 0.05
SALAD DRESSINGS 0.02 0.00 0.01 0.01 0.03 0.01 0.01 0.02
SPREADS 0.00 0.00 0.00 0.00 0.00 0.00 0.00 0.00
TOTAL* 99.15 99.16 99.70 99.59 99.58 99.82 99.75 99.48
*Totals are less than 100% because results do not include baby foods, infant formulas and WWEIA category – other
(continued from previous page)
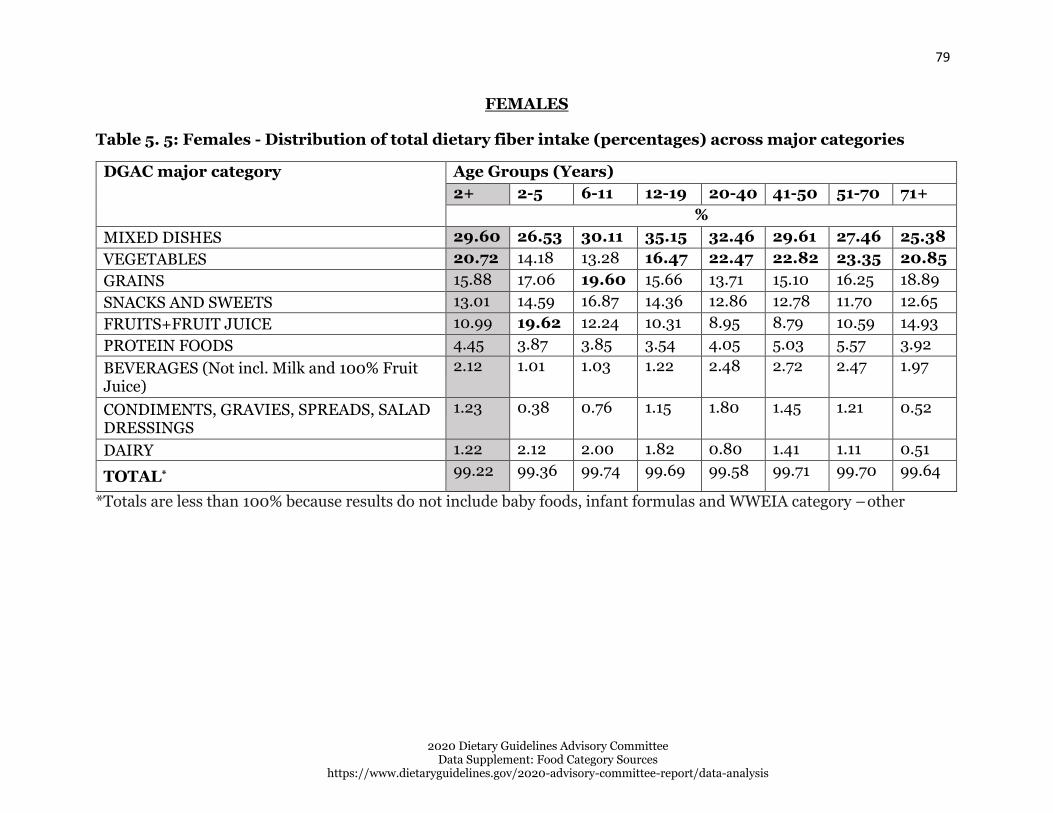
79
2020 Dietary Guidelines Advisory Committee Data Supplement: Food Category Sources
https://www.dietaryguidelines.gov/2020-advisory-committee-report/data-analysis
FEMALES
Table 5. 5: Females - Distribution of total dietary fiber intake (percentages) across major categories
DGAC major category Age Groups (Years)
2+ 2-5 6-11 12-19 20-40 41-50 51-70 71+
%
MIXED DISHES 29.60 26.53 30.11 35.15 32.46 29.61 27.46 25.38
VEGETABLES 20.72 14.18 13.28 16.47 22.47 22.82 23.35 20.85
GRAINS 15.88 17.06 19.60 15.66 13.71 15.10 16.25 18.89
SNACKS AND SWEETS 13.01 14.59 16.87 14.36 12.86 12.78 11.70 12.65
FRUITS+FRUIT JUICE 10.99 19.62 12.24 10.31 8.95 8.79 10.59 14.93
PROTEIN FOODS 4.45 3.87 3.85 3.54 4.05 5.03 5.57 3.92
BEVERAGES (Not incl. Milk and 100% Fruit Juice)
2.12 1.01 1.03 1.22 2.48 2.72 2.47 1.97
CONDIMENTS, GRAVIES, SPREADS, SALAD DRESSINGS
1.23 0.38 0.76 1.15 1.80 1.45 1.21 0.52
DAIRY 1.22 2.12 2.00 1.82 0.80 1.41 1.11 0.51
TOTAL* 99.22 99.36 99.74 99.69 99.58 99.71 99.70 99.64
*Totals are less than 100% because results do not include baby foods, infant formulas and WWEIA category – other

80
2020 Dietary Guidelines Advisory Committee Data Supplement: Food Category Sources
https://www.dietaryguidelines.gov/2020-advisory-committee-report/data-analysis
Table 5. 6: Females - Distribution of total dietary fiber intake (percentages) across sub-categories
DGAC sub-category Age Groups (Years)
2+ 2-5 6-11 12-19 20-40 41-50 51-70 71+
%
VEGETABLES (Incl. Beans and Peas, not Starchy)
13.68 8.08 7.39 9.10 14.43 16.01 16.33 14.83
BURGERS AND SANDWICHES (incl. Tacos and Burritos)
12.40 10.03 11.75 14.40 14.20 12.03 11.99 10.18
FRUIT (Non-Juice) 10.27 17.81 11.10 9.50 8.32 8.34 10.18 14.02
RICE, PASTA AND OTHER GRAIN-BASED MIXED DISHES
7.41 8.72 8.82 9.17 8.24 6.50 6.55 5.34
BREAKFAST CEREALS AND BARS 7.33 9.60 9.01 7.91 5.52 6.52 7.88 8.56
STARCHY VEGETABLES 7.03 6.09 5.89 7.37 8.04 6.81 7.02 6.02
CHIPS, CRACKERS, AND SAVORY SNACKS 6.10 7.12 8.42 7.83 6.44 6.52 5.11 3.46
DESSERTS AND SWEET SNACKS 5.59 6.53 7.29 5.20 5.17 5.03 5.06 7.74
YEAST BREADS AND TORTILLAS 5.49 3.95 6.06 4.20 5.16 5.47 5.76 7.66
PIZZA 4.25 4.22 6.08 7.37 4.92 4.42 2.51 2.46
MEAT, POULTRY, SEAFOOD MIXED DISHES 3.24 1.79 1.78 2.37 2.67 4.45 3.86 4.41
NUTS, SEEDS, AND SOY 2.91 1.59 1.56 1.50 2.50 3.52 4.31 3.08
SOUPS 2.31 1.76 1.68 1.84 2.43 2.21 2.54 3.00
QUICK BREADS (Biscuits, Muffins, Pancakes, Waffles)
1.78 2.45 3.34 2.25 1.32 2.11 1.40 1.63
SUGAR-SWEETENED AND DIET BEVERAGES
1.60 0.67 0.94 1.05 1.99 1.88 1.71 1.71
CANDY AND SUGARS 1.32 0.94 1.16 1.33 1.25 1.23 1.53 1.45
RICE AND PASTA 1.29 1.07 1.19 1.30 1.70 1.01 1.21 1.05
CONDIMENTS AND GRAVIES 1.21 0.38 0.74 1.13 1.78 1.43 1.17 0.52
POULTRY (Not incl. Deli and Mixed Dishes) 0.97 1.81 1.89 1.67 0.94 0.78 0.56 0.45
HIGHER FAT MILK/YOGURT 0.90 1.74 1.63 1.04 0.55 1.23 0.81 0.35
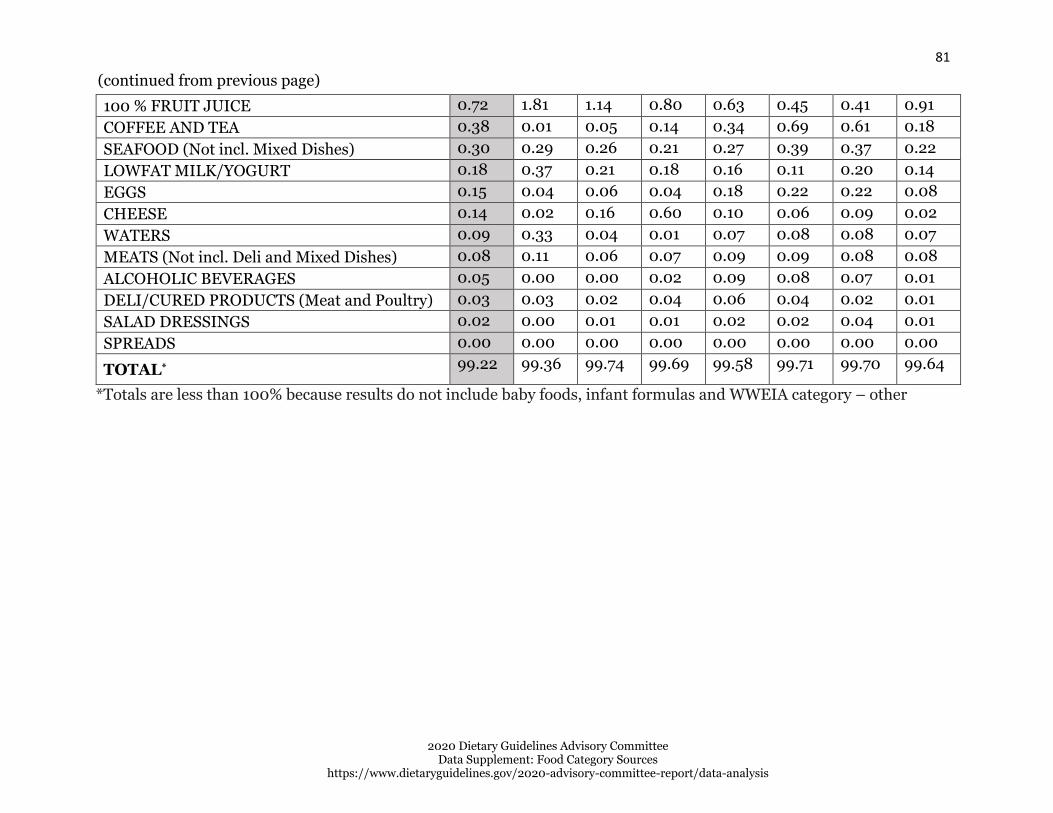
81
2020 Dietary Guidelines Advisory Committee Data Supplement: Food Category Sources
https://www.dietaryguidelines.gov/2020-advisory-committee-report/data-analysis
100 % FRUIT JUICE 0.72 1.81 1.14 0.80 0.63 0.45 0.41 0.91
COFFEE AND TEA 0.38 0.01 0.05 0.14 0.34 0.69 0.61 0.18
SEAFOOD (Not incl. Mixed Dishes) 0.30 0.29 0.26 0.21 0.27 0.39 0.37 0.22
LOWFAT MILK/YOGURT 0.18 0.37 0.21 0.18 0.16 0.11 0.20 0.14
EGGS 0.15 0.04 0.06 0.04 0.18 0.22 0.22 0.08
CHEESE 0.14 0.02 0.16 0.60 0.10 0.06 0.09 0.02
WATERS 0.09 0.33 0.04 0.01 0.07 0.08 0.08 0.07
MEATS (Not incl. Deli and Mixed Dishes) 0.08 0.11 0.06 0.07 0.09 0.09 0.08 0.08
ALCOHOLIC BEVERAGES 0.05 0.00 0.00 0.02 0.09 0.08 0.07 0.01
DELI/CURED PRODUCTS (Meat and Poultry) 0.03 0.03 0.02 0.04 0.06 0.04 0.02 0.01
SALAD DRESSINGS 0.02 0.00 0.01 0.01 0.02 0.02 0.04 0.01
SPREADS 0.00 0.00 0.00 0.00 0.00 0.00 0.00 0.00
TOTAL* 99.22 99.36 99.74 99.69 99.58 99.71 99.70 99.64
*Totals are less than 100% because results do not include baby foods, infant formulas and WWEIA category – other
(continued from previous page)

82
2020 Dietary Guidelines Advisory Committee Data Supplement: Food Category Sources
https://www.dietaryguidelines.gov/2020-advisory-committee-report/data-analysis
Figure 5. 1: Males and Females - Distribution of total dietary fiber intake (percentages) across major categories
100
90
80
70
60
50
40
30
20
10
0 2+
MIXED DISHES
GRAINS
2-5 years 6-11 years 12-19 years 20-40 years 41-50 years 51-70 years
VEGETABLES
SNACKS AND SWEETS
71+
FRUITS+FRUIT JUICE PROTEIN FOODS
BEVERAGES (Not incl. Milk and 100% Fruit Juice) CONDIMENTS, GRAVIES, SPREADS, SALAD DRESSINGS
DAIRY
%

83
2020 Dietary Guidelines Advisory Committee Data Supplement: Food Category Sources
https://www.dietaryguidelines.gov/2020-advisory-committee-report/data-analysis
Figure 5. 2: Males and Females - Distribution of total dietary fiber intake (percentages) across top 10 sub- categories
100
90
80
70
60
50
40
30
20
10
0
2+ 2-5 years 6-11 years 12-19 years 20-40 years 41-50 years 51-70 years 71+
BURGERS AND SANDWICHES (incl. tacos and burritos) VEGETABLES (Incl. Beans and Peas, not Starchy)
FRUIT (non-juice) RICE, PASTA AND OTHER GRAIN-BASED MIXED DISHES
STARCHY VEGETABLES BREAKFAST CEREALS AND BARS
CHIPS, CRACKERS, AND SAVORY SNACKS YEAST BREADS AND TORTILLAS
DESSERTS AND SWEET SNACKS PIZZA
%
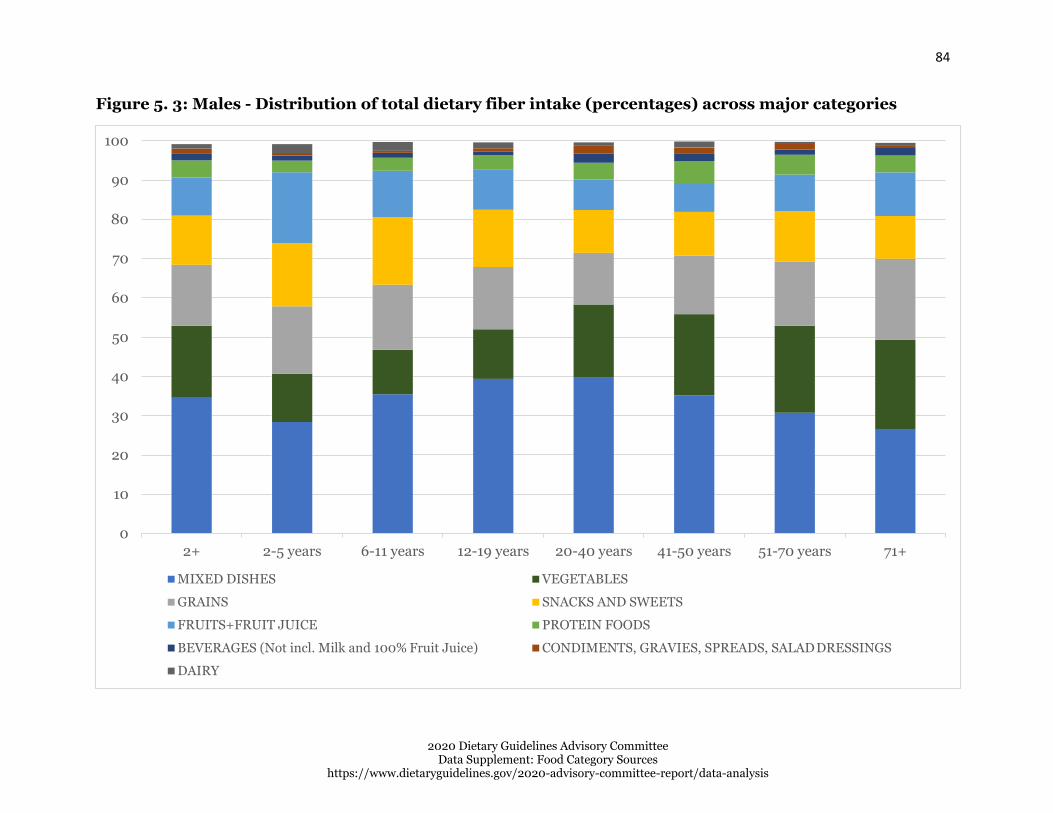
84
2020 Dietary Guidelines Advisory Committee Data Supplement: Food Category Sources
https://www.dietaryguidelines.gov/2020-advisory-committee-report/data-analysis
Figure 5. 3: Males - Distribution of total dietary fiber intake (percentages) across major categories
100
90
80
70
60
50
40
30
20
10
0 2+ 2-5 years 6-11 years 12-19 years 20-40 years 41-50 years 51-70 years 71+
MIXED DISHES VEGETABLES
GRAINS SNACKS AND SWEETS
FRUITS+FRUIT JUICE PROTEIN FOODS
BEVERAGES (Not incl. Milk and 100% Fruit Juice) CONDIMENTS, GRAVIES, SPREADS, SALAD DRESSINGS
DAIRY

85
2020 Dietary Guidelines Advisory Committee Data Supplement: Food Category Sources
https://www.dietaryguidelines.gov/2020-advisory-committee-report/data-analysis
Figure 5. 4: Males - Distribution of total dietary fiber intake (percentages) across top 10 sub-categories
100
90
80
70
60
50
40
30
20
10
0 2+ 2-5 years 6-11 years 12-19 years 20-40 years 41-50 years 51-70 years 71+
BURGERS AND SANDWICHES (incl. tacos and burritos) VEGETABLES (Incl. Beans and Peas, not Starchy)
FRUIT (non-juice) RICE, PASTA AND OTHER GRAIN-BASED MIXED DISHES
STARCHY VEGETABLES BREAKFAST CEREALS AND BARS
CHIPS, CRACKERS, AND SAVORY SNACKS YEAST BREADS AND TORTILLAS
DESSERTS AND SWEET SNACKS PIZZA
%
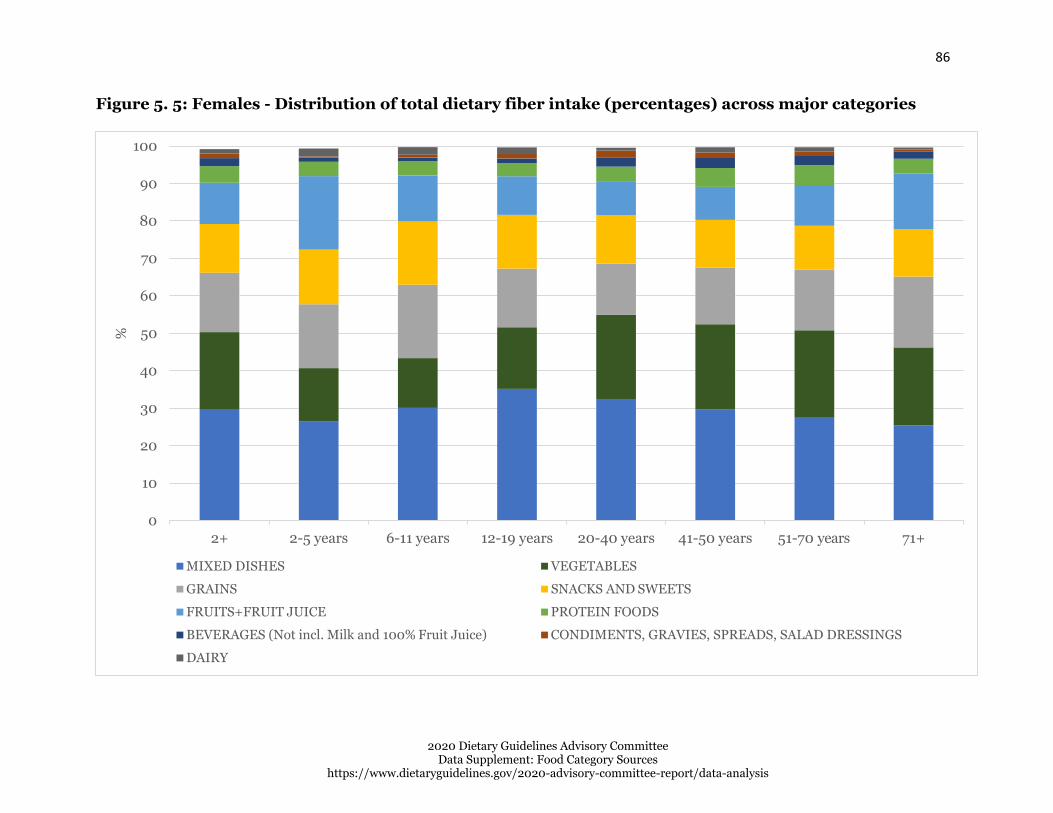
86
2020 Dietary Guidelines Advisory Committee Data Supplement: Food Category Sources
https://www.dietaryguidelines.gov/2020-advisory-committee-report/data-analysis
Figure 5. 5: Females - Distribution of total dietary fiber intake (percentages) across major categories
100
90
80
70
60
50
40
30
20
10
0 2+
MIXED DISHES
GRAINS
2-5 years 6-11 years 12-19 years 20-40 years 41-50 years 51-70 years
VEGETABLES
SNACKS AND SWEETS
71+
FRUITS+FRUIT JUICE PROTEIN FOODS
BEVERAGES (Not incl. Milk and 100% Fruit Juice) CONDIMENTS, GRAVIES, SPREADS, SALAD DRESSINGS
DAIRY
%

87
2020 Dietary Guidelines Advisory Committee Data Supplement: Food Category Sources
https://www.dietaryguidelines.gov/2020-advisory-committee-report/data-analysis
Figure 5. 6: Females - Distribution of total dietary fiber intake (percentages) across top 10 sub-categories
100
90
80
70
60
50
40
30
20
10
0 2+ 2-5 years 6-11 years 12-19 years 20-40 years 41-50 years 51-70 years 71+
VEGETABLES (Incl. Beans and Peas, not Starchy) BURGERS AND SANDWICHES (incl. tacos and burritos)
FRUIT (non-juice) RICE, PASTA AND OTHER GRAIN-BASED MIXED DISHES
BREAKFAST CEREALS AND BARS STARCHY VEGETABLES
CHIPS, CRACKERS, AND SAVORY SNACKS DESSERTS AND SWEET SNACKS
YEAST BREADS AND TORTILLAS PIZZA
%

88
2020 Dietary Guidelines Advisory Committee Data Supplement: Food Category Sources
https://www.dietaryguidelines.gov/2020-advisory-committee-report/data-analysis
Percent of vitamin D intakes, 2013-16, for U.S. population ages 2 years and
older, from WWEIA Food Categories
These data are estimates of the percent of vitamin D from WWEIA Food Categories, re-grouped into DGAC major categories and sub-categories as described elsewhere, for individuals 2 years and older based on the day 1 dietary recalls from WWEIA, NHANES 2013-16. Breastfed children, and pregnant and lactating women have been excluded. The sample size is 15,807.
WHOLE SAMPLE (MALES + FEMALES)
Table 6. 1: Males and Females - Distribution of total vitamin D intake (percentages) across major categories
DGAC major category Age Groups (Years)
2+ 2-5 6-11 12-19 20-40 41-50 51-70 71+
%
DAIRY 28.66 60.76 50.83 37.51 20.01 20.90 24.51 28.57
MIXED DISHES 25.12 9.70 17.18 24.92 31.41 27.49 24.71 19.81
PROTEIN FOODS 19.60 12.23 11.79 13.56 21.54 22.45 22.22 20.84
GRAINS 8.63 11.17 12.17 11.47 6.61 6.87 8.02 10.99
BEVERAGES (Not incl. Milk and 100% Fruit Juice) 7.75 1.06 1.24 3.41 10.34 10.48 8.88 7.70
SNACKS AND SWEETS 3.79 1.78 3.08 3.42 3.49 4.22 4.38 4.70
VEGETABLES 3.73 0.50 1.01 3.39 4.13 5.27 4.30 3.48
CONDIMENTS, GRAVIES, SPREADS, SALAD DRESSINGS
1.23 0.20 1.00 1.06 0.93 1.01 1.77 1.93
FRUITS+FRUIT JUICE 0.76 0.90 0.84 0.65 0.69 0.94 0.53 1.34
TOTAL* 99.25 98.29 99.14 99.38 99.13 99.63 99.32 99.37
*Totals are less than 100% because results do not include baby foods, infant formulas and WWEIA category – other

89
2020 Dietary Guidelines Advisory Committee Data Supplement: Food Category Sources
https://www.dietaryguidelines.gov/2020-advisory-committee-report/data-analysis
Table 6. 2: Males and Females - Distribution of total vitamin D intake (percentages) across sub-categories
DGAC sub-category Age Groups (Years)
2+ 2-5 6-11 12-19 20-40 41-50 51-70 71+
%
HIGHER FAT MILK/YOGURT 17.76 43.52 30.85 23.40 12.27 13.31 14.28 17.26
BURGERS AND SANDWICHES (incl. Tacos and Burritos)
16.53 7.22 11.75 16.18 21.26 17.33 15.72 13.28
LOWFAT MILK/YOGURT 8.03 14.54 17.35 11.20 4.31 5.48 7.23 9.29
EGGS 7.71 5.97 4.51 4.50 8.36 8.13 8.79 9.96
BREAKFAST CEREALS AND BARS 6.48 9.67 9.57 8.67 4.59 5.12 5.75 9.04
COFFEE AND TEA 4.39 0.13 0.40 2.10 5.42 6.38 5.61 3.78
SEAFOOD (Not incl. Mixed Dishes) 4.01 1.20 1.26 1.70 4.35 5.91 4.83 4.89
RICE, PASTA AND OTHER GRAIN- BASED MIXED DISHES
4.00 1.80 3.14 4.72 5.46 4.27 3.38 2.08
DESSERTS AND SWEET SNACKS 3.59 1.71 3.00 3.09 3.24 3.77 4.32 4.65
SUGAR-SWEETENED AND DIET BEVERAGES
3.22 0.83 0.80 1.31 4.74 3.91 3.10 3.80
POULTRY (Not incl. Deli and Mixed Dishes)
2.97 1.71 2.67 3.83 3.69 3.13 2.70 1.20
CHEESE 2.86 2.70 2.63 2.90 3.43 2.11 3.00 2.02
MEAT, POULTRY, SEAFOOD MIXED DISHES
2.78 0.40 1.40 2.34 2.74 3.44 3.63 2.69
MEATS (Not incl. Deli and Mixed Dishes) 2.51 0.75 1.13 1.83 3.00 3.09 2.98 1.88
VEGETABLES (Incl. Beans and Peas, not Starchy)
2.42 0.22 0.43 1.77 2.73 3.88 2.86 2.01
DELI/CURED PRODUCTS (Meat and Poultry)
2.40 2.60 2.21 1.71 2.14 2.20 2.92 2.91
QUICK BREADS (Biscuits, Muffins, Pancakes, Waffles)
1.73 1.34 2.26 2.35 1.56 1.39 1.76 1.61
STARCHY VEGETABLES 1.31 0.28 0.58 1.61 1.40 1.40 1.44 1.48

90
2020 Dietary Guidelines Advisory Committee Data Supplement: Food Category Sources
https://www.dietaryguidelines.gov/2020-advisory-committee-report/data-analysis
SOUPS 1.12 0.16 0.43 0.40 1.10 1.76 1.42 1.51
SPREADS 0.76 0.07 0.62 0.30 0.41 0.66 1.30 1.59
100 % FRUIT JUICE 0.74 0.90 0.80 0.64 0.67 0.93 0.52 1.26
PIZZA 0.68 0.12 0.46 1.28 0.85 0.69 0.57 0.26
CONDIMENTS AND GRAVIES 0.38 0.11 0.35 0.71 0.37 0.33 0.38 0.32
YEAST BREADS AND TORTILLAS 0.27 0.11 0.17 0.27 0.30 0.22 0.33 0.21
CHIPS, CRACKERS, AND SAVORY SNACKS
0.17 0.05 0.07 0.31 0.21 0.41 0.04 0.01
RICE AND PASTA 0.15 0.04 0.16 0.18 0.15 0.14 0.18 0.13
ALCOHOLIC BEVERAGES 0.10 0.00 0.00 0.01 0.16 0.08 0.16 0.05
SALAD DRESSINGS 0.08 0.01 0.04 0.05 0.16 0.02 0.09 0.02
WATERS 0.04 0.10 0.04 0.00 0.02 0.10 0.01 0.07
CANDY AND SUGARS 0.03 0.02 0.01 0.02 0.04 0.04 0.02 0.03
FRUIT (Non-Juice) 0.02 0.00 0.04 0.00 0.02 0.01 0.01 0.08
NUTS, SEEDS, AND SOY 0.00 0.00 0.00 0.00 0.00 0.00 0.00 0.00
TOTAL* 99.25 98.29 99.14 99.38 99.13 99.63 99.32 99.37
*Totals are less than 100% because results do not include baby foods, infant formulas and WWEIA category – other
(continued from previous page)

91
2020 Dietary Guidelines Advisory Committee Data Supplement: Food Category Sources
https://www.dietaryguidelines.gov/2020-advisory-committee-report/data-analysis
MALES
Table 6. 3: Males - Distribution of total vitamin D intake (percentages) across major categories
DGAC major category Age Groups (Years)
2+ 2-5 6-11 12-19 20-40 41-50 51-70 71+
%
DAIRY 28.89 58.69 51.80 39.75 19.71 20.75 23.34 27.78
MIXED DISHES 26.85 10.70 18.14 25.12 34.52 30.89 27.51 19.00
PROTEIN FOODS 19.74 13.35 11.21 13.69 21.77 22.85 22.78 24.55
GRAINS 8.30 11.13 11.62 11.49 6.44 5.61 8.17 11.39
BEVERAGES (Not incl. Milk and 100% Fruit Juice)
6.48 1.25 1.36 2.26 9.39 7.89 7.42 6.82
SNACKS AND SWEETS 3.36 1.80 2.54 2.89 2.87 4.45 4.33 3.95
VEGETABLES 3.10 0.48 1.08 2.78 2.87 5.69 3.71 3.17
CONDIMENTS, GRAVIES, SPREADS, SALAD DRESSINGS
0.92 0.16 0.56 0.56 0.84 0.74 1.46 1.49
FRUITS+FRUIT JUICE 0.76 0.81 0.91 0.62 0.81 0.95 0.54 1.11
TOTAL*98.41 98.39 99.23 99.17 99.22 99.82 99.26 99.26
*Totals are less than 100% because results do not include baby foods, infant formulas and WWEIA category – other

92
2020 Dietary Guidelines Advisory Committee Data Supplement: Food Category Sources
https://www.dietaryguidelines.gov/2020-advisory-committee-report/data-analysis
Table 6. 4: Males - Distribution of total vitamin D intake (percentages) across sub-categories
DGAC sub-category Age Groups (Years)
2+ 2-5 6-11 12-19 20-40 41-50 51-70 71+
%
HIGHER FAT MILK/YOGURT 18.62 42.58 31.05 26.30 12.98 13.57 13.39 16.88
BURGERS AND SANDWICHES (incl. Tacos and Burritos)
18.57 8.15 12.48 16.62 24.41 20.82 18.74 13.84
LOWFAT MILK/YOGURT 7.83 13.64 18.54 11.26 3.90 5.68 6.85 9.31
EGGS 7.61 5.57 4.49 4.93 7.97 7.52 8.90 12.36
BREAKFAST CEREALS AND BARS 6.25 9.25 9.53 8.58 4.27 4.55 5.69 10.15
RICE, PASTA AND OTHER GRAIN-BASED MIXED DISHES
3.85 1.80 3.15 4.12 5.30 4.83 3.06 1.86
SEAFOOD (Not incl. Mixed Dishes) 3.70 1.79 0.99 1.54 4.24 5.66 4.21 5.24
COFFEE AND TEA 3.43 0.11 0.36 0.95 4.50 5.04 4.66 3.16
DESSERTS AND SWEET SNACKS 3.15 1.71 2.46 2.57 2.71 3.63 4.25 3.91
POULTRY (Not incl. Deli and Mixed Dishes) 2.97 2.26 2.28 3.63 3.90 3.69 2.35 1.29
MEATS (Not incl. Deli and Mixed Dishes) 2.93 1.13 1.13 1.90 3.57 3.31 4.04 1.93
SUGAR-SWEETENED AND DIET BEVERAGES
2.89 1.13 0.93 1.31 4.75 2.55 2.52 3.57
MEAT, POULTRY, SEAFOOD MIXED DISHES
2.66 0.48 1.30 2.54 2.91 2.80 3.65 2.01
DELI/CURED PRODUCTS (Meat and Poultry)
2.54 2.61 2.32 1.68 2.10 2.67 3.29 3.73
CHEESE 2.44 2.46 2.21 2.19 2.83 1.50 3.10 1.60
VEGETABLES (Incl. Beans and Peas, not Starchy)
1.82 0.20 0.42 1.48 1.67 4.08 1.98 1.81
QUICK BREADS (Biscuits, Muffins, Pancakes, Waffles)
1.69 1.62 1.81 2.50 1.66 0.95 2.06 1.03
STARCHY VEGETABLES 1.28 0.28 0.65 1.30 1.20 1.61 1.72 1.36
SOUPS 0.98 0.11 0.59 0.19 0.77 1.86 1.52 1.13
PIZZA 0.78 0.17 0.62 1.64 1.12 0.59 0.53 0.15

93
2020 Dietary Guidelines Advisory Committee Data Supplement: Food Category Sources
https://www.dietaryguidelines.gov/2020-advisory-committee-report/data-analysis
100 % FRUIT JUICE 0.75 0.81 0.91 0.62 0.80 0.95 0.54 1.07
SPREADS 0.58 0.09 0.28 0.17 0.25 0.65 1.13 1.31
CONDIMENTS AND GRAVIES 0.28 0.07 0.25 0.36 0.44 0.06 0.26 0.17
YEAST BREADS AND TORTILLAS 0.23 0.19 0.14 0.37 0.34 0.09 0.22 0.13
CHIPS, CRACKERS, AND SAVORY SNACKS 0.19 0.06 0.06 0.29 0.15 0.75 0.05 0.01
RICE AND PASTA 0.13 0.07 0.14 0.04 0.17 0.03 0.20 0.09
ALCOHOLIC BEVERAGES 0.11 0.00 0.00 0.00 0.13 0.09 0.22 0.09
SALAD DRESSINGS 0.07 0.00 0.03 0.02 0.15 0.03 0.07 0.01
WATERS 0.04 0.02 0.07 0.00 0.01 0.21 0.02 0.00
CANDY AND SUGARS 0.03 0.04 0.02 0.03 0.01 0.07 0.03 0.02
FRUIT (Non-Juice) 0.01 0.00 0.01 0.00 0.01 0.00 0.00 0.04
NUTS, SEEDS, AND SOY 0.00 0.00 0.00 0.00 0.00 0.00 0.00 0.00
TOTAL*98.41 98.39 99.23 99.17 99.22 99.82 99.26 99.26
*Totals are less than 100% because results do not include baby foods, infant formulas and WWEIA category – other
(continued from previous page)

94
2020 Dietary Guidelines Advisory Committee Data Supplement: Food Category Sources
https://www.dietaryguidelines.gov/2020-advisory-committee-report/data-analysis
FEMALES
Table 6. 5: Females - Distribution of total vitamin D intake (percentages) across major categories
DGAC major category Age Groups (Years)
2+ 2-5 6-11 12-19 20- 40
41-50 51-70 71+
%
DAIRY 29.14 62.66 49.72 35.14 20.34 21.05 25.58 29.21
MIXED DISHES 22.47 8.79 16.08 24.72 27.86 24.38 22.17 20.47
PROTEIN FOODS 18.83 11.20 12.45 13.42 21.27 22.09 21.70 17.87
BEVERAGES (Not incl. Milk and 100% Fruit Juice) 8.73 0.88 1.10 4.63 11.43 12.84 10.21 8.40
GRAINS 8.72 11.20 12.79 11.45 6.80 8.01 7.88 10.66
VEGETABLES 4.23 0.52 0.93 4.02 5.55 4.89 4.84 3.73
SNACKS AND SWEETS 4.07 1.75 3.71 3.97 4.19 4.01 4.43 5.29
CONDIMENTS, GRAVIES, SPREADS, SALAD DRESSINGS
1.49 0.23 1.51 1.58 1.03 1.26 2.06 2.29
FRUITS+FRUIT JUICE 0.73 0.98 0.76 0.67 0.55 0.94 0.51 1.53
TOTAL* 98.41 98.20 99.03 99.61 99.02 99.46 99.38 99.46
*Totals are less than 100% because results do not include baby foods, infant formulas and WWEIA category – other

95
2020 Dietary Guidelines Advisory Committee Data Supplement: Food Category Sources
https://www.dietaryguidelines.gov/2020-advisory-committee-report/data-analysis
Table 6. 6: Females - Distribution of total vitamin D intake (percentages) across sub-categories
DGAC sub-category Age Groups (Years)
2+ 2-5 6-11 12-19 20-40 41-50 51-70 71+
%
HIGHER FAT MILK/YOGURT 17.89 44.39 30.62 20.34 11.45 13.08 15.09 17.57
BURGERS AND SANDWICHES (incl. Tacos and Burritos)
13.86 6.36 10.91 15.72 17.66 14.15 12.97 12.83
LOWFAT MILK/YOGURT 8.07 15.36 15.99 11.14 4.78 5.30 7.58 9.27
EGGS 7.63 6.33 4.54 4.04 8.79 8.69 8.69 8.04
BREAKFAST CEREALS AND BARS 6.56 10.05 9.62 8.77 4.95 5.64 5.81 8.16
COFFEE AND TEA 5.16 0.15 0.45 3.32 6.46 7.61 6.47 4.28
SEAFOOD (Not incl. Mixed Dishes) 4.18 0.66 1.56 1.86 4.48 6.13 5.40 4.61
RICE, PASTA AND OTHER GRAIN-BASED MIXED DISHES
4.03 1.81 3.13 5.35 5.63 3.76 3.66 2.25
DESSERTS AND SWEET SNACKS 3.90 1.71 3.61 3.64 3.84 3.89 4.38 5.24
SUGAR-SWEETENED AND DIET BEVERAGES
3.44 0.56 0.64 1.31 4.72 5.15 3.63 3.98
CHEESE 3.18 2.92 3.11 3.66 4.11 2.67 2.91 2.36
VEGETABLES (Incl. Beans and Peas, not Starchy)
2.93 0.24 0.44 2.08 3.93 3.69 3.65 2.16
POULTRY (Not incl. Deli and Mixed Dishes) 2.86 1.21 3.12 4.03 3.45 2.62 3.03 1.12
MEAT, POULTRY, SEAFOOD MIXED DISHES
2.81 0.33 1.51 2.14 2.55 4.02 3.62 3.22
DELI/CURED PRODUCTS (Meat and Poultry)
2.18 2.58 2.09 1.75 2.18 1.77 2.58 2.25
MEATS (Not incl. Deli and Mixed Dishes) 1.98 0.41 1.13 1.75 2.36 2.89 2.01 1.84
QUICK BREADS (Biscuits, Muffins, Pancakes, Waffles)
1.70 1.09 2.78 2.19 1.46 1.79 1.48 2.07
STARCHY VEGETABLES 1.30 0.27 0.49 1.94 1.62 1.20 1.19 1.57
SOUPS 1.22 0.22 0.26 0.61 1.48 1.67 1.32 1.82
SPREADS 0.92 0.06 1.00 0.43 0.58 0.68 1.45 1.82

96
2020 Dietary Guidelines Advisory Committee Data Supplement: Food Category Sources
https://www.dietaryguidelines.gov/2020-advisory-committee-report/data-analysis
100 % FRUIT JUICE 0.69 0.98 0.68 0.67 0.51 0.91 0.49 1.41
PIZZA 0.55 0.08 0.28 0.90 0.53 0.78 0.60 0.35
CONDIMENTS AND GRAVIES 0.48 0.14 0.47 1.07 0.29 0.57 0.49 0.44
YEAST BREADS AND TORTILLAS 0.29 0.04 0.21 0.16 0.26 0.34 0.43 0.27
RICE AND PASTA 0.17 0.02 0.19 0.32 0.13 0.24 0.16 0.16
CHIPS, CRACKERS, AND SAVORY SNACKS 0.14 0.04 0.08 0.34 0.27 0.10 0.03 0.01
ALCOHOLIC BEVERAGES 0.09 0.00 0.00 0.01 0.20 0.08 0.10 0.01
SALAD DRESSINGS 0.09 0.02 0.04 0.08 0.16 0.01 0.11 0.02
FRUIT (Non-Juice) 0.04 0.00 0.08 0.00 0.04 0.02 0.02 0.12
WATERS 0.04 0.17 0.01 0.00 0.05 0.00 0.01 0.13
CANDY AND SUGARS 0.03 0.00 0.01 0.00 0.08 0.01 0.01 0.04
NUTS, SEEDS, AND SOY 0.00 0.00 0.00 0.00 0.00 0.00 0.00 0.00
TOTAL* 98.41 98.20 99.03 99.61 99.02 99.46 99.38 99.46
*Totals are less than 100% because results do not include baby foods, infant formulas and WWEIA category – other
(continued from previous page)

97
2020 Dietary Guidelines Advisory Committee Data Supplement: Food Category Sources
https://www.dietaryguidelines.gov/2020-advisory-committee-report/data-analysis
Figure 6. 1: Males and Females - Distribution of total vitamin D intake (percentages) across major categories
100
90
80
70
60
50
40
30
20
10
0
2+
DAIRY
2-5 years 6-11 years 12-19 years 20-40 years 41-50 years 51-70 years
MIXED DISHES
71+
PROTEIN FOODS GRAINS
BEVERAGES (Not incl. Milk and 100% Fruit Juice) SNACKS AND SWEETS
VEGETABLES CONDIMENTS, GRAVIES, SPREADS, SALAD DRESSINGS
FRUITS+FRUIT JUICE
%

98
2020 Dietary Guidelines Advisory Committee Data Supplement: Food Category Sources
https://www.dietaryguidelines.gov/2020-advisory-committee-report/data-analysis
100
90
80
70
60
50
40
30
20
10
0
HIGHER FAT MILK/YOGURT
LOWFAT MILK/YOGURT
BREAKFAST CEREALS AND BARS
SEAFOOD (Not incl. Mixed Dishes)
DESSERTS AND SWEET SNACKS
BURGERS AND SANDWICHES (incl. tacos and burritos)
EGGS
COFFEE AND TEA
RICE, PASTA AND OTHER GRAIN-BASED MIXED DISHES
SUGAR-SWEETENED AND DIET BEVERAGES
Figure 6. 2: Males and Females - Distribution of total vitamin D intake (percentages) across top 10 sub- categories
71+ 12-19 years 20-40 years 41-50 years 51-70 years6-11 years2-5 years2+
%

99
2020 Dietary Guidelines Advisory Committee Data Supplement: Food Category Sources
https://www.dietaryguidelines.gov/2020-advisory-committee-report/data-analysis
Figure 6. 3: Males - Distribution of total vitamin D intake (percentages) across major categories
100
90
80
70
60
50
40
30
20
10
0 2+
DAIRY
2-5 years 6-11 years 12-19 years 20-40 years 41-50 years 51-70 years
MIXED DISHES
71+
PROTEIN FOODS GRAINS
BEVERAGES (Not incl. Milk and 100% Fruit Juice) SNACKS AND SWEETS
VEGETABLES CONDIMENTS, GRAVIES, SPREADS, SALAD DRESSINGS
FRUITS+FRUIT JUICE
%
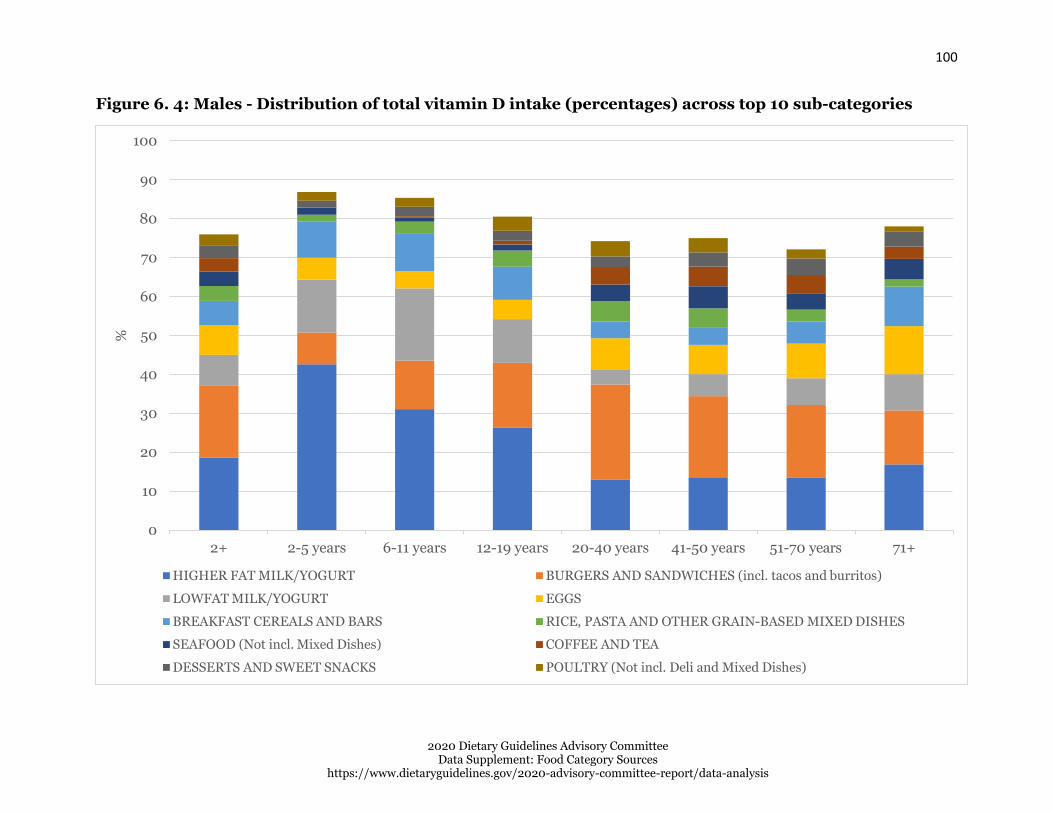
100
2020 Dietary Guidelines Advisory Committee Data Supplement: Food Category Sources
https://www.dietaryguidelines.gov/2020-advisory-committee-report/data-analysis
Figure 6. 4: Males - Distribution of total vitamin D intake (percentages) across top 10 sub-categories
100
90
80
70
60
50
40
30
20
10
0 2+ 2-5 years 6-11 years 12-19 years 20-40 years 41-50 years 51-70 years 71+
HIGHER FAT MILK/YOGURT BURGERS AND SANDWICHES (incl. tacos and burritos)
LOWFAT MILK/YOGURT EGGS
BREAKFAST CEREALS AND BARS RICE, PASTA AND OTHER GRAIN-BASED MIXED DISHES
SEAFOOD (Not incl. Mixed Dishes) COFFEE AND TEA
DESSERTS AND SWEET SNACKS POULTRY (Not incl. Deli and Mixed Dishes)
%

101
2020 Dietary Guidelines Advisory Committee Data Supplement: Food Category Sources
https://www.dietaryguidelines.gov/2020-advisory-committee-report/data-analysis
Figure 6. 5: Females - Distribution of total vitamin D intake (percentages) across major categories
100
90
80
70
60
50
40
30
20
10
0 2+
DAIRY
2-5 years 6-11 years 12-19 years 20-40 years 41-50 years 51-70 years
MIXED DISHES
71+
PROTEIN FOODS BEVERAGES (Not incl. Milk and 100% Fruit Juice)
GRAINS VEGETABLES
SNACKS AND SWEETS CONDIMENTS, GRAVIES, SPREADS, SALAD DRESSINGS
FRUITS+FRUIT JUICE
%

102
2020 Dietary Guidelines Advisory Committee Data Supplement: Food Category Sources
https://www.dietaryguidelines.gov/2020-advisory-committee-report/data-analysis
Figure 6. 6: Females - Distribution of total vitamin D intake (percentages) across top 10 sub-categories
100
90
80
70
60
50
40
30
20
10
0
2+ 2-5 years 6-11 years 12-19 years 20-40 years 41-50 years 51-70 years 71+
HIGHER FAT MILK/YOGURT BURGERS AND SANDWICHES (incl. tacos and burritos)
LOWFAT MILK/YOGURT EGGS
BREAKFAST CEREALS AND BARS COFFEE AND TEA
SEAFOOD (Not incl. Mixed Dishes) RICE, PASTA AND OTHER GRAIN-BASED MIXED DISHES
DESSERTS AND SWEET SNACKS SUGAR-SWEETENED AND DIET BEVERAGES
%

2020 Dietary Guidelines Advisory Committee Data Supplement: Food Category Sources
https://www.dietaryguidelines.gov/2020-advisory-committee-report/data-analysis
103
References
1. Centers for Disease Prevention and Control. National Health and NutritionExamination Survey: Survey Methods and Analytic Guidelines. Centers forDisease Prevention and Control Website:https://wwwn.cdc.gov/nchs/nhanes/AnalyticGuidelines.aspx#analytic- guidelines . Accessed March 22, 2019.
2. Agricultural Research Service, United States Department of Agriculture.WWEIA/NHANES Overview. Agricultural Research Service website:https://www.ars.usda.gov/northeast-area/beltsville-md-bhnrc/beltsville- human-nutrition-research-center/food-surveys-research- group/docs/wweianhanes-overview/. Updated July 31, 2018. Accessed March22, 2019.
3. Bowman SA, Clemens JC, Friday JE, Lynch KL, and Moshfegh AJ. 2017. FoodPatterns Equivalents Database 2013-14: Methodology and User Guide. U.S.Department of Agriculture, Agricultural Research Service, Food SurveysResearch Group website: http://www.ars.usda.gov/nea/bhnrc/fsrg. AccessedMarch 22, 2019.

SOURCES OF ENERGY INTAKE NHANES 2013-16
Acknowledgements The following individuals represent the team who produced this analysis:
Edwina Wambogo1
Jill Reedy1
Marissa Shams-White1
1National Cancer Institute, NIH

i
TABLE OF CONTENTS Acknowledgements ..................................................................................................................................
Sources of energy intake among the U.S. Population, 2013-16 ........................................................... 1
Objective .................................................................................................................................................. 1
Methods ................................................................................................................................................... 1
Key Findings ........................................................................................................................................... 1
Table A: List of specific foods: Major categories and sub-categories for Dietary Guidelines 2020
analysis – Assignment of WWEIA (WWEIA) Food Categories ........................................................... 3
DAIRY ...................................................................................................................................................... 3
PROTEIN FOODS .................................................................................................................................. 3
GRAINS ................................................................................................................................................... 5
SNACKS AND SWEETS ........................................................................................................................ 5
FRUITS and FRUIT JUICE .................................................................................................................. 6
VEGETABLES ......................................................................................................................................... 6
BEVERAGES (NOT INCL. MILK AND 100% FRUIT JUICE) * ...................................................... 6
CONDIMENTS, GRAVIES, SPREADS, SALAD DRESSINGS ......................................................... 7
LIST OF TABLES .................................................................................................................................... 8
LIST OF FIGURES ................................................................................................................................. 8
Percent of total energy intake, 2013-16, for U.S. population ages 2 years and older, from WWEIA
Food Categories .......................................................................................................................................... 9
WHOLE SAMPLE (MALES + FEMALES) .......................................................................................... 9
MALES ................................................................................................................................................... 12
FEMALES .............................................................................................................................................. 15
References ................................................................................................................................................. 24
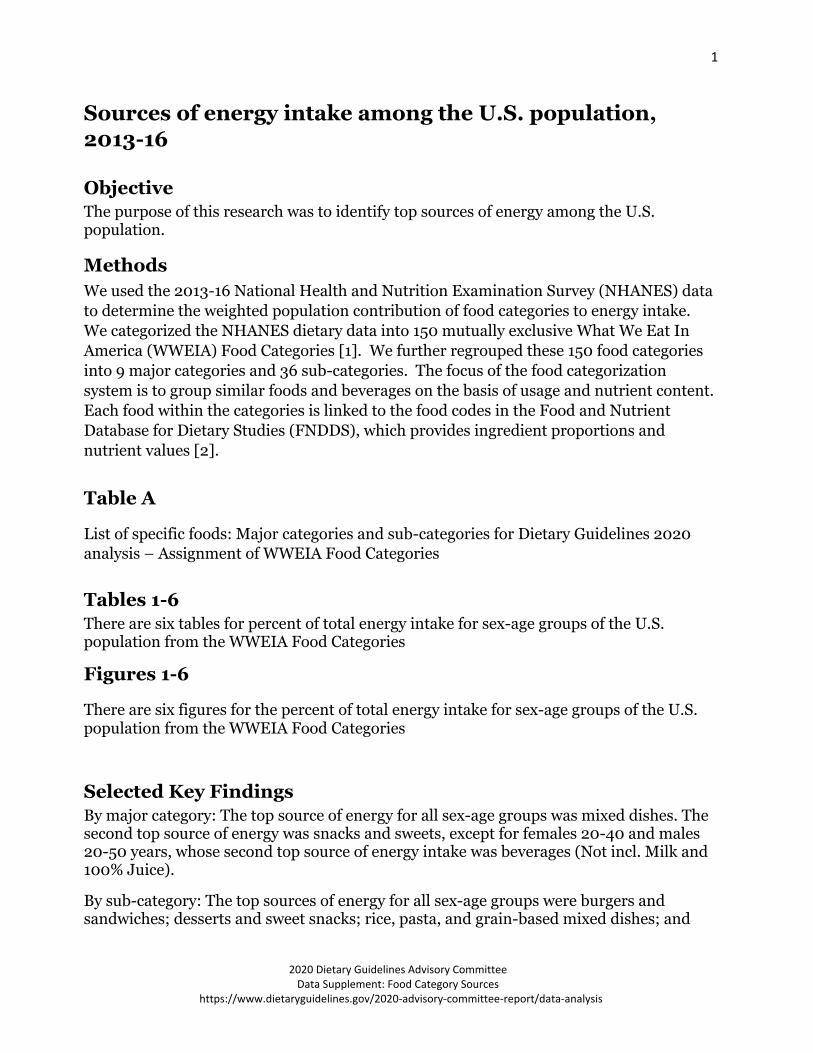
1
Sources of energy intake among the U.S. population,
2013-16
Objective
The purpose of this research was to identify top sources of energy among the U.S. population.
Methods
We used the 2013-16 National Health and Nutrition Examination Survey (NHANES) data
to determine the weighted population contribution of food categories to energy intake.
We categorized the NHANES dietary data into 150 mutually exclusive What We Eat In
America (WWEIA) Food Categories [1]. We further regrouped these 150 food categories
into 9 major categories and 36 sub-categories. The focus of the food categorization
system is to group similar foods and beverages on the basis of usage and nutrient content.
Each food within the categories is linked to the food codes in the Food and Nutrient
Database for Dietary Studies (FNDDS), which provides ingredient proportions and
nutrient values [2].
Table A
List of specific foods: Major categories and sub-categories for Dietary Guidelines 2020
analysis – Assignment of WWEIA Food Categories
Tables 1-6
There are six tables for percent of total energy intake for sex-age groups of the U.S. population from the WWEIA Food Categories
Figures 1-6
There are six figures for the percent of total energy intake for sex-age groups of the U.S. population from the WWEIA Food Categories
Selected Key Findings
By major category: The top source of energy for all sex-age groups was mixed dishes. The second top source of energy was snacks and sweets, except for females 20-40 and males 20-50 years, whose second top source of energy intake was beverages (Not incl. Milk and100% Juice).
By sub-category: The top sources of energy for all sex-age groups were burgers and sandwiches; desserts and sweet snacks; rice, pasta, and grain-based mixed dishes; and
2020 Dietary Guidelines Advisory Committee Data Supplement: Food Category Sources
https://www.dietaryguidelines.gov/2020-advisory-committee-report/data-analysis
2
2020 Dietary Guidelines Advisory Committee Data Supplement: Food Category Sources
https://www.dietaryguidelines.gov/2020-advisory-committee-report/data-analysis
sugar-sweetened and diet beverages. Alcoholic beverages contributed more to energy intake among males than females 20 years and older.

3
2020 Dietary Guidelines Advisory Committee Data Supplement: Food Category Sources
https://www.dietaryguidelines.gov/2020-advisory-committee-report/data-analysis
Table A: List of specific foods: Major categories and sub-
categories for Dietary Guidelines 2020 analysis –
Assignment of What We Eat In America (WWEIA) Food
Categories
Major categories (n=9) and sub-categories (n=36) for DGAC analyses of contributions of
food category intake to energy intake.
MAJOR CATEGORY
SUB-CATEGORY
WWEIA CATEGORY
SPECIFIC CATEGORY FROM WWEIA
DAIRY
LOW-FAT MILK/YOGURT 1006 Milk, low-fat
1008 Milk, nonfat
1206 Flavored milk, low-fat
1208 Flavored milk, nonfat
1404 Milk substitutes
HIGHER FAT MILK/YOGURT 1002 Milk, whole
1004 Milk, reduced fat
1202 Flavored milk, whole
1204 Flavored milk, reduced fat
1402 Milk shakes and other dairy drinks
1820 Yogurt, regular
1822 Yogurt, Greek
CHEESE
1602 Cheese
1604 Cottage/ricotta cheese
PROTEIN FOODS
MEATS (Not Incl. Deli and Mixed Dishes)
2002 Beef, excludes ground
2004 Ground beef
2006 Pork
2008 Lamb, goat, game
2010 Liver and organ meats
DELI/CURED PRODUCTS (Meat and Poultry)
2602 Cold cuts and cured meats
2604 Bacon
2606 Frankfurters
2608 Sausages
POULTRY (Not Incl. Deli and Mixed Dishes)

4
2020 Dietary Guidelines Advisory Committee Data Supplement: Food Category Sources
https://www.dietaryguidelines.gov/2020-advisory-committee-report/data-analysis
2202 Chicken, whole pieces
2204 Chicken patties, nuggets and tenders
2206 Turkey, duck, other poultry
SEAFOOD (Not Incl. Mixed Dishes)
2402 Fish
2404 Shellfish
EGGS
2502 Eggs and omelets
NUTS, SEEDS, AND SOY 2804 Nuts and seeds
2806 Processed soy products
MIXED DISHES
PIZZA 3602 Pizza
BURGERS AND SANDWICHES (Incl. Tacos and Burritos) 3702 Burgers (single code)
3704 Chicken/turkey sandwiches (single code)
3706 Egg/breakfast sandwiches (single code)
3708 Other sandwiches (single code+ combo codes)
3502 Burritos and Tacos
3703 Frankfurter sandwiches (single code + combo codes)
3720 Cheese sandwiches (single code +combo codes)
3722 Peanut butter and jelly sandwiches(single code + combo codes)
MEAT, POULTRY, SEAFOOD MIXED DISHES 3002 Meat mixed dishes
3004 Poultry mixed dishes
3006 Seafood mixed dishes
3404 Stir-fry and soy-based sauce mixtures
RICE, PASTA AND OTHER GRAIN-BASED MIXED DISHES 3202 Rice mixed dishes
3204 Pasta mixed dishes, excludes macaroni and cheese
3206 Macaroni and cheese
3208 Turnovers and other grain-based items
3402 Fried rice and lo/chow mein
3406 Egg rolls, dumplings, sushi
3506 Other Mexican mixed dishes

5
2020 Dietary Guidelines Advisory Committee Data Supplement: Food Category Sources
https://www.dietaryguidelines.gov/2020-advisory-committee-report/data-analysis
SOUPS 3802 Soups
GRAINS
RICE AND PASTA 4002 Rice
4004 Pasta, noodles, cooked grains
YEAST BREADS AND TORTILLAS 4202 Yeast breads
4204 Rolls and buns
4206 Bagels and English muffins
4208 Tortillas
QUICK BREADS (Biscuits, Muffins, Pancakes, Waffles) 4402 Biscuits, muffins, quick breads
4404 Pancakes, waffles, French toast
BREAKFAST CEREALS AND BARS 4602 Ready-to-eat cereal, higher sugar
(>21.2g/100g) 4604 Ready-to-eat cereal, lower sugar
(≤21.2g/100g) 4802 Oatmeal
4804 Grits and other cooked cereals
5402 Cereal bars
5404 Nutrition bars
SNACKS AND SWEETS
CHIPS, CRACKERS, AND SAVORY SNACKS 5002 Potato chips
5004 Tortilla, corn, other chips
5006 Popcorn
5008 Pretzels/snack mix
5202 Crackers, excludes saltines
5204 Saltine crackers
3504 Nachos
DESSERTS AND SWEET SNACKS 5502 Cakes and pies
5504 Cookies and brownies
5506 Doughnuts, sweet rolls, pastries
5802 Ice cream and frozen dairy desserts
5804 Pudding
5806 Gelatins, ices, sorbets
CANDY AND SUGARS 5702 Candy containing chocolate
5704 Candy not containing chocolate
8802 Sugars and honey

6
2020 Dietary Guidelines Advisory Committee Data Supplement: Food Category Sources
https://www.dietaryguidelines.gov/2020-advisory-committee-report/data-analysis
8804 Sugar substitutes
8806 Jams, syrups, toppings
FRUITS and FRUIT JUICE
FRUIT (Non-Juice) 6002 Apples
6004 Bananas
6006 Grapes
6008 Peaches and nectarines
6010 Berries
6012 Citrus fruits
6014 Melons
6016 Dried fruits
6018 Other fruits and fruit salads
100% FRUIT JUICE 7002 Citrus juice
7004 Apple juice
7006 Other fruit juice
VEGETABLES
VEGETABLES (Incl. Beans and Peas, not Starchy) 6402 Tomatoes 6404 Carrots 6406 Other red and orange vegetables 6408 Dark green vegetables, excludes
lettuce 6410 Lettuce and lettuce salads (Incl.
combo codes) 6412 String beans
6414 Onions
8410 Pasta sauces, tomato-based
6420 Other vegetables and combinations
6422 Vegetable mixed dishes
7008 Vegetable juice
2802 Beans, peas, legumes
STARCHY VEGETABLES 6416 Corn
6418 Other starchy vegetables
6802 White potatoes, baked or boiled
6804 French fries and other fried white potatoes
6806 Mashed potatoes and white potato mixtures
BEVERAGES (NOT INCL. MILK AND 100% FRUIT JUICE) *
SUGAR-SWEETENED AND DIET BEVERAGES

7
2020 Dietary Guidelines Advisory Committee Data Supplement: Food Category Sources
https://www.dietaryguidelines.gov/2020-advisory-committee-report/data-analysis
7102 Diet soft drinks
7104 Diet sport and energy drinks
7106 Other diet drinks
7202 Soft drinks
7204 Fruit drinks
7206 Sport and energy drinks
7208 Nutritional beverages
7802 Flavored or carbonated water
7220 Smoothies and grain drinks
COFFEE AND TEA
7302 Coffee
7304 Tea
ALCOHOLIC BEVERAGES 7502 Beer
7504 Wine
7506 Liquor and cocktails
WATERS 7702 Tap water
7704 Bottled water
7804 Enhanced or fortified water
CONDIMENTS, GRAVIES, SPREADS, SALAD DRESSINGS
CONDIMENTS AND GRAVIES 8402 Tomato-based condiments
8404 Soy-based condiments
8406 Mustard and other condiments
8408 Olives, pickles, pickled vegetables
8412 Dips, gravies, other sauces
SPREADS 8002 Butter and animal fats
8004 Margarine
8006 Cream cheese, sour cream, whipped cream
8008 Cream and cream substitutes
SALAD DRESSINGS 8010 Mayonnaise
8012 Salad dressings and vegetable oils

8
2020 Dietary Guidelines Advisory Committee Data Supplement: Food Category Sources
https://www.dietaryguidelines.gov/2020-advisory-committee-report/data-analysis
LIST OF TABLES*
Table 1: Males and Females - Distribution of energy intake (percentages) across major categories 9
Table 2: Males and Females - Distribution of energy intake (percentages) across sub-categories . 10
Table 3: Males - Distribution of energy intake (percentages) across major categories ..................... 12
Table 4: Males - Distribution of energy intake (percentages) across sub-categories ........................ 13
Table 5: Females - Distribution of energy intake (percentages) across major categories ................. 15
Table 6: Females - Distribution of energy intake (percentages) across sub-categories .................... 16
LIST OF FIGURES*
Figure 1: Males and Females - Distribution of energy intake (percentages) across major categories
........................................................................................................................................................................ 18
Figure 2: Males and Females - Distribution of energy intake (percentages) across top 10 sub-
categories ...................................................................................................................................................... 19
Figure 3: Males - Distribution of energy intake (percentages) across major categories ................... 20
Figure 4: Males - Distribution of energy intake (percentages) across top 10 sub-categories ........... 21
Figure 5: Females - Distribution of energy intake (percentages) across major categories ............... 22
Figure 6: Females - Distribution of energy intake (percentages) across top 10 sub-categories ....... 23
*Note: Each data table in this section has a figure that directly corresponds with the data in thetable. Figures do not include a description as it would be a direct repetition of the data in thepreceding tables.

9
2020 Dietary Guidelines Advisory Committee Data Supplement: Food Category Sources
https://www.dietaryguidelines.gov/2020-advisory-committee-report/data-analysis
Percent of total energy intake, 2013-16, for U.S. population ages 2 years and
older, from WWEIA Food Categories
These data are estimates of the percent of total energy intakes from WWEIA Food Categories, regrouped into DGAC major categories and sub-categories as described elsewhere, for individuals 2 years and older based on the day 1 dietary recalls from WWEIA, NHANES 2013-16. Breastfed children have been excluded. The sample size is 15,807.
WHOLE SAMPLE (MALES + FEMALES)
Table 2: Males and Females - Distribution of energy intake (percentages) across major categories
DGAC major category Age Groups (Years)
2+ 2-5 6-11 12-19 20-40 41-50 51-70 71+
%
MIXED DISHES 29.91 24.44 30.76 33.97 32.52 29.25 27.80 26.09
SNACKS AND SWEETS 15.45 20.01 20.94 16.74 12.82 13.84 15.19 17.46
BEVERAGES (Not incl. Milk and 100% Fruit Juice)
12.40 4.40 6.05 9.66 15.93 15.72 12.84 9.07
PROTEIN FOODS 11.77 10.48 8.93 9.61 12.26 12.66 12.90 11.70
GRAINS 10.46 11.31 12.12 11.00 8.97 10.26 10.61 12.23
VEGETABLES 7.95 4.42 4.75 6.22 8.17 8.86 9.23 9.34
DAIRY 6.06 15.30 10.20 7.41 4.22 4.48 5.24 5.76
FRUITS+FRUIT JUICE 3.84 7.55 4.38 3.64 3.00 3.01 3.81 5.34
CONDIMENTS, GRAVIES, SPREADS, AND SALAD DRESSINGS
1.78 1.06 1.49 1.38 1.68 1.71 2.08 2.53
TOTAL* 99.61 98.97 99.62 99.63 99.58 99.78 99.69 99.52
*Totals are less than 100% because results do not include baby foods, infant formulas, and WWEIA category – other
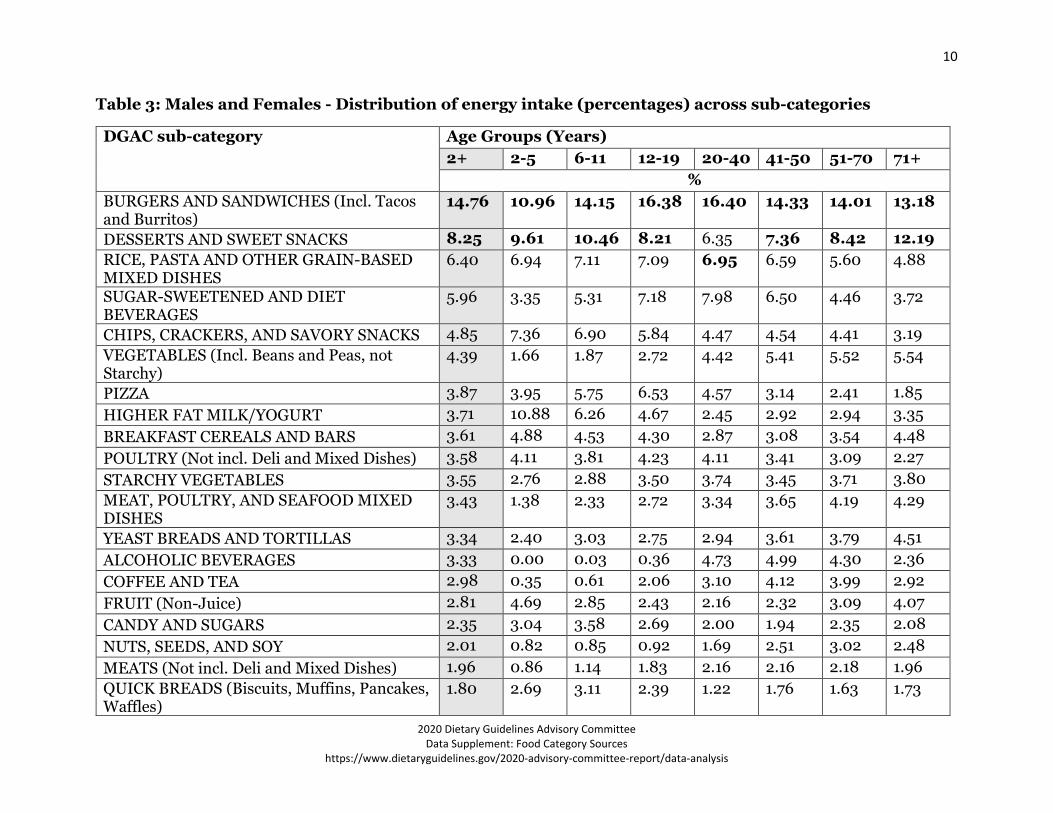
10
2020 Dietary Guidelines Advisory Committee Data Supplement: Food Category Sources
https://www.dietaryguidelines.gov/2020-advisory-committee-report/data-analysis
Table 3: Males and Females - Distribution of energy intake (percentages) across sub-categories
DGAC sub-category Age Groups (Years)
2+ 2-5 6-11 12-19 20-40 41-50 51-70 71+
%
BURGERS AND SANDWICHES (Incl. Tacos and Burritos)
14.76 10.96 14.15 16.38 16.40 14.33 14.01 13.18
DESSERTS AND SWEET SNACKS 8.25 9.61 10.46 8.21 6.35 7.36 8.42 12.19
RICE, PASTA AND OTHER GRAIN-BASED MIXED DISHES
6.40 6.94 7.11 7.09 6.95 6.59 5.60 4.88
SUGAR-SWEETENED AND DIET BEVERAGES
5.96 3.35 5.31 7.18 7.98 6.50 4.46 3.72
CHIPS, CRACKERS, AND SAVORY SNACKS 4.85 7.36 6.90 5.84 4.47 4.54 4.41 3.19
VEGETABLES (Incl. Beans and Peas, not Starchy)
4.39 1.66 1.87 2.72 4.42 5.41 5.52 5.54
PIZZA 3.87 3.95 5.75 6.53 4.57 3.14 2.41 1.85
HIGHER FAT MILK/YOGURT 3.71 10.88 6.26 4.67 2.45 2.92 2.94 3.35
BREAKFAST CEREALS AND BARS 3.61 4.88 4.53 4.30 2.87 3.08 3.54 4.48
POULTRY (Not incl. Deli and Mixed Dishes) 3.58 4.11 3.81 4.23 4.11 3.41 3.09 2.27
STARCHY VEGETABLES 3.55 2.76 2.88 3.50 3.74 3.45 3.71 3.80
MEAT, POULTRY, AND SEAFOOD MIXED DISHES
3.43 1.38 2.33 2.72 3.34 3.65 4.19 4.29
YEAST BREADS AND TORTILLAS 3.34 2.40 3.03 2.75 2.94 3.61 3.79 4.51
ALCOHOLIC BEVERAGES 3.33 0.00 0.03 0.36 4.73 4.99 4.30 2.36
COFFEE AND TEA 2.98 0.35 0.61 2.06 3.10 4.12 3.99 2.92
FRUIT (Non-Juice) 2.81 4.69 2.85 2.43 2.16 2.32 3.09 4.07
CANDY AND SUGARS 2.35 3.04 3.58 2.69 2.00 1.94 2.35 2.08
NUTS, SEEDS, AND SOY 2.01 0.82 0.85 0.92 1.69 2.51 3.02 2.48
MEATS (Not incl. Deli and Mixed Dishes) 1.96 0.86 1.14 1.83 2.16 2.16 2.18 1.96
QUICK BREADS (Biscuits, Muffins, Pancakes, Waffles)
1.80 2.69 3.11 2.39 1.22 1.76 1.63 1.73
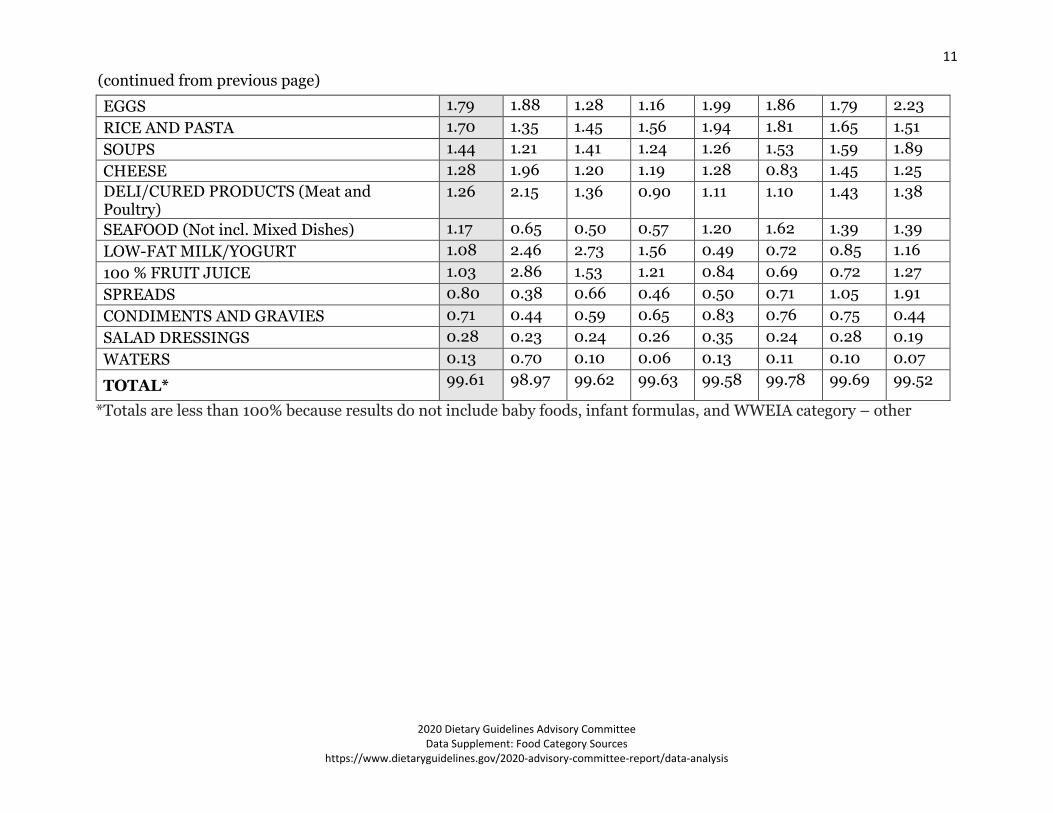
11
2020 Dietary Guidelines Advisory Committee Data Supplement: Food Category Sources
https://www.dietaryguidelines.gov/2020-advisory-committee-report/data-analysis
EGGS 1.79 1.88 1.28 1.16 1.99 1.86 1.79 2.23
RICE AND PASTA 1.70 1.35 1.45 1.56 1.94 1.81 1.65 1.51
SOUPS 1.44 1.21 1.41 1.24 1.26 1.53 1.59 1.89
CHEESE 1.28 1.96 1.20 1.19 1.28 0.83 1.45 1.25
DELI/CURED PRODUCTS (Meat and Poultry)
1.26 2.15 1.36 0.90 1.11 1.10 1.43 1.38
SEAFOOD (Not incl. Mixed Dishes) 1.17 0.65 0.50 0.57 1.20 1.62 1.39 1.39
LOW-FAT MILK/YOGURT 1.08 2.46 2.73 1.56 0.49 0.72 0.85 1.16
100 % FRUIT JUICE 1.03 2.86 1.53 1.21 0.84 0.69 0.72 1.27
SPREADS 0.80 0.38 0.66 0.46 0.50 0.71 1.05 1.91
CONDIMENTS AND GRAVIES 0.71 0.44 0.59 0.65 0.83 0.76 0.75 0.44
SALAD DRESSINGS 0.28 0.23 0.24 0.26 0.35 0.24 0.28 0.19
WATERS 0.13 0.70 0.10 0.06 0.13 0.11 0.10 0.07
TOTAL* 99.61 98.97 99.62 99.63 99.58 99.78 99.69 99.52
*Totals are less than 100% because results do not include baby foods, infant formulas, and WWEIA category – other
(continued from previous page)

12
2020 Dietary Guidelines Advisory Committee Data Supplement: Food Category Sources
https://www.dietaryguidelines.gov/2020-advisory-committee-report/data-analysis
MALES
Table 4: Males - Distribution of energy intake (percentages) across major categories
DGAC major category Age Groups (Years)
2+ 2-5 6-11 12-19 20-40 41-50 51-70 71+
%
MIXED DISHES 31.29 25.19 32.39 35.88 35.16 30.45 29.11 26.45
SNACKS AND SWEETS 14.33 20.54 20.52 16.26 11.25 12.41 14.79 15.81
BEVERAGES (Not incl. Milk and 100% Fruit Juice)
12.93 4.73 6.54 9.33 16.78 17.11 13.65 9.57
PROTEIN FOODS 11.96 10.12 8.58 9.86 12.69 13.13 13.02 13.65
GRAINS 9.96 11.54 11.23 10.65 8.36 9.92 10.52 11.77
VEGETABLES 7.07 4.17 4.24 5.27 6.85 8.10 8.71 9.70
DAIRY 6.12 14.27 10.66 7.72 4.24 4.43 4.33 5.73
FRUITS+FRUIT JUICE 3.53 7.29 4.21 3.49 2.72 2.51 3.56 4.39
CONDIMENTS, GRAVIES, SPREADS, AND SALAD DRESSINGS
1.61 1.03 1.25 1.14 1.48 1.71 2.03 2.33
TOTAL* 98.80 98.89 99.62 99.59 99.55 99.79 99.73 99.40
*Totals are less than 100% because results do not include baby foods, infant formulas, and WWEIA category – other

13
2020 Dietary Guidelines Advisory Committee Data Supplement: Food Category Sources
https://www.dietaryguidelines.gov/2020-advisory-committee-report/data-analysis
Table 5: Males - Distribution of energy intake (percentages) across sub-categories
DGAC sub-category Age Groups (Years)
2+ 2-5 6-11 12-19 20-40 41-50 51-70 71+
%
BURGERS AND SANDWICHES (Incl. Tacos and Burritos)
16.16 12.09 15.07 18.16 18.53 15.90 15.43 14.49
DESSERTS AND SWEET SNACKS 7.54 9.66 9.69 8.20 5.45 6.84 8.07 11.30
RICE, PASTA AND OTHER GRAIN-BASED MIXED DISHES
6.31 6.60 6.84 6.38 6.90 7.31 5.36 5.04
SUGAR-SWEETENED AND DIET BEVERAGES 6.17 3.57 5.86 7.50 8.35 6.75 4.45 3.58
CHIPS, CRACKERS, AND SAVORY SNACKS 4.61 7.79 6.84 5.45 3.99 3.88 4.53 2.97
PIZZA 4.11 4.44 6.39 6.95 5.13 2.50 2.68 1.14
ALCOHOLIC BEVERAGES 4.02 0.00 0.02 0.35 5.49 6.86 5.34 3.26
HIGHER FAT MILK/YOGURT 3.95 10.12 6.47 5.28 2.61 2.92 2.45 3.44
POULTRY (Not incl. Deli and Mixed Dishes) 3.79 4.06 3.92 4.50 4.47 3.71 3.08 2.70
VEGETABLES (Incl. Beans and Peas, not Starchy) 3.60 1.54 1.51 1.98 3.31 4.66 4.86 5.53
STARCHY VEGETABLES 3.47 2.63 2.74 3.29 3.54 3.45 3.85 4.17
MEAT, POULTRY, AND SEAFOOD MIXED DISHES
3.42 1.12 2.58 3.22 3.59 3.18 4.21 3.96
BREAKFAST CEREALS AND BARS 3.37 4.51 4.43 4.14 2.71 2.75 3.20 4.52
YEAST BREADS AND TORTILLAS 3.20 2.71 2.52 2.54 2.77 3.68 3.92 4.26
COFFEE AND TEA 2.59 0.34 0.58 1.44 2.82 3.43 3.78 2.66
FRUIT (Non-Juice) 2.46 4.28 2.73 2.25 1.82 1.85 2.80 3.30
MEATS (Not incl. Deli and Mixed Dishes) 2.21 0.64 0.95 1.99 2.63 2.36 2.64 2.28
CANDY AND SUGARS 2.19 3.09 3.98 2.60 1.80 1.70 2.19 1.54
NUTS, SEEDS, AND SOY 1.83 0.55 0.70 0.81 1.55 2.43 2.88 2.68
QUICK BREADS (Biscuits, Muffins, Pancakes, Waffles)
1.74 2.91 3.02 2.53 1.11 1.48 1.69 1.53
EGGS 1.71 1.89 1.16 1.22 1.82 1.69 1.63 2.79

14
2020 Dietary Guidelines Advisory Committee Data Supplement: Food Category Sources
https://www.dietaryguidelines.gov/2020-advisory-committee-report/data-analysis
RICE AND PASTA 1.65 1.42 1.25 1.44 1.78 2.01 1.71 1.46
DELI/CURED PRODUCTS (Meat and Poultry) 1.31 2.18 1.42 0.82 1.05 1.15 1.59 1.78
SOUPS 1.30 0.94 1.53 1.16 1.01 1.56 1.44 1.83
CHEESE 1.10 1.75 1.16 0.85 1.17 0.64 1.20 1.14
SEAFOOD (Not incl. Mixed Dishes) 1.10 0.79 0.41 0.52 1.18 1.79 1.19 1.41
LOW-FAT MILK/YOGURT 1.07 2.40 3.03 1.59 0.46 0.88 0.68 1.16
100% FRUIT JUICE 1.06 3.01 1.48 1.24 0.90 0.66 0.76 1.09
SPREADS 0.69 0.35 0.44 0.35 0.40 0.72 1.01 1.82
CONDIMENTS AND GRAVIES 0.68 0.45 0.55 0.62 0.77 0.77 0.78 0.41
SALAD DRESSINGS 0.24 0.23 0.27 0.16 0.32 0.22 0.24 0.10
WATERS 0.15 0.83 0.08 0.04 0.12 0.09 0.09 0.07
TOTAL* 98.80 98.89 99.62 99.59 99.55 99.79 99.73 99.40
*Totals are less than 100% because results do not include baby foods, infant formulas, and WWEIA category – other
(continued from previous page)

15
2020 Dietary Guidelines Advisory Committee Data Supplement: Food Category Sources
https://www.dietaryguidelines.gov/2020-advisory-committee-report/data-analysis
FEMALES
Table 6: Females - Distribution of energy intake (percentages) across major categories
DGAC major category Age Groups (Years)
2+ 2-5 6-11 12-19 20-40 41-50 51-70 71+
%
MIXED DISHES 27.78 23.75 28.89 32.02 29.54 28.16 26.60 25.81
SNACKS AND SWEETS 16.26 19.52 21.43 17.23 14.60 15.14 15.55 18.75
BEVERAGES (Not incl. Milk and 100% Fruit Juice)
11.51 4.09 5.49 10.01 14.98 14.45 12.10 8.68
PROTEIN FOODS 11.34 10.81 9.32 9.35 11.76 12.24 12.79 10.16
GRAINS 10.78 11.11 13.15 11.36 9.65 10.56 10.70 12.59
VEGETABLES 8.64 4.65 5.33 7.20 9.65 9.54 9.71 9.06
DAIRY 6.47 16.25 9.66 7.09 4.19 4.52 6.06 5.79
FRUITS+FRUIT JUICE 4.20 7.79 4.58 3.79 3.33 3.46 4.03 6.09
CONDIMENTS, GRAVIES, SPREADS, AND SALAD DRESSINGS
1.90 1.09 1.76 1.63 1.90 1.71 2.12 2.69
TOTAL* 98.87 99.05 99.63 99.67 99.61 99.77 99.66 99.61
*Totals are less than 100% because results do not include baby foods, infant formulas, and WWEIA category – other

16
2020 Dietary Guidelines Advisory Committee Data Supplement: Food Category Sources
https://www.dietaryguidelines.gov/2020-advisory-committee-report/data-analysis
Table 7: Females - Distribution of energy intake (percentages) across sub-categories
DGAC sub-category Age Groups (Years)
2+ 2-5 6-11 12-19 20-40 41-50 51-70 71+
%
BURGERS AND SANDWICHES (Incl. Tacos and Burritos)
12.91 9.91 13.11 14.57 13.99 12.91 12.71 12.16
DESSERTS AND SWEET SNACKS 8.77 9.56 11.34 8.22 7.37 7.83 8.74 12.89
RICE, PASTA AND OTHER GRAIN-BASED MIXED DISHES
6.41 7.26 7.42 7.82 7.00 5.95 5.82 4.76
SUGAR-SWEETENED AND DIET BEVERAGES 5.59 3.15 4.69 6.86 7.56 6.28 4.48 3.83
VEGETABLES (Incl. Beans and Peas, not Starchy) 5.07 1.77 2.29 3.48 5.68 6.09 6.13 5.55
CHIPS, CRACKERS, AND SAVORY SNACKS 5.02 6.96 6.97 6.24 5.01 5.14 4.31 3.36
HIGHER FAT MILK/YOGURT 3.94 11.58 6.02 4.04 2.25 2.93 3.38 3.29
BREAKFAST CEREALS AND BARS 3.82 5.24 4.64 4.47 3.06 3.37 3.86 4.45
STARCHY VEGETABLES 3.57 2.88 3.04 3.72 3.97 3.45 3.59 3.51
PIZZA 3.54 3.50 5.03 6.10 3.94 3.73 2.17 2.41
YEAST BREADS AND TORTILLAS 3.41 2.11 3.62 2.96 3.12 3.55 3.66 4.71
MEAT, POULTRY, AND SEAFOOD MIXED DISHES
3.36 1.63 2.06 2.21 3.07 4.08 4.17 4.54
POULTRY (Not incl. Deli and Mixed Dishes) 3.32 4.16 3.69 3.95 3.69 3.15 3.09 1.94
COFFEE AND TEA 3.26 0.35 0.64 2.70 3.41 4.75 4.17 3.13
FRUIT (Non-Juice) 3.17 5.07 2.99 2.61 2.54 2.75 3.35 4.68
ALCOHOLIC BEVERAGES 2.51 0.00 0.04 0.38 3.87 3.29 3.35 1.65
CANDY AND SUGARS 2.46 3.00 3.12 2.78 2.23 2.16 2.50 2.50
NUTS, SEEDS, AND SOY 2.11 1.08 1.01 1.04 1.86 2.58 3.14 2.32
EGGS 1.86 1.86 1.41 1.09 2.19 2.02 1.93 1.78
QUICK BREADS (Biscuits, Muffins, Pancakes, Waffles)
1.83 2.48 3.22 2.25 1.35 2.01 1.58 1.89
RICE AND PASTA 1.71 1.28 1.66 1.68 2.12 1.63 1.59 1.54

17
2020 Dietary Guidelines Advisory Committee Data Supplement: Food Category Sources
https://www.dietaryguidelines.gov/2020-advisory-committee-report/data-analysis
MEATS (Not incl. Deli and Mixed Dishes) 1.65 1.06 1.34 1.67 1.63 1.98 1.76 1.70
SOUPS 1.56 1.45 1.27 1.31 1.54 1.50 1.72 1.93
CHEESE 1.45 2.16 1.25 1.54 1.41 1.01 1.69 1.34
DELI/CURED PRODUCTS (Meat and Poultry) 1.21 2.12 1.28 0.97 1.18 1.05 1.29 1.06
SEAFOOD (Not incl. Mixed Dishes) 1.19 0.52 0.60 0.63 1.22 1.46 1.58 1.36
LOW-FAT MILK/YOGURT 1.07 2.51 2.39 1.52 0.52 0.58 0.99 1.16
100% FRUIT JUICE 1.04 2.71 1.59 1.18 0.78 0.71 0.68 1.41
SPREADS 0.88 0.42 0.90 0.58 0.61 0.69 1.08 1.98
CONDIMENTS AND GRAVIES 0.71 0.43 0.64 0.69 0.89 0.76 0.72 0.46
SALAD DRESSINGS 0.31 0.24 0.22 0.36 0.39 0.25 0.32 0.25
WATERS 0.15 0.59 0.13 0.07 0.14 0.13 0.10 0.07
TOTAL* 98.87 99.05 99.63 99.67 99.61 99.77 99.66 99.61
*Totals are less than 100% because results do not include baby foods, infant formulas, and WWEIA category – other
(continued from previous page)

18
2020 Dietary Guidelines Advisory Committee Data Supplement: Food Category Sources
https://www.dietaryguidelines.gov/2020-advisory-committee-report/data-analysis
Figure 1: Males and Females - Distribution of energy intake (percentages) across major categories
0
10
20
30
40
50
60
70
80
90
100
2+ 2-5 years 6-11 years 12-19 years 20-40 years 41-50 years 51-70 years 71+
%
MIXED DISHES SNACKS AND SWEETS
BEVERAGES (Not incl. Milk and 100% Fruit Juice) PROTEIN FOODS
GRAINS VEGETABLES
DAIRY FRUITS+FRUIT JUICE
CONDIMENTS, GRAVIES, SPREADS, SALAD DRESSINGS

19
2020 Dietary Guidelines Advisory Committee Data Supplement: Food Category Sources
https://www.dietaryguidelines.gov/2020-advisory-committee-report/data-analysis
Figure 2: Males and Females - Distribution of energy intake (percentages) across top 10 sub-categories
0
10
20
30
40
50
60
70
80
90
100
2+ 2-5 years 6-11 years 12-19 years 20-40 years 41-50 years 51-70 years 71+
%
BURGERS AND SANDWICHES (incl. tacos and burritos) DESSERTS AND SWEET SNACKS
RICE, PASTA AND OTHER GRAIN-BASED MIXED DISHES SUGAR-SWEETENED AND DIET BEVERAGES
CHIPS, CRACKERS, AND SAVORY SNACKS VEGETABLES (Incl. Beans and Peas, not Starchy)
PIZZA HIGHER FAT MILK/YOGURT
BREAKFAST CEREALS AND BARS POULTRY (Not incl. Deli and Mixed Dishes)

20
2020 Dietary Guidelines Advisory Committee Data Supplement: Food Category Sources
https://www.dietaryguidelines.gov/2020-advisory-committee-report/data-analysis
Figure 3: Males - Distribution of energy intake (percentages) across major categories
0
10
20
30
40
50
60
70
80
90
100
2+ 2-5 years 6-11 years 12-19 years 20-40 years 41-50 years 51-70 years 71+
%
MIXED DISHES SNACKS AND SWEETS
BEVERAGES (Not incl. Milk and 100% Fruit Juice) PROTEIN FOODS
GRAINS VEGETABLES
DAIRY FRUITS+FRUIT JUICE
CONDIMENTS, GRAVIES, SPREADS, SALAD DRESSINGS
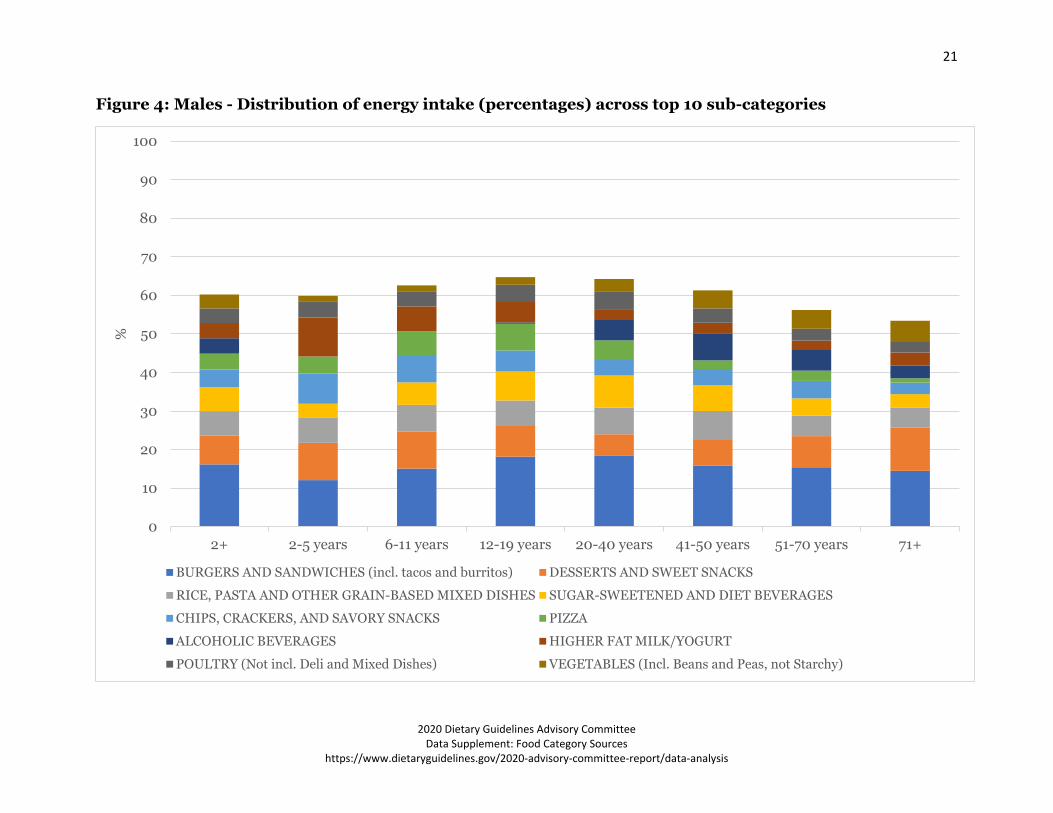
21
2020 Dietary Guidelines Advisory Committee Data Supplement: Food Category Sources
https://www.dietaryguidelines.gov/2020-advisory-committee-report/data-analysis
Figure 4: Males - Distribution of energy intake (percentages) across top 10 sub-categories
0
10
20
30
40
50
60
70
80
90
100
2+ 2-5 years 6-11 years 12-19 years 20-40 years 41-50 years 51-70 years 71+
%
BURGERS AND SANDWICHES (incl. tacos and burritos) DESSERTS AND SWEET SNACKS
RICE, PASTA AND OTHER GRAIN-BASED MIXED DISHES SUGAR-SWEETENED AND DIET BEVERAGES
CHIPS, CRACKERS, AND SAVORY SNACKS PIZZA
ALCOHOLIC BEVERAGES HIGHER FAT MILK/YOGURT
POULTRY (Not incl. Deli and Mixed Dishes) VEGETABLES (Incl. Beans and Peas, not Starchy)

22
2020 Dietary Guidelines Advisory Committee Data Supplement: Food Category Sources
https://www.dietaryguidelines.gov/2020-advisory-committee-report/data-analysis
Figure 5: Females - Distribution of energy intake (percentages) across major categories
0
10
20
30
40
50
60
70
80
90
100
2+ 2-5 years 6-11 years 12-19 years 20-40 years 41-50 years 51-70 years 71+
%
MIXED DISHES SNACKS AND SWEETS
BEVERAGES (Not incl. Milk and 100% Fruit Juice) PROTEIN FOODS
GRAINS VEGETABLES
DAIRY FRUITS+FRUIT JUICE
CONDIMENTS, GRAVIES, SPREADS, SALAD DRESSINGS

23
2020 Dietary Guidelines Advisory Committee Data Supplement: Food Category Sources
https://www.dietaryguidelines.gov/2020-advisory-committee-report/data-analysis
Figure 6: Females - Distribution of energy intake (percentages) across top 10 sub-categories
0
10
20
30
40
50
60
70
80
90
100
2+ 2-5 years 6-11 years 12-19 years 20-40 years 41-50 years 51-70 years 71+
%
BURGERS AND SANDWICHES (incl. tacos and burritos) DESSERTS AND SWEET SNACKS
RICE, PASTA AND OTHER GRAIN-BASED MIXED DISHES SUGAR-SWEETENED AND DIET BEVERAGES
VEGETABLES (Incl. Beans and Peas, not Starchy) CHIPS, CRACKERS, AND SAVORY SNACKS
HIGHER FAT MILK/YOGURT BREAKFAST CEREALS AND BARS
STARCHY VEGETABLES PIZZA
YEAST BREADS AND TORTILLAS

24
2020 Dietary Guidelines Advisory Committee Data Supplement: Food Category Sources
https://www.dietaryguidelines.gov/2020-advisory-committee-report/data-analysis
References
1. Centers for Disease Prevention and Control. National Health and NutritionExamination Survey: Survey Methods and Analytic Guidelines. Centers forDisease Prevention and Control Website:https://wwwn.cdc.gov/nchs/nhanes/AnalyticGuidelines.aspx#analytic-guidelines . Accessed March 22, 2019.
2. Agricultural Research Service, United States Department of Agriculture.WWEIA/NHANES Overview. Agricultural Research Service website:https://www.ars.usda.gov/northeast-area/beltsville-md-bhnrc/beltsville-human-nutrition-research-center/food-surveys-research-group/docs/wweianhanes-overview/. Updated July 31, 2018. Accessed March22, 2019.
SOURCES OF ENERGY INTAKE,
BY RACE/ETHNICITY AND
INCOME NHANES 2013-16
Acknowledgements The following individuals represent the team who produced this analysis: Edwina Wambogo1
Jill Reedy1
Marissa Shams-White1
National Cancer Institute, NIH

i
TABLE OF CONTENTS Acknowledgements ..................................................................................................................................
Sources of Energy Intake by race/ethnic groups and income among the U.S. Population, 2013-16
...................................................................................................................................................................... 1
Objective .................................................................................................................................................. 1
Methods ................................................................................................................................................... 1
Key Findings ........................................................................................................................................... 1
Table A: List of specific foods: Major categories and sub-categories for Dietary Guidelines 2020
analysis – Assignment of What We Eat In America (WWEIA) Food Categories .............................. 2
DAIRY ...................................................................................................................................................... 2
PROTEIN FOODS .................................................................................................................................. 2
GRAINS ................................................................................................................................................... 4
SNACKS AND SWEETS ........................................................................................................................ 4
FRUITS and FRUIT JUICE .................................................................................................................. 5
VEGETABLES ......................................................................................................................................... 5
BEVERAGES (NOT INCL. MILK AND 100% FRUIT JUICE) * ...................................................... 6
CONDIMENTS, GRAVIES, SPREADS, SALAD DRESSINGS ......................................................... 6
LIST OF TABLES .................................................................................................................................... 7
LIST OF FIGURES ................................................................................................................................. 8
Percent of total energy intakes, 2013-16, for racial/ethnic groups of the U.S. population, from
WWEIA Food Categories .......................................................................................................................... 9
WHOLE SAMPLE (MALES + FEMALES, ages 2+) .......................................................................... 9
Percent of total energy intakes, 2013-16, for age/income groups of the U.S. population, from
WWEIA Food Categories ........................................................................................................................ 14
WHOLE SAMPLE (MALES + FEMALES) ........................................................................................ 14
References ................................................................................................................................................. 28

1
2020 Dietary Guidelines Advisory Committee Data Supplement: Food Category Sources
https://www.dietaryguidelines.gov/2020-advisory-committee-report/data-analysis
Sources of energy intake by race/ethnicity and income
among the U.S. population, 2013-16
Objective
The purpose of this research was to identify the major contributors to energy intake by race/ethnicity and income among the U.S. population.
Methods
We used the 2013-16 National Health and Nutrition Examination Survey (NHANES) data to determine the weighted population contribution of food categories to energy intake. We categorized the NHANES dietary data into 150 mutually exclusive What We Eat In America (WWEIA) Food Categories [1]. We further regrouped these 150 food categories into 9 major categories and 36 sub-categories. The focus of the food categorization system is to group similar foods and beverages on the basis of usage and nutrient content. Each food within the categories is linked to the food codes in the Food and Nutrient Database for Dietary Studies (FNDDS), which provides ingredient proportions and nutrient values [2]. Additionally, the Food Patterns Equivalents Database (FPED) data [3], was used to determine food groupings.

1
Table A.
List of specific foods: Major categories and sub-categories for Dietary Guidelines 2020
analysis – Assignment of What We Eat In America (WWEIA) Food Categories.
Table 1.1 – 2-6
There are 8 tables for the percentage contribution of various food groups to total energy intake, by race/ethnicity, and by income.
Figure 1.1 – 2.6
There are 8 figures for the percentage contribution of various food groups to total energy intake, by race/ethnicity, and by income.
Selected Key Findings
Race/ethnicity:
By major category: Mixed dishes contributed the most to energy intake for all
race/ethnic groups. Snacks and sweets category was the next major contributor to
energy intake for non-Hispanic whites, Mexican Americans, non-Hispanic blacks and
other race/ethnic groups. Non-Hispanic Asians obtained the second largest proportion
of their energy intake from grains, and the contribution of beverages to their energy
intake was much lower than for other groups.
By sub-category: Burgers and sandwiches was the largest contributor to energy intake
for all race/ethnic groups. Sugar-sweetened and diet beverages contributed more to
energy intake for Mexican Americans, other Hispanics, non-Hispanic blacks and other
race/ethnic groups, and the least to energy intake of non-Hispanic Asians.
Income:
By major category: For both income groups, the top two sources of energy were mixed
dishes and snacks and sweets. Dairy provided a larger proportion of energy for children
2-11 years, compared to other age groups
By sub-category: Burgers and sandwiches was the top sub-category contributor to
energy intake for all age groups, followed by desserts and sweet snacks. Sugar-
sweetened and diet beverages contributed more to energy intake for those adolescents
12-19 years. Overall, soft drinks contributed more to energy intake for the income
category ≤185% of the poverty index ratio, compared to those with incomes >185% of
the poverty index ratio.
2020 Dietary Guidelines Advisory Committee Data Supplement: Food Category Sources
https://www.dietaryguidelines.gov/2020-advisory-committee-report/data-analysis

2
2020 Dietary Guidelines Advisory Committee Data Supplement: Food Category Sources
https://www.dietaryguidelines.gov/2020-advisory-committee-report/data-analysis
Table A: List of specific foods: Major categories and sub-
categories for Dietary Guidelines 2020 analysis –
Assignment of What We Eat In America (WWEIA) Food
Categories
Major categories (n=9) and sub-categories (n=36) for DGAC analyses of contributions of
food category intake to energy intake.
MAJOR CATEGORY
SUB-CATEGORY
WWEIA CATEGORY
SPECIFIC CATEGORY FROM WWEIA
DAIRY
LOW-FAT MILK/YOGURT 1006 Milk, low-fat
1008 Milk, nonfat
1206 Flavored milk, low-fat
1208 Flavored milk, nonfat
1404 Milk substitutes
HIGHER FAT MILK/YOGURT 1002 Milk, whole
1004 Milk, reduced fat
1202 Flavored milk, whole
1204 Flavored milk, reduced fat
1402 Milk shakes and other dairy drinks
1820 Yogurt, regular
1822 Yogurt, Greek
CHEESE
1602 Cheese
1604 Cottage/ricotta cheese
PROTEIN FOODS
MEATS (Not Incl. Deli and Mixed Dishes)
2002 Beef, excludes ground
2004 Ground beef
2006 Pork
2008 Lamb, goat, game
2010 Liver and organ meats
DELI/CURED PRODUCTS (Meat and Poultry)
2602 Cold cuts and cured meats
2604 Bacon
2606 Frankfurters

3
2020 Dietary Guidelines Advisory Committee Data Supplement: Food Category Sources
https://www.dietaryguidelines.gov/2020-advisory-committee-report/data-analysis
2608 Sausages
POULTRY (Not Incl. Deli and Mixed Dishes)
2202 Chicken, whole pieces
2204 Chicken patties, nuggets and tenders
2206 Turkey, duck, other poultry
SEAFOOD (Not Incl. Mixed Dishes)
2402 Fish
2404 Shellfish
EGGS
2502 Eggs and omelets
NUTS, SEEDS, AND SOY 2804 Nuts and seeds
2806 Processed soy products
MIXED DISHES
PIZZA 3602 Pizza
BURGERS AND SANDWICHES (Incl. Tacos and Burritos) 3702 Burgers (single code)
3704 Chicken/turkey sandwiches (single code)
3706 Egg/breakfast sandwiches (single code)
3708 Other sandwiches (single code+ combo codes)
3502 Burritos and Tacos
3703 Frankfurter sandwiches (single code + combo codes)
3720 Cheese sandwiches (single code +combo codes)
3722 Peanut butter and jelly sandwiches(single code + combo codes)
MEAT, POULTRY, SEAFOOD MIXED DISHES 3002 Meat mixed dishes
3004 Poultry mixed dishes
3006 Seafood mixed dishes
3404 Stir-fry and soy-based sauce mixtures
RICE, PASTA AND OTHER GRAIN-BASED MIXED DISHES 3202 Rice mixed dishes
3204 Pasta mixed dishes, excludes macaroni and cheese
3206 Macaroni and cheese
3208 Turnovers and other grain-based items
3402 Fried rice and lo/chow mein

4
2020 Dietary Guidelines Advisory Committee Data Supplement: Food Category Sources
https://www.dietaryguidelines.gov/2020-advisory-committee-report/data-analysis
3406 Egg rolls, dumplings, sushi
3506 Other Mexican mixed dishes
SOUPS 3802 Soups
GRAINS
RICE AND PASTA 4002 Rice
4004 Pasta, noodles, cooked grains
YEAST BREADS AND TORTILLAS 4202 Yeast breads
4204 Rolls and buns
4206 Bagels and English muffins
4208 Tortillas
QUICK BREADS (Biscuits, Muffins, Pancakes, Waffles) 4402 Biscuits, muffins, quick breads
4404 Pancakes, waffles, French toast
BREAKFAST CEREALS AND BARS 4602 Ready-to-eat cereal, higher sugar
(>21.2g/100g) 4604 Ready-to-eat cereal, lower sugar
(≤21.2g/100g) 4802 Oatmeal
4804 Grits and other cooked cereals
5402 Cereal bars
5404 Nutrition bars
SNACKS AND SWEETS
CHIPS, CRACKERS, AND SAVORY SNACKS 5002 Potato chips
5004 Tortilla, corn, other chips
5006 Popcorn
5008 Pretzels/snack mix
5202 Crackers, excludes saltines
5204 Saltine crackers
3504 Nachos
DESSERTS AND SWEET SNACKS 5502 Cakes and pies
5504 Cookies and brownies
5506 Doughnuts, sweet rolls, pastries
5802 Ice cream and frozen dairy desserts
5804 Pudding
5806 Gelatins, ices, sorbets
CANDY AND SUGARS 5702 Candy containing chocolate

5
2020 Dietary Guidelines Advisory Committee Data Supplement: Food Category Sources
https://www.dietaryguidelines.gov/2020-advisory-committee-report/data-analysis
5704 Candy not containing chocolate
8802 Sugars and honey
8804 Sugar substitutes
8806 Jams, syrups, toppings
FRUITS and FRUIT JUICE
FRUIT (Non-Juice) 6002 Apples
6004 Bananas
6006 Grapes
6008 Peaches and nectarines
6010 Berries
6012 Citrus fruits
6014 Melons
6016 Dried fruits
6018 Other fruits and fruit salads
100% FRUIT JUICE 7002 Citrus juice
7004 Apple juice
7006 Other fruit juice
VEGETABLES
VEGETABLES (Incl. Beans and Peas, not Starchy) 6402 Tomatoes 6404 Carrots 6406 Other red and orange vegetables 6408 Dark green vegetables, excludes
lettuce 6410 Lettuce and lettuce salads (Incl.
combo codes) 6412 String beans
6414 Onions
8410 Pasta sauces, tomato-based
6420 Other vegetables and combinations
6422 Vegetable mixed dishes
7008 Vegetable juice
2802 Beans, peas, legumes
STARCHY VEGETABLES 6416 Corn
6418 Other starchy vegetables
6802 White potatoes, baked or boiled
6804 French fries and other fried white potatoes
6806 Mashed potatoes and white potato mixtures

6
2020 Dietary Guidelines Advisory Committee Data Supplement: Food Category Sources
https://www.dietaryguidelines.gov/2020-advisory-committee-report/data-analysis
BEVERAGES (NOT INCL. MILK AND 100% FRUIT JUICE) *
SUGAR-SWEETENED AND DIET BEVERAGES 7102 Diet soft drinks
7104 Diet sport and energy drinks
7106 Other diet drinks
7202 Soft drinks
7204 Fruit drinks
7206 Sport and energy drinks
7208 Nutritional beverages
7802 Flavored or carbonated water
7220 Smoothies and grain drinks
COFFEE AND TEA
7302 Coffee
7304 Tea
ALCOHOLIC BEVERAGES 7502 Beer
7504 Wine
7506 Liquor and cocktails
WATERS 7702 Tap water
7704 Bottled water
7804 Enhanced or fortified water
CONDIMENTS, GRAVIES, SPREADS, SALAD DRESSINGS
CONDIMENTS AND GRAVIES 8402 Tomato-based condiments
8404 Soy-based condiments
8406 Mustard and other condiments
8408 Olives, pickles, pickled vegetables
8412 Dips, gravies, other sauces
SPREADS 8002 Butter and animal fats
8004 Margarine
8006 Cream cheese, sour cream, whipped cream
8008 Cream and cream substitutes
SALAD DRESSINGS 8010 Mayonnaise
8012 Salad dressings and vegetable oils

7
2020 Dietary Guidelines Advisory Committee Data Supplement: Food Category Sources
https://www.dietaryguidelines.gov/2020-advisory-committee-report/data-analysis
LIST OF TABLES*
Table 1. 1: Males and Females - Distribution of total energy intake (percentages) across major
categories ..................................................................................................................................................... 9
Table 1. 2: Males and Females - Distribution of total energy intake (percentages) across sub-
categories ..................................................................................................................................................... 9
Table 2. 1: Males and Females – Distribution of total energy intake (percentages) across major
categories - Income >185% of the Poverty Index Ratio ...................................................................... 14
Table 2. 2: Males and Females - Distribution of total energy intake (percentages) across sub-
categories - ................................................................................................................................................ 15
Table 2. 3: Males and Females- Percent contribution of sugar sweetened and diet beverages to
total energy consumption- Income >185% of the Poverty Index Ratio ............................................ 17
Table 2. 4: Males and Females - Distribution of total energy intake (percentages) across major
categories - Income ≤ 185% of the Poverty Index Ratio ..................................................................... 18
Table 2. 5: Males and Females - Distribution of total energy intake (percentages) across sub-
categories-Income ≤185% of the Poverty Index Ratio ........................................................................ 19
Table 2. 6: Males and Females - Percent contribution of sugar-sweetened and diet beverages to
total energy intake - Income > 185% of the Poverty Index Ratio ...................................................... 21

8
2020 Dietary Guidelines Advisory Committee Data Supplement: Food Category Sources
https://www.dietaryguidelines.gov/2020-advisory-committee-report/data-analysis
LIST OF FIGURES*
Figure 1. 1: Males and Females - Distribution of total energy intake (percentages) across major
categories ................................................................................................................................................... 12
Figure 1. 2: Males and Females - Distribution of total energy intake (percentages) across top 10
sub-categories ........................................................................................................................................... 13
Figure 2. 1: Males and Females - Distribution of total energy intake (percentages) across major
categories-Income >185% of the Poverty Index Ratio ........................................................................ 22
Figure 2. 2: Males and Females – Distribution of total energy intake (percentages) across top 10
sub-categories - Income >185% of the Poverty Index Ratio .............................................................. 23
Figure 2. 3: Males and Females- Percent contribution of sugar sweetened and diet beverages to
total energy consumption- Income >185% of the Poverty Index Ratio ............................................ 24
Figure 2. 4: Males and Females - Distribution of total energy intake (percentages) across major
categories - Income ≤ 185% of the Poverty Index Ratio ..................................................................... 25
Figure 2. 5: Males and Females - Distribution of total energy intake (percentages) across top 10
sub-categories - Income ≤185% of the Poverty Index Ratio .............................................................. 26
Figure 2. 6: Males and Females - Percent contribution of sugar-sweetened and diet beverages to
total energy intake - Income ≤185% of the Poverty Index Ratio ....................................................... 27
*Note: Each data table in this section has a figure that directly corresponds with the data in thetable. Figures do not include a description as it would be a direct repetition of the data in thepreceding tables.

9
2020 Dietary Guidelines Advisory Committee Data Supplement: Food Category Sources
https://www.dietaryguidelines.gov/2020-advisory-committee-report/data-analysis
Percent of total energy intake, 2013-16, by race/ethnicity, for U.S. population
ages 2 years and older, from WWEIA Food Categories
These data are estimates of the percent of total energy intake from WWEIA Food Categories, regrouped into DGAC major categories and subcategories as described elsewhere, for 2 years and older by racial/ethnic group, based on the day 1 dietary recalls from WWEIA, NHANES 2013-16. Breastfed children, and pregnant and lactating women have been excluded. The overall sample size is 15,807.
WHOLE SAMPLE (MALES + FEMALES, ages 2+)
Table 1. 1: Males and Females - Distribution of total energy intake (percentages) across major categories
DGAC major category
RACIAL/ETHNIC GROUP
NON-HISPANIC WHITES
MEXICAN AMERICANS
OTHER HISPANI CS
NON-HISPANIC BLACKS
NON-HISPANIC ASIANS
OTHER RACE/ETHNIC GROUPS
%
MIXED DISHES 29.92 33.48 30.20 28.12 26.70 29.32
SNACKS AND SWEETS 15.97 14.01 13.78 16.47 12.04 15.41
BEVERAGES (Not incl. Milk and 100% Fruit Juice)
12.71 11.64 12.71 13.01 7.75 13.66
PROTEIN FOODS 10.99 10.98 11.69 14.77 14.64 13.29
GRAINS 9.70 10.73 11.76 9.66 19.39 9.67
VEGETABLES 8.24 7.09 7.65 7.99 7.32 6.81
DAIRY 6.56 6.08 5.71 4.12 5.08 6.08
FRUITS+FRUIT JUICE 3.56 4.25 4.46 3.93 5.33 3.60
CONDIMENTS, GRAVIES, SPREADS, SALAD DRESSINGS
2.04 1.14 1.35 1.39 1.33 1.88
TOTAL* 99.69 99.40 99.32 99.46 99.58 99.73
*Totals are less than 100% because results do not include baby foods, infant formulas and WWEIA category – other

10
2020 Dietary Guidelines Advisory Committee Data Supplement: Food Category Sources
https://www.dietaryguidelines.gov/2020-advisory-committee-report/data-analysis
Table 1. 2: Males and Females - Distribution of total energy intake (percentages) across sub-categories
DGAC sub-category
RACIAL/ETHNIC GROUP
NON-
HISPANIC
WHITES
MEXICAN
AMERICANS
OTHER
HISPANI
CS
NON-
HISPANIC
BLACKS
NON-
HISPANIC
ASIANS
OTHER
RACE/ETHNIC
GROUPS
%
BURGERS AND SANDWICHES
(incl. Tacos and Burritos)
15.51 17.30 13.51 13.51 7.35 11.86
DESSERTS AND SWEET SNACKS 8.46 7.99 8.37 8.17 6.96 7.43
RICE, PASTA AND OTHER
GRAIN-BASED MIXED DISHES
5.83 7.74 7.87 6.55 7.53 7.34
SUGAR-SWEETENED AND DIET
BEVERAGES
5.55 7.15 7.08 7.41 2.95 7.00
CHIPS, CRACKERS, AND
SAVORY SNACKS
4.98 4.41 3.51 5.68 3.25 5.94
VEGETABLES (Incl. Beans and
Peas, not Starchy)
4.60 4.18 4.43 3.70 5.06 2.88
PIZZA 3.93 3.52 4.17 3.94 2.53 5.16
ALCOHOLIC BEVERAGES 3.91 1.93 2.32 2.93 1.72 2.97
BREAKFAST CEREALS AND
BARS
3.90 3.18 2.95 3.32 2.68 3.52
HIGHER FAT MILK/YOGURT 3.80 4.08 3.73 2.83 3.49 4.11
STARCHY VEGETABLES 3.65 2.91 3.22 4.29 2.27 3.93
MEAT, POULTRY, SEAFOOD
MIXED DISHES
3.61 2.54 2.89 2.93 5.00 3.34
COFFEE AND TEA 3.14 2.35 3.13 2.51 2.99 3.44
YEAST BREADS AND
TORTILLAS
3.03 5.32 3.85 2.35 5.01 2.69

11
2020 Dietary Guidelines Advisory Committee Data Supplement: Food Category Sources
https://www.dietaryguidelines.gov/2020-advisory-committee-report/data-analysis
POULTRY (Not incl. Deli and
Mixed Dishes)
2.86 3.52 4.22 6.54 3.93 4.66
FRUIT (Non-Juice) 2.72 2.98 3.01 2.31 4.43 2.63
CANDY AND SUGARS 2.54 1.61 1.91 2.61 1.83 2.04
NUTS, SEEDS, AND SOY 2.30 1.08 1.03 1.33 3.00 2.39
QUICK BREADS (Biscuits,
Muffins, Pancakes, Waffles)
1.87 1.22 1.71 2.19 1.42 1.78
MEATS (Not incl. Deli and Mixed
Dishes)
1.82 2.03 2.19 2.08 2.75 2.17
EGGS 1.67 2.64 2.11 1.48 1.95 1.51
CHEESE 1.52 1.06 1.04 0.77 0.52 1.12
DELI/CURED PRODUCTS (Meat
and Poultry)
1.37 0.74 0.88 1.50 0.86 1.48
LOWFAT MILK/YOGURT 1.23 0.94 0.94 0.52 1.06 0.86
SOUPS 1.04 2.37 1.77 1.20 4.29 1.61
SPREADS 1.02 0.38 0.49 0.42 0.34 0.61
SEAFOOD (Not incl. Mixed
Dishes)
0.98 0.97 1.25 1.83 2.15 1.08
RICE AND PASTA 0.90 1.01 3.24 1.80 10.28 1.68
100% FRUIT JUICE 0.85 1.27 1.45 1.62 0.89 0.97
CONDIMENTS AND GRAVIES 0.75 0.54 0.57 0.65 0.71 0.91
SALAD DRESSINGS 0.28 0.21 0.30 0.32 0.27 0.37
WATERS 0.11 0.21 0.17 0.16 0.10 0.24
TOTAL* 99.69 99.40 99.32 99.46 99.58 99.73
*Totals are less than 100% because results do not include baby foods, infant formulas and WWEIA category – other
%
Table 1. 2 Continued: Males and Females - Distribution of total energy intake (percentages) across sub-categories
DGAC sub-category
RACIAL/ETHNIC GROUP
NON-
HISPANIC
WHITES
MEXICAN
AMERICANS
OTHER
HISPANI
CS
NON-
HISPANIC
BLACKS
NON-
HISPANIC
ASIANS
OTHER
RACE/ETHNIC
GROUPS

12
2020 Dietary Guidelines Advisory Committee Data Supplement: Food Category Sources
https://www.dietaryguidelines.gov/2020-advisory-committee-report/data-analysis
Figure 1. 1: Males and Females - Distribution of total energy intake (percentages) across major categories
0
10
20
30
40
50
60
70
80
90
100
NON-HISPANICWHITES
MEXICANAMERICANS
OTHER HISPANICS
NON-HISPANICBLACKS
NON-HISPANICASIANS
OTHERRACE/ETHNIC
GROUPS
%
BEVERAGES (Not incl. Milk and 100% Fruit Juice) CONDIMENTS, GRAVIES, SPREADS, SALAD DRESSINGS
DAIRY FRUITS+FRUIT JUICE
GRAINS MIXED DISHES
PROTEIN FOODS SNACKS AND SWEETS
VEGETABLES

13
2020 Dietary Guidelines Advisory Committee Data Supplement: Food Category Sources
https://www.dietaryguidelines.gov/2020-advisory-committee-report/data-analysis
Figure 1. 2: Males and Females - Distribution of total energy intake (percentages) across top 10 sub-categories
0
10
20
30
40
50
60
70
80
90
100
NON-HISPANICWHITES
MEXICANAMERICANS
OTHER HISPANICS
NON-HISPANICBLACKS
NON-HISPANICASIANS
OTHERRACE/ETHNIC
GROUPS
%
BURGERS AND SANDWICHES (incl. Tacos and Burritos) DESSERTS AND SWEET SNACKS
RICE, PASTA AND OTHER GRAIN-BASED MIXED DISHES SUGAR-SWEETENED AND DIET BEVERAGES
CHIPS, CRACKERS, AND SAVORY SNACKS VEGETABLES (Incl. Beans and Peas, not Starchy)
PIZZA ALCOHOLIC BEVERAGES
BREAKFAST CEREALS AND BARS HIGHER FAT MILK/YOGURT

14
2020 Dietary Guidelines Advisory Committee Data Supplement: Food Category Sources
https://www.dietaryguidelines.gov/2020-advisory-committee-report/data-analysis
Percent of total energy intake, 2013-16, by income, for U.S. population ages 2
years and older, from WWEIA Food Categories
These data are estimates of the percent of total energy intake from WWEIA Food Categories, regrouped into DGAC major categories and subcategories as described elsewhere, for 2 years and older by age/income group, based on the day 1 dietary recalls from WWEIA, NHANES 2013-16.
Breastfed children, and pregnant and lactating women have been excluded. The overall sample size is 15,807.
WHOLE SAMPLE (MALES + FEMALES)
Table 2. 1: Males and Females – Distribution of total energy intake (percentages) across major categories - Income >185% of the Poverty Index Ratio
DGAC major category Age Groups (Years) 2+ 2-11 12-19 20+
%
MIXED DISHES 29.60 27.39 33.80 29.41
SNACKS AND SWEETS 15.64 21.85 17.59 14.50
BEVERAGES (Not incl. Milk and 100% Fruit Juice) 12.10 4.88 9.08 13.51
PROTEIN FOODS 11.91 9.31 8.22 12.73
GRAINS 10.44 11.97 11.66 10.07
VEGETABLES 8.31 4.58 6.01 9.13
DAIRY 5.99 12.44 7.98 4.81
FRUITS+FRUIT JUICE 3.73 5.48 4.00 3.44
CONDIMENTS, GRAVIES, SPREADS, SALAD
DRESSINGS 1.95 1.59 1.37 2.07
TOTAL* 99.66 99.49 99.71 99.68 *Totals are less than 100% because results do not include baby foods, infant formulas and WWEIA category – other

15
2020 Dietary Guidelines Advisory Committee Data Supplement: Food Category Sources
https://www.dietaryguidelines.gov/2020-advisory-committee-report/data-analysis
Table 2. 2: Males and Females - Distribution of total energy intake (percentages) across sub-categories - Income >185% of the Poverty Index Ratio
DGAC sub-category
Age Groups (Years) 2+ 2-11 12-19 20+
%
BURGERS AND SANDWICHES (incl. Tacos and
Burritos)
14.90 13.46 17.00 14.85
DESSERTS AND SWEET SNACKS 8.19 10.34 8.96 7.79
RICE, PASTA AND OTHER GRAIN-BASED MIXED
DISHES
6.24 6.45 6.61 6.17
SUGAR-SWEETENED AND DIET BEVERAGES 5.18 4.06 6.73 5.15
CHIPS, CRACKERS, AND SAVORY SNACKS 5.00 7.59 5.87 4.52
VEGETABLES (Incl. Beans and Peas, not Starchy) 4.68 1.77 2.68 5.35
ALCOHOLIC BEVERAGES 3.91 0.03 0.42 4.89
PIZZA 3.74 4.75 6.42 3.27
BREAKFAST CEREALS AND BARS 3.73 4.26 4.68 3.54
STARCHY VEGETABLES 3.63 2.81 3.33 3.78
HIGHER FAT MILK/YOGURT 3.50 8.00 4.89 2.67
MEAT, POULTRY, SEAFOOD MIXED DISHES 3.46 1.80 2.81 3.78
POULTRY (Not incl. Deli and Mixed Dishes) 3.34 3.55 3.63 3.28
YEAST BREADS AND TORTILLAS 3.21 2.77 2.47 3.36
COFFEE AND TEA 2.88 0.47 1.90 3.35
FRUIT (Non-Juice) 2.84 3.79 2.61 2.73
NUTS, SEEDS, AND SOY 2.45 1.10 0.89 2.84
CANDY AND SUGARS 2.44 3.93 2.77 2.19
QUICK BREADS (Biscuits, Muffins, Pancakes,
Waffles)
1.98 3.53 2.98 1.63
MEATS (Not incl. Deli and Mixed Dishes) 1.91 0.89 1.53 2.10
EGGS 1.76 1.45 0.84 1.92
RICE AND PASTA 1.51 1.41 1.54 1.53

16
2020 Dietary Guidelines Advisory Committee Data Supplement: Food Category Sources
https://www.dietaryguidelines.gov/2020-advisory-committee-report/data-analysis
CHEESE 1.33 1.61 1.33 1.29
DELI/CURED PRODUCTS (Meat and Poultry) 1.30 1.81 0.79 1.29
SOUPS 1.26 0.94 0.96 1.34
LOWFAT MILK/YOGURT 1.16 2.83 1.77 0.85
SEAFOOD (Not incl. Mixed Dishes) 1.14 0.51 0.55 1.30
SPREADS 0.90 0.77 0.59 0.95
100% FRUIT JUICE 0.89 1.70 1.38 0.71
CONDIMENTS AND GRAVIES 0.78 0.60 0.64 0.82
SALAD DRESSINGS 0.28 0.22 0.15 0.30
WATERS 0.13 0.31 0.03 0.11
TOTAL* 99.66 99.49 99.71 99.68
*Totals are less than 100% because results do not include baby foods, infant formulas and WWEIA category – other
Table 2. 2 Continued: Males and Females - Distribution of total energy intake (percentages) across sub-categories - Income >185% of the Poverty Index Ratio
DGAC sub-category
Age Groups (Years) 2+ 2-11 12-19 20+
%

17
2020 Dietary Guidelines Advisory Committee Data Supplement: Food Category Sources
https://www.dietaryguidelines.gov/2020-advisory-committee-report/data-analysis
Table 2. 3: Males and Females- Percent contribution of sugar sweetened and diet beverages to total energy consumption- Income >185% of the Poverty Index Ratio
DGAC beverage category Age Groups (Years) 2+ 2-11 12-19 20+
%
Soft drinks 2.68 1.58 3.66 2.73
Fruit drinks 0.74 1.64 1.61 0.50
Nutritional beverages 0.64 0.17 0.24 0.75
Smoothies and grain drinks 0.52 0.30 0.29 0.58
Sport and energy drinks 0.45 0.30 0.82 0.42
Diet soft drinks 0.08 0.01 0.01 0.09
Diet sport and energy drinks 0.03 0.01 0.05 0.03
Flavored or carbonated water 0.03 0.04 0.02 0.03
Other diet drinks 0.01 0.01 0.01 0.01
TOTAL 5.18 4.06 6.73 5.15
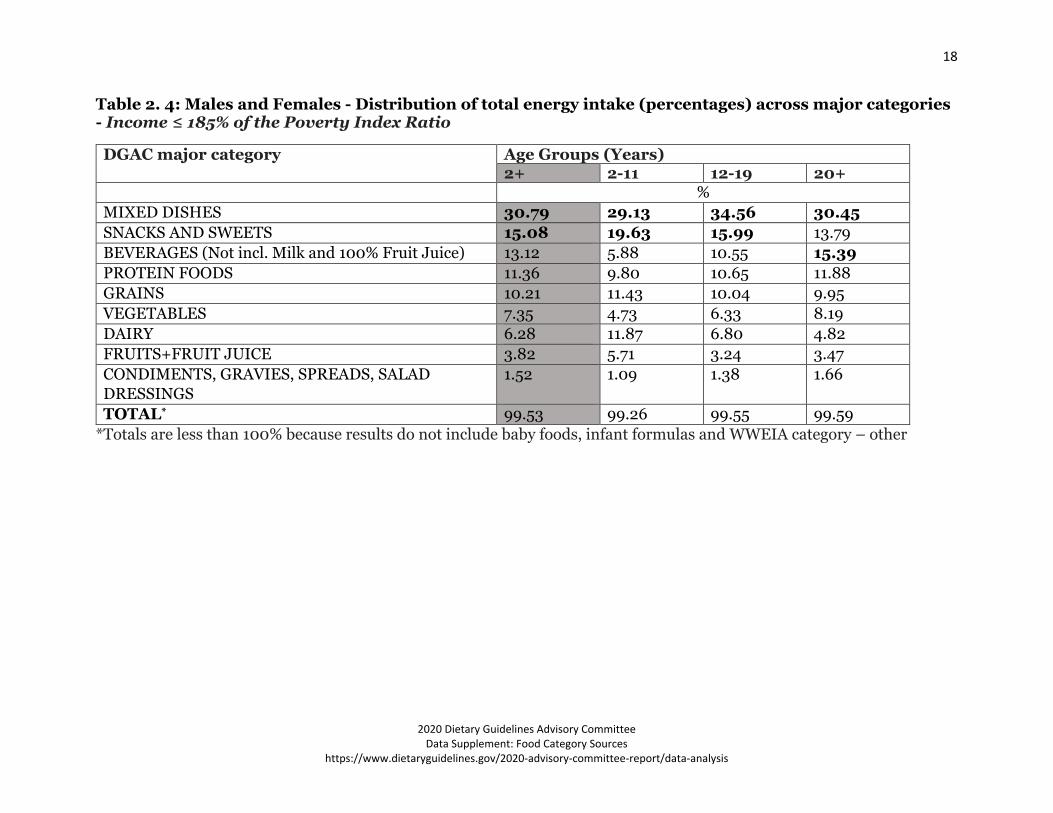
18
2020 Dietary Guidelines Advisory Committee Data Supplement: Food Category Sources
https://www.dietaryguidelines.gov/2020-advisory-committee-report/data-analysis
Table 2. 4: Males and Females - Distribution of total energy intake (percentages) across major categories - Income ≤ 185% of the Poverty Index Ratio
DGAC major category Age Groups (Years) 2+ 2-11 12-19 20+
%
MIXED DISHES 30.79 29.13 34.56 30.45
SNACKS AND SWEETS 15.08 19.63 15.99 13.79
BEVERAGES (Not incl. Milk and 100% Fruit Juice) 13.12 5.88 10.55 15.39
PROTEIN FOODS 11.36 9.80 10.65 11.88
GRAINS 10.21 11.43 10.04 9.95
VEGETABLES 7.35 4.73 6.33 8.19
DAIRY 6.28 11.87 6.80 4.82
FRUITS+FRUIT JUICE 3.82 5.71 3.24 3.47
CONDIMENTS, GRAVIES, SPREADS, SALAD
DRESSINGS
1.52 1.09 1.38 1.66
TOTAL* 99.53 99.26 99.55 99.59
*Totals are less than 100% because results do not include baby foods, infant formulas and WWEIA category – other

19
2020 Dietary Guidelines Advisory Committee Data Supplement: Food Category Sources
https://www.dietaryguidelines.gov/2020-advisory-committee-report/data-analysis
Table 2. 5: Males and Females - Distribution of total energy intake (percentages) across sub-categories-Income ≤185% of the Poverty Index Ratio
DGAC sub-category
Age Groups (Years) 2+ 2-11 12-19 20+
%
BURGERS AND SANDWICHES (incl. Tacos and Burritos) 14.79 12.37 16.08 15.12
DESSERTS AND SWEET SNACKS 8.17 10.15 7.43 7.84
SUGAR-SWEETENED AND DIET BEVERAGES 7.30 4.96 7.78 7.78
RICE, PASTA AND OTHER GRAIN-BASED MIXED
DISHES
6.73 7.58 7.50 6.37
CHIPS, CRACKERS, AND SAVORY SNACKS 4.65 6.69 5.98 3.90
PIZZA 4.21 5.21 6.69 3.47
HIGHER FAT MILK/YOGURT 4.11 8.02 4.51 3.08
VEGETABLES (Incl. Beans and Peas, not Starchy) 3.87 1.85 2.64 4.60
POULTRY (Not incl. Deli and Mixed Dishes) 3.85 4.39 4.65 3.56
YEAST BREADS AND TORTILLAS 3.51 2.89 2.93 3.77
STARCHY VEGETABLES 3.48 2.88 3.69 3.59
MEAT, POULTRY, SEAFOOD MIXED DISHES 3.38 2.16 2.84 3.78
BREAKFAST CEREALS AND BARS 3.36 5.02 3.87 2.86
COFFEE AND TEA 3.15 0.55 2.39 3.93
FRUIT (Non-Juice) 2.57 3.21 2.22 2.48
ALCOHOLIC BEVERAGES 2.51 0.00 0.29 3.56
CANDY AND SUGARS 2.25 2.80 2.58 2.05
MEATS (Not incl. Deli and Mixed Dishes) 1.96 1.21 2.04 2.13
EGGS 1.85 1.54 1.53 1.99
RICE AND PASTA 1.82 1.36 1.43 2.01
SOUPS 1.69 1.80 1.45 1.72
QUICK BREADS (Biscuits, Muffins, Pancakes, Waffles) 1.52 2.16 1.81 1.30
NUTS, SEEDS, AND SOY 1.32 0.58 0.87 1.58
100% FRUIT JUICE 1.25 2.50 1.02 0.99

20
2020 Dietary Guidelines Advisory Committee Data Supplement: Food Category Sources
https://www.dietaryguidelines.gov/2020-advisory-committee-report/data-analysis
CHEESE 1.22 1.41 0.99 1.21
SEAFOOD (Not incl. Mixed Dishes) 1.21 0.65 0.57 1.47
DELI/CURED PRODUCTS (Meat and Poultry) 1.17 1.43 0.99 1.15
LOWFAT MILK/YOGURT 0.96 2.44 1.30 0.53
SPREADS 0.63 0.33 0.31 0.76
CONDIMENTS AND GRAVIES 0.62 0.47 0.69 0.64
SALAD DRESSINGS 0.28 0.29 0.38 0.26
WATERS 0.15 0.37 0.09 0.11
TOTAL* 99.53 99.26 99.55 99.59
*Totals are less than 100% because results do not include baby foods, infant formulas and WWEIA category – other
Table 2. 5 Continued: Males and Females - Distribution of total energy intake (percentages) across sub-categories-Income ≤185% of the Poverty Index Ratio
DGAC sub-category
Age Groups (Years) 2+ 2-11 12-19 20+
%

21
2020 Dietary Guidelines Advisory Committee Data Supplement: Food Category Sources
https://www.dietaryguidelines.gov/2020-advisory-committee-report/data-analysis
Table 2. 6: Males and Females - Percent contribution of sugar-sweetened and diet beverages to total energy intake - Income > 185% of the Poverty Index Ratio
DGAC beverage category Age Groups (Years) 2+ 2-11 12-19 20+
%
Soft drinks 4.35 2.02 4.72 4.84
Fruit drinks 1.33 2.33 1.82 0.98
Sport and energy drinks 0.56 0.34 0.74 0.57
Nutritional beverages 0.50 0.02 0.11 0.70
Smoothies and grain drinks 0.48 0.23 0.34 0.58
Diet soft drinks 0.04 0.01 0.01 0.05
Other diet drinks 0.02 0.02 0.04 0.02
Flavored or carbonated water 0.01 0.00 0.00 0.02
Diet sport and energy drinks 0.01 0.00 0.01 0.02
TOTAL 7.30 4.96 7.78 7.78
Figure 2. 1: Males and Females - Distribution of total energy intake (percentages) across major categories-Income >185% of the Poverty Index Ratio

22
2020 Dietary Guidelines Advisory Committee Data Supplement: Food Category Sources
https://www.dietaryguidelines.gov/2020-advisory-committee-report/data-analysis
Figure 2. 1: Males and Females - Distribution of total energy intake (percentages) across major categories-Income >185% of the Poverty Index Ratio
0
10
20
30
40
50
60
70
80
90
100
2+ years 2-11 years 12-19 years 20+ years
%
MIXED DISHES SNACKS AND SWEETS
BEVERAGES (Not incl. Milk and 100% Fruit Juice) PROTEIN FOODS
GRAINS VEGETABLES
DAIRY FRUITS+FRUIT JUICE
CONDIMENTS, GRAVIES, SPREADS, SALAD DRESSINGS

23
2020 Dietary Guidelines Advisory Committee Data Supplement: Food Category Sources
https://www.dietaryguidelines.gov/2020-advisory-committee-report/data-analysis
Figure 2. 2: Males and Females – Distribution of total energy intake (percentages) across top 10 sub-categories - Income >185% of the Poverty Index Ratio
0
10
20
30
40
50
60
70
80
90
100
2+ years 2-11 years 12-19 years 20+ years
%
BURGERS AND SANDWICHES (incl. Tacos and Burritos) DESSERTS AND SWEET SNACKS
RICE, PASTA AND OTHER GRAIN-BASED MIXED DISHES SUGAR-SWEETENED AND DIET BEVERAGES
CHIPS, CRACKERS, AND SAVORY SNACKS VEGETABLES (Incl. Beans and Peas, not Starchy)
ALCOHOLIC BEVERAGES PIZZA
BREAKFAST CEREALS AND BARS STARCHY VEGETABLES

24
2020 Dietary Guidelines Advisory Committee Data Supplement: Food Category Sources
https://www.dietaryguidelines.gov/2020-advisory-committee-report/data-analysis
Figure 2. 3: Males and Females- Percent contribution of sugar sweetened and diet beverages to total energy consumption- Income >185% of the Poverty Index Ratio
0
1
2
3
4
5
6
7
8
9
10
2+ years 2-11 years 12-19 years 20+ years
%
Soft drinks Fruit drinks Nutritional beverages
Smoothies and grain drinks Sport and energy drinks Diet soft drinks
Diet sport and energy drinks Flavored or carbonated water Other diet drinks

25
2020 Dietary Guidelines Advisory Committee Data Supplement: Food Category Sources
https://www.dietaryguidelines.gov/2020-advisory-committee-report/data-analysis
Figure 2. 4: Males and Females - Distribution of total energy intake (percentages) across major categories - Income ≤ 185% of the Poverty Index Ratio
0
10
20
30
40
50
60
70
80
90
100
2+ years 2-11 years 12-19 years 20+ years
%
MIXED DISHES SNACKS AND SWEETS
BEVERAGES (Not incl. Milk and 100% Fruit Juice) PROTEIN FOODS
GRAINS VEGETABLES
DAIRY FRUITS+FRUIT JUICE
CONDIMENTS, GRAVIES, SPREADS, SALAD DRESSINGS

26
2020 Dietary Guidelines Advisory Committee Data Supplement: Food Category Sources
https://www.dietaryguidelines.gov/2020-advisory-committee-report/data-analysis
Figure 2. 5: Males and Females - Distribution of total energy intake (percentages) across top 10 sub-categories - Income ≤185% of the Poverty Index Ratio
0
10
20
30
40
50
60
70
80
90
100
2+ years 2-11 years 12-19 years 20+ years
%
BURGERS AND SANDWICHES (incl. Tacos and Burritos) DESSERTS AND SWEET SNACKS
SUGAR-SWEETENED AND DIET BEVERAGES RICE, PASTA AND OTHER GRAIN-BASED MIXED DISHES
CHIPS, CRACKERS, AND SAVORY SNACKS PIZZA
HIGHER FAT MILK/YOGURT VEGETABLES (Incl. Beans and Peas, not Starchy)
POULTRY (Not incl. Deli and Mixed Dishes) YEAST BREADS AND TORTILLAS

27
2020 Dietary Guidelines Advisory Committee Data Supplement: Food Category Sources
https://www.dietaryguidelines.gov/2020-advisory-committee-report/data-analysis
Figure 2. 6: Males and Females - Percent contribution of sugar-sweetened and diet beverages to total energy intake - Income ≤185% of the Poverty Index Ratio
0
1
2
3
4
5
6
7
8
9
10
2+ years 2-11 years 12-19 years 20+ years
%
Soft drinks Fruit drinks Sport and energy drinks
Nutritional beverages Smoothies and grain drinks Diet soft drinks
Other diet drinks Flavored or carbonated water Diet sport and energy drinks

28
2020 Dietary Guidelines Advisory Committee Data Supplement: Food Category Sources
https://www.dietaryguidelines.gov/2020-advisory-committee-report/data-analysis
References
1. Centers for Disease Prevention and Control. National Health and NutritionExamination Survey: Survey Methods and Analytic Guidelines. Centers forDisease Prevention and Control Website:https://wwwn.cdc.gov/nchs/nhanes/AnalyticGuidelines.aspx#analytic-guidelines . Accessed March 22, 2019.
2. Agricultural Research Service, United States Department of Agriculture.WWEIA/NHANES Overview. Agricultural Research Service website:https://www.ars.usda.gov/northeast-area/beltsville-md-bhnrc/beltsville-human-nutrition-research-center/food-surveys-research-group/docs/wweianhanes-overview/. Updated July 31, 2018. Accessed March22, 2019.
3. Bowman SA, Clemens JC, Friday JE, Lynch KL, and Moshfegh AJ. 2017. FoodPatterns Equivalents Database 2013-14: Methodology and User Guide. U.S.Department of Agriculture, Agricultural Research Service, Food SurveysResearch Group website: http://www.ars.usda.gov/nea/bhnrc/fsrg. AccessedMarch 22, 2019.

Food Sources of Food Group Intakes Among
Infants and Toddlers
NHANES 2007-16
Acknowledgements:
Prepared by National Cancer Institute, NIH

2020 Dietary Guidelines Advisory Committee
Data Supplement: Food Category Sources
https://www.dietaryguidelines.gov/2020-advisory-committee-report/data-analysis
Food Sources of Food Group Intakes Among Infants and Toddlers, 2007-16
• Objective
• Methods
• Figure
o What We Eat in America Food Categories
• Tables
o Footnotes for Tables
o Tables 1-16
Objective
The purpose of this research was to identify the contributions of food categories to food group
intakes among infants and toddlers.
Methods
We used the 2007-16 National Health and Nutrition Examination Survey data to determine the
weighted population contribution of food categories to intakes of food groups, including total
fruit, total vegetables, total grains, total protein foods, total dairy, oils, solid fats, and added
sugars. The dietary intake data collected in the surveys were categorized by the U.S. Department
of Agriculture into approximately 150 specific What We Eat in America (WWEIA) food
categories, including 46 food subcategories, and 15 major food categories (see Figure).
1

2020 Dietary Guidelines Advisory Committee
Data Supplement: Food Category Sources
https://www.dietaryguidelines.gov/2020-advisory-committee-report/data-analysis
Footnotes for All Tables*
Description: All tables include the percent contribution, cumulative percent contribution,
mean, and standard error of the mean.
Format and sample size: For infants, there are three tables for each food group: the first
table is for all infants 6-11 months (n=1988), and the second and third tables are stratified
by infant milk source: infants consuming human milk (n=153) and infants consuming any
formula (n=802). For toddlers, there is one table for each food group: all toddlers 12-23
months (n=1242).
Food categories: Because of limited sample size, we used the major food categories for
infants 6-11 months and the food subcategories for toddlers 12-23 months.
Exclusions: Human milk and infant formula were excluded from all analyses. Thus,
these analyses include food group intake from complementary foods and beverages, not
total intake.
2

What We Eat in America Food Categories
www.ars.usda.gov/ nea/bhnrc/fsrg
Milk
Milk, whole
MILK AND DAIRY
Cooked Grains
Rice
GRAINS BEVERAGES, NONALCOHOLIC
100% Juice
Citrus juice
Milk, reduced fat
Milk, lowfat
Milk, nonfat
Flavored Milk
Flavored milk, whole
Flavored milk, reduced fat
Flavored milk, lowfat
Flavored milk, nonfat
Dairy Drinks and Substitutes
Milk shakes and other dairy drinks
Milk substitutes
Cheese
Cheese
Cottage/ricotta cheese
Yogurt
Yogurt, regular
Yogurt, Greek
PROTEIN FOODS
Meats
Beef, excludes ground
Ground beef
Pork
Lamb, goat, game
Liver and organ meats
Poultry
Chicken, whole pieces
Chicken patties, nuggets and tenders
Turkey, duck, other poultry
Seafood
Fish
Shellfish
Eggs
Eggs and omelets
Cured Meats/Poultry
Cold cuts and cured meats
Bacon
Frankfurters
Sausages
Plant-based Protein Foods
Beans, peas, legumes
Nuts and seeds
Processed soy products
MIXED DISHES
Mixed Dishes - Meat, Poultry, Seafood
Meat mixed dishes
Poultry mixed dishes
Seafood mixed dishes
Mixed Dishes - Grain-based
Rice mixed dishes
Pasta dishes, excludes macaroni and cheese
Macaroni and cheese
Turnovers and other grain-based items
Mixed Dishes - Asian
Fried rice and lo/chow mein
Stir-fry and soy-based sauce mixtures
Egg rolls, dumplings, sushi
Mixed Dishes - Mexican
Burritos and tacos
Nachos
Other Mexican mixed dishes
Mixed Dishes - Pizza
Pizza
Mixed Dishes - Sandwiches (single code)
Burgers
Chicken/turkey sandwiches
Egg/breakfast sandwiches
Frankfurter sandwiches
Other sandwiches
Mixed Dishes - Soups
Soups
Pasta, noodles, cooked grains
Breads, Rolls, Tortillas
Yeast breads
Rolls and buns
Bagels and English muffins
Tortillas
Quick Breads and Bread Products
Biscuits, muffins, quick breads
Pancakes, waffles, French toast
Ready-to-Eat Cereals
Ready-to-eat cereal, high sugar (>21.2g/100g)
Ready-to-eat cereal, low sugar (:S21.2g/100g)
Cooked Cereals
Oatmeal
Grits and other cooked cereals
SNACKS AND SWEETS
Savory Snacks
Potato chips
Tortilla, corn, other chips
Popcorn
Pretzels/snack mix
Crackers
Crackers, excludes saltines
Saltine crackers
Snack/Meal Bars
Cereal bars
Nutrition bars
Sweet Bakery Products
Cakes and pies
Cookies and brownies
Doughnuts, sweet rolls, pastries
Candy
Candy containing chocolate
Candy not containing chocolate
Other Desserts
Ice cream and frozen dairy desserts
Pudding
Gelatins, ices, sorbets
FRUIT
Fruits
Apples
Bananas
Grapes
Peaches and nectarines
Berries
Citrus fruits
Melons
Dried fruits
Other fruits and fruit salads
VEGETABLES
Vegetables, excluding Potatoes
Tomatoes
Carrots
Other red and orange vegetables
Dark green vegetables, excludes lettuce
Lettuce and lettuce salads
String beans
Onions
Corn
Other starchy vegetables
Other vegetables and combinations
Vegetable mixed dishes
White Potatoes
White potatoes, baked or boiled
French fries and other fried white potatoes
Mashed potatoes and white potato mixtures
Apple juice
Other fruit juice
Vegetable juice
Diet Beverages
Diet soft drinks
Diet sport and energy drinks
Other diet drinks
Sweetened Beverages
Soft drinks
Fruit drinks
Sport and energy drinks
Nutritional beverages
Smoothies and grain drinks
Coffee and Tea
Coffee
Tea
ALCOHOLIC BEVERAGES
Alcoholic Beverages
Beer
Wine
Liquor and cocktails
WATER
Plain Water
Tap water
Bottled water
Flavored or Enhanced Water
Flavored or carbonated water
Enhanced or fortified water
FATS AND OILS
Fats and Oils
Butter and animal fats
Margarine
Cream cheese, sour and whipped cream
Cream and cream substitutes
Mayonnaise
Salad dressings and vegetable oils
CONDIMENTS AND SAUCES
Condiments and Sauces
Tomato-based condiments
Soy-based condiments
Mustard and other condiments
Olives, pickles, pickled vegetables
Pasta sauces, tomato-based
Dips, gravies, other sauces
SUGARS
Sugars
Sugars and honey
Sugar substitutes
Jams, syrups, toppings
INFANT FORMULA & BABY FOOD
Baby Foods
Baby food: cereals
Baby food: fruit
Baby food: vegetable
Baby food: meat and dinners
Baby food: yogurt
Baby food: snacks and sweets
Baby Beverages
Baby juice
Baby water
Infant Formulas
Formula, ready-to-feed
Formula, prepared from powder
Formula, prepared from concentrate
Human Milk
Human milk
OTHER
Protein and nutritional powders
Not included in a food category
2020 Dietary Guidelines Advisory Committee
Data Supplement: Food Category Sources
https://www.dietaryguidelines.gov/2020-advisory-committee-report/data-analysis
3

2020 Dietary Guidelines Advisory Committee
Data Supplement: Food Category Sources
https://www.dietaryguidelines.gov/2020-advisory-committee-report/data-analysis
Table 1. Food Sources of Total Fruit Among All Infants 6-11 Months, 2007-2016*
Rank Major Food Category % Cumulative % Mean SE Mean
1 Infant Formula & Baby Food 59.27 59.28 0.36 0.02
2 Fruit 26.10 85.38 0.16 0.02
3 Beverages, Nonalcoholic 13.73 99.11 0.08 0.01
Contributing less than 2% in descending order: Snacks and Sweets; Milk and Dairy; Grains; Mixed Dishes; Sugars;
Condiments and Sauces; Protein Foods; Vegetables; Water; Fats and Oils; Other
Table 1a. Food Sources of Total Fruit Among Infants 6-11 Months Consuming Human
Milk, 2007-2016*
Rank Major Food Category % Cumulative % Mean SE Mean
1 Fruit 56.48 56.48 0.25 0.05
2 Infant Formula & Baby Food 37.69 94.17 0.164 0.03
3 Beverages, Nonalcoholic 4.49 98.66 0.02 0.01
Contributing less than 2% in descending order: Milk and Dairy; Grains; Snacks and Sweets; Condiments and
Sauces; Sugars; Protein Foods; Mixed Dishes; Vegetables; Water; Fats and Oils
Table 1b. Food Sources of Total Fruit Among Infants 6-11 Months Consuming Formula,
2007-2016*
Rank Major Food Category % Cumulative % Mean SE Mean
1 Infant Formula & Baby Food 66.01 66.01 0.42 0.03
2 Fruit 19.34 85.35 0.12 0.01
3 Beverages, Nonalcoholic 13.80 99.15 0.09 0.01
Contributing less than 2% in descending order: Snacks and Sweets; Milk and Dairy; Grains; Mixed Dishes; Sugars;
Protein Foods; Vegetables; Water; Fats and Oils; Condiments and Sauces; Other
4

2020 Dietary Guidelines Advisory Committee
Data Supplement: Food Category Sources
https://www.dietaryguidelines.gov/2020-advisory-committee-report/data-analysis
Table 2. Food Sources of Total Vegetables Among All Infants 6-11 Months, 2007-2016*
Rank Major Food Category % Cumulative % Mean SE Mean
1 Infant Formula & Baby Food 58.53 58.53 0.23 0.01
2 Vegetables 28.25 86.78 0.11 0.01
3 Mixed Dishes 11.89 98.67 0.05 0.01
Contributing less than 2% in descending order: Snacks and Sweets; Protein Foods; Condiments and Sauces; Grains;
Beverages, Nonalcoholic; Other; Milk and Dairy; Fruit; Water; Fats and Oils; Sugars
Table 2a. Food Sources of Total Vegetables Among Infants 6-11 Months Consuming
Human Milk, 2007-2016*
Rank Major Food Category % Cumulative % Mean SE Mean
1 Vegetables 55.27 55.27 0.19 0.05
2 Infant Formula & Baby Food 32.43 87.69 0.11 0.03
3 Mixed Dishes 10.08 97.78 0.03 0.01
Contributing less than 2% in descending order: Snacks and Sweets; Protein Foods; Condiments and Sauces; Grains;
Beverages, Nonalcoholic; Milk and Dairy; Fruit; Water; Fats and Oils; Sugars
Table 2b. Food Sources of Total Vegetables Among Infants 6-11 Months Consuming
Formula, 2007-2016*
Rank Major Food Category % Cumulative % Mean SE Mean
1 Infant Formula & Baby Food 65.83 65.83 0.26 0.02
2 Vegetables 21.30 87.13 0.08 0.01
3 Mixed Dishes 11.73 98.86 0.05 0.01
Contributing less than 2% in descending order: Snacks and Sweets; Condiments and Sauces; Protein Foods;
Beverages, Nonalcoholic; Milk and Dairy; Grains; Fruit; Water; Fats and Oils; Sugars; Other
5

2020 Dietary Guidelines Advisory Committee
Data Supplement: Food Category Sources
https://www.dietaryguidelines.gov/2020-advisory-committee-report/data-analysis
Table 3. Food Sources of Total Grains Among All Infants 6-11 Months, 2007-2016*
Rank Major Food Category % Cumulative % Mean SE Mean
1 Infant Formula & Baby Food 52.92 52.92 0.57 0.03
2 Grains 19.55 72.46 0.21 0.02
3 Mixed Dishes 13.71 86.18 0.15 0.02
4 Snacks and Sweets 12.20 98.37 0.13 0.01
Contributing less than 2% in descending order: Protein Foods; Milk and Dairy; Condiments and Sauces; Vegetables,
Beverages, Nonalcoholic; Fruit; Water; Fats and Oils; Sugars; Others
Table 3a. Food Sources of Total Grains Among Infants 6-11 Months Consuming Human
Milk, 2007-2016*
Rank Major Food Category % Cumulative % Mean SE Mean
1 Infant Formula & Baby Food 48.79 48.79 0.38 0.04
2 Grains 25.45 74.25 0.20 0.06
3 Snacks and Sweets 15.04 89.29 0.12 0.03
4 Mixed Dishes 7.96 97.25 0.06 0.02
5 Protein Foods 2.72 99.97 0.02 0.02
Contributing less than 2% in descending order: Milk and Dairy; Condiments and Sauces; Fruit; Vegetables;
Beverages, Nonalcoholic; Water; Fats and Oils; Sugars
Table 3b. Food Sources of Total Grains Among Infants 6-11 Months Consuming Formula,
2007-2016*
Rank Major Food Category % Cumulative % Mean SE Mean
1 Infant Formula & Baby Food 56.91 56.91 0.62 0.03
2 Grains 16.78 73.69 0.18 0.02
3 Mixed Dishes 13.90 87.59 0.15 0.02
4 Snacks and Sweets 11.11 98.70 0.12 0.01
Contributing less than 2% in descending order: Protein Foods; Milk and Dairy; Condiments and Sauces; Vegetables;
Beverages, Nonalcoholic; Fruit; Water; Fats and Oils; Sugars; Other
6

2020 Dietary Guidelines Advisory Committee
Data Supplement: Food Category Sources
https://www.dietaryguidelines.gov/2020-advisory-committee-report/data-analysis
Table 4. Food Sources of Total Protein Foods Among All Infants 6-11 Months, 2007-2016*
Rank Major Food Category % Cumulative % Mean SE Mean
1 Protein Foods 48.33 48.33 0.23 0.03
2 Infant Formula & Baby Food 29.02 77.35 0.14 0.02
3 Mixed Dishes 20.69 98.04 0.10 0.01
Contributing less than 2% in descending order: Milk and Dairy; Snacks and Sweets; Grains; Vegetables; Beverages,
Nonalcoholic; Condiments and Sauces; Fruit; Water; Fats and Oils; Sugars; Other
Table 4a. Food Sources of Total Protein Foods Among Infants 6-11 Months Consuming
Human Milk, 2007-2016*
Rank Major Food Category % Cumulative % Mean SE Mean
1 Protein Foods 45.12 45.12 0.15 0.05
2 Mixed Dishes 29.14 74.26 0.10 0.04
3 Infant Formula & Baby Food 22.15 96.41 0.07 0.03
Contributing less than 2% in descending order: Milk and Dairy; Grains; Snacks and Sweets; Condiments and
Sauces; Vegetables; Fruit; Beverages, Nonalcoholic; Water; Fats and Oils; Sugars
Table 4b. Food Sources of Total Protein Foods Among Infants 6-11 Months Consuming
Formula, 2007-2016*
Rank Major Food Category % Cumulative % Mean SE Mean
1 Protein Foods 46.81 46.81 0.21 0.03
2 Infant Formula & Baby Food 31.60 78.41 0.143 0.02
3 Mixed Dishes 19.73 98.15 0.09 0.02
Contributing less than 2% in descending order: Snacks and Sweets; Milk and Dairy; Grains; Vegetables; Beverages,
Nonalcoholic; Condiments and Sauces; Fruit; Water; Fats and Oils; Sugars; Other
7

2020 Dietary Guidelines Advisory Committee
Data Supplement: Food Category Sources
https://www.dietaryguidelines.gov/2020-advisory-committee-report/data-analysis
Table 5. Food Sources of Total Dairy Among All Infants 6-11 Months, 2007-2016*
Rank Major Food Category % Cumulative % Mean SE Mean
1 Milk and Dairy 75.63 75.63 0.20 0.02
2 Infant Formula & Baby Food 11.61 87.24 0.03 0.00
3 Mixed Dishes 6.90 94.15 0.02 0.00
Contributing less than 2% in descending order: Snacks and Sweets; Grains; Protein Foods; Vegetables; Beverages,
Nonalcoholic; Condiments and Sauces; Fats and Oils; Other; Fruit; Water; Sugars
Table 5a. Food Sources of Total Dairy Among Infants 6-11 Months Consuming Human
Milk, 2007-2016*
Rank Major Food Category % Cumulative % Mean SE Mean
1 Milk and Dairy 76.81 76.81 0.12 0.04
2 Infant Formula & Baby Food 14.41 91.22 0.02 0.01
3 Mixed Dishes 2.05 93.27 0.00 0.00
Contributing less than 2% in descending order: Beverages, Nonalcoholic; Grains: Snacks and Sweets; Protein
Foods; Vegetables; Condiments and Sauces; Fruit; Water; Fats and Oils; Sugars
Table 5b. Food Sources of Total Dairy Among Infants 6-11 Months Consuming Formula,
2007-2016*
Rank Major Food Category % Cumulative % Mean SE Mean
1 Milk and Dairy 60.90 60.90 0.11 0.01
2 Infant Formula & Baby Food 17.30 78.20 0.03 0.00
3 Mixed Dishes 12.61 90.81 0.02 0.00
4 Snacks and Sweets 3.05 93.87 0.01 0.00
5 Grains 2.66 96.53 0.01 0.00
6 Protein Foods 2.04 98.57 0.00 0.00
Contributing less than 2% in descending order: Vegetables; Beverages, Nonalcoholic; Condiments and Sauces; Fats
and Oils; Other; Fruit; Water; Sugars
8

2020 Dietary Guidelines Advisory Committee
Data Supplement: Food Category Sources
https://www.dietaryguidelines.gov/2020-advisory-committee-report/data-analysis
Table 6. Food Sources of Oils Among All Infants 6-11 Months, 2007-2016*
Rank Major Food Category % Cumulative % Mean SE Mean
1 Mixed Dishes 22.18 22.18 0.37 0.05
2 Vegetables 20.63 42.81 0.345 0.09
3 Snacks and Sweets 18.92 61.74 0.32 0.04
4 Protein Foods 17.25 78.99 0.29 0.06
5 Infant Formula & Baby Food 9.24 88.23 0.15 0.02
6 Grains 7.30 95.53 0.12 0.03
Contributing less than 2% in descending order: Milk and Dairy; Condiments and Sauces; Fats and Oils; Fruit;
Beverages, Nonalcoholic; Water; Sugars; Other
Table 6a. Food Sources of Oils Among All Infants 6-11 Months Consuming Human Milk, 2007-
2016*
Rank Major Food Category % Cumulative % Mean SE Mean
1 Vegetables 50.73 50.73 1.00 0.44
2 Protein Foods 14.44 65.18 0.29 0.12
3 Snacks and Sweets 10.90 76.07 0.22 0.10
4 Mixed Dishes 9.05 85.12 0.18 0.05
5 Grains 6.09 91.21 0.12 0.05
6 Infant Formula & Baby Food 4.33 95.55 0.09 0.03
7 Condiments and Sauces 2.63 98.18 0.05 0.05
Contributing less than 2% in descending order: Milk and Dairy; Fruit; Beverages, Nonalcoholic; Water; Fats and
Oils; Sugars
Table 6b. Food Sources of Oils Among All Infants 6-11 Months Consuming Formula, 2007- 2016*
Rank Major Food Category % Cumulative % Mean SE Mean
1 Mixed Dishes 26.70 26.70 0.40 0.06
2 Snacks and Sweets 21.69 48.38 0.33 0.05
3 Protein Foods 16.90 65.28 0.25 0.07
4 Vegetables 11.97 77.26 0.18 0.05
5 Infant Formula & Baby Food 11.67 88.93 0.18 0.02
6 Grains 7.52 96.45 0.11 0.04
Contributing less than 2% in descending order: Condiments and Sauces; Milk and Dairy; Fats and Oils; Beverages,
Nonalcoholic; Fruit; Water; Sugars; Other
9

2020 Dietary Guidelines Advisory Committee
Data Supplement: Food Category Sources
https://www.dietaryguidelines.gov/2020-advisory-committee-report/data-analysis
Table 7. Food Sources of Solid Fats Among All Infants 6-11 Months, 2007-2016*
Rank Major Food Category % Cumulative % Mean SE Mean
1 Milk and Dairy 35.43 35.43 1.19 0.15
2 Mixed Dishes 17.31 52.74 0.58 0.10
3 Protein Foods 16.86 69.60 0.57 0.09
4 Snacks and Sweets 10.71 80.31 0.36 0.05
5 Infant Formula & Baby Food 9.28 89.59 0.31 0.03
6 Vegetables 5.17 94.76 0.17 0.03
7 Grains 3.25 98.01 0.11 0.02
Contributing less than 2% in descending order: Fats and Oils; Condiments and Sauces; Beverages, Nonalcoholic;
Sugars; Fruit; Other; Water
Table 7a. Food Sources of Solid Fats Among Infants 6-11 Months Consuming Human Milk, 2007-
2016*
Rank Major Food Category % Cumulative % Mean SE Mean
1 Milk and Dairy 40.11 40.11 0.79 0.26
2 Protein Foods 16.88 56.99 0.33 0.14
3 Mixed Dishes 12.75 69.74 0.25 0.10
4 Snacks and Sweets 11.80 81.54 0.23 0.07
5 Vegetables 6.46 87.60 0.13 0.06
6 Infant Formula & Baby Food 5.46 93.46 0.11 0.04
7 Grains 5.11 98.57 0.10 0.04
Contributing less than 2% in descending order: Fats and Oils; Beverages, Nonalcoholic; Condiments and Sauces;
Fruit; Water; Sugars
10

2020 Dietary Guidelines Advisory Committee
Data Supplement: Food Category Sources
https://www.dietaryguidelines.gov/2020-advisory-committee-report/data-analysis
Table 7b. Food Sources of Solid Fats Among Infants 6-11 Months Consuming Solid Fats, 2007-
2016*
Rank Major Food Category % Cumulative % Mean SE Mean
1 Milk and Dairy 23.20 23.20 0.67 0.10
2 Mixed Dishes 21.35 44.56 0.61 0.12
3 Protein Foods 19.04 63.60 0.55 0.10
4 Snacks and Sweets 12.72 76.32 0.37 0.06
5 Infant Formula & Baby Food 12.03 88.35 0.35 0.04
6 Vegetables 6.27 94.62 0.18 0.03
7 Grains 3.56 98.19 0.10 0.02
Contributing less than 2% in descending order: Fats and Oils; Condiments and Sauces; Beverages,
Nonalcoholic; Sugars; Fruit; Other; Water
11

2020 Dietary Guidelines Advisory Committee
Data Supplement: Food Category Sources
https://www.dietaryguidelines.gov/2020-advisory-committee-report/data-analysis
Table 8. Food Sources of Added Sugars Among All Infants 6-11 Months, 2007-2016*
Rank Major Food Category % Cumulative % Mean SE Mean
1 Snacks and Sweets 23.36 23.36 0.23 0.03
2 Milk and Dairy 19.63 42.99 0.19 0.04
3 Infant Formula & Baby Food 18.66 61.64 0.19 0.02
4 Beverages, Nonalcoholic 13.15 74.79 0.13 0.03
5 Grains 10.74 85.53 0.11 0.02
6 Fruit 8.36 93.89 0.08 0.02
7 Mixed Dishes 2.45 96.34 0.02 0.01
Contributing less than 2% in descending order: Sugars; Protein Foods; Other; Water; Vegetables; Condiments and
Sauces; Fats and Oils
Table 8a. Food Sources of Added Sugars Among Infants 6-11 Months Consuming Human Milk,
2007-2016*
Rank Major Food Category % Cumulative % Mean SE Mean
1 Milk and Dairy 27.80 27.80 0.28 0.12
2 Grains 17.34 45.15 0.17 0.07
3 Fruit 15.65 60.79 0.16 0.05
4 Snacks and Sweets 15.46 76.25 0.15 0.05
5 Infant Formula & Baby Food 13.80 90.05 0.14 0.03
6 Beverages, Nonalcoholic 5.99 96.04 0.06 0.03
7 Mixed Dishes 2.26 98.30 0.02 0.01
Contributing less than 2% in descending order: Protein Foods; Sugars; Condiments and Sauces; Vegetables; Water;
Fats and Oils
12

2020 Dietary Guidelines Advisory Committee
Data Supplement: Food Category Sources
https://www.dietaryguidelines.gov/2020-advisory-committee-report/data-analysis
Table 8b. Food Sources of Added Sugars Among Infants 6-11 Months Consuming
Formula, 2007-2016*
Rank Major Food Category % Cumulative % Mean SE Mean
1 Snacks and Sweets 24.97 24.97 0.23 0.04
2 Infant Formula & Baby Food 19.86 44.83 0.18 0.02
3 Milk and Dairy 18.72 63.55 0.17 0.05
4 Beverages, Nonalcoholic 15.75 79.30 0.14 0.03
5 Grains 7.74 87.04 0.07 0.01
6 Fruit 6.83 93.86 0.06 0.02
7 Mixed Dishes 2.45 96.31 0.02 0.01
Contributing less than 2% in descending order: Sugars; Protein Foods; Water; Vegetables; Other; Condiments
and Sauces; Fats and Oils
13
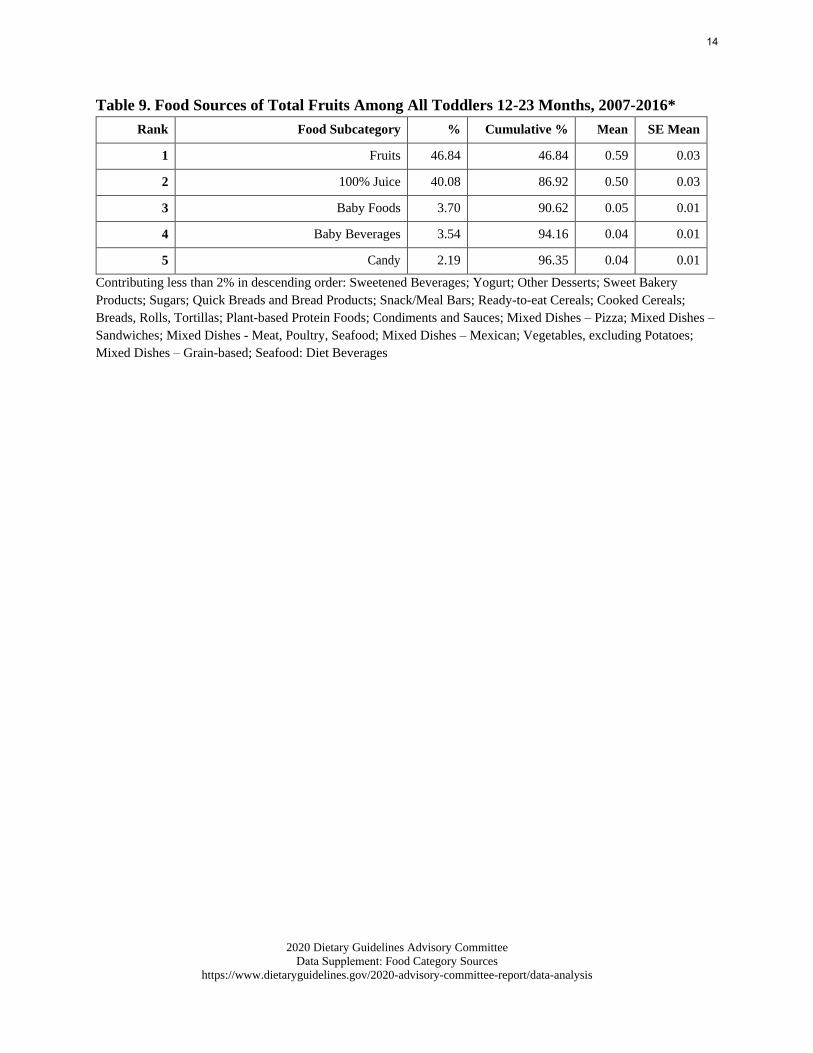
2020 Dietary Guidelines Advisory Committee
Data Supplement: Food Category Sources
https://www.dietaryguidelines.gov/2020-advisory-committee-report/data-analysis
Table 9. Food Sources of Total Fruits Among All Toddlers 12-23 Months, 2007-2016*
Rank Food Subcategory % Cumulative % Mean SE Mean
1 Fruits 46.84 46.84 0.59 0.03
2 100% Juice 40.08 86.92 0.50 0.03
3 Baby Foods 3.70 90.62 0.05 0.01
4 Baby Beverages 3.54 94.16 0.04 0.01
5 Candy 2.19 96.35 0.04 0.01
Contributing less than 2% in descending order: Sweetened Beverages; Yogurt; Other Desserts; Sweet Bakery
Products; Sugars; Quick Breads and Bread Products; Snack/Meal Bars; Ready-to-eat Cereals; Cooked Cereals;
Breads, Rolls, Tortillas; Plant-based Protein Foods; Condiments and Sauces; Mixed Dishes – Pizza; Mixed Dishes –
Sandwiches; Mixed Dishes - Meat, Poultry, Seafood; Mixed Dishes – Mexican; Vegetables, excluding Potatoes;
Mixed Dishes – Grain-based; Seafood: Diet Beverages
14

2020 Dietary Guidelines Advisory Committee
Data Supplement: Food Category Sources
https://www.dietaryguidelines.gov/2020-advisory-committee-report/data-analysis
Table 10. Food Sources of Total Vegetables Among All Toddlers 12-23 Months, 2007-2016*
Rank Food Subcategory % Cumulative % Mean SE Mean
1 Vegetables, excluding Potatoes 35.28 35.29 0.18 0.01
2 White Potatoes 17.42 52.71 0.09 0.01
3 Mixed Dishes - Grain-based 10.36 63.07 0.05 0.01
4 Baby Foods 7.86 70.94 0.04 0.01
5 Mixed Dishes - Meat, Poultry, Seafood 7.37 78.31 0.04 0.01
6 Mixed Dishes - Soup 6.66 84.97 0.03 0.01
7 Savory Snacks 4.53 89.50 0.02 0.00
8 Condiments and Sauces 2.16 91.65 0.01 0.00
Contributing less than 2% in descending order: Mixed Dishes – Mexican; Mixed Dishes – Pizza; Mixed Dishes –
Asian; 100% Juice; Mixed Dishes – Sandwiches; Eggs; Plant-based Protein Foods; Sweetened Beverages; Sweet
Bakery Products; Poultry; Quick Breads and Bread Products; Breads, Rolls, Tortillas; Baby Beverages; Fats and
Oils; Not included in a food category; Seafood: Diet Beverages
15

2020 Dietary Guidelines Advisory Committee
Data Supplement: Food Category Sources
https://www.dietaryguidelines.gov/2020-advisory-committee-report/data-analysis
Table 11. Food Sources of Total Grains Among All Toddlers 12-23 Months, 2007-2016*
Rank Food Subcategory % Cumulative % Mean SE Mean
1 Breads, Rolls, Tortillas 18.07 18.07 0.56 0.03
2 Mixed Dishes - Grain-based 11.25 29.32 0.35 0.02
3 Sweet Bakery Products 10.38 39.70 0.32 0.02
4 Crackers 8.91 48.61 0.27 0.02
5 Ready-to-eat Cereals 6.20 54.81 0.19 0.02
6 Savory Snacks 5.46 60.27 0.17 0.02
7 Baby Foods 5.28 65.55 0.16 0.02
8 Quick Breads and Bread Products 5.20 70.75 0.16 0.02
9 Mixed Dishes - Mexican 4.38 75.13 0.13 0.03
10 Mixed Dishes - Pizza 4.22 79.35 0.13 0.01
11 Cooked Cereals 4.05 83.39 0.12 0.02
12 Cooked Grains 3.95 87.34 0.12 0.01
13 Poultry 3.37 90.71 0.10 0.01
14 Mixed Dishes - Sandwiches 2.79 93.50 0.09 0.01
Contributing less than 2% in descending order: Mixed Dishes - Meat, Poultry, Seafood; Mixed Dishes – Soup;
Snack/Meal Bars; Mixed Dishes – Asian; Sweetened Beverages; Other Desserts; Vegetables, excluding Potatoes;
Seafood; Meats; Dairy Drinks and Substitutes; Condiments and Sauces; White Potatoes; Not included in a food
category; Candy; Plant-based Protein Foods; Cured Meats/Poultry
16

2020 Dietary Guidelines Advisory Committee
Data Supplement: Food Category Sources
https://www.dietaryguidelines.gov/2020-advisory-committee-report/data-analysis
Table 12. Food Sources of Total Protein Foods Among All Toddlers 12-23 Months, 2007-
2016*
Rank Food Subcategory % Cumulative % Mean SE Mean
1 Poultry 26.03 26.03 0.51 0.04
2 Cured Meats/Poultry 17.23 43.26 0.34 0.03
3 Eggs 14.04 57.30 0.27 0.02
4 Mixed Dishes - Meat, Poultry, Seafood 10.34 67.64 0.20 0.03
5 Meats 6.75 74.40 0.13 0.02
6 Plant-based Protein Foods 5.43 79.83 0.11 0.02
7 Mixed Dishes - Sandwiches 3.60 83.43 0.07 0.01
8 Mixed Dishes - Grain-based 3.38 86.82 0.7 0.01
9 Mixed Dishes - Soup 2.63 89.44 0.05 0.01
10 Seafood 2.18 91.62 0.04 0.01
Contributing less than 2% in descending order: Baby Food; Mixed Dishes – Mexican; Mixed Dishes – Asian; Quick
Breads and Bread Products; Mixed Dishes – Pizza; Sweet Bakery Products; Condiments and Sauces; Dairy Drinks
and Substitutes; Crackers; Snack/Meal Bars; Candy; Ready-to-eat Cereals; White Potatoes; Sweetened Beverages;
Breads, Rolls, Tortillas; Vegetables, excluding Potatoes; Cooked Grains; Savory Snacks; Other Desserts; Fats and
Oils; Cooked Cereals; Fruits; Not included in a food category; Sugars
17

2020 Dietary Guidelines Advisory Committee
Data Supplement: Food Category Sources
https://www.dietaryguidelines.gov/2020-advisory-committee-report/data-analysis
Table 13. Food Sources of Total Dairy Among All Toddlers 12-23 Months, 2007-2016*
Rank Food Subcategory % Cumulative % Mean SE Mean
1 Milk 73.37 73.37 1.89 0.06
2 Cheese 7.51 80.88 0.19 0.02
3 Yogurt 3.11 83.99 0.08 0.01
4 Mixed Dishes - Grain-based 2.38 86.36 0.06 0.01
5 Dairy Drinks and Substitutes 2.33 88.70 0.06 0.01
6 Flavored Milk 2.01 90.71 0.05 0.01
Contributing less than 2% in descending order: Mixed Dishes – Pizza; Mixed Dishes – Mexican; Cooked Cereals;
Eggs; Baby Foods; Other Desserts; White Potatoes; Mixed Dishes - Meat, Poultry, Seafood; Mixed Dishes –
Sandwiches; Quick Breads and Bread Products; Not included in a food category; Sweetened Beverages; Sweet
Bakery Products; Protein and nutritional powders; Candy; Mixed Dishes – Soup; Savory Snacks; Crackers;
Vegetables, excluding Potatoes; Breads, Rolls, Tortillas; Snack/Meal Bars; Cured Meats/Poultry; Condiments and
Sauces; Poultry; Ready-to-eat Cereals; Coffee and Tea; Seafood; Plant-based Protein Foods; Sugars; Fats and Oils
18

2020 Dietary Guidelines Advisory Committee
Data Supplement: Food Category Sources
https://www.dietaryguidelines.gov/2020-advisory-committee-report/data-analysis
Table 14. Food Sources of Oils Among All Toddlers 12-23 Months, 2007-2016*
Rank Food Subcategory % Cumulative % Mean SE Mean
1 Savory Snacks 12.116 12.12 1.00 0.09
2 Poultry 10.73 22.84 0.89 0.10
3 Crackers 10.44 33.28 0.86 0.08
4 White Potatoes 9.03 42.31 0.75 0.10
5 Mixed Dishes - Grain-based 8.03 50.34 0.66 0.06
6 Plant-based Protein Foods 7.84 58.18 0.66 0.10
7 Breads, Rolls, Tortillas 4.93 63.10 0.41 0.06
8 Eggs 4.08 67.19 0.34 0.03
9 Fats and Oils 3.71 70.90 0.31 0.05
10 Mixed Dishes - Meat, Poultry, Seafood 3.19 74.09 0.26 0.04
11 Vegetables, excluding Potatoes 2.91 76.99 0.24 0.05
12 Quick Breads and Bread Products 2.89 79.89 0.24 0.04
13 Sweet Bakery Products 2.63 82.51 0.22 0.03
14 Mixed Dishes - Sandwiches 2.56 85.07 0.21 0.04
15 Mixed Dishes - Soup 2.12 87.19 0.18 0.03
Contributing less than 2% in descending order: Mixed Dishes – Pizza; Dairy Drinks and Substitutes; Mixed Dishes –
Mexican; Baby Foods; Condiments and Sauces; Cooked Grains; Snack/Meal Bars; Mixed Dishes – Asian; Seafood;
Ready-to-eat Cereals; Cooked Cereals; Sweetened Beverages; Candy; Meats; Other Desserts; Cured Meats/Poultry;
Fruits; Sugars
19

2020 Dietary Guidelines Advisory Committee
Data Supplement: Food Category Sources
https://www.dietaryguidelines.gov/2020-advisory-committee-report/data-analysis
Table 15. Food Sources of Solid Fats Among All Toddlers 12-23 Months, 2007-2016*
Rank Food Subcategory % Cumulative % Mean SE Mean
1 Milk 43.08 43.08 10.64 0.35
2 Sweet Bakery Products 7.55 50.63 1.86 0.13
3 Cheese 6.68 57.30 1.65 0.17
4 Cured Meats/Poultry 5.6 62.96 1.40 0.19
5 Mixed Dishes - Grain-based 5.16 68.12 1.27 0.13
6 Eggs 4.12 72.23 1.02 0.08
7 Mixed Dishes - Mexican 2.55 74.78 0.63 0.14
8 Mixed Dishes - Pizza 2.47 77.25 0.61 0.07
9 Poultry 2.14 79.39 0.53 0.08
Contributing less than 2% in descending order: Fats and Oils; Mixed Dishes – Sandwiches; Mixed Dishes - Meat,
Poultry, Seafood; Crackers; Quick Breads and Bread Products; Other Desserts; White Potatoes; Yogurt; Flavored
Milk; Mixed Dishes – Soup; Candy; Baby Foods; Vegetables, excluding Potatoes; Meats; Cooked Cereals; Savory
Snacks; Breads, Rolls, Tortillas; Snack/Meal Bars; Plant-based Protein Foods; Condiments and Sauces; Dairy
Drinks and Substitutes; Mixed Dishes - Asian; Sweetened Beverages; Ready-to-eat Cereals; Not included in a food
category; Cooked Grains; Seafood; Sugars; Fruits; Protein and nutritional powders; Coffee and Tea
20

2020 Dietary Guidelines Advisory Committee
Data Supplement: Food Category Sources
https://www.dietaryguidelines.gov/2020-advisory-committee-report/data-analysis
Table 16. Food Sources of Added Sugars Among All Toddlers 12-23 Months, 2007-2016*
Rank Food Subcategory % Cumulative % Mean SE Mean
1 Sweetened Beverages 26.94 26.94 1.61 0.16
2 Sweet Bakery Products 14.96 41.90 0.90 0.06
3 Yogurt 7.24 49.15 0.43 0.05
4 Ready-to-eat Cereals 6.28 55.43 0.38 0.03
5 Candy 5.49 60.91 0.33 0.03
6 Other Desserts 5.13 66.04 0.31 0.04
7 Sugars 3.98 70.02 0.24 0.03
8 Fruits 3.79 73.81 0.23 0.03
9 Flavored Milk 3.01 76.82 0.18 0.04
10 Dairy Drinks and Substitutes 2.89 79.72 0.17 0.03
11 Baby Foods 2.58 82.30 0.15 0.02
12 Coffee and Tea 2.40 84.70 0.14 0.03
13 Snack/Meal Bars 2.13 86.84 0.13 0.02
14 Breads, Rolls, Tortillas 2.09 88.93 0.13 0.01
15 Quick Breads and Bread Products 2.08 91.00 0.12 0.02
Contributing less than 2% in descending order: Cooked Cereals; Crackers; Mixed Dishes - Sandwiches; Mixed
Dishes - Grain-based; Not included in a food category; Plant-based Protein Foods; Condiments and Sauces; Cured
Meats/Poultry; Protein and nutritional powders; Mixed Dishes – Pizza; Flavored or Enhanced Water; Vegetables,
excluding Potatoes; Mixed Dishes – Meat, Poultry, Seafood; Poultry; Savory Snacks; Mixed Dishes – Mexican;
Fats and Oils; Mixed Dishes – Soup; Seafood; Mixed Dishes – Asian; White Potatoes; Meats; Eggs
21

Food Sources of Nutrients Among Infants and
Toddlers
NHANES 2007-16
Acknowledgements:
Prepared by National Cancer Institute, NIH

Food Sources of Nutrients Among Infants and Toddlers, 2007-16
Objective
Methods
Figure
o What We Eat in America Food Categories
Tables
o Footnotes for Tables
o Tables 1-18
Objective
The purpose of this research was to identify the contributions of food categories to nutrient
intake among infants and toddlers.
Methods
We used the 2007-16 National Health and Nutrition Examination Survey data to determine the
weighted population contribution of food categories to intakes of nutrients, including calcium,
potassium, sodium, fiber, vitamin D, iron, zinc, vitamin E, and choline. The dietary intake data
collected in the surveys were categorized by the U.S. Department of Agriculture into
approximately 150 specific What We Eat in America (WWEIA) food categories, including 46
food subcategories, and 15 major food categories (see Figure).
1

Footnotes for All Tables*
Description: All tables include the percent contribution, cumulative percent contribution,
mean, and standard error of the mean.
Format and sample size: For infants, there are three tables for each nutrient: the first
table is for all infants 6-11 months (n=1988), and the second and third tables are stratified
by infant milk source: infants consuming human milk (n=153) and infants consuming any
formula (n=802). For toddlers, there is one table for each nutrient: all toddlers 12-23
months (n=1242).
Food categories: Because of limited sample size, we used the major food categories for
infants 6-11 months and the food subcategories for toddlers 12-23 months.
Exclusions: Human milk and infant formula were excluded from all analyses. Thus,
these analyses include nutrient intake from complementary foods and beverages, not total
nutrient intake.
2

What We Eat in America Food Categories
www.ars.usda.gov/ nea/bhnrc/fsrg
Milk
Milk, whole
MILK AND DAIRY
Cooked Grains
Rice
GRAINS BEVERAGES, NONALCOHOLIC
100% Juice
Citrus juice
Milk, reduced fat
Milk, lowfat
Milk, nonfat
Flavored Milk
Flavored milk, whole
Flavored milk, reduced fat
Flavored milk, lowfat
Flavored milk, nonfat
Dairy Drinks and Substitutes
Milk shakes and other dairy drinks
Milk substitutes
Cheese
Cheese
Cottage/ricotta cheese
Yogurt
Yogurt, regular
Yogurt, Greek
PROTEIN FOODS
Meats
Beef, excludes ground
Ground beef
Pork
Lamb, goat, game
Liver and organ meats
Poultry
Chicken, whole pieces
Chicken patties, nuggets and tenders
Turkey, duck, other poultry
Seafood
Fish
Shellfish
Eggs
Eggs and omelets
Cured Meats/Poultry
Cold cuts and cured meats
Bacon
Frankfurters
Sausages
Plant-based Protein Foods
Beans, peas, legumes
Nuts and seeds
Processed soy products
MIXED DISHES
Mixed Dishes - Meat, Poultry, Seafood
Meat mixed dishes
Poultry mixed dishes
Seafood mixed dishes
Mixed Dishes - Grain-based
Rice mixed dishes
Pasta dishes, excludes macaroni and cheese
Macaroni and cheese
Turnovers and other grain-based items
Mixed Dishes - Asian
Fried rice and lo/chow mein
Stir-fry and soy-based sauce mixtures
Egg rolls, dumplings, sushi
Mixed Dishes - Mexican
Burritos and tacos
Nachos
Other Mexican mixed dishes
Mixed Dishes - Pizza
Pizza
Mixed Dishes - Sandwiches (single code)
Burgers
Chicken/turkey sandwiches
Egg/breakfast sandwiches
Frankfurter sandwiches
Other sandwiches
Mixed Dishes - Soups
Soups
Pasta, noodles, cooked grains
Breads, Rolls, Tortillas
Yeast breads
Rolls and buns
Bagels and English muffins
Tortillas
Quick Breads and Bread Products
Biscuits, muffins, quick breads
Pancakes, waffles, French toast
Ready-to-Eat Cereals
Ready-to-eat cereal, high sugar (>21.2g/100g)
Ready-to-eat cereal, low sugar (:S21.2g/100g)
Cooked Cereals
Oatmeal
Grits and other cooked cereals
SNACKS AND SWEETS
Savory Snacks
Potato chips
Tortilla, corn, other chips
Popcorn
Pretzels/snack mix
Crackers
Crackers, excludes saltines
Saltine crackers
Snack/Meal Bars
Cereal bars
Nutrition bars
Sweet Bakery Products
Cakes and pies
Cookies and brownies
Doughnuts, sweet rolls, pastries
Candy
Candy containing chocolate
Candy not containing chocolate
Other Desserts
Ice cream and frozen dairy desserts
Pudding
Gelatins, ices, sorbets
FRUIT
Fruits
Apples
Bananas
Grapes
Peaches and nectarines
Berries
Citrus fruits
Melons
Dried fruits
Other fruits and fruit salads
VEGETABLES
Vegetables, excluding Potatoes
Tomatoes
Carrots
Other red and orange vegetables
Dark green vegetables, excludes lettuce
Lettuce and lettuce salads
String beans
Onions
Corn
Other starchy vegetables
Other vegetables and combinations
Vegetable mixed dishes
White Potatoes
White potatoes, baked or boiled
French fries and other fried white potatoes
Mashed potatoes and white potato mixtures
Apple juice
Other fruit juice
Vegetable juice
Diet Beverages
Diet soft drinks
Diet sport and energy drinks
Other diet drinks
Sweetened Beverages
Soft drinks
Fruit drinks
Sport and energy drinks
Nutritional beverages
Smoothies and grain drinks
Coffee and Tea
Coffee
Tea
ALCOHOLIC BEVERAGES
Alcoholic Beverages
Beer
Wine
Liquor and cocktails
WATER
Plain Water
Tap water
Bottled water
Flavored or Enhanced Water
Flavored or carbonated water
Enhanced or fortified water
FATS AND OILS
Fats and Oils
Butter and animal fats
Margarine
Cream cheese, sour and whipped cream
Cream and cream substitutes
Mayonnaise
Salad dressings and vegetable oils
CONDIMENTS AND SAUCES
Condiments and Sauces
Tomato-based condiments
Soy-based condiments
Mustard and other condiments
Olives, pickles, pickled vegetables
Pasta sauces, tomato-based
Dips, gravies, other sauces
SUGARS
Sugars
Sugars and honey
Sugar substitutes
Jams, syrups, toppings
INFANT FORMULA & BABY FOOD
Baby Foods
Baby food: cereals
Baby food: fruit
Baby food: vegetable
Baby food: meat and dinners
Baby food: yogurt
Baby food: snacks and sweets
Baby Beverages
Baby juice
Baby water
Infant Formulas
Formula, ready-to-feed
Formula, prepared from powder
Formula, prepared from concentrate
Human Milk
Human milk
OTHER
Protein and nutritional powders
Not included in a food
category 2020 Dietary Guidelines Advisory Committee
Data Supplement: Food Category Sources
https://www.dietaryguidelines.gov/2020-advisory-committee-report/data-analysis
3

Rank Major Food Category % Cumulative % Mean
(mg)
SE Mean
1 Infant Formula & Baby Food 52.23 52.23 125.29 6.47
2 Milk and Dairy 28.03 80.26 67.25 8.15
3 Grains 4.93 85.19 11.82 1.37
4 Mixed Dishes 4.35 89.54 10.43 1.61
5 Beverages, Nonalcoholic 2.45 91.99 5.89 0.97
6 Protein Foods 2.16 94.15 5.18 0.76
Contributing less than 2% in descending order: Vegetables, Snacks and Sweets, Water, Fruit, Condiments and
Sauces, Fats and Oils, Other, Sugars
Table 1a. Food Sources of Calcium Among Infants 6-11 Months Consuming Human Milk,
2007-2016*
Rank Major Food Category % Cumulative % Mean
(mg)
SE Mean
1 Infant Formula & Baby Food 47.03 47.03 76.46 8.01
2 Milk and Dairy 29.66 76.68 48.22 14.47
3 Grains 7.09 83.77 11.52 3.53
4 Vegetables 4.85 88.62 7.88 1.62
5 Protein Foods 2.49 91.11 4.05 1.01
6 Mixed Dishes 2.48 93.59 4.04 1.22
7 Fruit 2.05 95.64 3.33 0.90
Less than 2%: Water; Snacks and Sweets; Beverages, Nonalcoholic; Condiments and Sauces; Sugars; Fats and Oils
Table 1b. Food Sources of Calcium Among Infants 6-11 Months Consuming Formula,
2007-2016*
Rank Major Food Category % Cumulative % Mean
(mg)
SE Mean
1 Infant Formula & Baby Food 62.57 62.57 140.04 7.77
2 Milk and Dairy 17.21 79.78 38.52 5.61
3 Mixed Dishes 5.13 84.91 11.49 1.94
4 Grains 4.75 89.66 10.63 1.33
5 Beverages, Nonalcoholic 2.48 92.14 5.55 0.94
6 Protein Foods 2.12 94.26 4.74 0.86
7 Snacks and Sweets 2.00 96.26 4.48 0.58
Contributing less than 2% in descending order: Vegetables; Water; Fruit; Condiments and Sauces; Fats and Oils;
Other; Sugars
2020 Dietary Guidelines Advisory Committee
Data Supplement: Food Category Sources
https://www.dietaryguidelines.gov/2020-advisory-committee-report/data-analysis
4

Rank Major Food Category % Cumulative % Mean
(mg)
SE Mean
1 Infant Formula & Baby Food 48.26 48.26 280.97 11.97
2 Milk and Dairy 11.18 59.44 65.09 7.86
3 Fruit 9.11 68.55 53.04 5.85
4 vegetables 8.54 77.08 49.70 5.88
5 Mixed Dishes 7.89 84.97 45.93 5.10
6 Protein Foods 5.49 90.46 31.95 4.58
7 Beverages, Nonalcoholic 5.13 95.59 29.85 3.32
8 Grains 2.71 98.30 15.77 1.59
Contributing less than 2% in descending order: Snacks and Sweets; Condiments and Sauces; Sugars; Fats and Oils;
Other; Water
Table 2a. Food Sources of Potassium Among Infants 6-11 Months Consuming Human
Milk, 2007-2016*
Rank Major Food Category % Cumulative % Mean
(mg)
SE Mean
1 Infant Formula & Baby Food 32.35 32.35 145.89 19.76
2 Vegetables 20.86 53.20 94.06 22.20
3 Fruit 17.62 70.82 79.46 14.35
4 Milk and Dairy 8.60 79.42 38.78 13.19
5 Mixed Dishes 6.91 86.33 31.16 10.36
6 Protein Foods 6.02 92.35 27.13 8.09
7 Grains 4.07 96.41 18.35 5.78
Contributing less than 2% in descending order: Snacks and Sweets; Beverages, Nonalcoholic; Condiments and
Sauces; Water; Sugars; Fats and Oils
Table 2b. Food Sources of Potassium Among Infants 6-11 Months Consuming Formula,
2007-2016*
Rank Major Food Category % Cumulative % Mean (mg) SE Mean
1 Infant Formula & Baby Food 56.89 56.89 318.50 12.53
2 Mixed Dishes 8.34 65.23 46.68 5.87
3 Fruit 7.38 72.61 41.30 4.73
5

4 Vegetables 6.64 79.25 37.20 4.21
5 Milk and Dairy 5.83 85.08 32.63 4.16
6 Beverages, Nonalcoholic 5.50 90.58 30.78 3.63
7 Protein Foods 5.29 95.87 29.64 5.09
8 Grains 2.40 98.27 13.44 1.24
Contributing less than 2% in descending order: Snacks and Sweets; Condiments and Sauces; Sugars; Fats and Oils;
Other; Water
6

Table 3. Food Sources of Sodium Among All Infants 6-11 Months, 2007-2016*
Rank Major Food Category % Cumulative % Mean
(mg)
SE Mean
1 Mixed Dishes 27.20 27.20 85.84 9.84
2 Protein Foods 16.22 43.42 51.18 6.51
3 Vegetables 11.99 55.41 37.84 4.47
4 Infant Formula & Baby Food 11.66 67.07 36.80 2.71
5 Grains 11.41 78.48 36.02 3.82
6 Milk and Dairy 10.88 89.36 34.33 4.22
7 Snacks and Sweets 7.26 96.62 22.93 2.14
Contributing less than 2% in descending order: Beverages, Nonalcoholic; Condiments and Sauces; Fats and Oils;
Fruit, Sugars; Other
Table 3a. Food Sources of Sodium Among Infants 6-11 Months Consuming Human Milk,
2007-2016*
Rank Major Food Category % Cumulative % Mean
(mg)
SE Mean
1 Mixed Dishes 23.22 23.22 57.80 18.60
2 Vegetables 22.38 45.59 55.71 15.55
3 Grains 14.29 59.89 35.589 12.01
4 Protein Foods 13.44 73.33 33.46 9.00
5 Milk and Dairy 9.29 82.62 23.12 7.63
6 Infant Formula & Baby Food 7.83 90.45 19.50 4.28
7 Snacks and Sweets 7.362 97.81 18.33 4.23
8 Water 0.75 98.56 1.87 0.41
Contributing less than 2% in descending order: Water; Beverages, Nonalcoholic; Fruit; Condiments and Sauces;
Fats and Oils; Sugars
7

Table 3b. Food Sources of Sodium Among Infants 6-11 Months Consuming Formula, 2007-
2016*
Rank Major Food Category % Cumulative % Mean
(mg)
SE Mean
1 Mixed Dishes 28.98 28.99 86.46 10.72
2 Protein Foods 16.36 45.35 48.81 7.08
3 Infant Formula & Baby Food 13.89 59.24 41.42 3.15
4 Vegetables 10.74 69.98 32.03 3.60
5 Grains 10.73 80.70 32.00 3.33
6 Milk and Dairy 8.02 88.73 23.93 3.91
7 Snacks and Sweets 7.51 96.24 22.40 2.23
Contributing less than 2% in descending order: Beverages, Nonalcoholic; Condiments and Sauces; Water;
Fats and Oils; Fruit; Sugars; Other
8

Table 4. Food Sources of Fiber Among All Infants 6-11 Months, 2007-2016*
Rank Major Food Category % Cumulative % Mean (g) SE Mean
1 Infant Formula & Baby Food 55.57 55.57 2.61 0.12
2 Fruit 11.07 66.63 0.52 0.06
3 Vegetables 10.87 77.50 0.51 0.07
4 Mixed Dishes 7.24 84.75 0.34 0.04
5 Grains 6.81 91.56 0.32 0.03
6 Protein Foods 4.26 95.82 0.20 0.06
7 Snacks and Sweets 2.43 98.24 0.11 0.02
Contributing less than 2% in descending order: Beverages, Nonalcoholic; Milk and Dairy; Condiments and Sauces;
Sugars; Other; Water; Fats and Oils
Table 4a. Food Sources of Fiber Among Infants 6-11 Months Consuming Human Milk,
2007-2016*
Rank Major Food Category % Cumulative % Mean (g) SE Mean
1 Infant Formula & Baby Food 31.18 31.18 1.34 0.19
2 Vegetables 26.42 57.60 1.14 0.31
3 Fruit 18.94 76.54 0.82 0.16
4 Grains 8.70 85.24 0.38 0.12
5 Protein Foods 6.99 92.23 0.30 0.16
6 Mixed Dishes 4.24 96.47 0.18 0.05
7 Snacks and Sweets 2.40 98.879 0.10 0.03
Contributing less than 2% in descending order: Beverages, Nonalcoholic; Milk and Dairy; Condiments and Sauces;
Water; Fats and Oils; Sugars
9

Table 4b. Food Sources of Fiber Among Infants 6-11 Months Consuming Formula, 2007-
2016*
Rank Major Food Category % Cumulative % Mean (g) SE Mean
1 Infant Formula & Baby Food 63.44 63.44 2.96 0.13
2 Fruit 8.44 71.88 0.39 0.04
3 Mixed Dishes 7.48 79.36 0.35 0.04
4 Vegetables 7.29 86.65 0.34 0.04
5 Grains 5.71 92.35 0.267 0.03
6 Protein Foods 3.66 96.01 0.17 0.06
7 Snacks and Sweets 2.288 98.30 0.11 0.01
Contributing less than 2% in descending order: Beverages, Nonalcoholic; Milk and Dairy; Condiments and Sauces;
Sugars; Other; Water; Fats and Oils
Table 5. Food Sources of Vitamin D Among All Infants 6-11 Months, 2007-2016*
Rank Major Food Category % Cumulative % Mean
(mcg)
SE Mean
1 Milk and Dairy 48.46 48.46 0.53 0.08
2 Infant Formula & Baby Food 34.73 83.19 0.38 0.06
3 Protein Foods 7.95 91.14 0.09 0.01
4 Grains 5.01 96.15 0.05 0.01
5 Mixed Dishes 2.44 98.59 0.03 0.01
Contributing less than 2% in descending order: Beverages, Nonalcoholic; Vegetables; Snacks and Sweets; Fats and
Oils; Condiments and Sauces; Other; Fruit; Water; Sugars
10

Table 5a. Food Sources of Vitamin D Among Infants 6-11 Months Consuming Human
Milk, 2007-2016*
Rank Major Food Category % Cumulative % Mean
(mcg)
SE Mean
1 Infant Formula & Baby Food 37.79 37.79 0.22 0.06
2 Milk and Dairy 36.80 74.58 0.22 0.08
3 Grains 11.25 85.83 0.07 0.02
4 Protein Foods 10.11 95.95 0.06 0.03
5 Mixed Dishes 1.69 97.64 0.01 0.00
Contributing less than 2% in descending order: Beverages, Nonalcoholic; Vegetables; Snacks and Sweets;
Condiments and Sauces; Fruit; Water; Fats and Oils; Sugars
Table 5b. Food Sources of Vitamin D Among Infants 6-11 Months Consuming Formula,
2007-2016*
Rank Major Food Category % Cumulative % Mean
(mcg)
SE Mean
1 Infant Formula & Baby Food 50.93 50.93 0.43 0.07
2 Milk and Dairy 28.63 79.56 0.24 0.04
3 Protein Foods 9.90 89.46 0.08 0.01
4 Grains 5.31 94.77 0.04 0.01
5 Mixed Dishes 3.45 98.21 0.03 0.01
Contributing less than 2% in descending order: Beverages, Nonalcoholic; Vegetables; Snacks and Sweets; Fats and
Oils; Condiments and Sauces; Other; Fruit; Water; Sugars
11

Table 6. Food Sources of Iron Among All Infants 6-11 Months, 2007-2016*
Rank Major Food Category % Cumulative % Mean
(mg)
SE Mean
1 Infant Formula & Baby Food 82.69 82.69 6.70 0.36
2 Grains 7.12 89.81 0.58 0.07
3 Mixed Dishes 3.34 93.15 0.27 0.03
4 Protein Foods 2.238 95.39 0.18 0.03
Contributing less than 2% in descending order: Snacks and Sweets; Vegetables; Fruit; Milk and Dairy; Beverages,
Nonalcoholic; Condiments and Sauces; Sugars; Other; Fats and Oils; Water
Table 6a. Food Sources of Iron Among Infants 6-11 Months Consuming Human Milk,
2007-2016*
Rank Major Food Category % Cumulative % Mean
(mg)
SE Mean
1 Infant Formula & Baby Food 73.84 73.84 4.28 0.48
2 Grains 12.18 86.02 0.71 0.23
3 Vegetables 3.58 89.60 0.21 0.05
4 Protein Foods 3.25 92.86 0.19 0.07
5 Mixed Dishes 2.83 95.69 0.164 0.06
Contributing less than 2% in descending order: Snacks and Sweets; Fruit; Milk and Dairy; Beverages, Nonalcoholic;
Condiments and Sauces; Sugars; Water; Fats and Oils
Table 6b. Food Sources of Iron Among Infants 6-11 Months Consuming Formula, 2007-
2016*
Rank Major Food Category % Cumulative % Mean
(mg)
SE Mean
1 Infant Formula & Baby Food 86.12 86.12 7.44 0.43
2 Grains 5.28 91.40 0.46 0.05
3 Mixed Dishes 3.16 94.55 0.27 0.03
Contributing less than 2% in descending order: Protein Foods; Snacks and Sweets; Vegetables; Fruit; Beverages,
Nonalcoholic; Milk and Dairy; Condiments and Sauces; Sugars; Other; Fats and Oils; Water
12

Table 7. Food Sources of Zinc Among All Infants 6-11 Months, 2007-2016*
Rank Major Food Category % Cumulative % Mean
(mg)
SE
Mean
1 Infant Formula & Baby Food 55.09 55.09 1.28 0.09
2 Grains 10.61 65.70 0.25 0.04
3 Milk and Dairy 10.55 76.25 0.25 0.03
4 Mixed Dishes 9.05 85.30 0.21 0.03
5 Protein Foods 8.20 93.51 0.19 0.03
6 Vegetables 2.87 96.38 0.07 0.01
Contributing less than 2% in descending order: Snacks and Sweets; Fruit; Beverages, Nonalcoholic; Water;
Condiments and Sauces; Other; Sugars; fats and oil
Table 7a. Food Sources of Zinc Among Infants 6-11 Months Consuming Human Milk, 2007-
2016*
Rank Major Food Category % Cumulative % Mean
(mg)
SE Mean
1 Infant Formula & Baby Food 47.01 47.01 0.89 0.15
2 Grains 16.30 63.32 0.31 0.11
3 Milk and Dairy 10.19 73.50 0.19 0.06
4 Mixed Dishes 8.70 82.20 0.16 0.06
5 Vegetables 7.00 89.20 0.13 0.03
6 Protein Foods 6.51 95.71 0.12 0.04
7 Fruit 2.17 97.87 0.04 0.01
Contributing less than 2% in descending order: Snacks and Sweets; Beverages, Nonalcoholic; Water; Condiments
and Sauces; Sugars; Fats and Oils
Table 7b. Food Sources of Zinc Among Infants 6-11 Months Consuming Formula, 2007- 2016*
Rank Major Food Category % Cumulative % Mean
(mg)
SE Mean
1 Infant Formula & Baby Food 62.82 62.82 1.40 0.11
2 Mixed Dishes 9.11 71.94 0.20 0.03
3 Grains 8.19 80.12 0.18 0.02
4 Protein Foods 7.69 87.81 0.17 0.03
5 Milk and Dairy 6.54 94.36 0.15 0.02
6 Vegetables 2.19 96.55 0.05 0.01
Contributing less than 2% in descending order: Snacks and Sweets; Fruit; Beverages, Nonalcoholic; Water;
Condiments and Sauces; Sugars; Fats and Oils; Other
13

Table 8. Food Sources of Vitamin E Among All Infants 6-11 Months, 2007-2016*
Rank Major Food Category % Cumulative % Mean
(mg)
SE Mean
1 Infant Formula & Baby Food 65.60 65.60 1.31 0.06
2 Mixed Dishes 7.81 73.41 0.16 0.02
3 Vegetables 5.98 79.38 0.12 0.02
4 Protein Foods 5.02 84.40 0.10 0.02
5 Milk and Dairy 4.61 89.01 0.09 0.05
6 Snacks and Sweets 3.73 92.75 0.07 0.01
7 Fruit 3.14 95.89 0.06 0.01
8 Grains 2.12 98.00 0.04 0.01
Contributing less than 2% in descending order: Beverages, Nonalcoholic; Fats and Oils; Water; Condiments and
Sauces; Sugars; Other
Table 8a. Food Sources of Vitamin E Among Infants 6-11 Months Consuming Human
Milk, 2007-2016*
Rank Major Food Category % Cumulative
%
Mean
(mg)
SE Mean
1 Infant Formula & Baby Food 50.24 50.24 0.80 0.08
2 Vegetables 18.01 68.25 0.29 0.08
3 Milk and Dairy 7.16 75.41 0.11 0.10
4 Fruit 7.09 82.50 0.11 0.02
5 Mixed Dishes 5.48 87.98 0.09 0.03
6 Protein Foods 5.30 93.27 0.08 0.03
7 Snacks and Sweets 3.06 96.33 0.05 0.02
8 Grains 2.77 99.10 0.04 0.01
Contributing less than 2% in descending order: Beverages, Nonalcoholic; Condiments and Sauces; Fats and Oils;
Sugars; Water
14

Table 8b. Food Sources of Vitamin E Among Infants 6-11 Months Consuming Formula, 2007-
2016*
Rank Major Food Category % Cumulative % Mean
(mg)
SE Mean
1 Infant Formula & Baby Food 71.09 71.09 1.47 0.07
2 Mixed Dishes 7.64 78.76 0.16 0.02
3 Protein Foods 4.53 83.29 0.09 0.02
4 Snacks and Sweets 3.76 87.05 0.08 0.01
5 Vegetables 3.70 90.75 0.08 0.01
6 Milk and Dairy 3.48 94.23 0.07 0.06
7 Fruit 2.23 96.46 0.05 0.01
Contributing less than 2% in descending order: Grains; Beverages, Nonalcoholic; Water; Fats and Oils;
Condiments and Sauces; Sugars; Other
15

Table 9. Food Sources of Choline Among All Infants 6-11 Months, 2007-2016*
Rank Major Food Category % Cumulative % Mean
(mg)
SE Mean
1 Infant Formula & Baby Food 34.88 34.88 16.55 0.81
2 Protein Foods 25.00 59.88 11.86 1.65
3 Milk and Dairy 14.45 74.32 6.86 0.86
4 Mixed Dishes 10.07 84.40 4.78 0.58
5 Vegetables 5.82 90.22 2.76 0.29
6 Fruit 3.47 93.69 1.65 0.18
7 Grains 3.13 96.81 1.48 0.17
Contributing less than 2% in descending order: Snacks and Sweets; Beverages, Nonalcoholic; Condiments and
Sauces; Fats and Oils; Sugars; Other; Water
Table 9a. Food Sources of Choline Among Infants 6-11 Months Consuming Human Milk,
2007-2016*
Rank Major Food Category % Cumulative % Mean
(mg)
SE Mean
1 Infant Formula & Baby Food 25.72 25.72 8.71 1.30
2 Protein Foods 24.24 49.96 8.21 3.10
3 Vegetables 13.79 63.75 4.67 1.05
4 Mixed Dishes 10.40 74.15 3.52 1.09
5 Milk and Dairy 10.31 84.46 3.49 1.19
6 Fruit 7.56 92.02 2.56 0.46
7 Grains 5.32 97.34 1.80 0.61
Contributing less than 2% in descending order: Snacks and Sweets; Beverages, Nonalcoholic; Condiments and
Sauces; Fats and Oils; Sugars; Water
16
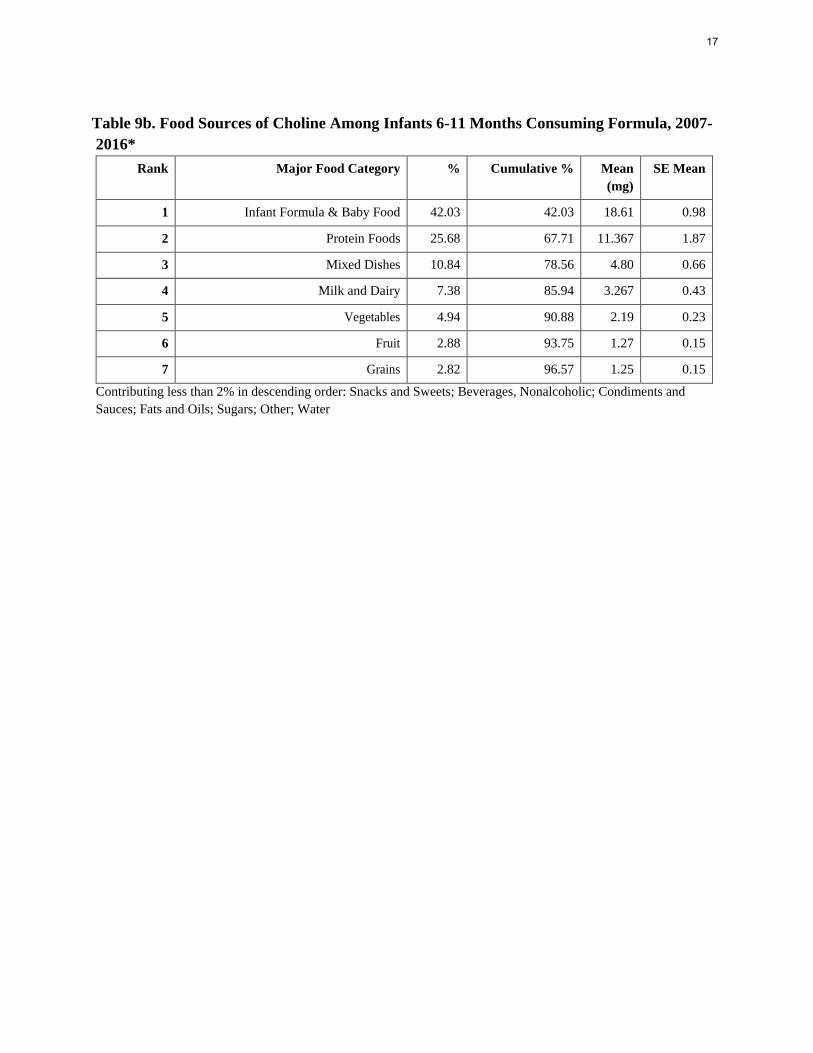
Table 9b. Food Sources of Choline Among Infants 6-11 Months Consuming Formula, 2007-
2016*
Rank Major Food Category % Cumulative % Mean
(mg)
SE Mean
1 Infant Formula & Baby Food 42.03 42.03 18.61 0.98
2 Protein Foods 25.68 67.71 11.367 1.87
3 Mixed Dishes 10.84 78.56 4.80 0.66
4 Milk and Dairy 7.38 85.94 3.267 0.43
5 Vegetables 4.94 90.88 2.19 0.23
6 Fruit 2.88 93.75 1.27 0.15
7 Grains 2.82 96.57 1.25 0.15
Contributing less than 2% in descending order: Snacks and Sweets; Beverages, Nonalcoholic; Condiments and
Sauces; Fats and Oils; Sugars; Other; Water
17

Table 10. Food Sources of Calcium Among All Toddlers 12-23 Months, 2007-2016*
Rank Food Subcategory % Cumulative % Mean
(mg)
SE Mean
1 Milk 53.89 53.89 527.92 16.05
2 Cheese 6.51 60.39 63.73 6.67
3 100% Juice 3.51 63.90 34.41 3.00
4 Yogurt 3.37 67.27 32.99 3.30
5 Baby Foods 2.88 70.15 28.23 2.39
6 Dairy Drinks and Substitutes 2.83 72.98 27.73 5.17
7 Mixed Dishes - Grain-based 2.82 75.80 27.63 3.51
Contributing less than 2% in descending order: Ready-to-eat Cereals; Breads, Rolls, Tortillas; Cooked Cereals;
Flavored Milk; Mixed Dishes – Mexican; Eggs; Plain Water; Mixed Dishes – Pizza; Quick Breads; Fruits; Mixed
Dishes - Sandwiches; Vegetables, excluding Potatoes; Sweetened Beverages; Mixed Dishes - Meat, Poultry,
Seafood; Other Desserts; Sweet Bakery Products; White Potatoes; Crackers; Snack/Meal Bars; Plant-based Protein
Foods; Mixed Dishes – Soup; Savory Snacks; Cured Meats/Poultry; Poultry; Baby Beverages; Not included in a
food category; Candy; Condiments and Sauces; Cooked Grains; Diet Beverages; Meats; Protein and nutritional
powders; Fats and Oils; Mixed Dishes – Asian; Seafoods; Sugars; Coffee and Tea; Flavored or Enhanced Water
18

Table 11. Food Sources of Potassium Among All Toddlers 12-23 Months, 2007-2016*
Rank Food Subcategory % Cumulative % Mean
(mg)
SE Mean
1 Milk 34.80 34.80 618.95 18.72
2 Fruits 9.77 44.57 173.83 8.50
3 100% Juice 8.41 52.98 149.51 9.80
4 Mixed Dishes - Grain-based 3.59 56.57 63.91 4.91
5 Vegetables, excluding Potatoes 3.22 59.79 57.23 4.29
6 White Potatoes 3.19 62.98 56.78 5.04
7 Poultry 2.93 65.92 52.15 4.08
8 Baby Foods 2.84 68.75 50.42 4.74
9 Yogurt 2.41 71.16 42.86 4.29
10 Mixed Dishes - Meat, Poultry, Seafood 2.22 73.38 39.45 5.16
11 Sweetened Beverages 2.16 75.54 38.42 4.66
12 Cured Meats/Poultry 2.03 77.57 36.16 3.55
Contributing less than 2% in descending order: Plant-based Protein Foods; Mixed Dishes – Soup; Eggs; Ready-to-
eat Cereals; Savory Snacks; Breads, Rolls, Tortillas; Dairy Drinks and Substitutes; Cooked Cereals; Flavored Milk;
Sweet Bakery Products; Meats; Mixed Dishes – Pizza; Cheese; Mixed Dishes – Mexican; Mixed Dishes –
Sandwiches; Other Desserts; Baby Beverages; Quick Breads and Bread Products; Crackers; Condiments and Sauces;
Candy; Snack/Meal Bars; Mixed Dishes – Asian; Cooked Grains; Seafood; Not included in a food category; Coffee
and Tea; Protein and nutritional powders; Sugars; Fats and Oils; Diet Beverages; Flavored or Enhanced Water
19

Table 12. Food Sources of Sodium Among All Toddlers 12-23 Months, 2007-2016*
Rank Food Subcategory % Cumulative % Mean
(mg)
SE Mean
1 Milk 12.74 12.74 201.53 6.12
2 Mixed Dishes - Grain-based 8.69 21.43 137.44 9.60
3 Cured Meats/Poultry 7.18 28.61 113.49 11.44
4 Poultry 6.42 35.03 101.55 7.82
5 Breads, Rolls, Tortillas 4.62 39.65 73.04 4.69
6 Cheese 4.52 44.17 71.53 7.97
7 Mixed Dishes - Soup 4.42 48.59 69.88 8.37
8 Mixed Dishes - Meat, Poultry, Seafood 4.36 52.95 68.92 9.07
9 Eggs 3.84 56.79 60.77 4.67
10 Vegetables, excluding Potatoes 3.50 60.29 55.36 4.03
11 Crackers 3.40 63.70 53.83 4.22
12 Sweet Bakery Products 3.00 66.70 47.42 2.77
13 Mixed Dishes - Pizza 2.88 69.57 45.48 5.17
14 White Potatoes 2.64 72.22 41.82 4.46
15 Mixed Dishes - Mexican 2.60 74.82 41.12 7.85
16 Quick Breads and Bread Products 2.47 77.28 38.99 4.40
17 Ready-to-eat Cereals 2.45 79.73 38.70 2.81
18 Savory Snacks 2.44 82.17 38.58 4.08
19 Mixed Dishes – Sandwiches 2.20 84.38 34.92 6.05
Contributing less than 2% in descending order: Cooked Cereals; Plant-based Protein Foods; Cooked Grains;
Condiments and Sauces; Baby Foods; Sweetened Beverages; Meats; Yogurt; Dairy Drinks and Substitutes; Mixed
Dishes – Asian; Fats and Oils; Candy; Plain Water; 100% Juice; Other Desserts; Flavored Milk; Seafood;
Snack/Meal Bars; Fruits; Not included in a food category; Baby Beverages; Protein and nutritional powders; Sugars;
Diet Beverages; Coffee and Tea; Flavored or Enhanced Water
20

Table 13. Food Sources of Fiber Among All Toddlers 12-23 Months, 2007-2016*
Rank Food Subcategory % Cumulative % Mean
(g)
SE Mean
1 Fruits 21.39 21.39 1.83 0.10
2 Vegetables, excluding Potatoes 8.51 29.90 0.73 0.05
3 Mixed Dishes - Grain-based 7.71 37.61 0.66 0.05
4 Breads, Rolls, Tortillas 6.66 44.27 0.57 0.03
5 Ready-to-eat Cereals 6.33 50.61 0.54 0.05
6 Plant-based Protein Foods 6.33 56.93 0.54 0.07
7 Baby Foods 6.07 63.00 0.52 0.05
8 White Potatoes 3.65 66.65 0.31 0.03
9 Cooked Cereals 3.63 70.29 0.31 0.04
10 100% Juice 3.32 73.61 0.28 0.02
11 Sweet Bakery Products 2.98 76.59 0.26 0.02
12 Savory Snacks 2.51 79.10 0.21 0.02
13 Mixed Dishes - Meat, Poultry, Seafood 2.25 81.35 0.19 0.03
14 Mixed Dishes - Mexican 2.08 83.43 0.18 0.03
Contributing less than 2% in descending order: Crackers; Mixed Dishes – Pizza; Mixed Dishes – Soup; Quick
Breads and Bread Products; Poultry; Mixed Dishes – Sandwiches; Cooked Grains; Snack/Meal Bars; Sweetened
Beverages; Condiments and Sauces; Dairy Drinks and Substitutes; Flavored Milk; Other Desserts; Mixed Dishes –
Asian; Yogurt; Candy; Sugars; Baby Beverages; Seafood; Not included in a food category; Eggs; Cured
Meats/Poultry; Meats; Coffee and Tea; Protein and nutritional powders; Fats and Oils; Cheese
21

Table 14. Food Sources of Vitamin D Among All Toddlers 12-23 Months, 2007-2016*
Rank Food Subcategory % Cumulative % Mean
(mcg)
SE Mean
1 Milk 76.15 76.15 5.90 0.18
2 Eggs 3.68 79.84 0.29 0.02
3 Ready-to-eat Cereals 3.04 82.87 0.24 0.02
4 Dairy Drinks and Substitutes 2.67 85.54 0.21 0.04
5 Yogurt 2.12 87.66 0.16 0.02
6 12: Flavored Milk 2.08 89.74 0.16 0.03
Contributing less than 2% in descending order: Cheese; Mixed Dishes - Grain-based; Cured Meats/Poultry; Cooked
Cereals; 100% Juice; Baby Foods; Baby Foods; Mixed Dishes - Meat, Poultry, Seafood; Seafood; Poultry; Mixed
Dishes – Sandwiches; White Potatoes; Sweetened Beverages; Quick Breads and Bread Products ; Not included in a
food category; Mixed Dishes – Soup; Meats; Mixed Dishes – Mexican; Sweet Bakery Products; Fats and Oils; Other
Desserts; Vegetables, excluding Potatoes; Snack/Meal Bars; Mixed Dishes – Asian; Breads, Rolls, Tortillas;
Condiments and Sauces; Mixed Dishes - Pizza; Cooked Grains; Plant-based Protein Foods; Savory Snacks; Coffee
and Tea
22

Table 15. Food Sources of Iron Among All Toddlers 12-23 Months, 2007-2016*
Rank Food Subcategory % Cumulative % Mean
(mg)
SE Mean
1 Ready-to-eat Cereals 20.85 20.85 1.82 0.15
2 Baby Foods 13.84 34.69 1.21 0.12
3 Cooked Cereals 6.56 41.25 0.57 0.08
4 Mixed Dishes - Grain-based 5.70 46.95 0.50 0.03
5 Breads, Rolls, Tortillas 5.49 52.44 0.48 0.03
6 Sweet Bakery Products 4.86 57.30 0.42 0.03
7 Crackers 3.04 60.33 0.26 0.02
8 Fruits 2.73 63.06 0.24 0.01
9 Eggs 2.71 65.77 0.24 0.02
10 Quick Breads and Bread Products 2.46 68.23 0.21 0.03
11 Mixed Dishes - Meat, Poultry, Seafood 2.44 70.67 0.21 0.03
12 Plant-based Protein Foods 2.24 72.91 0.19 0.03
13 Vegetables, excluding Potatoes 2.16 75.07 0.19 0.01
14 100% Juice 2.10 77.18 0.18 0.01
Contributing less than 2% in descending order: Poultry; Mixed Dishes – Pizza; Mixed Dishes – Soup; Mixed Dishes
– Mexican; Milk; Savory Snacks; Mixed Dishes – Sandwiches; Cured Meats/Poultry; Cooked Grains; Sweetened
Beverages; White Potatoes; Snack/Meal Bars; Meats; Dairy Drinks and Substitutes; Baby Beverages; Cheese;
Condiments and Sauces; Candy; Other Desserts; Mixed Dishes – Asian; Protein and nutritional powders; Not
included in a food category; Flavored Milk; Yogurt; Seafood; Coffee and Tea; sugars; Fats and Oils; Diet
Beverages; Flavored or Enhanced Water
23

Table 16. Food Sources of Zinc Among All Toddlers 12-23 Months, 2007-2016*
Rank Food Subcategory % Cumulative % Mean
(mg)
SE Mean
1 Milk 27.30 27.30 1.80 0.06
2 Ready-to-eat Cereals 12.72 40.04 0.84 0.06
3 Baby Foods 4.92 44.95 0.32 0.05
4 Mixed Dishes - Grain-based 4.65 49.60 0.31 0.02
5 Mixed Dishes - Meat, Poultry, Seafood 3.88 53.48 0.26 0.04
6 Cheese 3.57 57.05 0.24 0.03
7 Poultry 3.26 60.31 0.21 0.02
8 Cured Meats/Poultry 3.18 63.49 0.21 0.02
9 Eggs 3.08 66.57 0.20 0.02
10 Meats 2.88 69.45 0.19 0.02
11 Breads, Rolls, Tortillas 2.49 71.94 0.16 0.01
12 Yogurt 2.43 74.37 0.16 0.02
13 Plant-based Protein Foods 2.06 76.43 0.14 0.02
Contributing less than 2% in descending order: Cooked Cereals; Fruits; Mixed Dishes – Pizza; Mixed Dishes –
Mexican: Vegetables, excluding Potatoes; Mixed Dishes – Sandwiches; Mixed Dishes – Soup; Sweet Bakery
Products; Flavored Milk; Savory Snacks; White Potatoes; Dairy Drinks and Substitutes; Cheese; Crackers; 100%
Juice; Snack/Meal Bars; Cooked Grains; Sweetened Beverages; Quick Breads and Bread Products; Other Desserts;
Condiments and Sauces; Mixed Dishes – Asian; Protein and nutritional powders; Not included in a food category;
Candy; Baby Beverages; Plain Water; Seafood; Sugars; Coffee and Tea; Fats and Oils; Flavored or Enhanced
Water; Diet Beverages
24

Table 17. Food Sources of Vitamin E Among All Toddlers 12-23 Months, 2007-2016*
Rank Food Subcategory % Cumulative % Mean
(mg)
SE Mean
1 Mixed Dishes - Grain-based 9.05 9.05 0.33 0.03
2 Milk 7.59 16.64 0.27 0.01
3 Baby Foods 6.30 22.94 0.23 0.02
4 Fruits 5.73 28.68 0.21 0.01
5 Plant-based Protein Foods 5.36 34.04 0.20 0.03
6 Savory Snacks 5.12 39.16 0.19 0.02
7 Eggs 5.09 44.25 0.19 0.01
8 Poultry 4.48 48.74 0.16 0.01
9 Vegetables, excluding Potatoes 4.34 53.08 0.16 0.01
10 Sweet Bakery Products 4.27 57.35 0.16 0.01
11 Crackers 4.08 61.43 0.15 0.01
12 Dairy Drinks and Substitutes 3.82 65.25 0.14 0.01
13 Mixed Dishes – Meat, Poultry, Seafood 3.05 68.30 0.11 0.01
14 Sweetened Beverages 3.02 71.33 0.11 0.04
15 Ready-to-eat Cereals 2.90 74.23 0.11 0.01
16 White Potatoes 2.56 76.79 0.09 0.02
17 Mixed Dishes – Soup 2.05 78.83 0.07 0.01
18 100% Juice 2.03 80.86 0.07 0.01
Contributing less than 2% in descending order: Mixed Dishes – Pizza; Breads, Rolls, Tortillas; Quick Breads and
Bread Products; Fats and Oils; Mixed Dishes – Sandwiches; Mixed Dishes – Mexican; Condiments and Sauces;
Cheese; Cured Meats/Poultry; Cooked Cereal; Seafood: Baby Beverages; Snack/Meal Bars; Protein and nutritional
powders; Candy; Cooked Grains; Mixed Dishes – Asian; Other Desserts; Not included in a food category; Meats:
Flavored or Enhanced Water; Yogurt; Flavored Milk; Sugars; Diet Beverages: Coffee and Tea
25

fffkkkkkk
Table 18. Food Sources of Choline Among All Toddlers 12-23 Months, 2007-2016*
Rank Food Subcategory % Cumulative % Mean
(mg)
SE Mean
1 Milk 34.81 34.81 68.038 2.07
2 Eggs 16.44 51.25 32.13 2.58
3 Poultry 5.22 56.47 10.21 0.83
4 Mixed Dishes – Meat, Poultry, Seafood 3.30 59.78 6.46 0.84
5 Cured Meats/Poultry 3.13 62.91 6.13 0.61
6 Mixed Dishes - Grain-based 3.09 66.00 6.03 0.41
7 Fruits 2.86 68.86 5.58 0.26
8 Vegetables, excluding Potatoes 2.34 71.20 4.58 0.32
Less than 2%: Baby Foods; Meats; 100% Juice; Dairy Drinks and Substitutes; Yogurt; Plant-based Protein Foods;
Mixed Dishes – Soup; White Potatoes; Quick Breads and Bread Products; Sweet Bakery Products; Breads, Rolls,
Tortillas; Mixed Dishes – Sandwiches; Cooked Cereals; Cheese; Flavored Milk; Mixed Dishes – Pizza; Ready-to-
eat Cereals; Mixed Dishes – Mexican; Other Desserts; Sweetened Beverages; Savory Snacks; Seafood; Crackers;
Mixed Dishes – Asian; Snack/Meal Bars; Condiments and Sauces; Candy; Cooked Grains; Not included in a food
category; Protein and nutritional powders; Baby Beverages; Fats and Oils; Sugars; Coffee and Tea; Diet Beverages
26