da young oh nih public access 1,* evelyn walenta1 taro e ... · 5 lipomics technologies, inc., west...
TRANSCRIPT

A Gpr120 Selective Agonist Improves Insulin Resistance andChronic Inflammation
Da Young Oh1,*, Evelyn Walenta1, Taro E. Akiyama2, William S. Lagakos1, Denise Lackey1,Ariane R. Pessentheiner1,3, Roman Sasik1, Nasun Hah4, Tyler J. Chi1, Jason M. Cox2, MaryAnn Powels2, Jerry Di Salvo2, Christopher Sinz2, Steven M. Watkins5, Aaron M. Armando6,Heekyung Chung1, Ronald M. Evans4,7, Oswald Quehenberger1,6, Joanne McNelis1,Juliane G. Bogner-Strauss3, and Jerrold M. Olefsky1,*
1 Division of Endocrinology and Metabolism, Department of Medicine, University of California,San Diego, La Jolla, CA 92093, USA
2 Merck Research Laboratories, Kenilworth, NJ 07033, USA
3 Institute of Biochemistry, Graz University of Technology, Petersgasse 12 A-8010 Graz, Austria
4 Gene Expression Laboratory, Salk Institute for Biological Studies, La Jolla, CA 92037, USA
5 Lipomics Technologies, Inc., West Sacramento, CA 95691, USA
6 Department of Pharmacology, University of California, San Diego, La Jolla, CA 92093, USA
7 Howard Hughes Medical Institute, Salk Institute for Biological Studies, La Jolla, CA 92037, USA
It is well known that the omega-3 fatty acids (ω3-FAs) contained in fish oils can exert potent
anti-inflammatory effects 1-4. ω3-FAs are commonly consumed as fish products, dietary
supplements, and pharmaceuticals and a number of health benefits have been ascribed to
them, including a reduction in plasma triglyceride levels, amelioration of atherosclerosis,
and increased insulin sensitivity 5-7. We reported that Gpr120 is the functional receptor/
sensor for these fatty acids and that ω3-FAs produce robust anti-inflammatory, insulin
sensitizing effects, both in vivo and in vitro in a Gpr120-dependent manner 8. Indeed, human
genetic variants in the Gpr120 gene had been described which predispose to obesity and
diabetes 9. However, the amount of fish oils which would have to be consumed to sustain
chronic agonism of Gpr120 is too high to be practical, and, thus, a high affinity, small
molecule Gpr120 agonist would be of potential clinical benefit. Accordingly, Gpr120 is a
widely studied drug discovery target within the pharmaceutical industry. Gpr40 is another
lipid sensing GPCR 10, and it has been difficult to identify compounds with a high degree of
* To whom correspondence should be addressed; Da Young Oh, PhD ([email protected]) and Jerrold M. Olefsky, MD([email protected]) Division of Endocrinology & Metabolism, Department of Medicine, University of California, San Diego, 9500Gilman Drive, La Jolla, CA, 92093, USA. Phone: 858-822-6647 Fax: 858-534-6653.
Author contributionsD.Y.O. designed the studies and performed the experiments; R.S. carried out RNA-seq data analysis; D.Y.O. and J.M.O. analyzed,interpreted data, and co–wrote the manuscript. All other authors performed experiments and contributed to discussions. This work wassupported by grants to J.M.O. and D.Y.O. as detailed above.
Competing financial interestsThe authors declare no competing financial interests.
NIH Public AccessAuthor ManuscriptNat Med. Author manuscript; available in PMC 2015 February 01.
Published in final edited form as:Nat Med. 2014 August ; 20(8): 942–947. doi:10.1038/nm.3614.
NIH
-PA
Author M
anuscriptN
IH-P
A A
uthor Manuscript
NIH
-PA
Author M
anuscript

selectivity for Gpr120 vs. Gpr40 11. Here we report that a high affinity, selective, small
molecule Gpr120 agonist (cpdA), exerts potent anti-inflammatory effects on macrophages in
vitro, and in obese mice in vivo. Gpr120 agonist treatment of high fat diet (HFD)/obese mice
causes improved glucose tolerance, decreased hyperinsulinemia, increased insulin sensitivity
and decreased hepatic steatosis. This suggests that Gpr120 agonists could become new
insulin sensitizing drugs for the treatment of Type 2 diabetes and other human insulin
resistant states in the future.
Gpr120 and Gpr40 are 2 lipid sensing G protein-coupled receptors (GPCRs) 10,12, but
despite limited homology between these two polyunsaturated fatty acid (PUFA) receptors,
identification of ligands that are highly selective for Gpr120 over Gpr40 has been
challenging 11,13-15. We have generated a small molecule Gpr120 agonist, compound A
(cpdA) (Fig. 1a), and have examined its selectivity for Gpr120 compared to Gpr40 using a
Ca2+ FLIPR assay (Fig. 1b). CpdA was fully selective for Gpr120 (logEC50 (M) = −7.62 ±
0.11) with negligible activity towards Gpr40 (Fig. 1b). Gpr120 couples to Gαq/11-initiated
signal transduction pathways, and, as such, we assessed the activity of cpdA in an inositol-1,
4, 5-triphosphate (IP3) production assay, employing HEK 293 cells that stably express
human or mouse Gpr120. The Gpr120 agonist produced concentration dependent increases
in IP3 production from both human and mouse Gpr120 expressing cells (Fig. 1c). In addition
to promoting signaling via Gαq/11, Gpr120 also directly couples to β-arrestin-2 8,14.
Therefore, we examined the potency of cpdA in a β-arrestin-2 recruitment assay (Fig. 1d).
CpdA led to a concentration-dependent response to recruit β-arrestin-2 in both human and
mouse Gpr120 expressing cells, with EC50s of ~0.35 μM (Fig. 1d). Since Gpr120 is a
Gαq/11-coupled receptor, it stimulates both PKC and MAP kinase, and both of these
biologic effects can be detected in an SRE-driven reporter system 8. HEK293 cells were
transiently transfected with constructs for mouse Gpr120 along with a serum response
element-luciferase promoter/reporter (SRE-luc). The Gpr120 SRE-luc reporter cells were
treated with docosahexaenoic acid (DHA) and cpdA. Gpr120 stimulation by cpdA was ~50
fold more potent than DHA (Fig. 1e). DHA and cpdA were used at 100 μM and 10 μM in all
subsequent studies to achieve maximal effects.
In our previous studies 8, we showed that Gpr120 stimulation mediated anti-inflammatory
responses in macrophages. To link these observations to the cpdA compound, we evaluated
the effect of DHA and cpdA on NFkB-driven reporter genes in WT and Gpr120 KO primary
macrophages. DHA and cpdA decreased LPS-induced NFkB-reporter gene activity in WT,
but not in Gpr120 KO primary macrophages (Fig. 1f). To examine Gpr120-mediated anti-
inflammatory properties in a more physiologic context, we treated primary macrophages
from WT and Gpr120 KO mice with DHA or cpdA for 1 hr, followed by LPS stimulation.
DHA and cpdA strongly and comparably inhibited LPS-induced phosphorylation of Tak1,
Ikkβ, and Jnk and blocked IkB degradation (Fig. 1g). LPS-mediated cytokine secretion and
inflammatory gene expression were also inhibited in WT, but not in Gpr120 KO primary
macrophages (Supplemental Fig. 1a and b).
Next, we determined whether the synthetic Gpr120 agonist could produce beneficial
metabolic effects in vivo. WT and Gpr120 KO mice were placed on 60% HFD for 15 weeks.
At this point, separate groups of 10 mice each were treated for an additional 5 weeks with
Oh et al. Page 2
Nat Med. Author manuscript; available in PMC 2015 February 01.
NIH
-PA
Author M
anuscriptN
IH-P
A A
uthor Manuscript
NIH
-PA
Author M
anuscript

60% HFD alone, or HFD containing 30 mg kg−1 cpdA. The 5 weeks treatment time point
was most effective at improving glucose tolerance and lowering insulin concentration
(Supplemental Fig. 2). Figure 2 shows that treatment with cpdA led to markedly improved
glucose tolerance (Fig. 2a), insulin tolerance (Fig. 2b), and decreased insulin secretion
compared to HFD (Fig. 2c) in WT, but not in Gpr120 KO mice, with no change in body
weight (Supplemental Fig. 3). These metabolic effects of cpdA treatment were comparable
to dietary ω3-FAs supplementation (Supplemental Fig. 4). Importantly, during
hyperinsulinemic, euglycemic clamp studies, we found that the cpdA diet caused improved
insulin sensitivity with increased glucose infusion rates (GIR), enhanced insulin stimulated-
glucose disposal rate (IS-GDR), along with a marked increase in the ability of insulin to
suppress hepatic glucose production (HGP) only in WT mice (Fig. 2d). This demonstrates
the in vivo effects of the Gpr120 agonist to produce systemic insulin sensitivity by
enhancing muscle and liver insulin action. In addition to improving hepatic insulin
sensitivity, cpdA treatment had beneficial effects on hepatic lipid metabolism, causing
decreased hepatic steatosis, decreased liver triglycerides, and DAGs, along with reduced
saturated free fatty acid content (Supplemental Fig. 5). In contrast, cpdA administration was
without effect to reduce hepatic lipid levels in the Gpr120 KO mice.
Gpr120 can be expressed in enteroendocrine L cells and earlier studies on Gpr120 have
focused on its potential ability to stimulate Glp-1 secretion 12. Therefore, we measured the
total and active form of Glp-1 during oral glucose challenge in HFD mice with or without
cpdA treatment (Supplemental Fig. 6a). The results demonstrated that Gpr120 activation had
no effect to stimulate Glp-1 secretion at 15 min after oral glucose challenge (Supplemental
Fig. 6a). Others have also shown a lack of effect of Gpr120 stimulation on Glp-1
secretion 16,17. We next measured glucose-stimulated insulin secretion (GSIS) in isolated
islets from WT and Gpr120 KO mice (Supplemental Fig. 6b) and in the mouse β cell line,
MIN6 cells (Supplemental Fig. 6c). CpdA had a slight, but not statistically significant, effect
to increase GSIS in WT islets, but was without effect in Gpr120 KO islets. DHA treatment
had a stronger effect to increase GSIS, which was comparable in both WT and Gpr120 KO
islets (Supplemental Fig. 6b and 6c), showing that this effect of DHA was Gpr120-
independent, but Gpr40-mediated as previously reported 10,18. This is also consistent with
the in vivo GTT results showing slightly higher insulin levels and lower glucose levels in
FOD compared to cpdA treated WT mice (Supplemental Fig. 4). Furthermore, a recent
paper by Stone et al. 18 showed that Gpr120 is preferentially expressed in mouse islet delta
cells and not detected in β cells, and that Gpr120 activation inhibits glucose-induced
somatostatin secretion. Therefore, the slight effect of the Gpr120 agonist on GSIS in isolate
islets is most likely an indirect effect from inhibition of somatostatin secretion. This
interpretation is fully consistent with our results showing that cpdA has no effect on GSIS in
MIN6 cells.
We performed acute insulin response studies by measuring Akt phosphorylation in muscle
and liver following an injection of insulin into HFD WT or Gpr120 KO mice. Fully
consistent with the in vivo glucose clamp studies, this biochemical measure of muscle and
hepatic insulin signaling was increased with cpdA treatment in WT, but not in Gpr120 KO
Oh et al. Page 3
Nat Med. Author manuscript; available in PMC 2015 February 01.
NIH
-PA
Author M
anuscriptN
IH-P
A A
uthor Manuscript
NIH
-PA
Author M
anuscript

mice (Fig. 2e). Taken together, these results show that the Gpr120 agonist leads to increased
systemic insulin sensitivity in vivo.
Gpr120 stimulation by ω3-FAs decreases adipose tissue macrophage (ATM) infiltration and
reduces inflammatory gene expression 8. Consistent with this, we observed that cpdA
treatment blocked chemotaxis of WT macrophage induced by adipocyte condition medium
(CM) as effectively as DHA, but both were without effect in Gpr120 KO macrophages (Fig.
3a). To determine if these in vitro chemotaxis results translated to the in vivo situation, we
directly measured macrophage migration into adipose tissue using an in vivo macrophage
tracking technique. With this approach, circulating monocytes were obtained from WT
donor mice and labeled with fluorescent PKH26 dye ex vivo. The labeled monocytes were
then injected into recipient HFD WT and Gpr120 KO mice with or without dietary ω3-FAs
supplementation or HFD+cpdA treatment. As seen in Figure 3b, there was a substantial
decrease in labeled ATM appearance in both ω3-FA and cpdA treated WT mice, with no
effect in Gpr120 KO mice. These data were even more revealing when we examined the
subpopulations of labeled macrophages between the groups. Thus, ATMs expressing Cd11c
are M1-like and proinflammatory (ATM1) compared to M2-like Cd11c negative ATMs
(ATM2), which are non-inflammatory. With this analysis, there is an even greater decrease
in the number of recruited Cd11c positive ATMs. At the same time, there is an increase in
the Cd11c negative ATM population in the cpdA treated WT mice, with no effect in Gpr120
KO mice (Fig. 3b). This shows that cpdA led to reduced monocyte migration with less M1-
like Cd11c positive ATMs, and that the labeled monocytes that do become ATMs, favor the
M2-like Cd11c negative state. Along with in vivo migration results, we also found reduced
ATM content by immunohistochemistry (F4/80 staining) in adipose tissue sections from
HFD+cpdA treated compared to HFD mice (Fig. 3c). This was accompanied by decreased
Cd11c positive ATMs, and increased Cd11c negative ATMs (Fig. 3d and Supplemental Fig.
7a) by FACS analysis. As before, all of these effects were observed in WT, but not in
Gpr120 KO mice.
While macrophages are one of the critical immune cells mediating HFD-induced
inflammation, recent studies show that other immune cell type, such as T cells and B cells,
can contribute to adipose tissue inflammation 19,20. In particular, Foxp3+ regulatory T
(Treg) cells 19 and regulatory B (Breg) cells 20 suppress inflammation in adipose tissue and
can secrete Il-10 (Fig. 3e). Therefore, we measured Treg and Breg cells in HFD WT and
Gpr120 KO mice with or without cpdA treatment and found increased Treg and Breg cells
in adipose tissue from cpdA treated WT mice, but not in Gpr120 KO mice (Supplemental
Fig. 7b and c). Taken together, ratio of proinflammatory M1-like ATMs to anti-
inflammatory M2-like ATMs+Tregs is markedly decreased with cpdA treatment and this
ability of Gpr120 agonism to boost adipose tissue Treg levels may represent an additional
therapeutic effect.
We also found decreased expression of a number of proinflammatory genes in epididymal
adipose tissue, such as Tnf-α, Il6, Mcp1, and Il1β (Fig. 3e upper row). At the same time, an
increase in anti-inflammatory gene expression, such as Il-10, Clec7a, Mgl1, Ym1 was
observed (Fig. 3e lower row). Interestingly, adipose tissue levels of the proinflammatory
arachidonic acid metabolites, leukotriene B4 (LTB4), prostaglandin E2 (PGE2), 5-
Oh et al. Page 4
Nat Med. Author manuscript; available in PMC 2015 February 01.
NIH
-PA
Author M
anuscriptN
IH-P
A A
uthor Manuscript
NIH
-PA
Author M
anuscript

hydroxyeicosatetraenoic acid (5-HETE), and leukotriene A4 (LTA4) were also inhibited by
both ω3-FA and cpdA treatment (Supplemental Fig. 8). Indicative of systemic inflammation,
circulating cytokine levels are elevated in obesity, and as seen in Figure 3f. Inflammatory
cytokine levels were markedly reduced in HFD+cpdA treated HFD WT mice but not in
HFD Gpr120 KO mice (Fig. 3f). To directly link these observations to inflammatory
transcriptional output, we performed RNA-seq analyses in primary macrophages from WT
and Gpr120 KO mice. As illustrated in Supplemental Figure 9a, pretreatment of
macrophages with DHA or cpdA inhibited LPS-stimulated inflammatory gene expression.
Information clustering results revealed that highly significant biological processes
(Bonferroni p-value < 0.01) in LPS-stimulated macrophages pretreated with DHA
(Supplemental Fig. 9b) or cpdA (Supplemental Fig. 9c) included several inflammation
related pathways.
It is known that nitric oxide (NO) can attenuate insulin signaling through nitrosylation of
insulin signaling molecules, including Akt 21. Tissue NO levels represent the balance
between iNos and Arginase activity. iNos expression was induced in adipose tissue from
both WT and Gpr120 KO mice by HFD, and this effect was reduced by cpdA treatment in
WT but not Gpr120 KO mice. HFD also led to increased Arginase expression, and this
increase was enhanced in WT, but not Gpr120 KO mice, with cpdA treatment. Thus, the
iNos/Arginase ratio was markedly reduced in WT adipose tissue by HFD+cpdA compared
to HFD (Fig. 4a). As would be predicted from these gene expression changes, levels of
adipose tissue NO2, a stable breakdown product of NO, were reduced ~60% in HFD+cpdA
treated WT mice (Fig. 4b). This decrease was almost completely abrogated in Gpr120 KO
mice. Consistent with these changes in NO levels, nitrosylation of Akt, was increased on
HFD in both WT and Gpr120 KO adipose tissue and this was reduced by HFD+cpdA
treatment only in WT adipose tissue (Fig. 4c). Concomitant with this, insulin-stimulated Akt
phosphorylation was greater in adipose tissue from HFD+cpdA treated WT mice compared
to HFD (Fig. 4d).
To further examine the effect of cpdA on insulin signaling, we isolated primary adipocytes
from WT and Gpr120 KO mice for glucose uptake analyses. Ligand-stimulation of Gpr120
led to a modest increase in glucose uptake in primary WT adipocytes, but was without effect
in Gpr120 KO adipocytes (Fig. 4e). As previously described for ω3-FAs, Gpr120 agonist-
mediated glucose uptake was dependent on Gαq/11 signaling and independent of the β-
arrestin-2 pathway (Supplemental Fig. 10; 8 ).
Recently, the ω3-FA sensing GPCR, Gpr120, has received increasing interest as a
therapeutic target for the treatment of both metabolic and inflammatory diseases. Knockout
experiments in cells and mice, as well as human genetic studies are consistent with the view
that Gpr120 plays an important role in anti-inflammation and insulin sensitization 8,9,12.
Despite this interest, further validation of Gpr120 as a therapeutic target has been hindered
by the lack of available small molecule agonists. In our current work, we have used a novel
small molecule agonist for Gpr120, cpdA, to explore the pharmacology and function of
Gpr120 in vitro and in vivo. Comparison of cpdA with ω3-FAs clearly demonstrated that
this Gpr120 agonist is a selective, potent activator of both human and mouse Gpr120. Most
importantly, treatment with this compound in vitro and in vivo, caused anti-inflammatory,
Oh et al. Page 5
Nat Med. Author manuscript; available in PMC 2015 February 01.
NIH
-PA
Author M
anuscriptN
IH-P
A A
uthor Manuscript
NIH
-PA
Author M
anuscript

insulin sensitizing effects, comparable to ω3-FA administration. Taken together, Gpr120
agonists could become future insulin sensitizing agents for the treatment of Type 2 diabetes
and other human insulin resistant states.
Online Methods
Chemicals and reagents
CpdA was provided from Merck & Co., Inc. (Whitehouse Station, NJ) and DHA was from
Cayman chemical (Ann Arbor, MI). All other chemicals were purchased from Sigma unless
mentioned otherwise.
Animal care and use
Male C57Bl/6 WT or Gpr120 KO littermates were fed a normal chow (13.5% fat; LabDiet)
or high-fat diet (60% fat; Research Diet) ad libitum for 15-20 weeks from 8 weeks of age.
Gpr120 KO mice and WT littermates were initially provided by Taconic Inc. (Hudson, NY)
and bred further in house, backcrossing with C57Bl/6J mice for > 10 generations. After 15
weeks on HFD, WT and Gpr120 KO mice were switched to an isocaloric HFD
supplemented with ω3-FA concentrate 8 or 30 mg kg-1 cpdA and fed for 5 weeks. Mice
received fresh diet every 3rd day, and food consumption and body weight were monitored.
Animals were housed in a specific pathogen-free facility and given free access to food and
water. All procedures were approved by the University of California San Diego animal care
and use committee. In vivo metabolic studies were performed as described previously 8.
Metabolic studies
We performed GTT, ITT, and hyperinsulinemic euglycemic clamp studies as described 8,22.
Acute insulin response
WT and Gpr120 KO mice on HFD or HFD+cpdA were injected with insulin (0.35 U kg−1)
after 6 hr fast into the inferior vena cava. Tissue species were harvested as described 23, at
the indicated time points and flash frozen in liquid N2. We prepared lysates and ran Western
blots according to standard protocols.
Western blotting and gene expression analyses
Western blotting and quantitative PCR (qPCR) were performed as previously described 8,22.
All antibodies are from Cell Signaling Technology.
SVCs isolation, and FACS analysis
SVC isolation and FACS analyses were performed as previously described 24. SVCs were
incubated with Fc Block (BD Biosciences) for 20 min at 4 °C before staining with
fluorescently labeled primary antibodies or control IgGs for 30 min at 4 °C. We used Aqua
L-D (Invitrogen) to exclude dead cells. The antibodies used were anti-F4/80-APC (BM8,
AbD Serotec), Cd11b-FITC (M1/70, BD Biosciences), Cd11c-PE (HL-3, BD Biosciences),
Cd4 (RM4-5, BD Biosciences), Cd19 (MB19-1, eBioscience), Cd22.2 (CY34.1, BD
Biosciences), Cd25 (PC61, eBioscience), Cd45R-APC-Cy7 (BD Biosciences), Foxp3
Oh et al. Page 6
Nat Med. Author manuscript; available in PMC 2015 February 01.
NIH
-PA
Author M
anuscriptN
IH-P
A A
uthor Manuscript
NIH
-PA
Author M
anuscript

(FJK-16s, eBioscience). Unstained, single stained, and fluorescence minus one controls
were used for setting compensation and gates.
Immunohistochemistry
Liver was fixed and embedded in paraffin and sectioned for H&E staining.
In vitro chemotaxis assay
In vitro chemotaxis assay was performed as previously described 8.
In vivo macrophage tracking
In vivo macrophage tracking was performed as previously described 25. Briefly, blood
leukocytes from C57BL/6 WT mice were subjected to red blood cell lysis and monocyte
subsets were enriched with EasySep® mouse monocyte enrichment kit (STEMCELL tech,
Vancouver, BC) following the manufacture’s instructions. Isolated monocytes (2×10⁶ to
5×10⁶) were washed once in serum-free medium (RPMI-1640) and suspended in 2 ml of
Diluent solution C (included in the PKH26 labeling kit). Two ml of PKH26 (Sigma
Chemical Co. St Louis, MO) at 2×10⁻³ M in Diluent C was added and mixed, and the cells
were incubated for 10 min at room temperature in the dark. The staining reaction was
stopped by addition of an equal volume (2 ml) of medium supplemented with 10% FBS. The
mixture was centrifuged and the cells were washed once and resuspended in serum
containing medium. Subsequent to labeling with PKH26, the monocytes were counted and
~0.2×10⁶ viable cells were suspended in 0.2 ml PBS and injected retroorbitally in each
group of mice. Five days after injection, the ATMs were isolated from visceral fat tissue and
analyzed by FACS 25.
Glucose uptake in primary adipocyte and 3T3-L1 adipocyte
Glucose uptake in primary adipocyte and 3T3-L1 adipocyte were measured as previously
described 8,23.
Intraperitoneal primary macrophage isolation and culture
We harvested primary macrophages from WT and Gpr120 KO mice as described 8. Three
days after harvest and plating, we pretreated cells with 100 μM DHA or 10 μM cpdA for 1
hr, followed by LPS (100 ng ml−1) for 15 min prior to protein isolation, 6 hr for collection of
condition media and RNA isolation for qPCR analyses. For the NFkB-luc reporter assay was
conducted as described 26 with primary macrophages from WT and Gpr120 KO mice.
Nitrate measurement
Nitrate content in adipose tissue lysate was measured using Griess Reagent System
(Promega) in accordance with the manufacturer's protocol.
Measurement of protein nitrosylation
S-nitrosylation of Akt was detected using the biotin-switch method (Cayman) according to
the manufacturer's protocol.
Oh et al. Page 7
Nat Med. Author manuscript; available in PMC 2015 February 01.
NIH
-PA
Author M
anuscriptN
IH-P
A A
uthor Manuscript
NIH
-PA
Author M
anuscript

Lipid measurement
Lipid measurements in mouse liver was performed by Lipomics as described previously 8.
LTB4 measurement
LTB4 measurement in mouse adipose tissue was performed as previously described 27.
Measurement of Insulin Secretory Response from Isolated Islets
Glucose-stimulate insulin secretion from mouse islet was performed as previously
described 28. For static GSIS assays, ~20 mouse islets were incubated for 2 hr in low
glucose media at 37 °C, 5% CO2, and then incubated for 60 min or 75 min with 2.8 mM or
16.7 mM glucose in the same conditions.
RNA library construction and High-throughput sequencing
RNA library construction and Illumina high-throughput sequencing was performed as
described previously 29.
Processing RNA-seq data for information clustering and heatmap
RNA sequences from Illumina HiSeq were aligned to the mouse transcriptome using the
Bowtie2 aligner 30. Gene-level count summaries were analyzed for statistically significant
changes using DESeq 31. Individual p-values were adjusted for multiple testing by
calculating the q-values. For each gene, the q-value is the smallest false discovery rate at
which the gene is found significant. For Information clustering and heatmap generation, We
analyzed biological processes as defined by the Gene Ontology Consortium 32. A typical list
of significant biological processes usually contains several redundant, closely related gene
sets with great overlap of member genes. In order to reduce redundancy of reporting, we
cluster the significant terms using a true distance metric called variation of information 33.
Qualitatively speaking, variation of information between two sets of genes is smaller (i.e.,
gene sets are closer) when the gene sets share a large fraction of member genes and is larger
(gene sets are farther apart) when the gene memberships have less overlap. A distance
matrix thus obtained defines a graph in higher-dimensional Euclidean space in which each
node is a gene set and the length of every edge is the distance (variation of information)
between the connected nodes. This graph is then optimally visualized in two dimensions
using a Principal Coordinates Analysis (multiscaling) function cmdscale of R. For
presentation purposes, we choose to represent each node (gene set) not just by a point, but a
circle whose diameter is proportional to the (−log) of the Bonferroni-adjusted P value. This
way, more significant nodes appear as larger circles to draw attention. Any two circles may
appear to overlap, but this should not be interpreted in the usual Venn diagram sense. When
circles overlap, it is because the gene sets they represent were close enough in the
information sense (had overlapping gene membership) and was significant enough to
produce large circles. We use this visualization to report the relevant non-redundant
biological processes.
Oh et al. Page 8
Nat Med. Author manuscript; available in PMC 2015 February 01.
NIH
-PA
Author M
anuscriptN
IH-P
A A
uthor Manuscript
NIH
-PA
Author M
anuscript

Data analysis
Densitometric quantification and normalization were performed using the ImageJ 1.42q
software. The values presented are expressed as the means±SEM. The statistical significance
of the differences between various treatments was determined by one-way ANOVA with the
Bonferroni correction using GraphPad Prism 6.0 (San Diego, CA). p<0.05 was considered
significant.
Supplementary Material
Refer to Web version on PubMed Central for supplementary material.
Acknowledgments
This study was funded in part by grants to J.M.O (DK033651, DK074868, DK063491, DK09062), and D.Y.O.(P30 DK063491), a grant from Merck Inc. to J.M.O. and D.Y.O., Austrian science fund (FWF Doktoratskolleg DK-MCD W1226 and the FWF project P24143) to J.G.B.S., and Marshall Plan Scholarship to A.R.P.
We thank Angela Tyler for editorial assistance and Neal Sekiya for assistance with FACS analysis at the VA SanDiego hospital, the UCSD Histology Core lab for technical help with processing liver specimens, and the UCSDMicroscope Resource for microscopy analysis which is funded by UCSD Neuroscience Microscopy Shared FacilityGrant P30 NS047101.
References
1. Sijben JW, Calder PC. Differential immunomodulation with long-chain n-3 PUFA in health andchronic disease. Proc Nutr Soc. 2007; 66:237–259. [PubMed: 17466105]
2. Lee JY, et al. Differential modulation of Toll-like receptors by fatty acids: preferential inhibition byn-3 polyunsaturated fatty acids. J Lipid Res. 2003; 44:479–486. [PubMed: 12562875]
3. Proudman SM, Cleland LG, James MJ. Dietary omega-3 fats for treatment of inflammatory jointdisease: efficacy and utility. Rheum Dis Clin North Am. 2008; 34:469–479. [PubMed: 18638687]
4. Calder PC. Polyunsaturated fatty acids and inflammation. Biochem Soc Trans. 2005; 33:423–427.[PubMed: 15787620]
5. Polozova A, Salem N Jr. Role of liver and plasma lipoproteins in selective transport of n-3 fattyacids to tissues: a comparative study of 14C-DHA and 3H-oleic acid tracers. J Mol Neurosci. 2007;33:56–66. [PubMed: 17901547]
6. Neschen S, et al. n-3 Fatty acids preserve insulin sensitivity in vivo in a peroxisome proliferator-activated receptor-alpha-dependent manner. Diabetes. 2007; 56:1034–1041. [PubMed: 17251275]
7. Geleijnse JM, Giltay EJ, Grobbee DE, Donders AR, Kok FJ. Blood pressure response to fish oilsupplementation: metaregression analysis of randomized trials. J Hypertens. 2002; 20:1493–1499.[PubMed: 12172309]
8. Oh DY, et al. GPR120 is an omega-3 fatty acid receptor mediating potent anti-inflammatory andinsulin-sensitizing effects. Cell. 2010; 142:687–698. [PubMed: 20813258]
9. Ichimura A, et al. Dysfunction of lipid sensor GPR120 leads to obesity in both mouse and human.Nature. 2012; 483:350–354. [PubMed: 22343897]
10. Itoh Y, et al. Free fatty acids regulate insulin secretion from pancreatic beta cells through GPR40.Nature. 2003; 422:173–176. [PubMed: 12629551]
11. Hudson BD, et al. The pharmacology of TUG-891, a potent and selective agonist of the free fattyacid receptor 4 (FFA4/GPR120), demonstrates both potential opportunity and possible challengesto therapeutic agonism. Molecular pharmacology. 2013; 84:710–725. [PubMed: 23979972]
12. Hirasawa A, et al. Free fatty acids regulate gut incretin glucagon-like peptide-1 secretion throughGPR120. Nature medicine. 2005; 11:90–94.
13. Hara T, et al. Novel selective ligands for free fatty acid receptors GPR120 and GPR40. Naunyn-Schmiedeberg's archives of pharmacology. 2009; 380:247–255.
Oh et al. Page 9
Nat Med. Author manuscript; available in PMC 2015 February 01.
NIH
-PA
Author M
anuscriptN
IH-P
A A
uthor Manuscript
NIH
-PA
Author M
anuscript

14. Shimpukade B, Hudson BD, Hovgaard CK, Milligan G, Ulven T. Discovery of a potent andselective GPR120 agonist. Journal of medicinal chemistry. 2012; 55:4511–4515. [PubMed:22519963]
15. Sun Q, et al. Structure-activity relationships of GPR120 agonists based on a docking simulation.Molecular pharmacology. 2010; 78:804–810. [PubMed: 20685848]
16. Paulsen SJ, et al. Expression of the fatty acid receptor GPR120 in the gut of diet-induced-obeserats and its role in GLP-1 secretion. PloS one. 2014; 9:e88227. [PubMed: 24520357]
17. Xiong Y, et al. Activation of FFA1 mediates GLP-1 secretion in mice. Evidence for allosterism atFFA1. Molecular and cellular endocrinology. 2013; 369:119–129. [PubMed: 23403053]
18. Stone VM, et al. GPR120 (FFAR4) is preferentially expressed in pancreatic delta cells andregulates somatostatin secretion from murine islets of Langerhans. Diabetologia. 2014
19. Feuerer M, et al. Lean, but not obese, fat is enriched for a unique population of regulatory T cellsthat affect metabolic parameters. Nature medicine. 2009; 15:930–939.
20. Nishimura S, et al. Adipose Natural Regulatory B Cells Negatively Control Adipose TissueInflammation. Cell metabolism. 2013
21. Yasukawa T, et al. S-nitrosylation-dependent inactivation of Akt/protein kinase B in insulinresistance. The Journal of biological chemistry. 2005; 280:7511–7518. [PubMed: 15632167]
22. Li P, et al. Adipocyte NCoR knockout decreases PPARgamma phosphorylation and enhancesPPARgamma activity and insulin sensitivity. Cell. 2011; 147:815–826. [PubMed: 22078880]
23. Talukdar S, et al. Neutrophils mediate insulin resistance in mice fed a high-fat diet throughsecreted elastase. Nature medicine. 2012; 18:1407–1412.
24. Li P, et al. Functional heterogeneity of CD11c-positive adipose tissue macrophages in diet-inducedobese mice. The Journal of biological chemistry. 2010; 285:15333–15345. [PubMed: 20308074]
25. Oh DY, Morinaga H, Talukdar S, Bae EJ, Olefsky JM. Increased macrophage migration intoadipose tissue in obese mice. Diabetes. 2012; 61:346–354. [PubMed: 22190646]
26. Li P, et al. NCoR repression of LXRs restricts macrophage biosynthesis of insulin-sensitizingomega 3 fatty acids. Cell. 2013; 155:200–214. [PubMed: 24074869]
27. Quehenberger O, et al. Lipidomics reveals a remarkable diversity of lipids in human plasma. JLipid Res. 2010; 51:3299–3305. [PubMed: 20671299]
28. Lee YS, et al. The fractalkine/CX3CR1 system regulates beta cell function and insulin secretion.Cell. 2013; 153:413–425. [PubMed: 23582329]
29. Lister R, et al. Hotspots of aberrant epigenomic reprogramming in human induced pluripotent stemcells. Nature. 2011; 471:68–73. [PubMed: 21289626]
30. Langmead B, Salzberg SL. Fast gapped-read alignment with Bowtie 2. Nature methods. 2012;9:357–359. [PubMed: 22388286]
31. Anders S, Huber W. Differential expression analysis for sequence count data. Genome biology.2010; 11:R106. [PubMed: 20979621]
32. Reference Genome Group of the Gene Ontology, C. The Gene Ontology's Reference GenomeProject: a unified framework for functional annotation across species. PLoS computationalbiology. 2009; 5:e1000431. [PubMed: 19578431]
33. Nugent R, Meila M. An overview of clustering applied to molecular biology. Methods inmolecular biology. 2010; 620:369–404. [PubMed: 20652512]
Oh et al. Page 10
Nat Med. Author manuscript; available in PMC 2015 February 01.
NIH
-PA
Author M
anuscriptN
IH-P
A A
uthor Manuscript
NIH
-PA
Author M
anuscript

Figure 1. CpdA is a selective agonist of Gpr120(a) Chemical structure of cpdA. Dose response data for cpdA are shown in (b) Ca2+
mobilization for Gpr120 vs. Gpr40 transfected cells. Dose response data for cpdA are shown
in (c) IP3 production, and (d) β-arrestin-2 interaction assay with human and mouse Gpr120.
Results are % activity over basal. (e) Gpr120-mediated SRE-luc activity after treatment with
DHA and cpdA for 6 hr in HEK 293 cells. (f) NFkB-luc activity after pretreatment with
DHA and cpdA for 1 hr subjected followed by LPS for 6 hr in primary macrophages from
WT or Gpr120 KO mice. Results are fold activities over basal. Each data point represents
Oh et al. Page 11
Nat Med. Author manuscript; available in PMC 2015 February 01.
NIH
-PA
Author M
anuscriptN
IH-P
A A
uthor Manuscript
NIH
-PA
Author M
anuscript

mean±SEM of three independent experiments performed in triplicate. P<0.05 versus LPS
treatment in WT macrophages. (g) DHA and cpdA inhibits LPS-induced inflammatory
signaling in primary macrophages from WT, but not Gpr120 KO macrophages. The scanned
bar graph (right panel) shows fold induction over basal conditions (p-Tak, p-Ikk, and p-Jnk)
or LPS treatment (IkB degradation). Data are expressed as the mean±SEM. *, P<0.05 versus
LPS treatment in WT mice to DHA+LPS or cpdA+LPS. n=6 per group. Data is a
representative image from more than five independent experiments.
Oh et al. Page 12
Nat Med. Author manuscript; available in PMC 2015 February 01.
NIH
-PA
Author M
anuscriptN
IH-P
A A
uthor Manuscript
NIH
-PA
Author M
anuscript

Figure 2. Gpr120 agonist and in vivo metabolic studies(a) GTT in WT and Gpr120 KO mice on HFD or HFD+cpdA. n=10 per group. (b) ITT in
WT and Gpr120 KO mice on HFD or HFD+cpdA. n=10 per group. (c) Plasma insulin level
during GTT at the indicated time points. (d) Hyperinsulinemic/euglycemic clamp studies in
WT and Gpr120 KO mice on HFD or HFD+cpdA. Glucose infusion rate (GIR), total
glucose disposal rate (GDR), insulin–stimulated glucose disposal rate (IS-GDR), percent
suppression of hepatic glucose production. *, p<0.05, compared to HFD. Data are
represented as mean±SEM. (e) Acute insulin response showing phosphorylation of Akt in
skeletal muscle and liver from WT and Gpr120 KO mice on HFD or HFD+cpdA using 0.35
U kg–1 insulin injected via inferior vena cava. Left panel is a representative image from five
independent experiments, and the scanned bar graph (right panel) shows fold induction over
basal (before insulin injection) conditions. Data are expressed as the mean±SEM. *, P<0.05
versus insulin injection in WT mice on HFD. n=6 per group.
Oh et al. Page 13
Nat Med. Author manuscript; available in PMC 2015 February 01.
NIH
-PA
Author M
anuscriptN
IH-P
A A
uthor Manuscript
NIH
-PA
Author M
anuscript

Figure 3. Anti-inflammatory effects of Gpr120 agonism(a) Effect of Gpr120 agonist on 3T3-L1 adipocyte CM-induced chemotaxis of primary
macrophage from WT and Gpr120 KO mice. (b) In vivo tracking of PKH26 positive
monocytes in WT and Gpr120 KO mice on HFD or HFD+ω3-FA (W3) or HFD+cpdA. n=6
per group. (c) ATM content by F4/80 staining in adipose tissue sections from WT and
Gpr120 KO mice on HFD or HFD+cpdA. Scale bar indicates 250 μm. (d) FACS analysis of
ATMs from WT and Gpr120 KO mice on HFD or HFD+cpdA. n=6 per group. (e) Relative
mRNA level of inflammatory cytokines (upper row) and anti-inflammatory cytokines (lower
row) in adipose tissue from WT and Gpr120 KO mice from HFD or HFD+cpdA. n= 10 per
group. (f) Serum Il–6, Mcp–1, Kc, and Pai–1 levels from WT and Gpr120 KO mice on HFD
or HFD+cpdA. n= 10 per group. Data are expressed as the mean±SEM. *, P<0.05 versus
WT mice on HFD.
Oh et al. Page 14
Nat Med. Author manuscript; available in PMC 2015 February 01.
NIH
-PA
Author M
anuscriptN
IH-P
A A
uthor Manuscript
NIH
-PA
Author M
anuscript
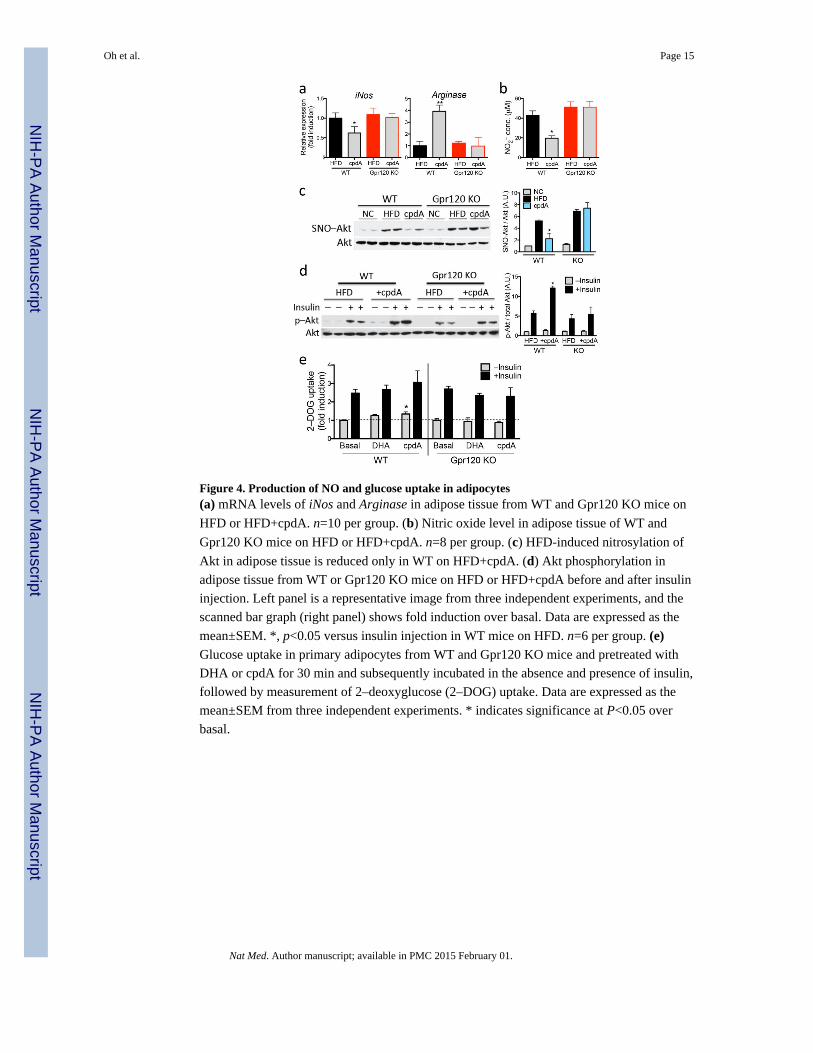
Figure 4. Production of NO and glucose uptake in adipocytes(a) mRNA levels of iNos and Arginase in adipose tissue from WT and Gpr120 KO mice on
HFD or HFD+cpdA. n=10 per group. (b) Nitric oxide level in adipose tissue of WT and
Gpr120 KO mice on HFD or HFD+cpdA. n=8 per group. (c) HFD-induced nitrosylation of
Akt in adipose tissue is reduced only in WT on HFD+cpdA. (d) Akt phosphorylation in
adipose tissue from WT or Gpr120 KO mice on HFD or HFD+cpdA before and after insulin
injection. Left panel is a representative image from three independent experiments, and the
scanned bar graph (right panel) shows fold induction over basal. Data are expressed as the
mean±SEM. *, p<0.05 versus insulin injection in WT mice on HFD. n=6 per group. (e)Glucose uptake in primary adipocytes from WT and Gpr120 KO mice and pretreated with
DHA or cpdA for 30 min and subsequently incubated in the absence and presence of insulin,
followed by measurement of 2–deoxyglucose (2–DOG) uptake. Data are expressed as the
mean±SEM from three independent experiments. * indicates significance at P<0.05 over
basal.
Oh et al. Page 15
Nat Med. Author manuscript; available in PMC 2015 February 01.
NIH
-PA
Author M
anuscriptN
IH-P
A A
uthor Manuscript
NIH
-PA
Author M
anuscript