dabur india limited · e commerce in mena growing in strong double digits : plans ... other...
TRANSCRIPT

Investor Communication Quarter ended 30thJune 2017
Dabur India Limited
1
August 4, 2017

GST Transition
2
GST implemented w.e.f. 1st July 2017
De‐stocking in trade channels and institutions led to impact on primary sales
Exceptional promotional intensity witnessed in the month of May & June
North and East Wholesale channel impacted more than other regions
Underlying consumption trends steady
Dabur Overview : Q1FY18
3
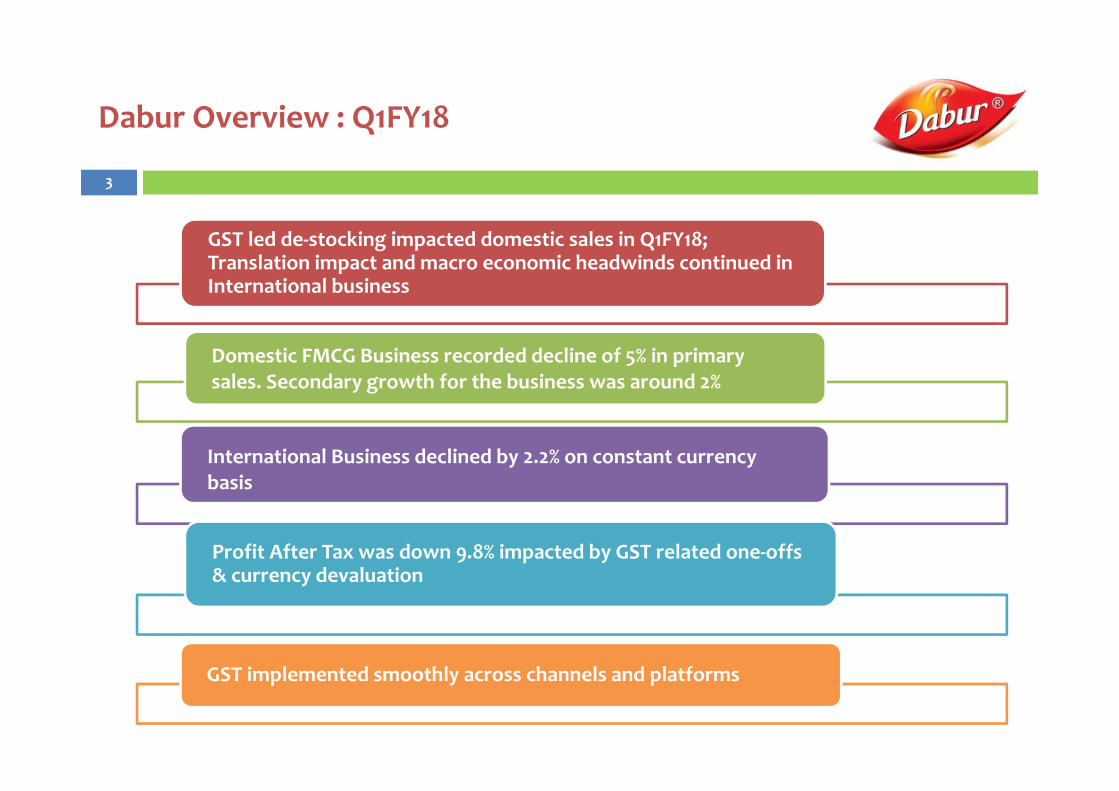
GST led de‐stocking impacted domestic sales in Q1FY18; Translation impact and macro economic headwinds continued in International business
Domestic FMCG Business recorded decline of 5% in primary sales. Secondary growth for the business was around 2%
International Business declined by 2.2% on constant currency basis
Profit After Tax was down 9.8% impacted by GST related one‐offs & currency devaluation
GST implemented smoothly across channels and platforms
Consolidated Financials : Q1FY18
4
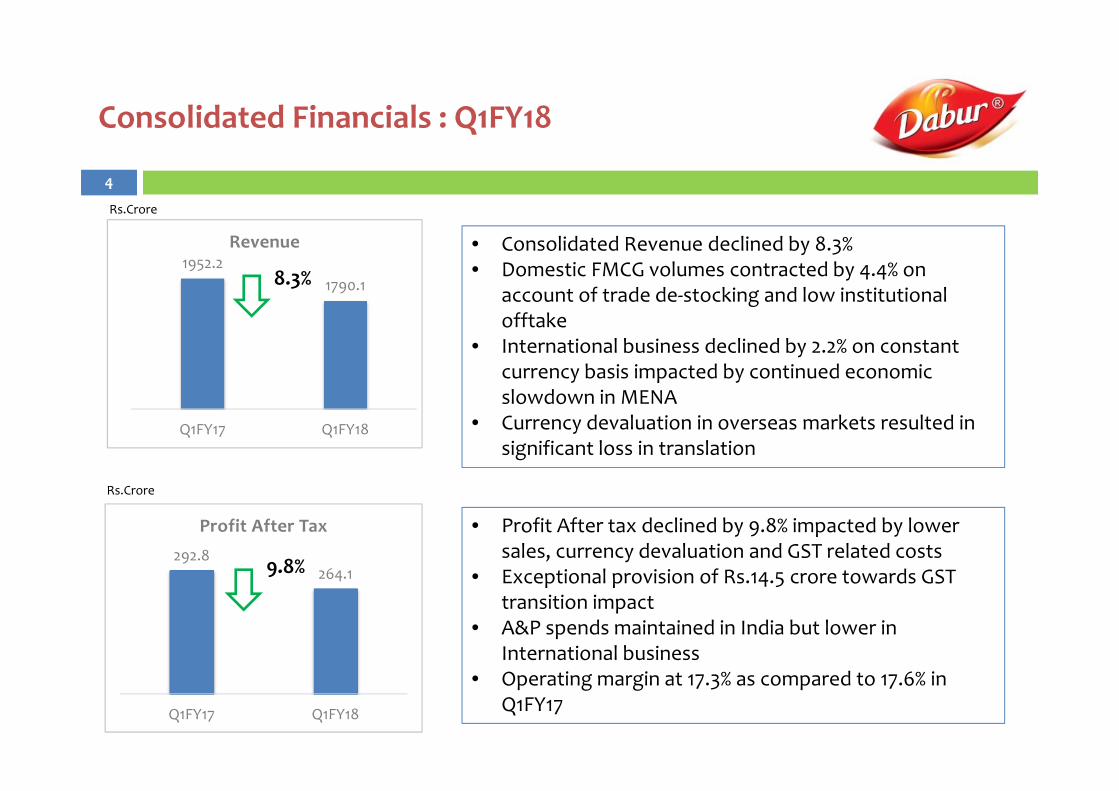
• Consolidated Revenue declined by 8.3%• Domestic FMCG volumes contracted by 4.4% on
account of trade de‐stocking and low institutional offtake
• International business declined by 2.2% on constant currency basis impacted by continued economic slowdown in MENA
• Currency devaluation in overseas markets resulted in significant loss in translation
1952.21790.1
Q1FY17 Q1FY18
Revenue
292.8264.1
Q1FY17 Q1FY18
Profit After Tax • Profit After tax declined by 9.8% impacted by lower sales, currency devaluation and GST related costs
• Exceptional provision of Rs.14.5 crore towards GST transition impact
• A&P spends maintained in India but lower in International business
• Operating margin at 17.3% as compared to 17.6% in Q1FY17
8.3%
9.8%
Rs.Crore
Rs.Crore
Business Overview Q1FY18
5
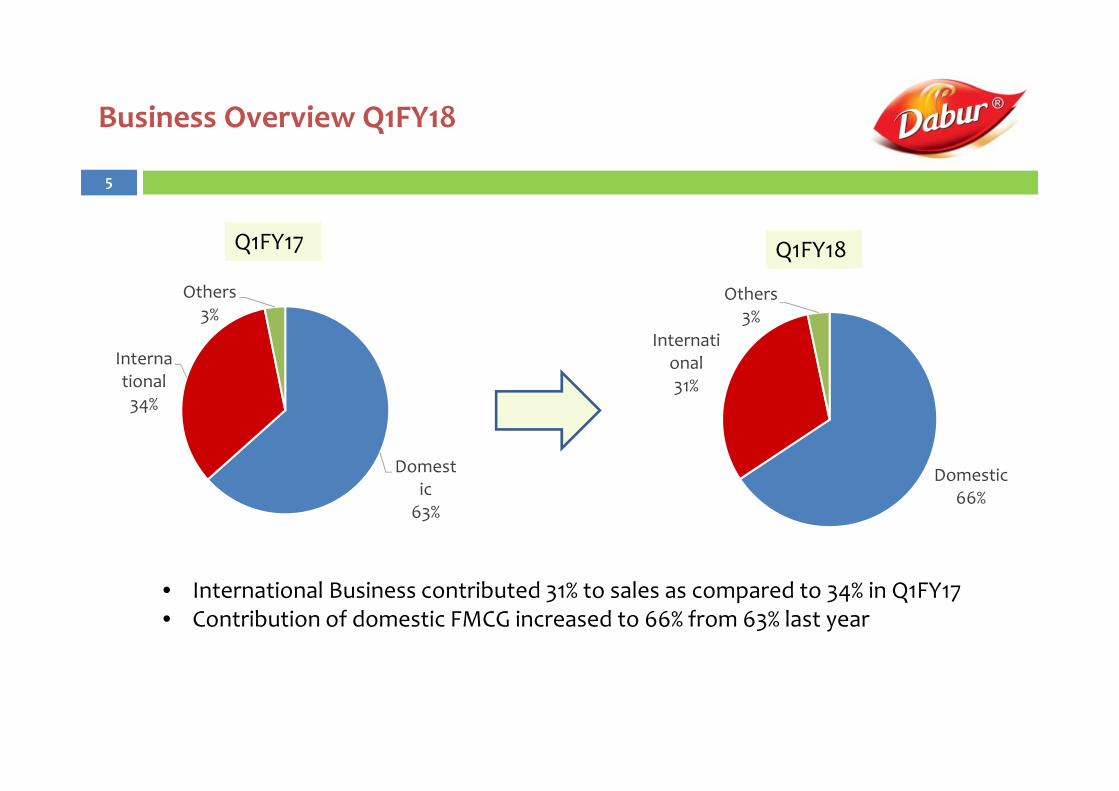
Domestic66%
International 31%
Others 3%
Domestic63%
International 34%
Others 3%
Q1FY17 Q1FY18
• International Business contributed 31% to sales as compared to 34% in Q1FY17• Contribution of domestic FMCG increased to 66% from 63% last year
Category Wise Sales – Domestic FMCG
6
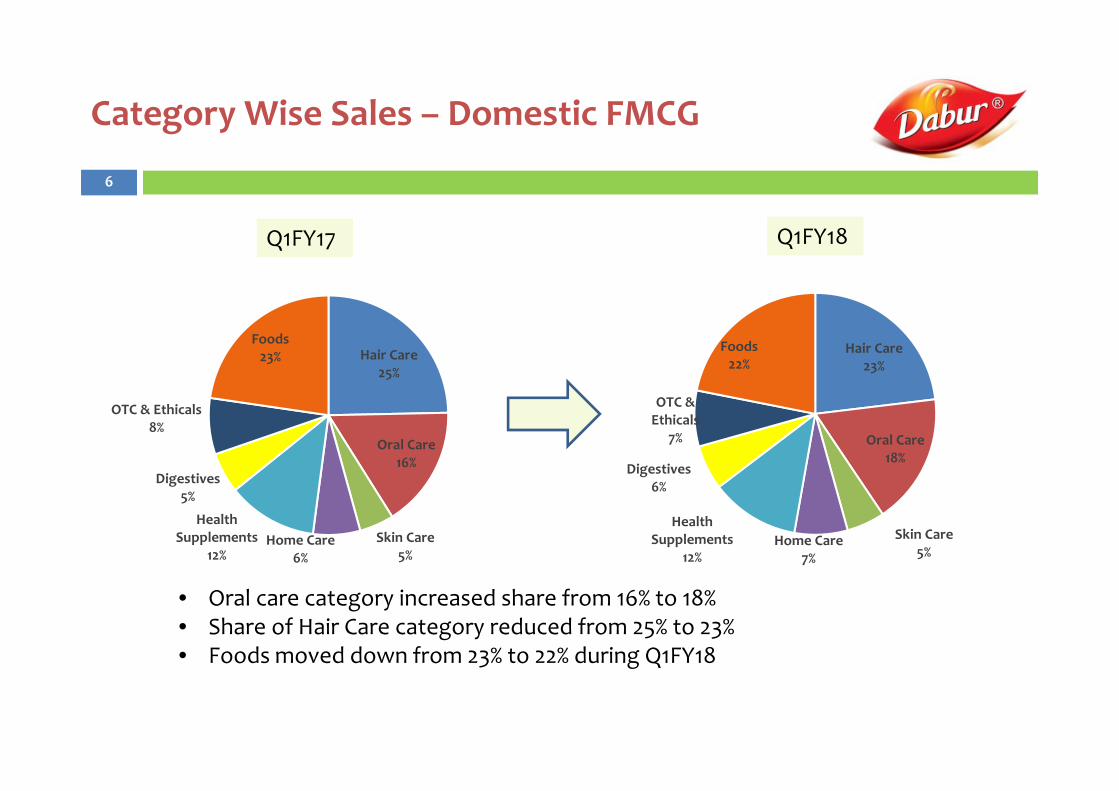
Hair Care 23%
Oral Care 18%
Skin Care 5%
Home Care 7%
Health Supplements
12%
Digestives6%
OTC & Ethicals
7%
Foods 22%
Q1FY18
Hair Care 25%
Oral Care 16%
Skin Care 5%
Home Care 6%
Health Supplements
12%
Digestives5%
OTC & Ethicals8%
Foods 23%
Q1FY17
• Oral care category increased share from 16% to 18%• Share of Hair Care category reduced from 25% to 23% • Foods moved down from 23% to 22% during Q1FY18
7
Category Highlights
Home and Personal Care (HPC)
8
First of its kind Ayurvedic Toothpastein Gel format
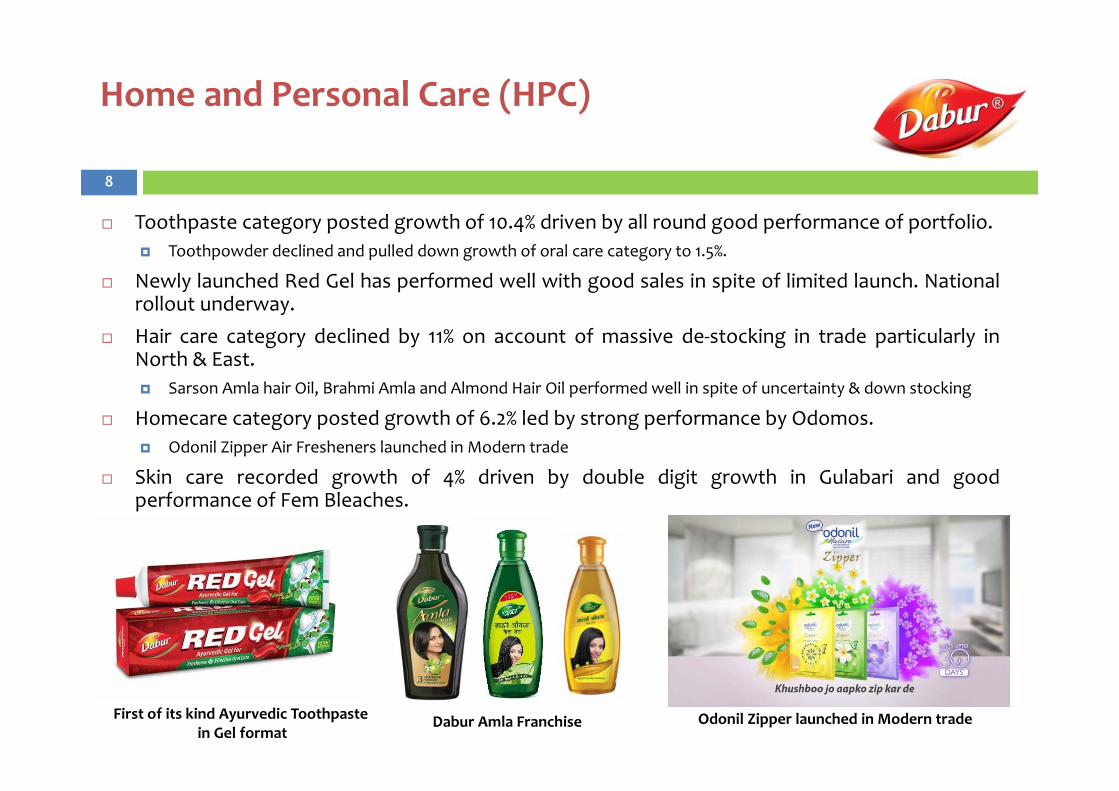
Toothpaste category posted growth of 10.4% driven by all round good performance of portfolio. Toothpowder declined and pulled down growth of oral care category to 1.5%.
Newly launched Red Gel has performed well with good sales in spite of limited launch. Nationalrollout underway.
Hair care category declined by 11% on account of massive de‐stocking in trade particularly inNorth & East. Sarson Amla hair Oil, Brahmi Amla and Almond Hair Oil performed well in spite of uncertainty & down stocking
Homecare category posted growth of 6.2% led by strong performance by Odomos. Odonil Zipper Air Fresheners launched in Modern trade
Skin care recorded growth of 4% driven by double digit growth in Gulabari and goodperformance of Fem Bleaches.
Dabur Amla Franchise Odonil Zipper launched in Modern trade
Health Care (HC)
9
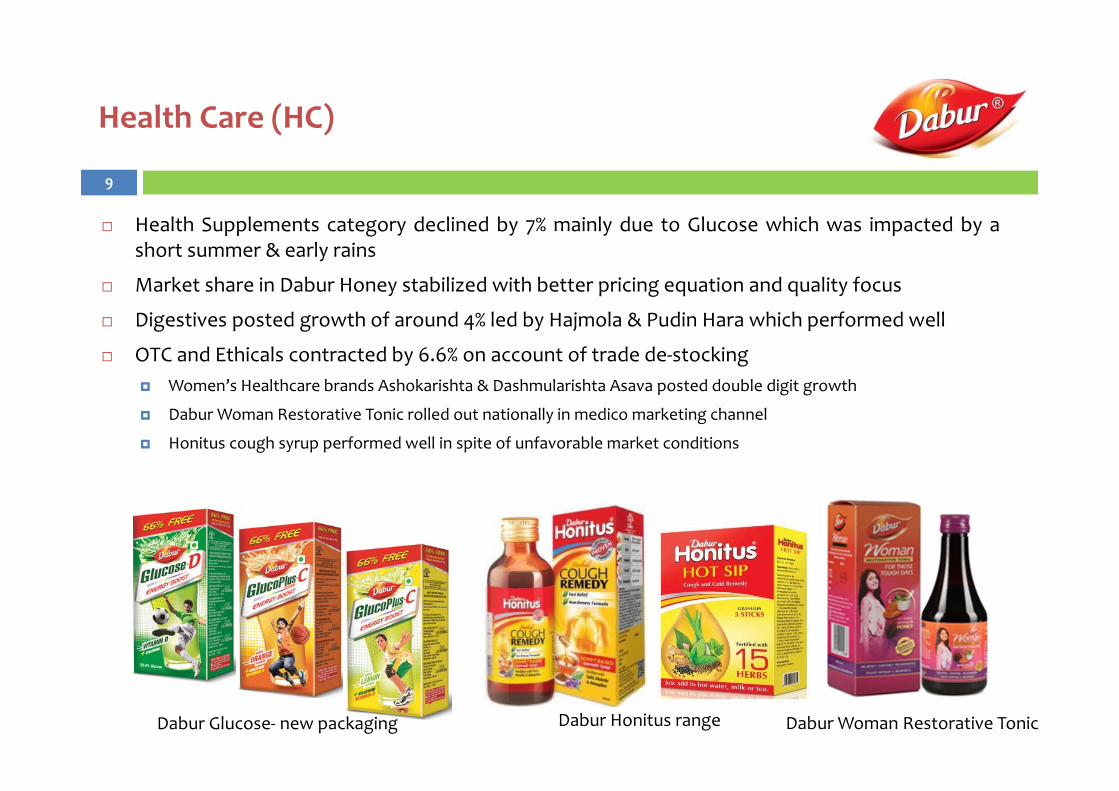
Health Supplements category declined by 7% mainly due to Glucose which was impacted by ashort summer & early rains
Market share in Dabur Honey stabilized with better pricing equation and quality focus
Digestives posted growth of around 4% led by Hajmola & Pudin Hara which performed well
OTC and Ethicals contracted by 6.6% on account of trade de‐stocking Women’s Healthcare brands Ashokarishta & Dashmularishta Asava posted double digit growth
Dabur Woman Restorative Tonic rolled out nationally in medico marketing channel
Honitus cough syrup performed well in spite of unfavorable market conditions
Dabur Glucose‐ new packaging Dabur Honitus range Dabur Woman Restorative Tonic

Foods
Foods category was impacted by major de‐stocking and heightened discounting by competition
Early rains in June impacted sales in North & Central India
Beverages witnessed decline of 8.3% in primary sales however secondary growth was 4%.
Activ Coconut Water posted strong growth driven by consumer demand & new communication
New flavours such as Real Mosambi and Real Wellnezz performed well
Entry into fruit drinks category off to a good start
10

International Business
11
102 102105
102107 105 107 106 104 104
10094
114 109 112 114 115108 107 108
104109 108 108
Q12014
Q22014
Q32014
Q42014
Q12015
Q22015
Q32015
Q42015
Q12016
Q22016
Q32016
Q42016
Consumer Confidence Index
• Macro‐economic factors have impacted International Business sales across the MENA region due to :▸Continued economic challenges in the region on account of falling Oil prices▸Currency devaluation in key markets ▸Political and governmental regulations impacting sales i.e. Qatar, Algeria
• This is reflected in the falling Consumer sentiments in the region
UAE
SAUDI ARABIA
International Business : Q1FY18
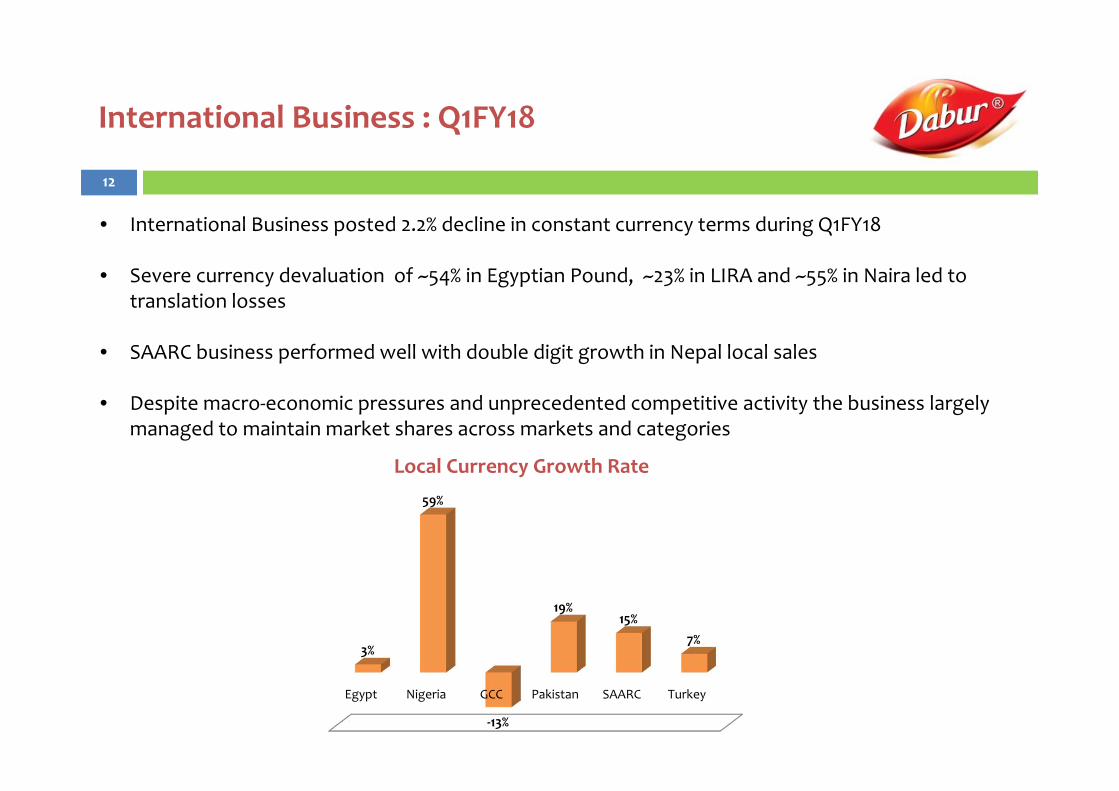
• International Business posted 2.2% decline in constant currency terms during Q1FY18
• Severe currency devaluation of ~54% in Egyptian Pound, ~23% in LIRA and ~55% in Naira led to translation losses
• SAARC business performed well with double digit growth in Nepal local sales
• Despite macro‐economic pressures and unprecedented competitive activity the business largely managed to maintain market shares across markets and categories
Local Currency Growth Rate
12
Egypt Nigeria GCC Pakistan SAARC Turkey
3%
59%
‐13%
19%15%
7%
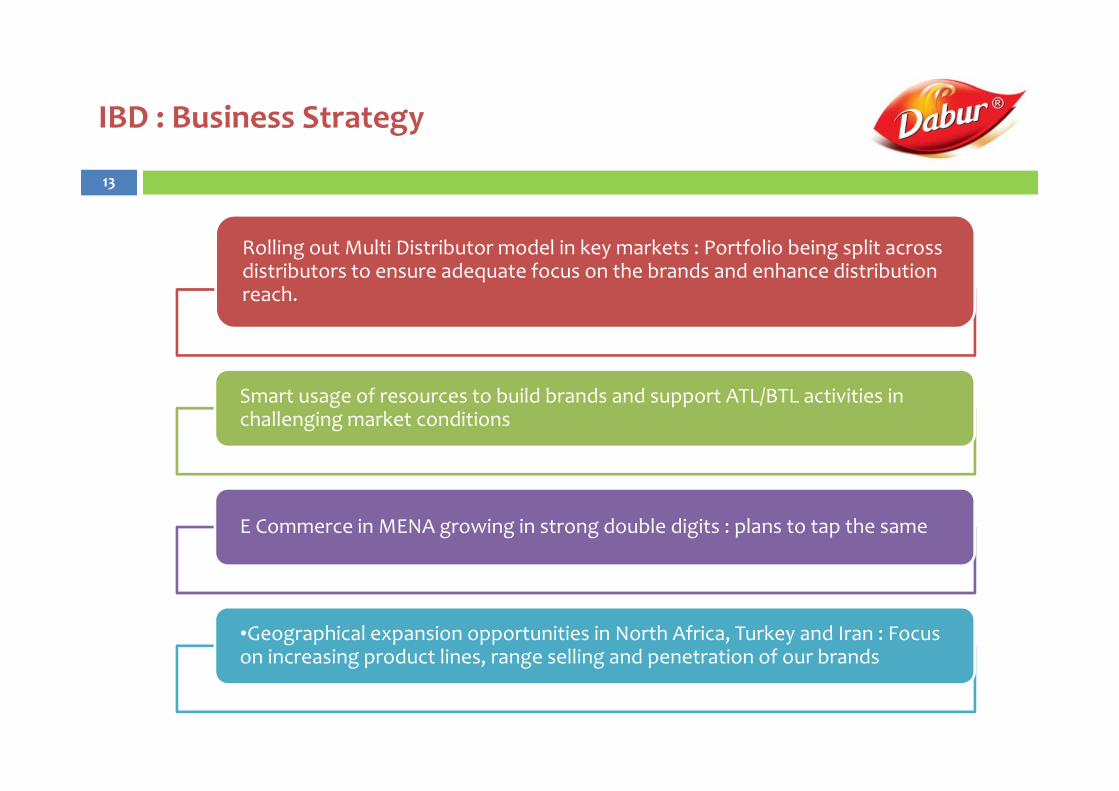
IBD : Business Strategy
13
Rolling out Multi Distributor model in key markets : Portfolio being split across distributors to ensure adequate focus on the brands and enhance distribution reach.
Smart usage of resources to build brands and support ATL/BTL activities in challenging market conditions
E Commerce in MENA growing in strong double digits : plans to tap the same
•Geographical expansion opportunities in North Africa, Turkey and Iran : Focus on increasing product lines, range selling and penetration of our brands

Bolt on acquisition in South Africa : Long & Lasting
14
• Dabur South Africa (Pty) Ltd. entered into Share Purchase Agreement to acquire 100%shareholding of D&A Cosmetics Proprietary Ltd and Atlanta Body and Health ProductsProprietary Ltd. on 17th May 2017
• The Companies operate the brand ‘Long & Lasting’ which offers a range of quality haircare products to African consumers
• Total consideration for the acquisition is ZAR 50 million (USD 3.7 million) which is 2.2xSales and 13x EBIDTA
• Acquisition to be completed by 1st June 2018 after completion of conditions precedent
Long & Lasting Brand offers a wide range of quality hair care products :
AftercareWeavesRelaxersBraidsDreadsTreatmentsSerums

Consolidated Profit & Loss : Q1FY2017‐18
15
DIL (Consolidated) P&L ‐ in Rs. crores Q1FY2017‐18 Q1FY2016‐17 YoY (%) FY2016‐17
Revenue from operations 1,790.1 1,952.2 ‐8.3% 7,701.4Other income 81.3 61.0 33.2% 298.3Total Income 1,871.3 2,013.2 ‐7.0% 7,999.8Material Cost 914.5 961.3 ‐4.9% 3843.2% of Revenue 51.1% 49.2% 49.9%
Employee Expense 203.5 211.5 ‐3.8% 789.6% of Revenue 11.4% 10.8% 10.3%
Advertising & Publicity 150.0 196.5 ‐23.6% 646.1
% of Revenue 8.4% 10.1% 8.4%
Other Expenses 213.1 234.0 ‐8.9% 913.5
% of Revenue 11.9% 12.0% 11.9%
Operating Profit 308.9 348.8 ‐11.5% 1,508.9 % of Revenue 17.3% 17.9% 19.6%EBITDA 390.2 409.8 ‐4.8% 1,807.3 % of Revenue 21.8% 21.0% 23.5%Finance Costs 13.3 11.8 12.3% 54.0
Depreciation & Amortization 39.1 34.3 13.8% 142.9Profit before exceptional items, tax and share of profit/(loss) from joint venture 337.8 363.7 ‐7.1% 1610.4
Exceptional Item 14.5 0.0 0.0Tax Expenses
Current Tax 55.6 65.6 311.0Deferred Tax 3.3 4.5 19.3
Net Profit After Tax (After Minority Interest) 264.1 292.8 ‐9.8% 1276.9% of Revenue 14.8% 15.0% 16.6%
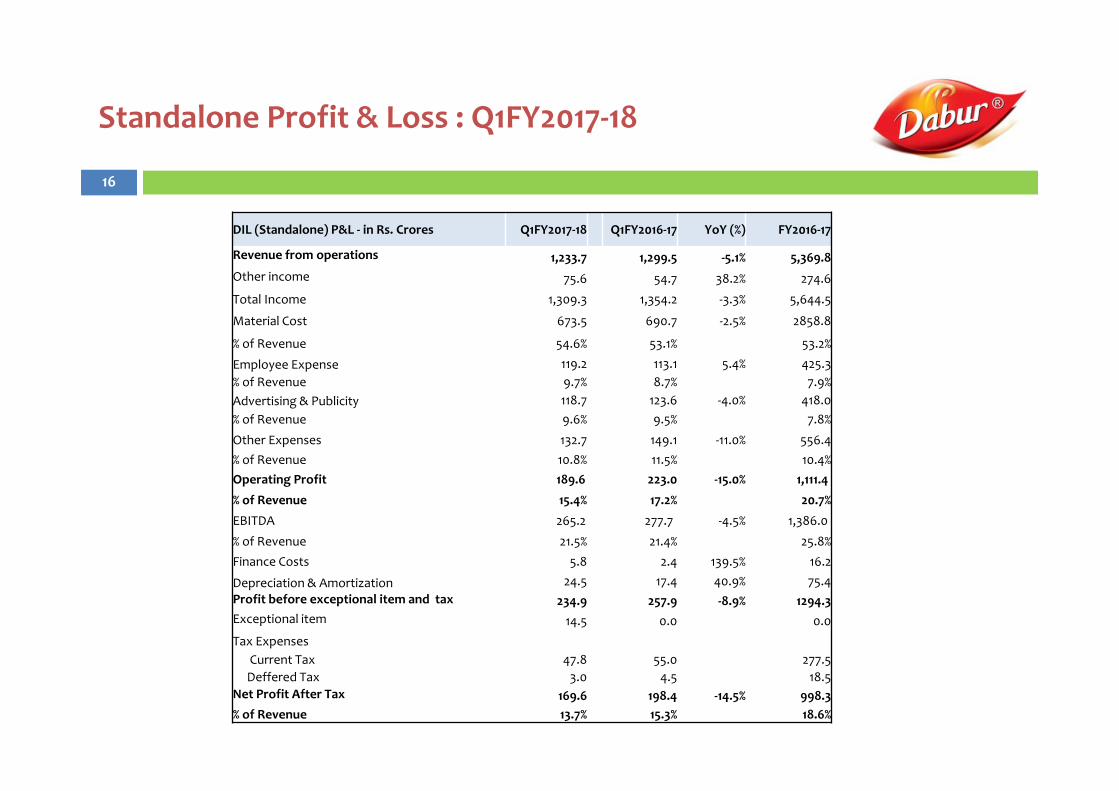
Standalone Profit & Loss : Q1FY2017‐18
16
DIL (Standalone) P&L ‐ in Rs. Crores Q1FY2017‐18 Q1FY2016‐17 YoY (%) FY2016‐17
Revenue from operations 1,233.7 1,299.5 ‐5.1% 5,369.8Other income 75.6 54.7 38.2% 274.6
Total Income 1,309.3 1,354.2 ‐3.3% 5,644.5
Material Cost 673.5 690.7 ‐2.5% 2858.8
% of Revenue 54.6% 53.1% 53.2%
Employee Expense 119.2 113.1 5.4% 425.3% of Revenue 9.7% 8.7% 7.9%Advertising & Publicity 118.7 123.6 ‐4.0% 418.0% of Revenue 9.6% 9.5% 7.8%
Other Expenses 132.7 149.1 ‐11.0% 556.4% of Revenue 10.8% 11.5% 10.4%Operating Profit 189.6 223.0 ‐15.0% 1,111.4
% of Revenue 15.4% 17.2% 20.7%
EBITDA 265.2 277.7 ‐4.5% 1,386.0
% of Revenue 21.5% 21.4% 25.8%Finance Costs 5.8 2.4 139.5% 16.2
Depreciation & Amortization 24.5 17.4 40.9% 75.4Profit before exceptional item and tax 234.9 257.9 ‐8.9% 1294.3Exceptional item 14.5 0.0 0.0Tax Expenses
Current Tax 47.8 55.0 277.5Deffered Tax 3.0 4.5 18.5
Net Profit After Tax 169.6 198.4 ‐14.5% 998.3% of Revenue 13.7% 15.3% 18.6%

Thank You
17