daily b - latibex brasil 15-10.pdf · ¨preview: redecard & visanet: 3q09 – the last time?...
TRANSCRIPT
DAILY BRAZIL
October 15 2009 Settlement: October 20 2009
Banco Espírito Santo de Investimento, S.A. Equity Iberia – Brazil
MARKET OVERVIEW MACROECONOMICS STEEL/MINING
Vale announces investments of R$ 9.5 billion in Minas Gerais BANKING
Preview: Redecard & VisaNet: 3Q09 – The Last Time? Banco Cruzeiro do Sul: Interest on capital
TELECOM / IT / MEDIA GVT: Sets date for Extraordinary General Meeting TOTVS: Acquires 70.0% of Totalbanco TOTVS: Acquisition of Hery
FOOD/BEVERAGES JBS: Department of Justice approves the acquisition of Pilgrim’s
AVIATION TAM: Air traffic statistics – Sep/09
MACRO CALENDAR CORPORATE CALENDAR SHORT INTEREST
Main Economic Figures
Brazil Date Local Time (BZ) Indicator Reference BES Estimates Consensus Last
15-Oct-09 09:00 BZ Retail Sales (MoM) AUG - - - - 0,50%15-Oct-09 09:00 BZ Retail Sales (YoY) AUG 3,5% - - 5,9%
International Date Local Time (BZ) Indicator Reference BES Estimates Consensus Last
15-Oct-09 01:30 JN Industrial Production YOY% AUG F - - - - -18,7%15-Oct-09 02:00 JN BOJ Monthly Report 15-Oct - - - - - -15-Oct-09 5:00 EC ECB Monthly Report 15-Oct - - - - - -15-Oct-09 6:00 EC Euro-Zone CPI (YoY) SEP - - -0,3% -0,2%15-Oct-09 06:00 EC Euro-Zone CPI - Core (YoY) SEP - - 1,2% 1,3%15-Oct-09 09:30 US Consumer Price Index (MoM) SEP - - 0,2% 0,4%15-Oct-09 09:30 US CPI Ex Food & Energy (MoM) SEP - - 0,1% 0,1%15-Oct-09 09:30 US Consumer Price Index (YoY) SEP - - -1,4% -1,5%15-Oct-09 09:30 US CPI Ex Food & Energy (YoY) SEP - - 1,4% 1,4%15-Oct-09 09:30 US Initial Jobless Claims 10-Oct - - 525K 521K15-Oct-09 09:30 US Empire Manufacturing OCT - - 18,0 18,915-Oct-09 11:00 US Philadelphia Fed. OCT - - 12,0 14,1
Brazilian Market 14-Oct Daily Chg. YTD Chg.Ibovespa 66.201.1 2.41% 76.30%IBX-50 9.283.5 2.43% 67.38%
Fixed Income/Yield 14-Oct 13-Oct 31-DecBR40 4.08% 4.06% 5.47%30y T-Bond 4.27% 4.20% 4.51%
IBOV Most Traded Stocks R$m Quantity (k) 6M Avg.*IBOVESPA 9.322.0 - 60.66%VALE PNA 1.514.4 37.893 2.77%PETROBRAS PN 514.0 783 0.87%ITAU UNIBANCO HOLDING P 783.1 21.668 4.11%GERDAU PN 267.6 7.266 2.02%BRADESCO PN 237.1 8.410 1.54%Blue Chips Daily Chg. Monthly Last PriceBradesco PN 2.48% 3.00% 37.20Brasil Tel Part PN -0.15% 5.80% 19.97Eletrobrás PNB 1.12% 0.70% 25.35Petrobras PN 0.92% 2.90% 36.15Telemar PN 1.17% -0.20% 33.81Vale PNA 4.61% 5.50% 40.41
Ibovespa - Top Gainers Daily Chg. Monthly Last PriceMETAL. GERDAU PN 6.47% 13.70% 35.89GERDAU PN 6.31% 13.50% 28.65GOL LINHAS AÉREAS PN 6.21% -3.60% 18.80TAM PN 5.42% 3.60% 25.11CYRELA ON 5.32% 14.90% 27.90
Ibovespa - Top Losers Daily Chg. Monthly Last PriceCOSAN ON -2.88% 6.60% 20.25MMX ON -1.86% 23.30% 13.19CESP PNB -1.65% 5.40% 22.59ELET. METROPOLITANA PN -1.11% 6.40% 38.15LIGHT ON -1.02% 7.20% 26.21
Other Stock Markets 14-Oct Daily Chg. YTD Chg.North AmericaDow Jones US 10.015.9 1.47% 15.54%Nasdaq US 2.172.2 1.51% 40.08%S&P 500 US 1.092.0 1.75% 22.61%EuropeDax Xetra GR 5.854.1 2.45% 21.70%IBEX 35 SM 11.870.9 2.26% 29.09%CAC 40 FP 5.783.4 2.54% 27.37%FTSE 100 LN 5.256.1 1.98% 19.66%PSI 20 PL 8.881.7 1.63% 39.70%AsiaNikkei JP 10.060.2 -0.16% 13.55%Emerging MarketsTOP 40 SJ 3.218.4 2.94% 56.33%Merval AR 2.224.3 1.38% 106.02%IGPA CI 29.5 0.39% 67.52%BUX HB 119.0 3.79% 83.52%JCI IJ 0.3 2.47% 116.56%IPC MX 2.358.6 1.39% 45.18%RTS RU 1.441.2 2.94% 130.44%Price Index Preview Oct-09 Last 2008IPCA 0.15% 0.36% 5.90%IGP-M -0.43% -0.10% 9.81%Indicators 14-Oct Daily Chg. YTD Chg.Dollar (R$/US$) 1.703 -1.39% -27.24%Brent (US$) 72.86 1.01% 92.24%*Volume traded as % of average daily volume for the last 6 months

Daily Brazil
October 15 2009
Banco Espírito Santo de Investimento, S.A. - 2 - Equity Iberia - Brazil
MARKET OVERVIEW Equity Market
BovespaClose (Points) 66.201
Variation 2,41%Trading Volume (Billion) R$ 9.323
Broker FlowLong & Short VALE5/VALE3 Foreign Asset Management
Meaningful Sales VALE3 Foreign Asset ManagementMeaningful Buys VALE3 Foreign Asset Management
Best/Worst PerformersTop Winners GOAU4 6,47% GGBR4 6,31% GOLL4 6,21%Top Losers CSAN3 -2,88% MMXM3 -1,86% CESP6 -1,65%
Short Position Comments
Trading volume was good in equity rental markets this Wednesday, with the main highlight being Gerdau PN (GGBR4), trading at 2.20% p.a., in line with its 21-day average.
Exchange Rate
The US Dollar weakened against most currencies, led by the Euro that surpassed 1.49 level, as wells as the BRL Real that strengthened below 1.70 BrlUsd. We have seen strong risk taken worldwide on equities and commodities markets, which have supported local currency performance, due to better than estimated economics in China, with trade balance and credit concession, and US that posted improvements on Advanced Retail Sales. Now markets will be focused on US CPI, jobless claim and Empire Manufacturing index, not to mention corporate releases as Goldman Sachs, Citibank, IBM and Google. The Crude Oil (CL1) closed above $75.0 per barrel and the 10yr Treasuries Yield closed at 3.41%.
The USD closed at R$ 1.70 down 1.39%.
Interest Rates
The local yield curve shifted slightly down, redeeming part of the market premium on rates, as discussions about inflation and some other fiscal matters rested at this session. Meanwhile, on the activity fieldwe faced positive readings on CAGED job report when it posted 151 thousand creations in September, consolidating the labor market recovery this year. Now markets will be focused on the Advanced Retail Sales of August. The 180 and 360 day’s rates closed at 8,93% and 9,93%, respectively.
MACROECONOMICS Market participants witnessed a positive session on Wednesday in the wake of a favourable news flow both on the domestic and international fronts. Abroad, economic activity figures regarding advanced economies and corporate results in US came in mostly better than expected and boosted investors’ confidence on the chances of a faster world economic recovery. In the US advance retail sales fell less in Sep09 than market median forecast was pointing out (-1.5% MoM versus consensus of -2.1% MoM), with the same behaviour – which was even more important – being observed when excluding motor vehicles and parts, which points towards a more widespread consumption recovery rather than one just based on the cash-for-clunkers program.
In Brazil the highlight was the release of the monthly Labour Ministry’s survey (dubbed CAGED) about hiring and dismissal figures in the formal economy. According to it, the Brazilian firms increased their payrolls by 252,617 workers in Sep09, which led the net hiring to have reached almost one million in YTD terms (creation of 932,651 new jobs). The outcome reinforced the general view that Brazilian economy is prone to keep on expanding in the coming months. However, it is important to say the hiring rhythm has seemingly decelerated in seasonal adjusted terms, which underpins our assessment the country is unlikely to face important inflationary pressures in the short term.

Daily Brazil
October 15 2009
Banco Espírito Santo de Investimento, S.A. - 3 - Equity Iberia - Brazil
STEEL/MINING
Vale announces investments of R$ 9.5 billion in Minas Gerais Company Ticker Rating Target Price Upside Last Price R$ YTD P/E 09E EV/EBTIDA 09E DY 09E
VALE PNA vale5 Not Rated - - 40.4 64.5 - - - VALE ON vale3 Not Rated - - 45.3 58.7 - - -
Analyst: Juliano Navarro - [email protected] (11) 3074 7320 Vale entered into an investment agreement totaling R$ 9.5 billion with the State of Minas Gerais. The projects are subject to approval of company’s Board of Directors. Investments include three iron ore projects: Apolo, Conceição Itabiritos and Vargem Grande Itabiritos. Although Vale has not released further details regarding the investment, Apolo’s mine, which was already part of Vale’s projects pipeline, shall comprise a production capacity of 24 million tons of iron ore and will be part of the Southern System. The project is budgeted at US$ 2.5 billion and the start up is expected to be in 1H13. By the end of October, Vale shall release its investment plan (CAPEX) for 2010, which may contain further details concerning the new projects announced. We believe that the investment budget for 2010 will be higher than 2009’s plan, which was budgeted at US$ 9 billion.
Vale had a meeting with the Governor of Minas Gerais and Secretaries of the State before announcing the investments. According to the Governor, Itabiritos and Vargem Grande Itabiritos projects comprise two iron ore beneficiation plants. The first would be installed in Itabira, at Conceição’s mine, which is part of the Southern System. The processing capacity totals 5 million tons of iron ore per annum, with an estimated investment of R$ 2.68 billion. The second beneficiation plant, Vargem Grande Itabiritos, would be able to process 10 million tons of ore from Abóboras, Tamanduá and Capitão do Mato mines, which are all located in the complex of Vargem Grande, in the Southern System. The estimated investment for Vargem Grande plant totals R$ 2.3 billion and such project is expected to be concluded in Oct/2012.
Opinion: The inclusion of two new projects of iron ore beneficiation plants in Vale's investment plan is positive. In our view, it emphasizes company’s optimism concerning the iron ore market and indicates that Vale continues to focus on organic growth. In addition, the investment in beneficiation projects leads to a larger production capacity of ore with higher value added, thus increasing the competitiveness of sales in the foreign market.
Vale’s priority is to expand its iron ore capacity. Projects shall be put into practice more quickly as of 2010, as company’s optimism has increased toward the global consumption of iron ore, especially in China. According to Vale, recent months have indicated that the global economic scenario improved and China reported a strong pace in steel production and, therefore, in the consumption of ore. The strong imports of iron ore by China in September, which summed up 64.5 million tons, a 30% increase compared to August, evidence the strong consumption of ore in the region. Vale already foresees recovery signs in the demand of iron ore in other regions as well as, such as in Europe, which shall be reflected on a more rapid recovery in sales volumes of iron ore in the 2H09. In addition to investments in new capacities, Vale will also invest capital in the restructuring of mines that have a high cost structure, an important decision that may gradually reduce company’s consolidated iron ore production cost.
BANKING
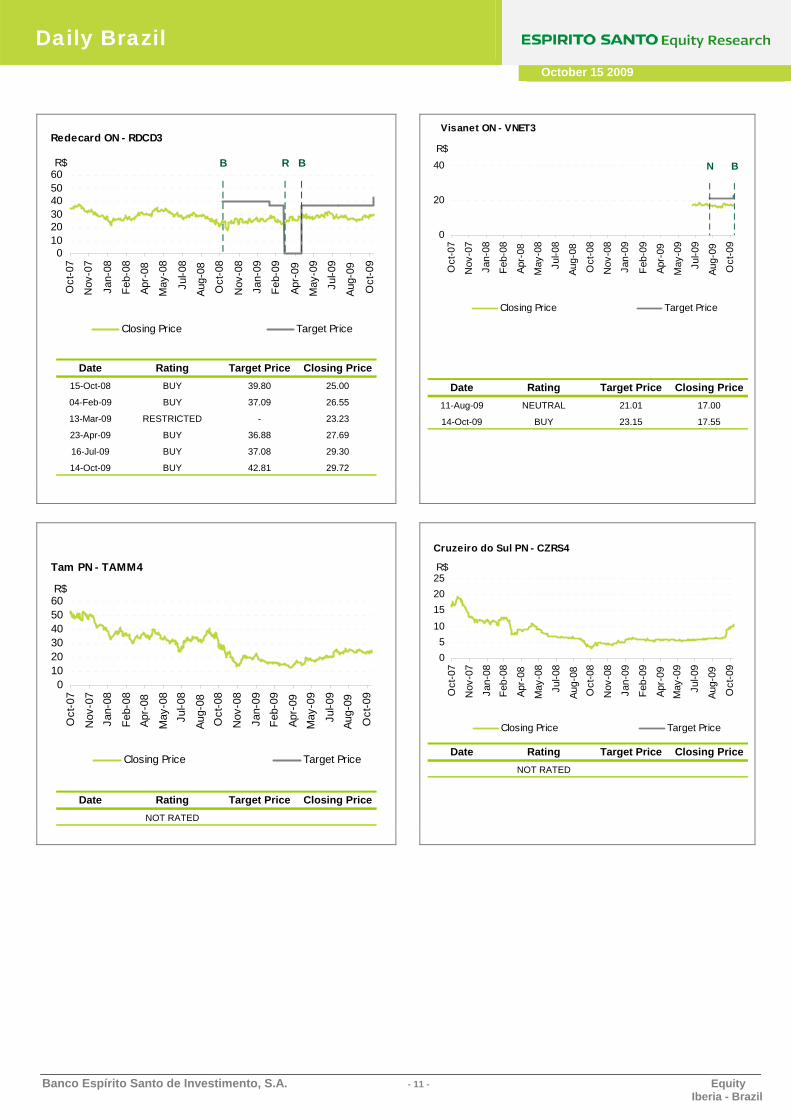
Preview: Redecard & VisaNet: 3Q09 – The Last Time? Company Ticker Rating Target Price Upside Last Price R$ YTD P/E 09E EV/EBTIDA 09E DY 09E
REDECARD ON rdcd3 BUY 42.8 45.4% 29.5 20.5 14.26 9.1 5.5% VISANET ON vnet3 BUY 23.2 31.9% 17.6 - - - -
Analyst: Mariana Moraes de Barros - [email protected] (11) 3074 7356 The main change in our scenario for 2010 in relation to the acquiring companies was in our discount rate (Ke) due to the drop in the level of Brazil’s sovereign risk from 250 bps to 200 bps. As a result our nominal cost of equity capital falls from 13.7% to 13.2%.
Because of this, our target price for Redecard rose from R$ 37.08 to R$ 42.81 and we are giving the company’s stock a BUY recommendation, which denotes an upside potential of 44.1%. While in the case of VisaNet the target price climbed from R$ 21.01 to R$ 23.15 and we are changing our recommendation from NEUTRAL to BUY together with a potential upside of 31.9%.
We prefer Redecard to VisaNet not only due to a higher potential upside in the stock but also because we believe Redecard is in a better position in the acquiring of new brands when compared to VisaNet. More than this, VisaNet is “suck” in the exclusivity agreement with Visa brand until June 2010.

Daily Brazil
October 15 2009
Banco Espírito Santo de Investimento, S.A. - 4 - Equity Iberia - Brazil
Banco Cruzeiro do Sul: Interest on capital Company Ticker Rating Target Price Upside Last Price R$ YTD P/E 09E EV/EBTIDA 09E DY 09E
CRUZEIRO DO SUL PN czrs4 Not Rated - - 10.2 131.6 - - -Analyst: Mariana Moraes de Barros - [email protected] (11) 3074 7356
Approval was given at a board meeting of Banco Cruzeiro do Sul to pay interest on equity to the tune of R$ 15.5 million per share, based on the 3Q09 results, or R$0.1145 per share which represent a dividend yield of 1.1%, based on the closing price of Oct 14. The payment will be made on the 27th October 2009, and the shares will go ex-interest on October 15st 2009.
TELECOM / IT / MEDIA
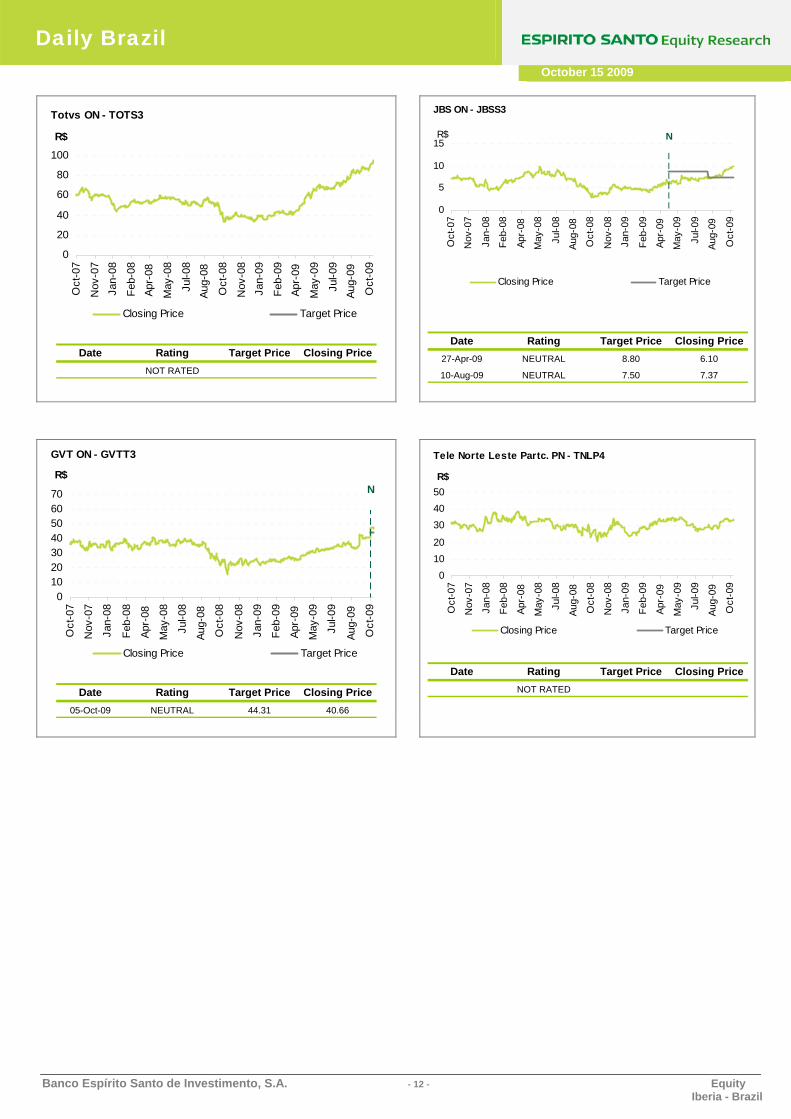
GVT: Sets date for Extraordinary General Meeting Company Ticker Rating Target Price Upside Last Price R$ YTD P/E 09E EV/EBTIDA 09E DY 09E
GVT HOLDING ON gvtt3 NEUTRAL 44.3 -5.1% 46.7 85.3 - - - TELEMAR NORTE LESTE PN tnlp4 Not Rated - - 33.8 24.1 - - -
TELEMAR PNA tmar5 Not Rated - - 61.4 18.5 - - - TELESP PN tlpp4 Not Rated - - 45.2 5.2 - - -
NET SERVIÇOS PN netc4 Not Rated - - 23.4 68.3 - - -Analyst: Gilberto Pereira de Souza - [email protected] (11) 3074 7325
GVT's Board of Directors held an extraordinary meeting on October 13, 2009 at which it decided to convene an EGM to vote on the waiver of the poison pill clause in its bylaws, to enable the bid by Telefonica (TLPP) to proceed. According to the company, in addition to the setting of the date (November 3, 2009) it was also decided that: (i) any bid must be made by a Qualified Bidder; (ii) financial settlement must be by February 28, 2010, and (iii) payment for the acquisition of the company's shares must be in cash. We point out that the Board of Directors defines a Qualified Bidder as a company that: (i) has the financial capacity to acquire 100% of the shares of GVT a for a minimum price of R$ 48.00 per share; and (ii) is an operator or provider of public fixed, mobile phone and broadband services, in Brazil or abroad, either directly or through one of its subsidiaries or affiliated companies. The Board of Directors confirmed that both Vivendi and Telesp fall within the category of Qualified Bidders.
Opinion. We are maintaining our NEUTRAL recommendation for the company's shares, while we do not see any potential upside for the shares based on fundamentals. Although there may still be a counter bid (by Vivendi or some other telecommunications group), we believe that such a possibility is relatively small, due to the fact that Telesp's bid is 8.3% higher than the fair price we have estimated for the company to the end of 2010. As a consequence, we are recommending the sale of the company's shares at the auction to be held by Telesp on November 19, 2009. Our greatest concern about this deal is the risk of Anatel not issuing approval by November 19, 2009. We do not believe that there should any regulatory obstacles to approval, but the time involved is relatively short (less than 43 days since the announcement of the bid by Telesp). It should also be borne in mind that there are no time limits set for approvals of this type by Anatel. Taking the most recent deals, we point out that Anatel took 30 days to issue a ruling in the case of the Oi/BrT merger, while taking approximately one year to approve the purchase of BigTV by NET.
TOTVS: Acquires 70.0% of Totalbanco Company Ticker Rating Target Price Upside Last Price R$ YTD P/E 09E EV/EBTIDA 09E DY 09E
TOTVS ON tots3 Not Rated - - 95.0 158.8 - - -Analyst: Gilberto Pereira de Souza - [email protected] (11) 3074 7325
On October 13, 2009 TOTVS (TOTS) announced the acquisition of 70.0% of the paid-up capital of TotalBanco, a company that operates in the consultancy segment - developing applications for the financial market - for approximately R$ 17.6 million. The company has also signed an agreement for a call option on the remaining 30.0% of the capital of TotalBanco to be exercised in 2011, for a figure which could be as much as R$ 12.2 million, depending on the company's performance over the period.
Opinion: We believe this deal to be positive for TOTVS as it adds another service to the company's portfolio, while the acquisition was made at an EV/EBITDA09 multiple that is lower than the company’s (5.5x, while TOTVS is trading at 6.0x). However, as the value of the acquisition is relatively small, representing less than 2% of TOTVS's market capitalisation, we do not believe that it will have any significant impact on the company's share price.
Daily Brazil
October 15 2009
Banco Espírito Santo de Investimento, S.A. - 5 - Equity Iberia - Brazil
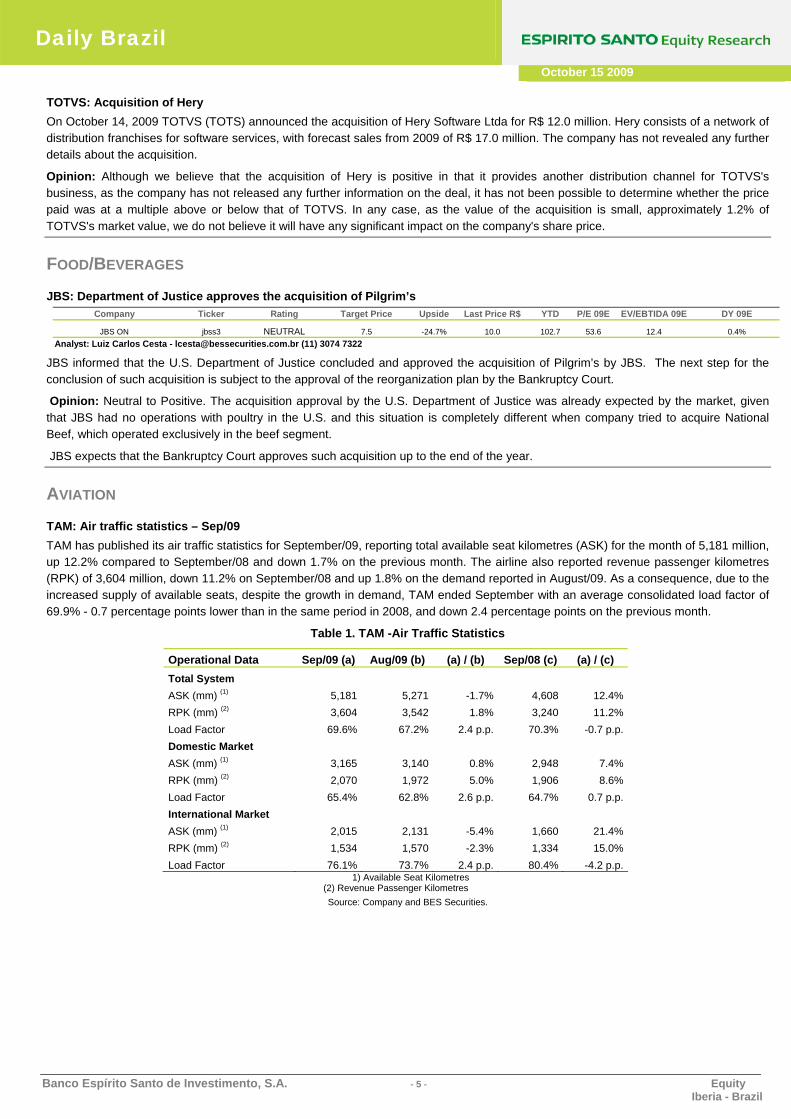
TOTVS: Acquisition of Hery On October 14, 2009 TOTVS (TOTS) announced the acquisition of Hery Software Ltda for R$ 12.0 million. Hery consists of a network of distribution franchises for software services, with forecast sales from 2009 of R$ 17.0 million. The company has not revealed any further details about the acquisition.
Opinion: Although we believe that the acquisition of Hery is positive in that it provides another distribution channel for TOTVS's business, as the company has not released any further information on the deal, it has not been possible to determine whether the price paid was at a multiple above or below that of TOTVS. In any case, as the value of the acquisition is small, approximately 1.2% of TOTVS's market value, we do not believe it will have any significant impact on the company's share price.
FOOD/BEVERAGES
JBS: Department of Justice approves the acquisition of Pilgrim’s Company Ticker Rating Target Price Upside Last Price R$ YTD P/E 09E EV/EBTIDA 09E DY 09E
JBS ON jbss3 NEUTRAL 7.5 -24.7% 10.0 102.7 53.6 12.4 0.4%Analyst: Luiz Carlos Cesta - [email protected] (11) 3074 7322
JBS informed that the U.S. Department of Justice concluded and approved the acquisition of Pilgrim’s by JBS. The next step for the conclusion of such acquisition is subject to the approval of the reorganization plan by the Bankruptcy Court.
Opinion: Neutral to Positive. The acquisition approval by the U.S. Department of Justice was already expected by the market, given that JBS had no operations with poultry in the U.S. and this situation is completely different when company tried to acquire National Beef, which operated exclusively in the beef segment.
JBS expects that the Bankruptcy Court approves such acquisition up to the end of the year.
AVIATION
TAM: Air traffic statistics – Sep/09 TAM has published its air traffic statistics for September/09, reporting total available seat kilometres (ASK) for the month of 5,181 million, up 12.2% compared to September/08 and down 1.7% on the previous month. The airline also reported revenue passenger kilometres (RPK) of 3,604 million, down 11.2% on September/08 and up 1.8% on the demand reported in August/09. As a consequence, due to the increased supply of available seats, despite the growth in demand, TAM ended September with an average consolidated load factor of 69.9% - 0.7 percentage points lower than in the same period in 2008, and down 2.4 percentage points on the previous month.
Table 1. TAM -Air Traffic Statistics
Operational Data Sep/09 (a) Aug/09 (b) (a) / (b) Sep/08 (c) (a) / (c) Total System ASK (mm) (1) 5,181 5,271 -1.7% 4,608 12.4% RPK (mm) (2) 3,604 3,542 1.8% 3,240 11.2% Load Factor 69.6% 67.2% 2.4 p.p. 70.3% -0.7 p.p. Domestic Market ASK (mm) (1) 3,165 3,140 0.8% 2,948 7.4% RPK (mm) (2) 2,070 1,972 5.0% 1,906 8.6% Load Factor 65.4% 62.8% 2.6 p.p. 64.7% 0.7 p.p. International Market ASK (mm) (1) 2,015 2,131 -5.4% 1,660 21.4% RPK (mm) (2) 1,534 1,570 -2.3% 1,334 15.0% Load Factor 76.1% 73.7% 2.4 p.p. 80.4% -4.2 p.p.
1) Available Seat Kilometres (2) Revenue Passenger Kilometres Source: Company and BES Securities.

Daily Brazil
October 15 2009
Banco Espírito Santo de Investimento, S.A. - 6 - Equity Iberia - Brazil
Chart 1. TAM - Operating Figures
-
1,000
2,000
3,000
4,000
5,000
6,000
Sep-07
Nov-07
Jan-08
Mar-08
May-08
Jul-0
8
Sep-08
Nov-08
Jan-09
Mar-09
May-09
Jul-0
9
Sep-09
55%
60%
65%
70%
75%
80%
ASK (mm) RPK (mm) Load Factor
Source: Company and BES Securities.
In the domestic market, TAM reported an increase in the number of seats available compared to the same period in 2008, while being slightly up on August/09. It is also worth mentioning that the increase in seats available compared to Sep/08, of 7.4%, was below the average market growth taking the same comparison period. However, compared to Aug/09, TAM reported a slight increase in available seats of 0.8%, while the market as a whole reported a contraction of 1.8%.
On the demand side, TAM's RPK was up 8.6% and 5.0% compared to Sep/08 and Aug/09, respectively. While this was below the expansion in the market of 29.9% compared to Sep/08, it was higher than the market growth of 4.2% compared to the previous month.
Despite this, TAM ended Sep/09 with a domestic market share of 44.1%, higher than in the figure in Aug/09 of 43.8% (this compares to 52.8% in Sep/08). We believe that, due to the fact that the company has chosen to move in the opposite direction to its competitors (TAM has opted to increase its number of available seats compared to Aug/09), this has negatively impacted its load factor, which is 1.0% below the market average.
For the international market, it should be borne in mind that only Brazilian companies were included in the research. Thus, in this market TAM reported an increase in seats available of 21.4% compared to Sep/08, while the figure was down 5.4% compared to Aug/09. Meanwhile the average increase in available seats in the market as a whole was only 11.0% compared to Sep/08, while being down 6.4% compared to Aug/09. The reason for TAM's growth being higher than that for the market as a whole, compared to Sep/08, is due to the inauguration of various new routes, and particularly passengers switching over to the airline, as its main competitor has chosen to reduce the size of its international network.
In demand terms (RPK), TAM reported an increase of 15.0% compared to Sep/08, and a drop of 2.3% compared to Aug/09. While the average growth in demand for the market as a whole amounted to 8.1% compared to the same month in 2008, while showing an increase of 0.1% compared to Aug/09. As a result of passengers switching airlines, as explained above, growth in demand at TAM was higher than the market average, compared to Sep/08. While compared to Aug/09, we believe that due to the competitive prices practised by its main competitor, demand at TAM saw a slight drop, while demand in the market as a whole increased by 0.1%.
TAM ended Sep/09 with a domestic market share of 87.3%, lower than that in Aug/09 of 89.4% (which also compares to 82.1% in Sep/08). Despite the drop in market share, TAM's load factor in Sep/09 was 3.6 p.p. higher than its competitors. Compared to Sep/08, TAM reported a more pronounced drop in load factor than the market as a whole, which we believe is due to the inauguration of new routes; while compared to Aug/09, TAM's load factor increase was less than that of the market, which is explained by the more aggressive prices being practised by the airline's main competitor.

Daily Brazil
October 15 2009
Banco Espírito Santo de Investimento, S.A. - 7 - Equity Iberia - Brazil
Table 2. Market data
Market Data Sep/09 (a) Aug/09 (b) (a)/(b) Sep/08 (c) (a)/(c) Total System ASK (mm) (1) 9,445 9,736 -3.0% 8,037 17.5% RPK (mm) (2) 6,447 6,258 3.0% 5,235 23.2% Load Factor 68.3% 64.3% 4.0 p.p. 65.1% 3.1 p.p.
Domestic Market ASK (mm) (1) 7,060 7,188 -1.8% 5,889 19.9% RPK (mm) (2) 4,689 4,502 4.2% 3,609 29.9% Load Factor 66.4% 62.6% 3.8 p.p. 61.3% 5.1 p.p.
International Market ASK (mm) (1) 2,385 2,548 -6.4% 2,148 11.0% RPK (mm) (2) 1,758 1,756 0.1% 1,625 8.1% Load Factor 73.7% 68.9% 4.8 p.p. 75.7% -2.0 p.p.
1) Available Seat Kilometres (2) Revenue Passenger Kilometres
Source: Company and BES Securities
Taking a quarterly comparison, at the end of 3Q09 TAM reported available seat kilometres (ASK) of 15,840 million, up 11.7% compared to 3Q08 and down 1.5% compared to the previous quarter. Revenue passenger kilometres (RPK) totalled 11,075 million, up 8.2% compared to the same period in 2008 and down 10.0% compared to the demand reported in 2Q09. Seasonal factors come into play when comparing the third quarter with the second quarter due to the holiday period in the third quarter; this led the growth in demand to be higher than the increase in the number of seats available, with a consequent increase in load factor of 5.4 p.p.. Compared to the previous year, the increase in demand was not sufficient to keep pace with the significant rise in the number of seats available. As a consequence, compared to 3Q08, the load factor was down by 2.3 .p.p..
Table 3. TAM - Quarterly Add Traffic Statistics
Operational Data 3Q09 (a) 2Q09 (b) (a) / (b) 3Q08 (c) (a) / (c) Total System ASK (mm) (1) 15,840 15,598 1.5% 14,181 11.7% RPK (mm) (2) 11,075 10,068 10.0% 10,239 8.2% Load Factor 69.9% 64.5% 5.4 p.p. 72.2% -2.3 p.p. Domestic Market ASK (mm) (1) 9,511 9,380 1.4% 8,989 5.8% RPK (mm) (2) 6,339 5,791 9.5% 6,077 4.3% Load Factor 66.7% 61.7% 4.9 p.p. 67.6% -1.0 p.p. International Market ASK (mm) (1) 6,329 6,218 1.8% 5,192 21.9% RPK (mm) (2) 4,736 4,277 10.7% 4,162 13.8% Load Factor 74.8% 68.8% 6.0 p.p. 80.2% -5.3 p.p.
1) Available Seat Kilometres (2) Revenue Passenger Kilometres
Source: Company and BES Securities
Opinion: Negative for the shares of TAM. The market figures for September 2009 indicate that airlines in general adopted very aggressive pricing, while the figures released by TAM show that the company also adopted this practice, resulting in reduced yields.
Daily Brazil
October 15 2009
Banco Espírito Santo de Investimento, S.A. - 8 - Equity Iberia - Brazil
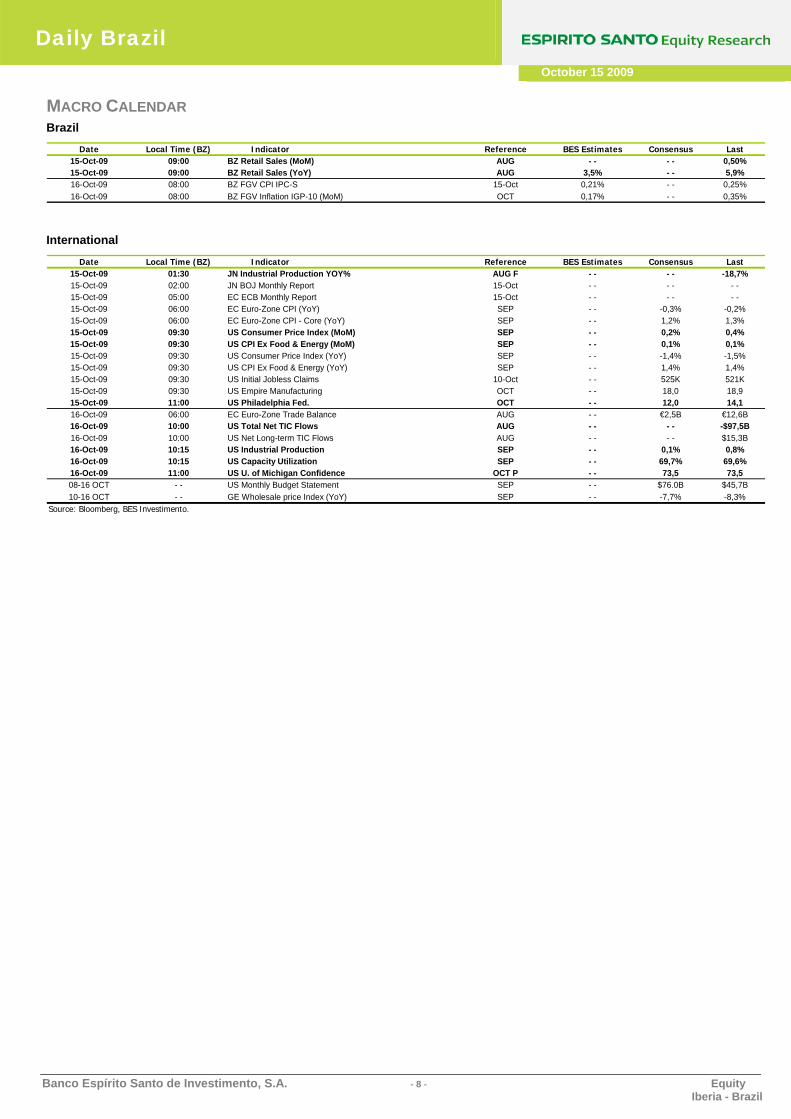
MACRO CALENDAR Brazil
Date Local Time (BZ) Indicator Reference BES Estimates Consensus Last15-Oct-09 09:00 BZ Retail Sales (MoM) AUG - - - - 0,50%15-Oct-09 09:00 BZ Retail Sales (YoY) AUG 3,5% - - 5,9%16-Oct-09 08:00 BZ FGV CPI IPC-S 15-Oct 0,21% - - 0,25%16-Oct-09 08:00 BZ FGV Inflation IGP-10 (MoM) OCT 0,17% - - 0,35%
International
Date Local Time (BZ) Indicator Reference BES Estimates Consensus Last15-Oct-09 01:30 JN Industrial Production YOY% AUG F - - - - -18,7%15-Oct-09 02:00 JN BOJ Monthly Report 15-Oct - - - - - -15-Oct-09 05:00 EC ECB Monthly Report 15-Oct - - - - - -15-Oct-09 06:00 EC Euro-Zone CPI (YoY) SEP - - -0,3% -0,2%15-Oct-09 06:00 EC Euro-Zone CPI - Core (YoY) SEP - - 1,2% 1,3%15-Oct-09 09:30 US Consumer Price Index (MoM) SEP - - 0,2% 0,4%15-Oct-09 09:30 US CPI Ex Food & Energy (MoM) SEP - - 0,1% 0,1%15-Oct-09 09:30 US Consumer Price Index (YoY) SEP - - -1,4% -1,5%15-Oct-09 09:30 US CPI Ex Food & Energy (YoY) SEP - - 1,4% 1,4%15-Oct-09 09:30 US Initial Jobless Claims 10-Oct - - 525K 521K15-Oct-09 09:30 US Empire Manufacturing OCT - - 18,0 18,915-Oct-09 11:00 US Philadelphia Fed. OCT - - 12,0 14,116-Oct-09 06:00 EC Euro-Zone Trade Balance AUG - - €2,5B €12,6B16-Oct-09 10:00 US Total Net TIC Flows AUG - - - - -$97,5B16-Oct-09 10:00 US Net Long-term TIC Flows AUG - - - - $15,3B16-Oct-09 10:15 US Industrial Production SEP - - 0,1% 0,8%16-Oct-09 10:15 US Capacity Utilization SEP - - 69,7% 69,6%16-Oct-09 11:00 US U. of Michigan Confidence OCT P - - 73,5 73,508-16 OCT - - US Monthly Budget Statement SEP - - $76.0B $45,7B10-16 OCT - - GE Wholesale price Index (YoY) SEP - - -7,7% -8,3%
Source: Bloomberg, BES Investimento.

Daily Brazil
October 15 2009
Banco Espírito Santo de Investimento, S.A. - 9 - Equity Iberia - Brazil
CORPORATE CALENDAR
12 13 14 15 16
19 20 21 22 23Natura-(NATU) 3Q09Release OI-(TNLP/TMAR) 3Q09Release/After Natura-(NATU) Conference Call 3Q09
Net-(NETC)3Q09Release/Before OI-(TNLP/TMAR) Conference Call 3Q09/11h00
Portuguese/13h00 English
Net-(NETC)Conference Call 3Q09/10h00
Portuguese/12h00 EnglishSuzano-(SUZB) 3Q09Release
Usiminas-(USIM) 3Q09Release
26 27 28 29 30
Weg-(WEGE)3Q09Release Klabin-(KLBN) 3Q09Release/Before
Klabin-(KLBN)Conference Call 3Q09/10hh00
Portuguese/11h00 English Vale do Rio Doce-(VALE)Conference Call 3Q09/12h00
Portuguese/English BRF-(PRGA)Conference Call 3Q09
Lojas Renner-(LREN) 3Q09Release Vale do Rio Doce-(VALE) 3Q09Release/After BRF-(PRGA) 3Q09ReleaseComgás-(CGAS) 3Q09Release Lojas Renner-(LREN) Conference Call 3Q09 Romi-(ROMI) Conference Call 3Q09Weg-(WEGE) Conference Call 3Q09 Romi-(ROMI) 3Q09Release
2 3 4 5 6Braskem-(BRKM) 3Q09Release/Before Braskem-(BRKM) Conference Call 3Q09 Providência-(PRVI) Conference Call 3Q09 Braskem-(BRKM) Analysts meeting
Grupo Pão de Açúcar-(PCAR) 3Q09Release Marfrig-(MRFG) Conference Call 3Q09 M.Dias Branco-(MDIA) Conference Call 3Q09Providência-(PRVI) 3Q09Release Positivo-(POSI) Conference Call 3Q09 Lojas Americanas-(LAME) Conference Call 3Q09Marfrig-(MRFG) 3Q09Release M.Dias Branco-(MDIA) 3Q09Release B2W-(BTOW) Conference Call 3Q09Positivo-(POSI) 3Q09Release Lojas Americanas-(LAME) 3Q09Release Iochpe-Maxion-(MYPK) Conference Call 3Q09Fras-Le-(FRAS) 3Q09Release B2W-(BTOW) 3Q09Release Randon-(RAPT) 3Q09Release
Gerdau-(GGBR) 3Q09ReleaseGerdau-(GGBR) Conference Call 3Q09Fras-Le-(FRAS) Conference Call 3Q09Iochpe-Maxion-(MYPK) 3Q09Release
Monday Tuesday Wednesday Thursday Friday
October 2009
Monday Tuesday Wednesday Thursday Friday
November 2009
Legend: Before - Before Market Opening
After - After Market Closing
Brazilian Holidays
Daily Brasil
October 14, 2009
EquityIberia - Brazil
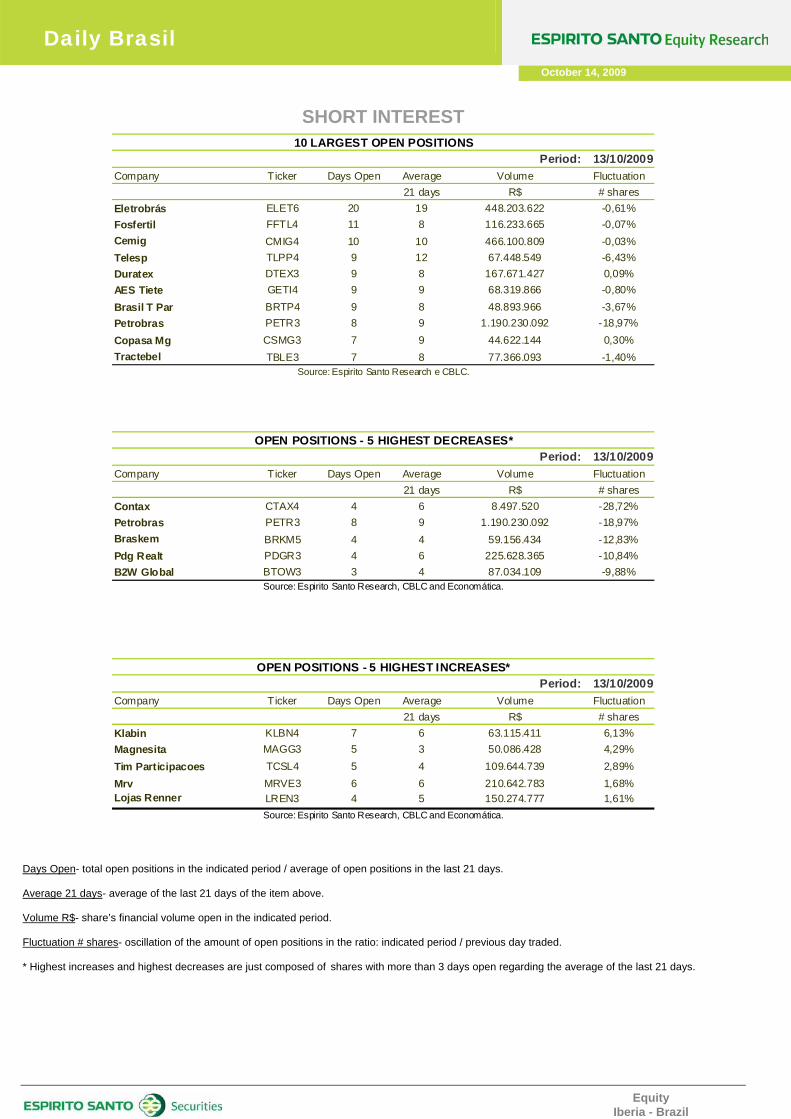
SHORT INTEREST
Period: 13/10/2009Company Ticker Days Open Average Volume Fluctuation
21 days R$ # sharesEletrobrás ELET6 20 19 448.203.622 -0,61%Fosfertil FFTL4 11 8 116.233.665 -0,07%Cemig CMIG4 10 10 466.100.809 -0,03%Telesp TLPP4 9 12 67.448.549 -6,43%Duratex DTEX3 9 8 167.671.427 0,09%AES Tiete GETI4 9 9 68.319.866 -0,80%Brasil T Par BRTP4 9 8 48.893.966 -3,67%Petrobras PETR3 8 9 1.190.230.092 -18,97%Copasa Mg CSMG3 7 9 44.622.144 0,30%Tractebel TBLE3 7 8 77.366.093 -1,40%
10 LARGEST OPEN POSITIONS
Source: Espirito Santo Research e CBLC.
Period: 13/10/2009Company Ticker Days Open Average Volume Fluctuation
21 days R$ # sharesContax CTAX4 4 6 8.497.520 -28,72%Petrobras PETR3 8 9 1.190.230.092 -18,97%Braskem BRKM5 4 4 59.156.434 -12,83%Pdg Realt PDGR3 4 6 225.628.365 -10,84%B2W Global BTOW3 3 4 87.034.109 -9,88%
OPEN POSITIONS - 5 HIGHEST DECREASES*
Source: Espirito Santo Research, CBLC and Economática.
Period: 13/10/2009Company Ticker Days Open Average Volume Fluctuation
21 days R$ # sharesKlabin KLBN4 7 6 63.115.411 6,13%Magnesita MAGG3 5 3 50.086.428 4,29%Tim Participacoes TCSL4 5 4 109.644.739 2,89%Mrv MRVE3 6 6 210.642.783 1,68%Lojas Renner LREN3 4 5 150.274.777 1,61%
Source: Espirito Santo Research, CBLC and Economática.
OPEN POSITIONS - 5 HIGHEST INCREASES*
Days Open- total open positions in the indicated period / average of open positions in the last 21 days. Average 21 days- average of the last 21 days of the item above. Volume R$- share’s financial volume open in the indicated period. Fluctuation # shares- oscillation of the amount of open positions in the ratio: indicated period / previous day traded. * Highest increases and highest decreases are just composed of shares with more than 3 days open regarding the average of the last 21 days.

EquityIberia - Brazil
DAILY BRAZIL
October 14 2009
SHORT INTEREST 13/10/2009
Ticker Name Open Volume Average Ticker Name Open Volume Average Ticker Name Open Volume AverageDays 21 days Days 21 days Days 21 days
ABYA3 Abyara 0 R$ 20.250 0 DTEX3 Duratex 9 R$ 167.671.427 8 OGXP3 OGX Petróleo 2 R$ 388.177.778 1AGIN3 Agra Incorp 1 R$ 12.441.092 1 ECOD3 Brasil Ecodiesel 0 R$ 165.263 0 PCAR5 Pão de Açúcar 4 R$ 149.858.636 7
ALLL11 All America Latina 3 R$ 183.745.716 2 ELET3 Eletrobrás 2 R$ 47.958.618 2 PDGR3 Pdg Realt 4 R$ 225.628.365 6AMBV3 Ambev 3 R$ 19.677.931 3 ELET6 Eletrobrás 20 R$ 448.203.622 19 PETR3 Petrobras 8 R$ 1.190.230.092 9AMBV4 Ambev 5 R$ 240.072.549 8 ELPL6 Eletropaulo Metropo 3 R$ 59.675.181 4 PETR4 Petrobras 2 R$ 1.113.927.951 3ARCZ6 Aracruz 1 R$ 39.042.352 1 EMBR3 Embraer 2 R$ 67.924.566 2 PLAS3 Plascar 0 R$ 19.479 0BBAS3 Brasil 5 R$ 480.876.678 6 ENBR3 Energias Br 5 R$ 49.690.682 5 POSI3 Positivo 0 R$ 366.024 0BBDC3 Bradesco 0 R$ 213.538 0 FFTL4 Fosfertil 11 R$ 116.233.665 8 PRGA3 BRF Foods 1 R$ 83.266.990 3BBDC4 Bradesco 4 R$ 817.863.079 6 FHER3 Fer Heringer 0 R$ 200.952 0 PSSA3 Porto Seguro 4 R$ 23.138.359 3BISA3 Brascan 1 R$ 9.078.286 0 GETI4 AES Tiete 9 R$ 68.319.866 9 RAPT4 Randon Part 4 R$ 19.637.747 4BNCA3 Nossa Caixa 2 R$ 1.242.240 1 GFSA3 Gafisa 2 R$ 111.021.967 3 RDCD3 Redecard 2 R$ 163.696.617 2BRAP4 Bradespar 1 R$ 27.782.932 1 GGBR3 Gerdau 0 R$ 2.384.359 1 RENT3 Localiza 2 R$ 28.970.118 1BRKM5 Braskem 4 R$ 59.156.434 4 GGBR4 Gerdau 5 R$ 819.671.312 6 RSID3 Rossi Resid 0 R$ 17.638.855 1BRML3 Br Malls Par 2 R$ 25.705.120 2 GOAU4 Gerdau Met 2 R$ 60.513.955 2 SBSP3 Sabesp 2 R$ 23.268.060 3BRSR6 Banrisul 0 R$ 760.529 0 GOLL4 Gol 3 R$ 94.879.633 3 SDIA4 Sadia 0 R$ 0 1BRTO4 Brasil Telecom 1 R$ 11.916.121 1 GVTT3 Gvt Holding 0 R$ 14.478.776 1 SUZB5 Suzano Papel 1 R$ 16.541.462 1BRTP4 Brasil T Par 9 R$ 48.893.966 8 ITSA4 Itausa 1 R$ 79.026.311 1 TAMM4 Tam 2 R$ 56.368.957 2BTOW3 B2W Global 3 R$ 87.034.109 4 ITUB4 Itaubanco 5 R$ 1.115.278.254 7 TBLE3 Tractebel 7 R$ 77.366.093 8BVMF3 BM&F Bovespa 1 R$ 202.544.039 1 JBSS3 JBS 2 R$ 50.076.617 3 TCSL3 Tim Participacoes 0 R$ 1.877.563 0CCRO3 Ccr Rodovias 2 R$ 58.039.413 2 JHSF3 Jhsf Part 0 R$ 291.370 0 TCSL4 Tim Participacoes 5 R$ 109.644.739 4CESP6 Cesp 0 R$ 9.883.283 0 KLBN4 Klabin 7 R$ 63.115.411 6 TEND3 Tenda 0 R$ 737.738 0CGAS5 Comgás 3 R$ 5.867.537 4 KSSA3 Klabin Segall 1 R$ 10.453.547 1 TLPP4 Telesp 9 R$ 67.448.549 12CLSC6 Celesc 5 R$ 10.684.392 5 LAME4 Loj Americanas 6 R$ 161.451.833 6 TMAR5 Telemar Norte Leste 4 R$ 42.755.364 4CMIG4 Cemig 10 R$ 466.100.809 10 LIGT3 Light 0 R$ 14.239.331 0 TNLP3 Telemar-Tele Nl Par 1 R$ 14.103.868 1CNFB4 Confab 1 R$ 3.703.352 0 LLXL3 LLX Logística 0 R$ 6.053.508 0 TNLP4 Telemar-Tele Nl Par 4 R$ 132.734.181 4CPFE3 CPFL Energia 3 R$ 47.010.244 4 LREN3 Lojas Renner 4 R$ 150.274.777 5 TRPL4 Transmissao Paulist 8 R$ 98.717.912 7CPLE6 Copel 2 R$ 41.773.965 2 LUPA3 Lupatech 1 R$ 9.046.274 1 UGPA4 Ultrapar 1 R$ 19.813.360 1CRUZ3 Souza Cruz 6 R$ 102.227.936 6 MAGG3 Magnesita 5 R$ 50.086.428 3 USIM3 Usiminas 0 R$ 4.570.954 1CSAN3 Cosan 1 R$ 28.370.043 1 MMXM3 Mmx Mineracao 1 R$ 65.388.872 1 USIM5 Usiminas 4 R$ 472.284.200 3CSMG3 Copasa Mg 7 R$ 44.622.144 9 MRFG3 Marfrig 1 R$ 9.902.880 1 VALE3 Vale Rio Doce 7 R$ 1.095.925.902 6CSNA3 Sid Nacional 2 R$ 277.549.078 3 MRVE3 Mrv 6 R$ 210.642.783 6 VALE5 Vale Rio Doce 5 R$ 2.694.090.949 4CYRE3 Cyrela Realty 5 R$ 374.477.434 5 NATU3 Natura 2 R$ 63.063.801 3 VCPA3 Votorantim C P 2 R$ 43.514.742 2DASA3 Dasa 1 R$ 15.186.827 1 NETC4 Net 1 R$ 41.222.743 1 VIVO4 Vivo Part 3 R$ 117.502.132 3
WEGE3 Weg 4 R$ 23.231.514 4
OPEN POSITION - IBRX 100

DAILY BRAZIL
October 15 2009
Equity Iberia - Brazil
REC. Price T.P. Dec/09 Upside P/BV Mkt Cap Free Daily Volume Ibov
10/14/09 Update R$/share R$/share (%) 2007 2008 2009E 2010E 2007 2008 2009E 2010E 2009E 2010E Daily MTD YTD Min. Max. R$ M Float R$ K Share(%)
Ibovespa Share: 0,00% Total Market Cap:
AGRENCO UNIT Not Rated - 0,9 - - - - - - - - - - - - 0,2 0,0 2,4 290,9 0,1 1,0 132 47,2% 4.840 -
BRASIL ECODIESEL ON Not Rated - 0,9 - - - - - - - - - - - - 3,2 4,7 2,4 95,3 0,4 1,1 645 70,4% 14.340 -
FER. HERINGER ON Not Rated - 12,2 - - - - - - - - - - - - 1,9 -1,1 2,6 245,8 2,7 12,9 584 32,4% 3.019 -
FOSFERTIL PN Not Rated - 18,2 - - - - - - - - - - - - 3,8 -1,9 -0,8 62,5 8,5 19,9 7.659 22,3% 11.111 -
SLC AGRÍCOLA ON NEUTRAL 08/10/09 16,2 19,0 18% 15,6 9,9 12,8 14,2 - - 31,4 39,2 0,8% 0,6% 2,0 0,0 6,0 16,3 6,5 19,2 1.583 42,9% 3.304 -
Ibovespa Share: 1,33% Total Market Cap:
GOL LINHAS AÉREAS PN Not Rated - 18,8 - - - - - - - - - - - - 2,6 6,2 -3,6 78,6 6,5 21,3 4.982 23,1% 35.110 0,7%
TAM PN Not Rated - 25,1 - - - - - - - - - - - - 2,7 5,4 3,6 24,8 12,2 29,4 3.767 37,3% 26.821 0,7%
Ibovespa Share: 20,32% Total Market Cap:
ABC PN NEUTRAL 07/29/09 11,4 8,5 -25% - - - - 16,3 4,5 12,6 9,0 2,7% 2,7% 1,3 0,9 8,8 135,1 2,6 12,2 1.526 32,2% 2.801 -
BANRISUL PNB Not Rated - 12,1 - - - - - - - - - - - - 1,6 1,4 9,7 126,8 3,7 12,1 4.961 30,2% 7.158 -
BICBANCO PN Not Rated - 12,5 - - - - - - - - - - - - 1,9 -1,1 10,6 391,9 1,4 12,9 3.182 16,7% 2.713 -
BM&F BOVESPA ON Not Rated - 13,8 - - - - - - - - - - - - 1,4 -0,6 5,7 135,6 3,8 14,1 27.548 98,0% 155.328 4,4%
BRADESCO PN Not Rated - 37,2 - - - - - - - - - - - - 3,1 2,5 3,0 62,6 18,2 37,3 114.204 64,2% 176.982 3,9%
BRASIL ON NEUTRAL 07/29/09 32,4 23,3 -28% - - - - - 4,2 12,3 10,4 2,7% 3,8% 2,6 3,2 0,5 127,0 10,3 32,1 83.171 21,7% 102.887 2,1%
CRUZEIRO DO SUL PN Not Rated - 10,2 - - - - - - - - - - - - 1,4 1,3 9,5 131,6 3,3 10,4 1.382 10,0% 1.649 -
DAYCOVAL PN NEUTRAL 07/29/09 9,7 7,4 -23% - - - - 18,4 5,2 12,4 11,0 3,3% 2,2% 1,3 2,1 12,0 89,0 3,3 9,9 2.095 10,4% 1.515 -
ITAU UNIBANCO HOLDING PN NEUTRAL 07/29/09 37,1 31,2 -16% - - - - 10,1 13,4 16,7 14,5 2,0% 2,1% 2,7 2,8 1,2 55,7 14,7 37,3 167.284 47,2% 223.957 5,6%
ITAUSA PN Not Rated - 11,1 - - - - - - - - - - - - 2,0 3,1 0,6 57,7 4,1 11,1 48.295 69,9% 104.802 2,5%
NOSSA CAIXA ON FALSO 03/05/09 59,4 - - - - - - - 11,2 13,6 9,7 3,0% 4,1% 2,3 1,7 -6,5 -13,7 24,8 75,9 6.357 23,5% 537 0,3%
PANAMERICANO PN BUY 07/29/09 7,1 5,5 -23% - - - - 11,1 2,7 24,9 15,7 2,5% 1,6% 1,2 0,4 1,4 192,6 2,0 7,6 1.740 7,9% 4.016 -
PARANA PN Not Rated - 9,5 - - - - - - - - - - - - 1,1 1,1 -2,8 294,8 2,1 9,9 912 22,0% 1.230 -
PINE PN Not Rated - 11,0 - - - - - - - - - - - - 1,1 -0,6 3,3 264,9 2,9 11,5 927 13,4% 522 -
PORTO SEGURO ON Not Rated - 18,8 - - - - - - - - - - - - 2,1 1,3 3,2 47,4 9,2 19,2 4.312 19,1% 5.653 -
REDECARD ON BUY 10/14/09 29,5 42,8 45% - - 9,1 8,6 - n.d. 14,3 13,4 5,5% 7,0% 27,5 1,2 6,8 20,5 16,2 32,4 19.820 45,0% 87.223 1,6%
SOFISA PN Not Rated - 6,3 - - - - - - - - - - - - 1,0 3,0 -2,6 82,7 2,7 7,1 863 9,9% 1.354 -
SUL AMERICA UNT Not Rated - 37,5 - - - - - - - - - - - - 4,3 0,3 -1,6 147,5 13,7 40,8 10.538 35,1% 10.505 -
VISANET ON BUY 10/14/09 17,6 23,2 32% - - - - - - - - - - 150,7 1,7 -1,9 - 14,8 18,8 23.956 35,0% 88.652 -
Ibovespa Share: 0,73% Total Market Cap:
CONFAB PN Not Rated - 5,9 - - - - - - - - - - - - 1,9 1,0 5,6 87,0 2,4 6,0 2.360 47,2% 6.940 -
EMBRAER ON Not Rated - 10,3 - - - - - - - - - - - - 1,3 1,8 -1,6 14,5 5,5 11,6 7.435 25,3% 33.296 0,7%
FRAS-LE PN Not Rated - 4,3 - - - - - - - - - - - - 1,3 0,9 8,3 90,4 2,1 4,4 290 13,8% 239 -
INDUSTRIAS ROMI ON Not Rated - 12,0 - - - - - - - - - - - - 1,4 0,1 4,4 57,8 4,8 12,8 900 39,5% 380 -
IOCHP-MAXION ON Not Rated - 24,3 - - - - - - - - - - - - 2,5 -0,3 2,7 223,5 7,0 24,9 1.142 35,5% 2.474 -
LUPATECH ON Not Rated - 31,1 - - - - - - - - - - - - 7,5 7,2 12,1 23,9 13,4 33,0 1.493 48,4% 11.751 -
MARCOPOLO PN Not Rated - 6,2 - - - - - - - - - - - - 1,9 0,0 2,3 98,9 2,5 6,5 1.398 52,3% 4.083 -
RANDON PN Not Rated - 13,6 - - - - - - - - - - - - 2,6 -0,9 2,7 128,1 4,4 13,8 2.171 39,5% 4.677 -
WEG ON Not Rated - 17,8 - - - - - - - - - - - - 5,0 3,8 1,3 41,0 9,1 17,5 10.970 48,9% 5.765 -
Ibovespa Share: 0,76% Total Market Cap:
ALPARGATAS PN Not Rated - 81,4 - - - - - - - - - - - - 1,4 1,1 7,1 77,4 30,1 83,4 1.384 26,3% 6.326 -
CIA HERING ON Not Rated - 21,3 - - - - - - - - - - - - 4,0 0,9 4,2 179,7 4,3 21,3 1.150 32,2% 3.001 -
GRENDENE ON Not Rated - 8,1 - - - - - - - - - - - - 1,8 -2,5 -0,1 109,7 3,0 8,5 2.439 25,1% 1.516 -
NATURA ON BUY 07/16/09 33,8 32,1 -5% 10,5 9,8 14,6 12,3 15,7 15,8 21,5 18,5 3,8% 4,9% 18,1 2,2 3,5 83,9 15,5 33,4 14.534 26,3% 26.715 0,8%
R$ 499.116 M
R$ 28.159 M
EV/EBITDA P/E
R$ 10.604 M
R$ 8.749 M
>CONSUMER GOODS --------------------------------
Change % 52 weeksCOMPANIES Div. Yeld
>AGRIBUSINESS ---------------------------------------
>AVIATION ------------------------------------------------
>BANKING -------------------------------------------------
>CAPITAL GOODS -------------------------------------
R$ 21.626 M
*Multiples based on US GAAP; **Please, consider EV/EBITDAR instead of EV/EBITDA. ***08: Represents the period of the 07/08 harvest, already ended; 09E: represents the period of the 08/09 harvest, already ended in Mar/09; 10E: represents the period of the 09/10 harvest, due to end in Mar/10.

DAILY BRAZIL
October 15 2009
Equity Iberia - Brazil
REC. Price T.P. Dec/09 Upside P/BV Mkt Cap Free Daily Volume Ibov
10/14/09 Update R$/share R$/share (%) 2007 2008 2009E 2010E 2007 2008 2009E 2010E 2009E 2010E Daily MTD YTD Min. Max. R$ M Float R$ K Share(%)
CONSUMER GOODS (Cont.)
POSITIVO INF. ON Not Rated - 19,1 - - - - - - - - - - - - 2,9 0,9 13,2 180,6 3,7 19,0 1.644 27,2% 4.059 -
PROVIDENCIA ON BUY 08/03/09 5,9 9,3 57% 9,5 5,5 6,4 5,9 149,3 7,3 7,0 7,3 3,4% 3,3% 1,0 0,0 -1,0 85,6 1,9 6,4 475 21,7% 506 -
Ibovespa Share: 0,00% Total Market Cap:
ANHANGUERA UNIT BUY 08/11/09 24,4 29,9 22% 63,8 15,9 20,2 15,5 119,0 49,2 33,6 19,0 0,0% 0,0% 2,9 -3,1 24,8 108,1 9,0 26,0 2.994 38,9% 2.400 -
ESTACIO ON Not Rated - 22,8 - - - - - - - - - - - - 3,9 5,4 5,0 76,0 10,0 25,0 1.801 27,8% 3.339 -
KROTON UNIT NEUTRAL 08/06/09 18,6 18,3 -2% 0,0 9,8 14,2 9,7 0,0 16,1 24,5 13,6 1,0% 1,8% 2,4 3,0 14,3 67,4 6,6 18,5 1.143 32,2% 4.943 -
SEB UNIT BUY 07/30/09 19,6 23,8 22% 0,0 9,6 12,9 7,5 0,0 neg neg. neg. 1,7% 2,6% 2,5 0,0 10,7 110,7 6,0 20,1 792 23,4% 250 -
Ibovespa Share: 7,16% Total Market Cap:
AES TIETE ON BUY 08/04/09 19,6 22,8 17% 7,5 4,2 6,0 6,0 12,4 7,0 9,2 9,6 10,9% 10,4% 10,6 -0,9 5,7 68,4 8,8 19,7 7.449 39,5% 2.667 -
AES TIETE PN BUY 08/04/09 20,3 22,5 11% 6,4 4,8 6,2 6,2 10,4 8,2 9,6 10,0 10,5% 10,0% 11,1 0,7 1,1 48,1 10,3 21,1 7.750 39,5% 7.839 -
CELESC PNB Not Rated - 35,0 - - - - - - - - - - - - 0,8 -0,1 2,5 6,8 26,3 36,1 1.365 17,6% 2.003 0,1%
CEMIG PN BUY 08/04/09 28,5 35,0 23% 5,9 6,0 6,4 5,0 8,2 8,3 10,4 8,4 4,8% 11,9% 1,7 2,9 2,6 15,2 21,8 29,3 17.670 62,2% 46.429 1,7%
CESP PNB BUY 08/04/09 22,6 30,8 36% 13,4 neg. 6,9 5,7 79,6 n.a. 10,9 10,3 2,6% 9,2% 0,9 -1,7 5,4 53,7 8,2 23,1 7.410 40,8% 27.252 0,8%
COELCE PNA NEUTRAL 08/04/09 29,5 26,0 -12% 5,6 5,2 5,4 4,9 5,2 5,9 6,7 6,2 13,1% 10,7% 2,1 -0,6 -3,1 52,0 13,0 31,5 2.302 28,8% 3.476 -
COPEL PNB BUY 08/04/09 33,0 41,4 25% 4,1 3,8 6,1 7,0 6,6 6,1 11,2 14,1 2,2% 1,8% 1,0 0,1 5,2 42,7 19,3 33,1 9.042 39,0% 19.984 0,7%
CPFL ENERGIA ON Not Rated - 33,8 - - - - - - - - - - - - 3,2 0,8 5,1 20,3 24,4 34,3 16.243 22,2% 13.455 0,5%
ELETROBRAS ON Not Rated - 28,5 - - - - - - - - - - - - 0,4 1,0 2,3 15,1 17,7 31,0 31.258 23,4% 29.593 1,0%
ELETROBRAS PNB Not Rated - 25,4 - - - - - - - - - - - - 0,3 1,1 0,7 10,2 17,1 27,5 27.784 23,4% 22.293 0,9%
ELET. METROPOLITANA PNB NEUTRAL 08/04/09 38,2 38,3 0% 5,9 4,1 5,2 4,6 8,5 4,2 7,8 6,9 12,4% 13,8% 1,8 -1,1 6,4 81,1 18,3 39,0 6.371 47,2% 22.994 0,7%
ENERGIAS DO BRASIL ON Not Rated - 31,1 - - - - - - - - - - - - 1,2 1,0 5,3 45,8 17,8 31,4 4.440 25,3% 8.765 -
EQUATORIAL ON NEUTRAL 09/16/09 18,1 18,4 2% 3,6 3,5 4,4 3,8 5,8 5,8 10,1 9,9 6,5% 7,4% 1,7 -0,3 3,4 118,6 7,9 19,5 1.913 44,6% 4.710 -
LIGHT ON BUY 08/04/09 26,2 29,7 13% 7,4 4,8 6,5 5,1 5,4 4,6 11,3 8,8 4,6% 7,6% 1,7 -1,0 7,2 33,6 15,1 28,8 5.347 23,5% 30.408 0,3%
TRACTEBEL ON Not Rated - 21,8 - - - - - - - - - - - - 3,9 2,0 2,5 18,6 14,7 22,1 14.255 21,3% 11.148 -
TRANS. PAULISTA PN BUY 07/15/09 51,2 55,9 9% 4,6 5,2 6,7 7,2 5,9 7,3 9,4 9,7 10,0% 9,5% 1,8 0,4 4,7 32,0 34,1 53,2 7.733 21,0% 11.453 0,4%
Ibovespa Share: 3,23% Total Market Cap:
AMBEV ON BUY 08/10/09 138,4 146,2 6% 7,9 9,3 8,8 7,6 21,6 27,7 15,4 13,4 3,3% 4,4% 4,6 0,8 8,5 67,4 68,2 139,0 85.254 28,8% 6.783 -
AMBEV PN NEUTRAL 08/10/09 161,3 146,2 -9% 10,1 7,6 9,8 8,7 28,5 22,4 17,9 15,6 3,8% 6,1% 5,3 1,2 9,0 62,3 79,5 161,3 99.342 28,8% 41.338 1,0%
JBS ON NEUTRAL 08/10/09 10,0 7,5 -25% 14,9 9,1 12,4 9,7 neg 89,6 53,6 14,3 0,4% 1,7% 2,7 -0,2 8,2 102,7 2,7 10,2 13.954 19,9% 24.513 0,6%
MARFRIG ON BUY 08/10/09 19,1 20,8 9% 13,4 7,1 9,5 7,0 48,1 neg 10,3 10,1 2,3% 2,3% 1,8 1,9 11,3 150,0 6,3 19,4 5.100 27,1% 13.203 -
M DIAS BRANCO ON Not Rated - 37,3 - - - - - - - - - - - - 3,0 0,9 1,5 89,4 15,3 37,2 4.217 29,2% 2.020 -
MINERVA ON SELL 08/10/09 6,5 5,4 -16% 7,7 6,7 8,2 7,2 23,7 neg 3,6 7,7 0,0% 0,0% 1,8 0,8 8,5 280,7 1,4 6,6 677 0,6% 3.885 -
BRF FOODS ON Restricted 07/10/09 48,5 - - - - - - - - - - - - 5,3 0,7 1,9 61,7 25,9 49,8 21.124 71,8% 76.284 1,0%
SOUZA CRUZ ON SELL 07/31/09 69,2 57,4 -17% 10,5 7,3 9,6 10,1 16,2 10,8 15,5 16,1 6,2% 5,9% 8,6 1,7 9,3 68,5 28,4 68,4 21.166 24,7% 15.025 0,6%
Ibovespa Share: 0,00% Total Market Cap:AMIL ON Not Rated - 10,1 - - - - - - - - - - - - 2,9 -0,2 3,9 43,9 5,4 11,3 3.595 30,3% 5.554 -
CREMER ON Under Revision 10/01/09 14,8 Under Revision - - - - - - - - - - - 1,5 3,7 11,7 116,0 4,8 14,5 473 45,6% 1.063 -
DASA ON Not Rated - 48,0 - - - - - - - - - - - - 5,3 1,7 3,0 109,9 19,5 47,9 2.736 57,3% 13.584 -
DROGASIL ON Not Rated - 22,6 - - - - - - - - - - - - 3,5 0,4 0,0 128,9 7,0 23,1 1.333 48,6% 1.692 -
MEDIAL ON Not Rated - 10,0 - - - - - - - - - - - - 1,4 0,5 -8,3 32,7 4,9 11,6 700 40,3% 1.704 -
ODONTOPREV ON Not Rated - 38,0 - - - - - - - - - - - - 3,5 1,8 3,7 67,9 18,8 39,4 949 55,2% 2.003 -
PROFARMA ON Not Rated - 17,0 - - - - - - - - - - - - 1,2 1,4 5,0 222,4 4,4 16,8 579 27,6% 843 -
TEMPO PART. ON Not Rated - 3,2 - - - - - - - - - - - - 1,6 -0,3 5,2 21,1 2,0 4,0 502 54,6% 1.620 -
>EDUCATION ---------------------------------------------------
>ELECTRIC UTILITIES ------------------------------------
>FOOD, BEVERAGES & TOBACCO -----------------
R$ 6.731 M
>HEALTH CARE ----------------------------------------------- R$ 10.868 M
R$ 165.581 M
R$ 168.330 M
Change % 52 weeksCOMPANIES Div. YeldEV/EBITDA P/E
*Multiples based on US GAAP; **Please, consider EV/EBITDAR instead of EV/EBITDA. ***08: Represents the period of the 07/08 harvest, already ended; 09E: represents the period of the 08/09 harvest, already ended in Mar/09; 10E: represents the period of the 09/10 harvest, due to end in Mar/10.

DAILY BRAZIL
October 15 2009
Equity Iberia - Brazil
REC. Price T.P. Dec/09 Upside P/BV Mkt Cap Free Daily Volume Ibov
10/14/09 Update R$/share R$/share (%) 2007 2008 2009E 2010E 2007 2008 2009E 2010E 2009E 2010E Daily MTD YTD Min. Max. R$ M Float R$ K Share(%)
Ibovespa Share: 2,01% Total Market Cap:ALL UNT BUY 09/30/09 13,4 17,2 29% - - - - - - - - - - 15,0 0,1 -0,7 36,5 6,3 14,0 38.530 70,7% 52.313 1,4%
CCR ON Not Rated - 32,9 - - - - - - - - - - - - 6,9 -0,9 9,5 48,0 12,6 34,4 13.263 23,9% 24.824 0,6%
LLX LOGÍSTICA ON Not Rated - 8,2 - - - - - - - - - - - - 5,2 4,2 26,5 443,0 0,5 8,3 5.674 21,9% 25.397 -
LOG-IN ON Not Rated - 8,9 - - - - - - - - - - - - 1,3 0,0 -1,2 82,8 3,6 9,5 766 30,5% 3.183 -
OHL ON Not Rated - 28,3 - - - - - - - - - - - - 2,3 -1,2 12,6 133,5 11,2 28,8 1.949 14,3% 2.512 -
SANTOS BRASIL UNT N2 Not Rated - 13,9 - - - - - - - - - - - - 7,9 -1,0 -0,9 116,6 5,9 14,9 9.092 29,6% 1.679 -
TEGMA ON BUY 08/03/09 12,1 18,9 56% neg. neg. 99,6 112,8 4,3 0,9 - - 5,6% 6,5% 2,2 -1,5 1,7 197,5 3,2 14,0 799 19,4% 1.063 -
WILSON SONS UNIT Not Rated - 21,4 - - - - - - - - - - - - - -0,7 -12,1 102,4 8,8 25,6 - 31,1% 1.628 -
Ibovespa Share: 19,40% Total Market Cap:
BRASKEM PNA NEUTRAL 08/24/09 12,9 14,0 9% 4,6 6,8 6,6 4,6 10,6 neg 5,6 6,6 8,5% 7,2% 1,3 1,0 13,0 129,2 4,4 13,0 6.669 31,0% 14.938 0,5%
COMGAS PNA Not Rated - 34,5 - - - - - - - - - - - - 3,5 0,6 1,9 9,6 27,3 36,2 4.139 7,2% 1.978 0,1%
PETROBRAS ON Under Revision 05/13/08 42,5 Under Revision - - - - - - - - - - - 2,4 1,5 2,9 55,5 18,5 44,2 372.456 57,0% 138.344 3,3%
PETROBRAS PN Under Revision 05/13/08 36,2 Under Revision - - - - - - - - - - - 2,0 0,9 2,9 61,1 15,7 36,0 317.180 57,0% 538.070 15,0%
QUATTOR PETROQUIMICA PN Not Rated - 7,7 - - - - - - - - - - - - 2,1 0,0 7,7 -8,3 5,0 9,5 1.748 0,7% 7 -
ULTRAPAR PN Under Revision 05/15/08 75,8 Under Revision - - - - - - - - - - - 2,1 3,9 2,1 47,7 36,2 74,5 10.151 48,6% 18.806 0,5%
UNIPAR PNB Not Rated - 1,1 - - - - - - - - - - - - 0,9 -1,7 0,0 83,4 0,5 1,3 952 59,1% 1.707 -
Ibovespa Share: 0,43% Total Market Cap:
DURATEX PN Not Rated - 31,3 - - - - - - - - - - - - 2,2 0,0 11,9 126,8 11,7 33,0 3.975 50,3% 18.188 0,4%
LOCALIZA ON Not Rated - 19,6 - - - - - - - - - - - - 6,8 1,8 9,2 175,7 5,0 19,8 3.869 54,8% 16.290 -
SATIPEL ON Not Rated - 12,1 - - - - - - - - - - - - - 0,0 #N/D #N/D #N/D #N/D - ####### #N/D -
Ibovespa Share: 2,47% Total Market Cap:
ARACRUZ PNB Not Rated - 4,1 - - - - - - - - - - - - 2,6 0,0 2,8 63,1 1,3 4,2 4.186 31,4% 42.798 1,4%
KLABIN PN Not Rated - 4,6 - - - - - - - - - - - - 1,6 1,3 8,6 41,4 2,5 4,6 4.163 40,0% 9.059 0,4%
SUZANO PNA Not Rated - 18,0 - - - - - - - - - - - - 1,3 -0,5 -3,3 49,5 9,3 19,2 5.523 45,7% 21.410 -
VCP ON Not Rated - 30,3 - - - - - - - - - - - - 1,4 1,0 3,2 - 26,6 31,9 11.817 23,4% 24.311 0,7%
Ibovespa Share: 3,15% Total Market Cap:ABYARA ON Not Rated - 4,8 - - - - - - - - - - - - 2,5 2,3 -0,6 291,9 0,9 4,9 508 38,2% 15.256 -
AGRA ON Not Rated - 5,3 - - - - - - - - - - - - 1,4 1,7 1,0 189,2 0,9 5,6 1.260 47,6% 16.727 -
BR MALLS ON Not Rated - 22,9 - - - - - - - - - - - - 2,5 7,7 1,9 134,1 4,3 22,5 4.586 53,0% 12.957 -
BROOKFIELD ON Not Rated - 7,6 - - - - - - - - - - - - 1,5 -2,1 0,4 232,5 1,6 8,5 2.660 32,1% 12.990 -
CAMARGO CORREA ON Not Rated - 6,1 - - - - - - - - - - - - 1,1 1,5 9,7 145,7 1,9 6,2 685 30,4% 2.928 -
CYRELA ON BUY - 27,9 33,3 19% - - - - - - - - - - 4,2 5,3 14,9 191,9 5,5 26,6 10.295 55,5% 66.500 1,4%
CYRELA COM PROP ON Not Rated - 10,9 - - - - - - - - - - - - 2,4 -0,6 5,6 84,2 4,6 11,0 948 21,5% 1.248 -
GAFISA ON NEUTRAL - 31,0 30,1 -3% - - - - - - - - - - 2,3 3,6 12,1 188,3 6,6 30,0 4.030 54,4% 50.723 1,2%
GENERAL SHOPPING ON Not Rated - 7,7 - - - - - - - - - - - - 1,0 2,1 7,0 230,0 1,3 8,5 383 29,2% 1.069 -
IGUATEMI ON Not Rated - 31,5 - - - - - - - - - - - - 2,1 2,2 11,0 144,4 7,5 32,5 2.049 18,6% 3.637 -
INPAR ON Not Rated - 4,3 - - - - - - - - - - - - 1,1 -1,6 4,5 166,1 1,2 4,6 855 17,7% 13.063 -
KLABINSEGALL ON Not Rated - 5,3 - - - - - - - - - - - - 2,1 1,5 0,8 120,9 1,0 5,5 769 56,2% 8.523 -
LOPES BRASIL ON Not Rated - 21,1 - - - - - - - - - - - - 73,9 3,5 11,1 209,1 4,7 20,5 1.035 29,6% 1.680 -
MRV ON Not Rated - 39,0 - - - - - - - - - - - - 2,9 1,4 13,1 299,2 6,3 39,1 6.240 57,4% 34.069 -
R$ 52.968 M>REAL ESTATE ------------------------------------------
>PULP & PAPER ----------------------------------------
>OIL & PETROCHEMICAL -------------------------
>OTHERS ---------------------------------------------------
R$ 713.295 M
R$ 7.844 M
R$ 25.688 M
COMPANIES
>LOGISTIC & CONCESSIONS -------------------
EV/EBITDA
R$ 70.074 M
Div. Yeld Change % 52 weeksP/E
*Multiples based on US GAAP; **Please, consider EV/EBITDAR instead of EV/EBITDA. ***08: Represents the period of the 07/08 harvest, already ended; 09E: represents the period of the 08/09 harvest, already ended in Mar/09; 10E: represents the period of the 09/10 harvest, due to end in Mar/10.

DAILY BRAZIL
October 15 2009
Equity Iberia - Brazil
REC. Price T.P. Dec/09 Upside P/BV Mkt Cap Free Daily Volume Ibov
10/14/09 Update R$/share R$/share (%) 2007 2008 2009E 2010E 2007 2008 2009E 2010E 2009E 2010E Daily MTD YTD Min. Max. R$ M Float R$ K Share(%)
REAL ESTATE (Cont.)
MULTIPLAN ON Not Rated - 28,7 - - - - - - - - - - - - 2,5 3,4 3,2 134,6 8,3 29,3 4.956 24,8% 24.168 -
PDG REALTY ON Not Rated - 17,3 - - - - - - - - - - - - 3,4 3,6 13,6 199,6 3,6 16,8 6.332 58,2% 46.978 -
ROSSI ON Not Rated - 14,1 - - - - - - - - - - - - 2,7 0,7 -1,8 277,8 2,4 15,4 3.624 32,1% 55.973 0,6%
TECNISA ON Not Rated - 11,5 - - - - - - - - - - - - 2,0 5,2 17,1 228,0 2,0 11,1 1.660 21,0% 5.931 -
TENDA ON Not Rated - 5,3 - - - - - - - - - - - - 1,9 -0,4 0,2 362,1 0,8 5,6 2.141 23,4% 12.112 -
Ibovespa Share: 3,11% Total Market Cap:
B2W GLOBAL ON Not Rated - 55,8 - - - - - - - - - - - - 25,0 1,3 10,5 132,8 18,9 55,0 6.133 38,7% 24.913 0,7%
GLOBEX ON Restricted 07/06/09 8,1 - - - - - - - - - - - - 2,6 -1,2 1,1 62,0 4,5 10,0 998 19,2% 49 -
GUARARAPES ON Not Rated - 41,6 - - - - - - - - - - - - 1,8 -1,5 1,9 140,0 14,1 42,2 2.576 18,1% 909 -
LOJAS AMERICANAS PN Not Rated - 12,7 - - - - - - - - - - - - 31,0 0,2 6,1 103,6 4,4 12,7 9.227 42,7% 24.975 1,0%
LOJAS RENNER ON Not Rated - 34,2 - - - - - - - - - - - - 5,4 -0,1 10,2 119,4 11,8 34,7 4.175 79,7% 39.796 0,9%
MARISA ON Not Rated - 8,9 - - - - - - - - - - - - 2,6 1,6 6,0 179,3 2,8 8,9 1.654 16,2% 2.126 -
PÃO AÇUCAR PNA Restricted 07/06/09 54,8 - - - - - - - - - - - - 2,5 1,8 7,7 75,7 24,4 53,9 13.919 39,4% 39.592 0,6%
Ibovespa Share: 27,67% Total Market Cap:
BRADESPAR PN Not Rated - 37,9 - - - - - - - - - - - - 2,6 2,9 13,0 96,7 14,4 37,0 13.262 57,8% 36.809 1,1%
CSN ON Not Rated - 60,6 - - - - - - - - - - - - 6,5 5,0 6,1 112,6 18,5 57,7 45.753 41,8% 109.661 3,0%
GERDAU PN Not Rated - 28,7 - - - - - - - - - - - - 2,5 6,3 13,5 79,6 10,3 27,0 40.712 50,4% 160.663 3,6%
METAL. GERDAU PN Not Rated - 35,9 - - - - - - - - - - - - 1,9 6,5 13,7 68,5 14,0 33,8 14.571 76,7% 30.056 0,9%
MMX ON Not Rated - 13,2 - - - - - - - - - - - - neg. -1,9 23,3 385,2 2,2 13,6 4.023 44,0% 58.961 0,7%
USIMINAS ON Not Rated - 50,0 - - - - - - - - - - - - 1,7 4,2 5,9 90,0 16,6 56,7 24.705 57,7% 24.412 0,7%
USIMINAS PNA Not Rated - 52,8 - - - - - - - - - - - - 1,8 5,1 7,6 94,2 17,7 50,3 26.083 57,7% 128.009 3,1%
VALE ON Not Rated - 45,3 - - - - - - - - - - - - 2,5 4,6 5,1 58,7 21,8 44,1 236.149 58,6% 146.971 3,5%
VALE PNA Not Rated - 40,4 - - - - - - - - - - - - 2,2 4,6 5,5 64,5 19,9 38,9 210.657 58,6% 532.377 12,1%
Ibovespa Share: 0,55% Total Market Cap:
COSAN ON BUY 08/11/09 20,3 23,5 16% 50,8 10,4 8,1 6,9 na na 12,2 22,6 2,0% 1,1% 1,9 -2,9 6,6 85,5 8,0 21,6 7.533 27,4% 21.668 0,6%
COSAN LIMITED UNIT NEUTRAL 08/11/09 14,7 15,1 3% - - - - - - - - - - 1,2 -0,4 1,0 84,5 5,4 15,8 3.984 33,6% 192 -
GUARANI ON NEUTRAL 08/11/09 5,7 6,1 7% 14,0 7,2 6,1 5,6 na na 11,0 24,0 2,3% 1,0% 1,4 1,2 -3,7 175,3 1,6 6,3 1.642 30,7% 5.925 -
SÃO MARTINHO ON BUY 08/11/09 18,6 20,0 8% 25,5 11,5 8,5 8,6 na na 22,5 60,3 1,1% 0,4% 1,3 -0,8 12,7 104,1 8,6 19,5 2.096 35,4% 1.124 -
Ibovespa Share: 3,80% Total Market Cap:
AMERICAN BANKNOTE ON Not Rated - 17,0 - - - - - - - - - - - - 2,3 -2,0 0,9 65,9 9,1 17,8 867 58,1% 3.831 -
BEMATECH ON Not Rated - 8,1 - - - - - - - - - - - - 1,1 0,2 3,2 44,0 3,5 8,3 420 61,0% 1.114 -
BRASIL TEL PART PN Not Rated - 20,0 - - - - - - - - - - - - 1,4 -0,2 5,8 14,9 11,7 22,9 7.229 17,3% 5.342 0,3%
BRASIL TEL SA PN Not Rated - 16,4 - - - - - - - - - - - - 1,6 -0,8 5,2 20,9 10,0 17,6 8.965 21,4% 7.830 0,4%
CONTAX PN Not Rated - 81,0 - - - - - - - - - - - - 3,7 1,3 1,3 111,6 19,9 82,0 1.215 22,9% 1.907 -
CSU CARDSYSTEM ON Not Rated - 6,0 - - - - - - - - - - - - 2,1 1,4 -2,2 155,2 2,0 6,5 286 36,2% 1.161 -
GVT HOLDING ON NEUTRAL 10/05/09 46,7 44,3 -5% - - - - - - - - - - 3,1 -0,7 16,0 85,3 15,3 47,7 5.978 68,9% 110.842 -
NET SERVIÇOS PN Not Rated - 23,4 - - - - - - - - - - - - 2,8 4,5 8,4 68,3 10,6 22,8 8.009 56,4% 34.147 0,8%
TELEMAR PNA Not Rated - 61,4 - - - - - - - - - - - - 1,5 0,0 5,5 18,5 38,1 65,1 14.611 12,5% 9.553 0,3%
TELEMAR NORTE LESTE PN Not Rated - 33,8 - - - - - - - - - - - - 1,5 1,2 -0,2 24,1 19,7 35,1 12.915 45,7% 32.176 1,0%
TELESP PN Not Rated - 45,2 - - - - - - - - - - - - 2,1 1,3 2,3 5,2 38,1 49,1 22.856 12,0% 7.447 0,2%
R$ 15.254 M
R$ 99.025 M
EV/EBITDA P/E
R$ 38.682 M
R$ 602.653 M
>RETAIL -----------------------------------------------------
>STEEL & MINING -------------------------------------
>SUGAR & ETHANOL*** ---------------------------
>TELECOM / IT / MEDIA -----------------------------
Change % 52 weeksCOMPANIES Div. Yeld
*Multiples based on US GAAP; **Please, consider EV/EBITDAR instead of EV/EBITDA. ***08: Represents the period of the 07/08 harvest, already ended; 09E: represents the period of the 08/09 harvest, already ended in Mar/09; 10E: represents the period of the 09/10 harvest, due to end in Mar/10.
DAILY BRAZIL
October 15 2009
Equity Iberia - Brazil
REC. Price T.P. Dec/09 Upside P/BV Mkt Cap Free Daily Volume Ibov
10/14/09 Update R$/share R$/share (%) 2007 2008 2009E 2010E 2007 2008 2009E 2010E 2009E 2010E Daily MTD YTD Min. Max. R$ M Float R$ K Share(%)
TELECOM / IT / MEDIA (Cont.)
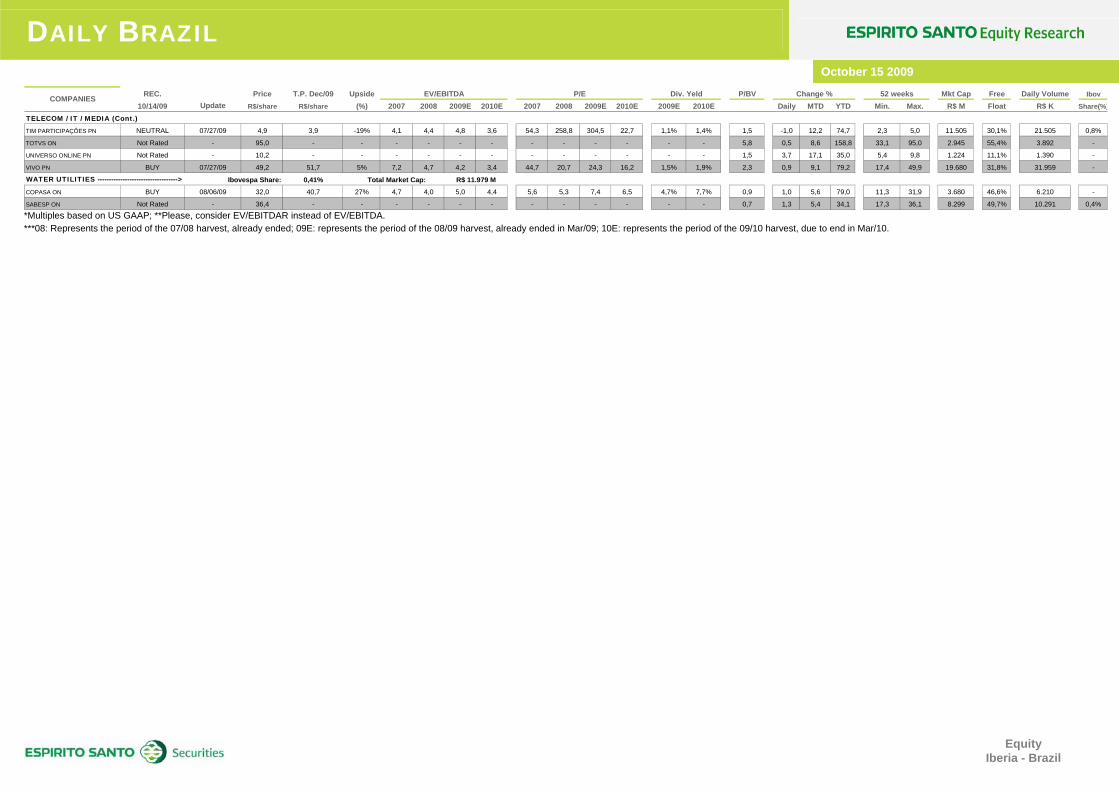
TIM PARTICIPAÇÕES PN NEUTRAL 07/27/09 4,9 3,9 -19% 4,1 4,4 4,8 3,6 54,3 258,8 304,5 22,7 1,1% 1,4% 1,5 -1,0 12,2 74,7 2,3 5,0 11.505 30,1% 21.505 0,8%
TOTVS ON Not Rated - 95,0 - - - - - - - - - - - - 5,8 0,5 8,6 158,8 33,1 95,0 2.945 55,4% 3.892 -
UNIVERSO ONLINE PN Not Rated - 10,2 - - - - - - - - - - - - 1,5 3,7 17,1 35,0 5,4 9,8 1.224 11,1% 1.390 -
VIVO PN BUY 07/27/09 49,2 51,7 5% 7,2 4,7 4,2 3,4 44,7 20,7 24,3 16,2 1,5% 1,9% 2,3 0,9 9,1 79,2 17,4 49,9 19.680 31,8% 31.959 -
Ibovespa Share: 0,41% Total Market Cap:
COPASA ON BUY 08/06/09 32,0 40,7 27% 4,7 4,0 5,0 4,4 5,6 5,3 7,4 6,5 4,7% 7,7% 0,9 1,0 5,6 79,0 11,3 31,9 3.680 46,6% 6.210 -
SABESP ON Not Rated - 36,4 - - - - - - - - - - - - 0,7 1,3 5,4 34,1 17,3 36,1 8.299 49,7% 10.291 0,4%
52 weeksCOMPANIES Div. Yeld
>WATER UTILITIES -----------------------------------
Change %EV/EBITDA P/E
R$ 11.979 M
*Multiples based on US GAAP; **Please, consider EV/EBITDAR instead of EV/EBITDA. ***08: Represents the period of the 07/08 harvest, already ended; 09E: represents the period of the 08/09 harvest, already ended in Mar/09; 10E: represents the period of the 09/10 harvest, due to end in Mar/10.

Daily Brazil
October 15 2009
Banco Espírito Santo de Investimento, S.A. - 10 - Equity Iberia - Brazil
DISCLAIMER Ratings
Buy 54.8% Neutral 40.5%
Sell 4.8%
Vale PNA - VALE5
B NR
0
20
40
60
80
100
Oct
-07
Nov
-07
Jan-
08
Feb-
08
Apr-
08
May
-08
Jul-0
8
Aug-
08
Oct
-08
Nov
-08
Jan-
09
Feb-
09
Apr-
09
May
-09
Jul-0
9
Aug-
09
Oct
-09
R$
Closing Price Target Price
Date Rating Target Price Closing Price23-Oct-07 NEUTRAL 60.30 50.75
25-Feb-08 BUY 67.10 51.24
17-Apr-08 BUY 69.60 51.80
01-Aug-08 BUY 64.77 38.45
21-Oct-08 BUY 52.60 26.39
12-Feb-09 BUY 46.20 29.80
29-Apr-09 BUY 41.50 30.10
08-Jun-09 NOT RATED - -
Vale do Rio Doce ON - VALE3
BN N NR
020406080
100120
Oct
-07
Nov
-07
Jan-
08
Feb-
08
Apr-
08
May
-08
Jul-0
8
Aug-
08
Oct
-08
Nov
-08
Jan-
09
Feb-
09
Apr-
09
May
-09
Jul-0
9
Aug-
09
Oct
-09
R$
Closing Price Target Price
Date Rating Target Price Closing Price15-Feb-08 NEUTRAL 64.60 55.22
25-Feb-08 NEUTRAL 71.90 60.70
17-Apr-08 NEUTRAL 74.60 62.65
01-Aug-08 BUY 69.42 44.39
21-Oct-08 BUY 56.30 28.84
12-Feb-09 NEUTRAL 49.60 34.81
29-Apr-09 NEUTRAL 44.50 35.00
08-Jun-09 NOT RATED - -
Daily Brazil
October 15 2009
Banco Espírito Santo de Investimento, S.A. - 11 - Equity Iberia - Brazil
Redecard ON - RDCD3
B BR
0102030405060
Oct
-07
Nov
-07
Jan-
08
Feb-
08
Apr-
08
May
-08
Jul-0
8
Aug-
08
Oct
-08
Nov
-08
Jan-
09
Feb-
09
Apr-
09
May
-09
Jul-0
9
Aug-
09
Oct
-09
R$
Closing Price Target Price
Date Rating Target Price Closing Price15-Oct-08 BUY 39.80 25.00
04-Feb-09 BUY 37.09 26.55
13-Mar-09 RESTRICTED - 23.23
23-Apr-09 BUY 36.88 27.69
16-Jul-09 BUY 37.08 29.30
14-Oct-09 BUY 42.81 29.72
Visanet ON - VNET3
BN
0
20
40
Oct
-07
Nov
-07
Jan-
08
Feb-
08
Apr-
08
May
-08
Jul-0
8
Aug-
08
Oct
-08
Nov
-08
Jan-
09
Feb-
09
Apr-
09
May
-09
Jul-0
9
Aug-
09
Oct
-09
R$
Closing Price Target Price
Date Rating Target Price Closing Price11-Aug-09 NEUTRAL 21.01 17.00
14-Oct-09 BUY 23.15 17.55
Tam PN - TAMM4
0102030405060
Oct
-07
Nov
-07
Jan-
08
Feb-
08Ap
r-08
May
-08
Jul-0
8
Aug-
08O
ct-0
8
Nov
-08
Jan-
09Fe
b-09
Apr-
09M
ay-0
9
Jul-0
9Au
g-09
Oct
-09
R$
Closing Price Target Price
Date Rating Target Price Closing PriceNOT RATED
Cruzeiro do Sul PN - CZRS4
05
10152025
Oct
-07
Nov
-07
Jan-
08Fe
b-08
Apr-
08
May
-08
Jul-0
8
Aug-
08O
ct-0
8
Nov
-08
Jan-
09
Feb-
09
Apr-
09M
ay-0
9
Jul-0
9
Aug-
09
Oct
-09
R$
Closing Price Target Price
Date Rating Target Price Closing PriceNOT RATED
Daily Brazil
October 15 2009
Banco Espírito Santo de Investimento, S.A. - 12 - Equity Iberia - Brazil
Totvs ON - TOTS3
0
20
40
60
80
100
Oct
-07
Nov
-07
Jan-
08
Feb-
08Ap
r-08
May
-08
Jul-0
8Au
g-08
Oct
-08
Nov
-08
Jan-
09
Feb-
09Ap
r-09
May
-09
Jul-0
9Au
g-09
Oct
-09
R$
Closing Price Target Price
Date Rating Target Price Closing PriceNOT RATED
JBS ON - JBSS3
N
0
5
10
15
Oct
-07
Nov
-07
Jan-
08
Feb-
08
Apr-
08
May
-08
Jul-0
8
Aug-
08
Oct
-08
Nov
-08
Jan-
09
Feb-
09
Apr-
09
May
-09
Jul-0
9
Aug-
09
Oct
-09
R$
Closing Price Target Price
Date Rating Target Price Closing Price27-Apr-09 NEUTRAL 8.80 6.10
10-Aug-09 NEUTRAL 7.50 7.37
GVT ON - GVTT3
N
010203040506070
Oct
-07
Nov
-07
Jan-
08
Feb-
08
Apr-
08
May
-08
Jul-0
8
Aug-
08
Oct
-08
Nov
-08
Jan-
09
Feb-
09
Apr-
09
May
-09
Jul-0
9
Aug-
09
Oct
-09
R$
Closing Price Target Price
Date Rating Target Price Closing Price05-Oct-09 NEUTRAL 44.31 40.66
Tele Norte Leste Partc. PN - TNLP4
01020
304050
Oct
-07
Nov
-07
Jan-
08
Feb-
08
Apr-
08
May
-08
Jul-0
8
Aug-
08
Oct
-08
Nov
-08
Jan-
09
Feb-
09
Apr-
09
May
-09
Jul-0
9
Aug-
09
Oct
-09
R$
Closing Price Target Price
Date Rating Target Price Closing Price
NOT RATED

Daily Brazil
October 15 2009
Banco Espírito Santo de Investimento, S.A. - 13 - Equity Iberia - Brazil
Telemar PNA - TMAR5
01020304050607080
Oct
-07
Nov
-07
Jan-
08
Feb-
08
Apr-
08
May
-08
Jul-0
8
Aug-
08
Oct
-08
Nov
-08
Jan-
09
Feb-
09
Apr-
09
May
-09
Jul-0
9
Aug-
09
Oct
-09
R$
Closing Price Target Price
Date Rating Target Price Closing PriceNOT RATED
TeleSP PN - TLPP4
010203040506070
Oct
-07
Nov
-07
Jan-
08Fe
b-08
Apr-
08M
ay-0
8
Jul-0
8Au
g-08
Oct
-08
Nov
-08
Jan-
09Fe
b-09
Apr-
09M
ay-0
9
Jul-0
9Au
g-09
Oct
-09
R$
Closing Price Target Price
Date Rating Target Price Closing Price
NOT RATED
Net PN - NETC4
0
10
20
30
40
Oct
-07
Nov
-07
Jan-
08
Feb-
08
Apr-
08
May
-08
Jul-0
8
Aug-
08
Oct
-08
Nov
-08
Jan-
09
Feb-
09
Apr-
09
May
-09
Jul-0
9
Aug-
09
Oct
-09
R$
Closing Price Target Price
Date Rating Target Price Closing PriceNOT RATED
E q u i t y I b e r i a - B r a z i l
ANALYST STOCK RATING BUY: Expect the company to perform better than the primary market index over the next 12 months. NEUTRAL: Expect the company to perform approximately in line with the primary market index over the next 12 months. SELL: Expect the company to underperform the primary market index over the next 12 months. Espírito Santo Research has issued this report for information purposes only. All the information contained in this report is based upon information available to the public and has been obtained from sources believed to be reliable, but Espírito Santo Research does not guarantee its accuracy or completeness. The opinions expressed herein are our present opinions only, and are subject to change without prior notice. Espírito Santo Research is not under any obligation to update or keep current the information and the opinions expressed herein. This report is not, and should not be construed as, an offer or a solicitation to buy or sell any securities or related financial instruments. The investment discussed or recommended in this report may be unsuitable for investors depending on their specific investment objectives and financial position. Where an investment is denominated in a currency other than the investor's currency, changes in rates of exchange may have an adverse effect on the value, price of, or income derived from the investment. Past performance is not necessarily a guide to future performance. Income from investments may fluctuate. The price or value of the investments to which this report relates, either directly or indirectly, may fall or rise against the interest of investors. The securities mentioned in this publication may not be eligible for sale in some states or countries. Espírito Santo Research does not accept any kind of liability for losses or damages which may arise from the use of this report. This report cannot be reproduced, in whole or in part, in any form or by any means, without Espírito Santo. The Espírito Santo Research is a trademark and aggregates the teams of analysis from Banco Espírito Santo, S.A. (Portugal) and its affiliates BES Securities do Brasil, S.A - Corretora de Câmbio e Valores Mobiliários, (Brazil) and Espírito Santo Investment, S.A.U., Sociedad de Valores (Spain). Until the date of publication of the present report, none of these institutions held business relations with the company object of this analysis, with the possibility however, of establishing one due to its activities.
Not disregarding provision stated in the “disclaimer” above, the analyst(s) of investment responsible for this report declare the following:
_ the analysis(es)/recommendation(s) herewith described reflect only and exclusively his(their) individual opinion(s), being developed independently and autonomously, even as far as BES Securities is concerned; _the BES Securities does not hold direct or indirect stake in the capital of the company(companies) object of analysis(es)/recommendation(s) in this report, but the Grupo Banco Espírito Santo in which it takes part, holds direct shareholding stake, and in some cases indirect, in the capital of the companies: Cia. Providência Indústria e Comércio, Bradesco, Bradespar and its associated companies CVRD and CPFL Energia; and Brasilcel and its associated company Vivo Participações; and UOL. Bradesco is a direct shareholder of BES Securities’ parent company.. With the exception of the companies mentioned before, the BES Securities does not hold direct or indirect stake in the capital of the other companies object of analysis(es/recommendations in this report, as well as it was not involved in the acquisition alienation and intermediation of securities issue by these companies in the market; _the analyst(s) does(do) not maintain relationship with any individual working for the company(companies) which securities was(were) target of analysis(es)/recommendation(s) in this report; _ the analyst(s) does(do) not hold, directly or indirectly, securities issued by the company(companies) object of analysis(es)/recommendation(s) in this report, which correspond to 5% (five percent) or more of the individual assets, not even until the date of publication, or is(are) involved in the acquisition, alienation and intermediation of securities issued by the company(companies) in the market; _ the analyst(s) does(do) not receive, nor does BES Securities, payment for services provided, nor maintain commercial relations with company object of analysis(es)/recommendation(s), or with individual or legal entity, fund or universality of rights that act on the behalf of company’s interest; _ the fixed compensation(s) and eventual variable compensation(s) are not related to pricing of securities issued by the company object of analysis(es)/recommendation(s) in this report. The variable compensation, eventually received, is conditioned to the fulfilment of qualitative and quantitative premises established by the BES Securities board, among which, net result of activities.
Confidentiality
This report cannot be reproduced, in whole or in part, in any form or by any means, without BES Securities’ specific written authorization. This report contains information intended solely for the designated addressee. Therefore any disclosure, replication, distribution or any action taken in reliance on it, is prohibited and unlawful.
E q u i t y I b e r i a - B r a z i l
Disclosures for US Persons This document is confidential and addressed to a restricted number of entities. If you are not an addressee of this document, you should immediately destroy it. The dissemination or copy, in total or in part, of this document is not allowed. E.S. Financial Services, Inc. is the U.S. distributor of this report. E.S. Financial Services, Inc. accepts full responsibility for the content of this report. Any U.S. person receiving this report and wishing to effect securities transactions in any security discussed in the report should do so through E.S. Financial Services, Inc. and not through any non-U.S. affiliate of E.S. Financial Services, Inc. Each research analyst whose name appears in this report certifies the following, with respect to each security or issuer that the research analyst covered in this report: (1) that all of the views expressed in this report accurately reflect the personal views of the research analyst about those securities and issuers; and (2) that no part of the compensation of the research analyst was, is, or will be, directly or indirectly, related to the specific recommendations or views expressed by the research analyst in this report. The research analysts whose names appear in this report are not registered or qualified as research analysts with the Financial Industry Regulatory Authority (“FINRA”) and may not be associated persons of E.S. Financial Services, Inc. and therefore may not be subject to the applicable restrictions under FINRA Rules on communications with a subject company, public appearances and trading securities held by a research analyst account. For additional information, please refer to other investor disclosures provided herein including, but not limited to, those in the Disclosure of Interests section. Andrea Czarniak – Head of Sales (212) 351-6050 [email protected] Pedro Marques – Equity Research Sales (212) 351-6051 [email protected] Sabina Nyckowski – Equity Research Sales (212) 351-6056 [email protected] Michael Williams – Sales Trader (212) 351-6052 [email protected] E.S. Financial Services, Inc. New York Branch 340 Madison Avenue, 12th Floor New York, N.Y. 10173
E q u i t y I b e r i a - B r a s i l
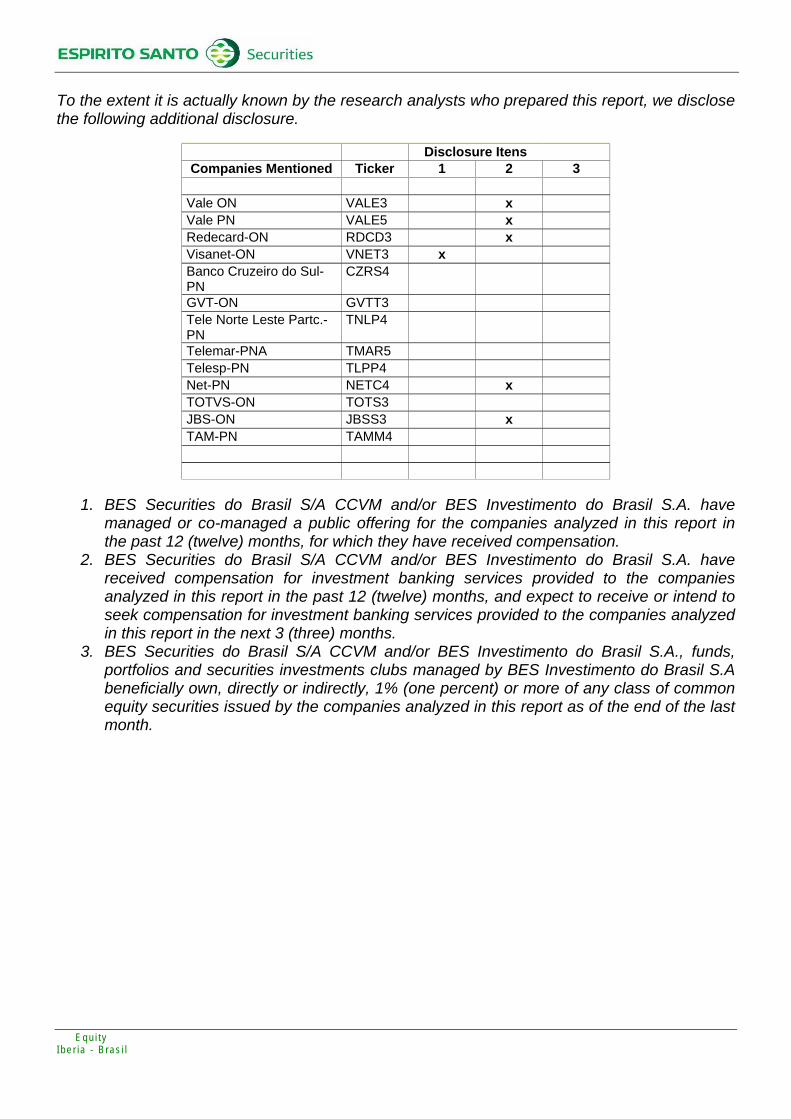
To the extent it is actually known by the research analysts who prepared this report, we disclose the following additional disclosure.
Disclosure Itens
Companies Mentioned Ticker 1 2 3 Vale ON VALE3 x Vale PN VALE5 x Redecard-ON RDCD3 x Visanet-ON VNET3 x Banco Cruzeiro do Sul-PN
CZRS4
GVT-ON GVTT3 Tele Norte Leste Partc.-PN
TNLP4
Telemar-PNA TMAR5 Telesp-PN TLPP4 Net-PN NETC4 x TOTVS-ON TOTS3 JBS-ON JBSS3 x TAM-PN TAMM4
1. BES Securities do Brasil S/A CCVM and/or BES Investimento do Brasil S.A. have
managed or co-managed a public offering for the companies analyzed in this report in the past 12 (twelve) months, for which they have received compensation.
2. BES Securities do Brasil S/A CCVM and/or BES Investimento do Brasil S.A. have received compensation for investment banking services provided to the companies analyzed in this report in the past 12 (twelve) months, and expect to receive or intend to seek compensation for investment banking services provided to the companies analyzed in this report in the next 3 (three) months.
3. BES Securities do Brasil S/A CCVM and/or BES Investimento do Brasil S.A., funds, portfolios and securities investments clubs managed by BES Investimento do Brasil S.A beneficially own, directly or indirectly, 1% (one percent) or more of any class of common equity securities issued by the companies analyzed in this report as of the end of the last month.

GLOBAL RESEARCH COORDINATOR Miguel Frasquilho [email protected] +351 21 310 6457
BES SECURITIES DO BRASIL Gilberto Pereira de Souza Rui Marques
[email protected] [email protected]
+55 11 3074 7325 +55.11.3074.7103
BRAZIL EQUITY RESEARCH Gilberto Pereira de Souza [email protected] +55 11 3074 7325
Alexandre Kogake Claudio
Juliano Martins Navarro
+55 11 3074 7327
+55 113074 7320
Leonardo Ricci Scutti [email protected] +55 11 3074 7329
Luiz Carlos Cesta [email protected] +55 11 3074 7322
Mariana Moraes de Barros [email protected] +55 11 3074 7356
MACROECONOMIC RESEARCH Carlos Almeida Andrade [email protected] +351 21 310 6493
Jankiel A. Lima dos Santos [email protected] +55 11 3074 7344 Flavio Zientara Serrano [email protected] +55 11 30747343
BRAZIL EQUITY SALES – Local Rui Marques [email protected] +55 11 3074 7103
Andre Julião [email protected] +55 11 3074 7392
Karin Augustinská [email protected] +55 11 3074 7390
Ricardo Copia [email protected] +55 11 3074 7398
BRAZIL EQUITY SALES - Iberia
Igor Maresti [email protected] +351 21 319 9735
João Gonçalves [email protected] +351 21 319 9786
BRAZIL EQUITY SALES – USA Andrea Czarniak [email protected] +1 212 351 6050
Sabina Nyckowski [email protected] +1 212 351 6056
TRADING BRAZIL – EQUITY & BM&F Luiz Eduardo Sposito [email protected] +55 11 3074 7393
Gustavo Vieira de Oliveira [email protected] +55 11 3074 7394
Jorge Alexandre G. de Almeida [email protected] +55 11 3074 7010
Diogo Vinícius N. Andrade [email protected] +55 11 3074 7369
Marcos Prado [email protected] +55 11 3074 7410
Maurício Albernaz [email protected] +55 11 3074 7009
Ney Mendonça de Aquino [email protected] +55 11 3074 7340
Simone Klein [email protected] +55 11 3074 7011
São Paulo Desk [email protected] +55 11 3074 7400
FIXED INCOME BRAZIL Paulo Augusto L.F. Saba [email protected] +55 11 3074 7358
Jorge Carlos Menezes Simão [email protected] +55 11 3074 7579
Eliana Winter Gaz [email protected] +55 11 3074 7581
Samia Ayoub [email protected] +55 11 3074 7580
FIXED INCOME EUROPE
Carlos Pinto [email protected] +351 21 310 95 81
Arnaldo Antunes (Sales & Trading) [email protected] +351 21 310 95 83
Marta Martin (Corporate Desk) [email protected] +34 91 400 53 52
Bárbara Braamcamp (Corporate Desk) [email protected] +351 21 310 95 69
FIXED INCOME USA Andrea Czarniak [email protected] +1 212 351 6050
Ivana Bouras [email protected] +1 212 351 6053
BANCO ESPÍRITO SANTO ESPIRITO SANTO DE INVESTIMENTO ESPIRITO SANTO INVESTMENT ESPÍRITO SANTO INVESTMENT
Av. da Liberdade, 195 1250 - 142 Lisboa
PORTUGAL
Rua Alexandre Herculano, 38 1269 - 161 Lisboa
PORTUGAL
Calle Serrano, 88 28006 Madrid
SPAIN
Av. Brigadeiro Faria Lima,3729 – 6º04538-905 São Paulo
BRAZIL Ombudsman: 0800-7700668