daily operations tracer summit - heating and air ... operations tracer summit ... accessing the...
TRANSCRIPT

BMTX-SVU01B-EN
Daily Operations
TRACER SUMMIT™Version 17


Daily Operations
Tracer Summit ™
Version 17
BMTX-SVU01B-EN
June 2006Tracer Summit Version 17

BMTX-SVU01B-EN
Tracer Summit Daily Operations
This guide and the information in it are the property of American Standard Inc. and shall not be used or reproduced in whole or in part, without the written permission of American Standard Inc. Trane, a business of American Standard Inc., has a policy of continuous product and product data improvement and reserves the right to change design and specification without notice.
Use of the software contained in this package is provided under a software license agreement. Unauthorized use of the software or related materials discussed in this guide can result in civil damages and criminal penalties. The terms of this license are included with the compact disk. Please read them thoroughly.
Although Trane has tested the system described in this guide, no guarantee is offered that the system is error free.
Trane reserves the right to revise this publication at any time and to make changes to its content without obligation to notify any per-son of such revision or change.
Trane may have patents or patent applications covering items in this publication. By providing this document, Trane does not imply giving license to these patents.
The following are trademarks or registered trademarks of American Standard: Tracer, Tracer Summit, Trane, Integrated Comfort, Varitrac, Tracker, and Voyager.
The following are trademarks or registered trademarks of their respective companies or organizations: ARCNET from Datapoint Corporation; CorelDRAW from Corel Corporation; Paintshop Pro from Jasc Software, Inc.; Pentium from Intel Cor-poration; and Windows from Microsoft Corporation in the United States and other countries.
Printed in the U.S.A.
© 2006 American Standard All rights reserved
™ ®
™ ®
BMTX-SVU01B-EN
NOTICE:Warnings and Cautions appear at appropriate sections throughout this manual. Read these carefully:
�WARNINGIndicates a potentially hazardous situation, which, if not avoided, could result in death or serious injury.
�CAUTIONIndicates a potentially hazardous situation, which, if not avoided, may result in minor or moderate injury.
It may also be used to alert against unsafe practices.
CAUTIONIndicates a situation that may result in equipment damage or property damage.
The following format and symbol conventions appear at appropriate sections throughout this manual:
IMPORTANTAlerts installer, servicer, or operator to potential actions that could cause the product or system to
operate improperly but will not likely result in potential for damage.
◆ This symbol precedes a procedure that consists of only a single step.
Note:
A note may be used to make the reader aware of useful information, to clarify a point, or to describe options or alternatives.
BMTX-SVU01B-EN
Contents
Contents
Chapter 1 Getting Started. . . . . . . . . . . . . . . . . . . . . . . . . . . . . 1
Tracer Summit Software . . . . . . . . . . . . . . . . . . . . . . . . . . . . . . . . . . . . . . 3
Tracer Summit Daily Operations Tutorial. . . . . . . . . . . . . . . . . . . . . . 3
Trane on the Web . . . . . . . . . . . . . . . . . . . . . . . . . . . . . . . . . . . . . . . . . 3
MyTraneControls.com . . . . . . . . . . . . . . . . . . . . . . . . . . . . . . . . . . . . . 3
Becoming a member: . . . . . . . . . . . . . . . . . . . . . . . . . . . . . . . . . . 3
Accessing MyTraneControls.com. . . . . . . . . . . . . . . . . . . . . . . . . 4
Tracer Summit Hardware . . . . . . . . . . . . . . . . . . . . . . . . . . . . . . . . . . . . . . 4
PC Workstation . . . . . . . . . . . . . . . . . . . . . . . . . . . . . . . . . . . . . . . . . . . 5
Building Control Unit (BCU) . . . . . . . . . . . . . . . . . . . . . . . . . . . . . . . . 6
Unit Control Modules (UCMs). . . . . . . . . . . . . . . . . . . . . . . . . . . . . . . 7
Chapter 2 Using the Daily Operations Tutorial . . . . . . . . . . . . 9
Using the Tutorial within Tracer Summit Software . . . . . . . . . . . . . . . . . 9
Accessing the Training Modules within Tracer Summit . . . . . . . . . 13
Schedule Training Modules . . . . . . . . . . . . . . . . . . . . . . . . . . . . 13
Override Dialog Box Training Modules . . . . . . . . . . . . . . . . . . . 15
Event Log Training Modules . . . . . . . . . . . . . . . . . . . . . . . . . . . . 16
Chiller Plant Status Training Modules . . . . . . . . . . . . . . . . . . . . 17
Reports Training Modules . . . . . . . . . . . . . . . . . . . . . . . . . . . . . . 18
Backup and Restore Training Modules . . . . . . . . . . . . . . . . . . . 19
Using the Tutorial as a Stand-alone Training Course . . . . . . . . . . . . . . 21
Accessing the Stand-alone Tutorial . . . . . . . . . . . . . . . . . . . . . . . . . 21
Using the Training Modules . . . . . . . . . . . . . . . . . . . . . . . . . . . . . . . 22
Checking Your Knowledge. . . . . . . . . . . . . . . . . . . . . . . . . . . . . . . . . 23
Obtaining Continuing Education Credit . . . . . . . . . . . . . . . . . . . . . . 23
Chapter 3 Opening and Closing Tracer Summit . . . . . . . . . . 25
Opening Tracer Summit . . . . . . . . . . . . . . . . . . . . . . . . . . . . . . . . . . . . . . 25
Minimizing (Hiding) Tracer Summit . . . . . . . . . . . . . . . . . . . . . . . . . . . . 26
Displaying Tracer Summit When it is Minimized (Hidden). . . . . . . 27
Closing Tracer Summit. . . . . . . . . . . . . . . . . . . . . . . . . . . . . . . . . . . . . . . 28
BMTX-SVU01B-EN i
Contents
Chapter 4 Logging On to and Off of Tracer Summit . . . . . . 29
Logging On to Tracer Summit . . . . . . . . . . . . . . . . . . . . . . . . . . . . . . . . . 29
Logging Off of Tracer Summit . . . . . . . . . . . . . . . . . . . . . . . . . . . . . . . . . 30
Chapter 5 Finding Your Way Around . . . . . . . . . . . . . . . . . . . 33
Menu Bar . . . . . . . . . . . . . . . . . . . . . . . . . . . . . . . . . . . . . . . . . . . . . . . . . . 34
Task Bar . . . . . . . . . . . . . . . . . . . . . . . . . . . . . . . . . . . . . . . . . . . . . . . . . . . 35
Using the Navigation Tree . . . . . . . . . . . . . . . . . . . . . . . . . . . . . . . . . 38
Displaying or Hiding the Navigation Tree. . . . . . . . . . . . . . . . . . . . . 39
Opening a Site . . . . . . . . . . . . . . . . . . . . . . . . . . . . . . . . . . . . . . . . . . . . . . 39
Opening Other Sites . . . . . . . . . . . . . . . . . . . . . . . . . . . . . . . . . . . . . . . . . 40
Opening Tracer 100/Tracker Sites. . . . . . . . . . . . . . . . . . . . . . . . . . . . . . . 40
Closing a Site. . . . . . . . . . . . . . . . . . . . . . . . . . . . . . . . . . . . . . . . . . . . . . . 41
Help Information . . . . . . . . . . . . . . . . . . . . . . . . . . . . . . . . . . . . . . . . . . . . 41
Chapter 6 Using Terminal Emulation and Keyboard Macros 43
Accessing Terminal Emulation. . . . . . . . . . . . . . . . . . . . . . . . . . . . . . . . . 44
Accessing Keyboard Macros . . . . . . . . . . . . . . . . . . . . . . . . . . . . . . . . . . 45
Switching to Another Panel in the Site . . . . . . . . . . . . . . . . . . . . . . . . . . 46
Using Terminal Emulation Screen Options. . . . . . . . . . . . . . . . . . . . . . . 46
Saving Screen Text to a File . . . . . . . . . . . . . . . . . . . . . . . . . . . . . . . . 47
Printing Screen Text . . . . . . . . . . . . . . . . . . . . . . . . . . . . . . . . . . . . . . 47
Copying Text . . . . . . . . . . . . . . . . . . . . . . . . . . . . . . . . . . . . . . . . . . . . 48
Changing the Window Color Scheme . . . . . . . . . . . . . . . . . . . . . . . . 48
Chapter 7 Displaying and Changing Status Information . . . 51
Displaying Status Information on Graphics . . . . . . . . . . . . . . . . . . . . . . 51
Viewing a Graphic From the Navigation Tree. . . . . . . . . . . . . . . . . . 52
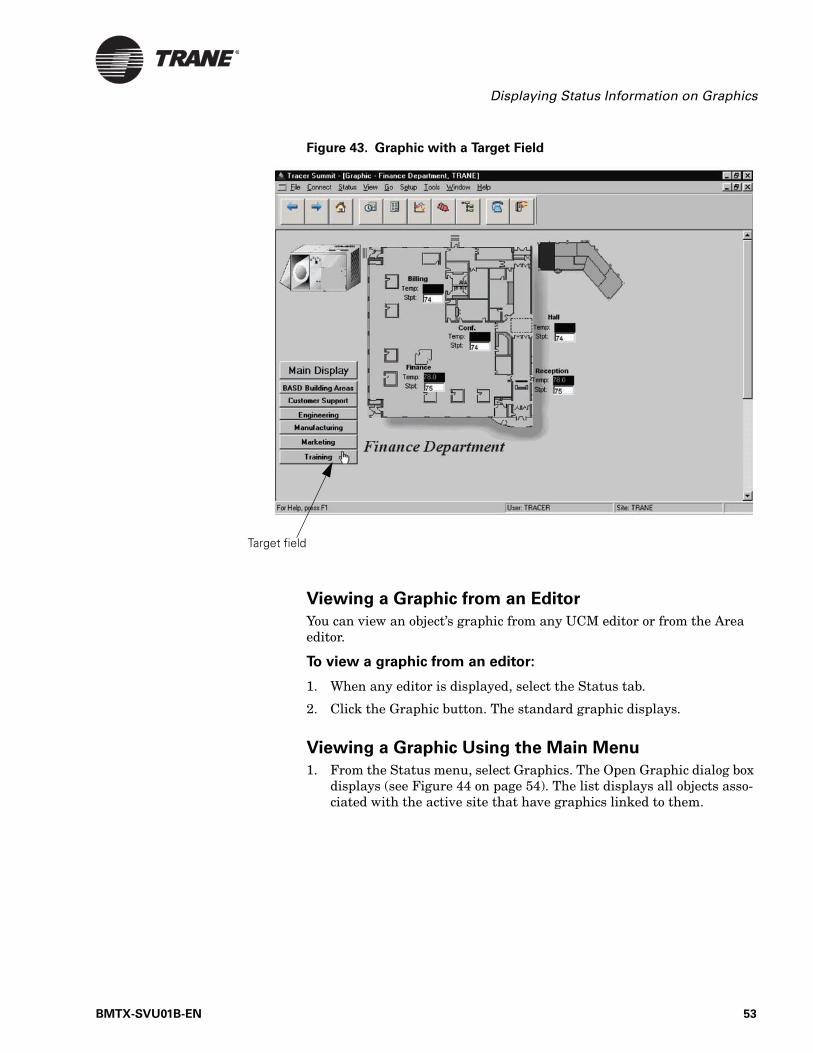
Viewing a Graphic from a Graphic with a Target Field . . . . . . . . . . 52
Viewing a Graphic from an Editor . . . . . . . . . . . . . . . . . . . . . . . . . . . 53
Viewing a Graphic Using the Main Menu. . . . . . . . . . . . . . . . . . . . . 53
Viewing a Graphic Using the Task Bar Buttons . . . . . . . . . . . . . . . . 54
Closing a Graphic . . . . . . . . . . . . . . . . . . . . . . . . . . . . . . . . . . . . . . . . 54
Changing System Values (Overrides and Setpoints) . . . . . . . . . . . . . . . 55
Overriding System Values . . . . . . . . . . . . . . . . . . . . . . . . . . . . . . . . . 56
Displaying Override Status . . . . . . . . . . . . . . . . . . . . . . . . . . . . . . . . 57
Setting Up the Simplified Override Dialog Box . . . . . . . . . . . . . . . . . . . 58
Accessing the Simplified Override Dialog box . . . . . . . . . . . . . . . . . . . . 60
Using the Override Control button . . . . . . . . . . . . . . . . . . . . . . . . . . 60
ii BMTX-SVU01B-EN
Contents
Using a Pop-up Menu . . . . . . . . . . . . . . . . . . . . . . . . . . . . . . . . . . . . 61
Using the Simplified Override Dialog Box . . . . . . . . . . . . . . . . . . . . . . . 62
Overriding an Analog Output . . . . . . . . . . . . . . . . . . . . . . . . . . . . . . 62
Changing the Min/Max Output Range . . . . . . . . . . . . . . . . . . . . 63
Overriding an Analog Output or Analog Value in a Non-Trane BACnet Device . . . . . . . . . . . . . . . . . . . . . . . . . . . . . . . . . . . . . . . . . 64
Overriding a Multi-State Analog Output . . . . . . . . . . . . . . . . . . . . . 65
Overriding a Multi-State Output in a non-Trane BACnet Device . . 66
Overriding a Binary Output or a Lighting Value . . . . . . . . . . . . . . . 67
Overriding a Binary Output or Binary Value in a Non-Trane BACnet Device. . . . . . . . . . . . . . . . . . . . . . . . . . . . . . . . 68
Overriding a UCM or Application . . . . . . . . . . . . . . . . . . . . . . . . . . . 70
Releasing Control Back to the System . . . . . . . . . . . . . . . . . . . . . . . 71
Trane Objects . . . . . . . . . . . . . . . . . . . . . . . . . . . . . . . . . . . . . . . . 71
Non-Trane BACnet devices . . . . . . . . . . . . . . . . . . . . . . . . . . . . . 71
Using the Advanced Systems Override . . . . . . . . . . . . . . . . . . . . . . . . . 72
Overriding the Present Value Control . . . . . . . . . . . . . . . . . . . . . . . . 73
Releasing Control with Present Value Control . . . . . . . . . . . . . . . . . 73
Changing Setpoints . . . . . . . . . . . . . . . . . . . . . . . . . . . . . . . . . . . . . . 74
Changing Binary Values with Binary Check Box Controls . . . . . . . 74
Changing System Values with Selection List Controls . . . . . . . . . . 74
Making a Timed Override Request . . . . . . . . . . . . . . . . . . . . . . . . . . 75
Using the Graphics Pop-up Menu . . . . . . . . . . . . . . . . . . . . . . . . . . . . . . 77
Open Trend Viewer. . . . . . . . . . . . . . . . . . . . . . . . . . . . . . . . . . . . . . . 77
Edit. . . . . . . . . . . . . . . . . . . . . . . . . . . . . . . . . . . . . . . . . . . . . . . . . . . . 77
View Schedule . . . . . . . . . . . . . . . . . . . . . . . . . . . . . . . . . . . . . . . . . . 77
View Report. . . . . . . . . . . . . . . . . . . . . . . . . . . . . . . . . . . . . . . . . . . . . 77
Displaying Information on a Graph . . . . . . . . . . . . . . . . . . . . . . . . . 78
Chapter 8 Changing Schedules . . . . . . . . . . . . . . . . . . . . . . . 79
Understanding the Scheduling Screen . . . . . . . . . . . . . . . . . . . . . . . . . . 80
Displaying the Scheduling Screen. . . . . . . . . . . . . . . . . . . . . . . . . . . . . . 82
Closing the Scheduling Screen . . . . . . . . . . . . . . . . . . . . . . . . . . . . . . . . 84
Selecting the Calendar Month and Day . . . . . . . . . . . . . . . . . . . . . . . . . 85
Displaying the Daily Events in a Schedule . . . . . . . . . . . . . . . . . . . . . . . 86
About Event Time Bars . . . . . . . . . . . . . . . . . . . . . . . . . . . . . . . . . . . 86
Types of Events . . . . . . . . . . . . . . . . . . . . . . . . . . . . . . . . . . . . . . . . . 87
Changing Start or End Times of Events . . . . . . . . . . . . . . . . . . . . . . . . . 88
Adding an Exception to a Schedule . . . . . . . . . . . . . . . . . . . . . . . . . . . . 89
Creating an Exception Template . . . . . . . . . . . . . . . . . . . . . . . . . . . . . . . 90
BMTX-SVU01B-EN iii
Contents
Applying an Exception Template . . . . . . . . . . . . . . . . . . . . . . . . . . . . . . . 92
Modifying an Exception Template . . . . . . . . . . . . . . . . . . . . . . . . . . . . . . 93
Handling Holidays for BCU Panels. . . . . . . . . . . . . . . . . . . . . . . . . . . . . . 94
Apply an Existing Holiday to a Schedule . . . . . . . . . . . . . . . . . . . . . 94
Defining a New Holiday . . . . . . . . . . . . . . . . . . . . . . . . . . . . . . . . . . . 96
Modifying a Holiday . . . . . . . . . . . . . . . . . . . . . . . . . . . . . . . . . . . . . . 97
Handling Holidays for Tracer 100 Panels. . . . . . . . . . . . . . . . . . . . . . . . . 98
Defining New Holiday Dates . . . . . . . . . . . . . . . . . . . . . . . . . . . . . . . 98
Clearing a Holiday Date . . . . . . . . . . . . . . . . . . . . . . . . . . . . . . . . . . . 98
Modifying a Holiday Date. . . . . . . . . . . . . . . . . . . . . . . . . . . . . . . . . . 99
Removing Exceptions and Holidays . . . . . . . . . . . . . . . . . . . . . . . . . . . . 99
Linking and Unlinking Events to Days. . . . . . . . . . . . . . . . . . . . . . . . . . 100
Creating Schedule Reports . . . . . . . . . . . . . . . . . . . . . . . . . . . . . . . . . . . 102
Adding event information to the report . . . . . . . . . . . . . . . . . . . . . 104
Chapter 9 Handling Alarms and Events. . . . . . . . . . . . . . . . 105
Displaying the Event Log . . . . . . . . . . . . . . . . . . . . . . . . . . . . . . . . . . . . 108
Understanding the Event Log . . . . . . . . . . . . . . . . . . . . . . . . . . . . . . . . 109
Viewing the Event Log Tab. . . . . . . . . . . . . . . . . . . . . . . . . . . . . . . . 109
Configuring Category Alarm Pop-ups . . . . . . . . . . . . . . . . . . . . . . . . . . 112
Temporarily Disabling a Category Alarm Pop-up . . . . . . . . . . . . . 114
Using the Pop-up Dialog Box. . . . . . . . . . . . . . . . . . . . . . . . . . . . . . 115
Adding a comment to the event log . . . . . . . . . . . . . . . . . . . . . 115
Viewing the BCU Event Log Tab . . . . . . . . . . . . . . . . . . . . . . . . . . . 116
Viewing the Error Log. . . . . . . . . . . . . . . . . . . . . . . . . . . . . . . . . . . . 117
Closing the Event Log . . . . . . . . . . . . . . . . . . . . . . . . . . . . . . . . . . . . . . . 118
Silencing the Audible Alarm . . . . . . . . . . . . . . . . . . . . . . . . . . . . . . . . . 119
Acknowledging an Alarm . . . . . . . . . . . . . . . . . . . . . . . . . . . . . . . . . . . . 120
Acknowledging Alarms Received at the PC Workstation . . . . . . . 121
Acknowledging Alarms in the BCU Event Log . . . . . . . . . . . . . . . . 121
Refreshing the Event Log . . . . . . . . . . . . . . . . . . . . . . . . . . . . . . . . . . . . 122
Displaying an Expanded Message. . . . . . . . . . . . . . . . . . . . . . . . . . . . . 124
Sorting the Event Log . . . . . . . . . . . . . . . . . . . . . . . . . . . . . . . . . . . . . . . 125
Rearranging Columns . . . . . . . . . . . . . . . . . . . . . . . . . . . . . . . . 126
Hiding Columns . . . . . . . . . . . . . . . . . . . . . . . . . . . . . . . . . . . . . 127
Filtering the Event Log . . . . . . . . . . . . . . . . . . . . . . . . . . . . . . . . . . . . . . 127
Selecting Filter Criteria . . . . . . . . . . . . . . . . . . . . . . . . . . . . . . . . . . . 128
Setting up a Default Filter. . . . . . . . . . . . . . . . . . . . . . . . . . . . . . . . . 129
Printing Alarms and Events . . . . . . . . . . . . . . . . . . . . . . . . . . . . . . . . . . 131
Printing the Entire Event Log . . . . . . . . . . . . . . . . . . . . . . . . . . . . . . 131
iv BMTX-SVU01B-EN
Contents
Printing Selected Alarms and Events . . . . . . . . . . . . . . . . . . . . . . . 131
Saving the Event Log . . . . . . . . . . . . . . . . . . . . . . . . . . . . . . . . . . . . . . . 134
Deleting Alarms and Events . . . . . . . . . . . . . . . . . . . . . . . . . . . . . . . . . 135
Deleting an Alarm or Event . . . . . . . . . . . . . . . . . . . . . . . . . . . . . . . 136
Deleting More Than One Alarm or Event. . . . . . . . . . . . . . . . . . . . 137
Deleting a Block of Alarms or Events . . . . . . . . . . . . . . . . . . . . . . . 138
Deleting the Entire Event Log . . . . . . . . . . . . . . . . . . . . . . . . . . . . . 138
Chapter 10 Running Reports. . . . . . . . . . . . . . . . . . . . . . . . . . 141
Running a Standard Live Report . . . . . . . . . . . . . . . . . . . . . . . . . . . . . . 144
Running a Standard Live Report from a Graphic with Associated Reports . . . . . . . . . . . . . . . . . . . . . . . . . . . . . . . . 144
Running a Standard Live Report in Other Situations . . . . . . . . . . 145
Running a Standard Live Site Report . . . . . . . . . . . . . . . . . . . . . . . . . . 148
Running a Standard Trend Report. . . . . . . . . . . . . . . . . . . . . . . . . . . . . 151
Running a Custom Report . . . . . . . . . . . . . . . . . . . . . . . . . . . . . . . . . . . 153
Displaying a Saved Report. . . . . . . . . . . . . . . . . . . . . . . . . . . . . . . . . . . 155
Displaying a Recently Viewed Report . . . . . . . . . . . . . . . . . . . . . . . . . . 158
About the Report Viewer . . . . . . . . . . . . . . . . . . . . . . . . . . . . . . . . . . . . 160
Saving a Report. . . . . . . . . . . . . . . . . . . . . . . . . . . . . . . . . . . . . . . . . . . . 162
Printing a Report . . . . . . . . . . . . . . . . . . . . . . . . . . . . . . . . . . . . . . . . . . . 165
Chapter 11 Using the Trend Viewer . . . . . . . . . . . . . . . . . . . . 167
Setting up the Trend Viewer . . . . . . . . . . . . . . . . . . . . . . . . . . . . . . . . . 168
Setting up Properties from Pop-up Menus in a Graphic . . . . . . . . 173
Creating a Trend Viewer. . . . . . . . . . . . . . . . . . . . . . . . . . . . . . . . . . . . . 174
Creating a Trend Viewer From the Setup Menu . . . . . . . . . . . . . . 174
Creating a Trend Viewer from a Property in a Graphic . . . . . . . . . 176
Opening a Trend Viewer. . . . . . . . . . . . . . . . . . . . . . . . . . . . . . . . . . . . . 177
Opening a Trend Viewer from the Setup Menu. . . . . . . . . . . . . . . 177
Opening a Trend Viewer from a Graphic . . . . . . . . . . . . . . . . . . . . 178
Opening a Trend Viewer from the Toolbar. . . . . . . . . . . . . . . . . . . 180
Saving a New Trend Viewer . . . . . . . . . . . . . . . . . . . . . . . . . . . . . . 181
Adding to a Trend Viewer . . . . . . . . . . . . . . . . . . . . . . . . . . . . . . . . . . . 182
Working with the Trend Viewer . . . . . . . . . . . . . . . . . . . . . . . . . . . . . . . 183
Trend Viewer Toolbar . . . . . . . . . . . . . . . . . . . . . . . . . . . . . . . . . . . . 184
Trend Viewer Chart. . . . . . . . . . . . . . . . . . . . . . . . . . . . . . . . . . . . . . 185
Viewing the Legend. . . . . . . . . . . . . . . . . . . . . . . . . . . . . . . . . . 186
Changing the Legend Member Name . . . . . . . . . . . . . . . . . . . 186
Icons . . . . . . . . . . . . . . . . . . . . . . . . . . . . . . . . . . . . . . . . . . . . . . 187
BMTX-SVU01B-EN v

Contents
Changing Data Marker Settings . . . . . . . . . . . . . . . . . . . . . . . . 187
The Grid . . . . . . . . . . . . . . . . . . . . . . . . . . . . . . . . . . . . . . . . . . . 187
Trend Viewer Main Control Buttons . . . . . . . . . . . . . . . . . . . . . . . . 188
Selecting a Date Range . . . . . . . . . . . . . . . . . . . . . . . . . . . . . . . 189
Historical Trends in the Audit Trail Database . . . . . . . . . . . . . . . . . . . . 190
Viewing Historical Trends. . . . . . . . . . . . . . . . . . . . . . . . . . . . . . . . . 190
Chapter 12 Backing up Tracer Summit . . . . . . . . . . . . . . . . . 193
Backing up a Location . . . . . . . . . . . . . . . . . . . . . . . . . . . . . . . . . . . . . . . 194
Backing up Global Graphics . . . . . . . . . . . . . . . . . . . . . . . . . . . . . . . . . . 198
Backing up Site Graphics . . . . . . . . . . . . . . . . . . . . . . . . . . . . . . . . . . . . 200
Backing up Reports . . . . . . . . . . . . . . . . . . . . . . . . . . . . . . . . . . . . . . . . . 202
Backing up Custom Screens. . . . . . . . . . . . . . . . . . . . . . . . . . . . . . . . . . 204
Chapter 13 Changing Chiller Plant Status Information . . . . 207
Viewing Chiller Plant Control Status . . . . . . . . . . . . . . . . . . . . . . . . . . . 208
Resetting Chiller Failures . . . . . . . . . . . . . . . . . . . . . . . . . . . . . . . . . . . . 209
Resetting an Individual Chiller Failure . . . . . . . . . . . . . . . . . . . . . . 209
Resetting All Chiller Plant Failures . . . . . . . . . . . . . . . . . . . . . . . . . 211
Forcing a Chiller to be Added. . . . . . . . . . . . . . . . . . . . . . . . . . . . . . . . . 213
Forcing a Chiller to be Subtracted . . . . . . . . . . . . . . . . . . . . . . . . . . . . . 213
Making a Chiller Unavailable . . . . . . . . . . . . . . . . . . . . . . . . . . . . . . . . . 214
Making a Chiller Available . . . . . . . . . . . . . . . . . . . . . . . . . . . . . . . . . . . 214
Forcing the Chiller Sequence to be Rotated . . . . . . . . . . . . . . . . . . . . . 215
Glossary . . . . . . . . . . . . . . . . . . . . . . . . . . . . . . . . 219
Reader Response Form . . . . . . . . . . . . . . . . . . . . 227
Index . . . . . . . . . . . . . . . . . . . . . . . . . . . . . . . . . . . 229
vi BMTX-SVU01B-EN
Chapter 1
Getting Started
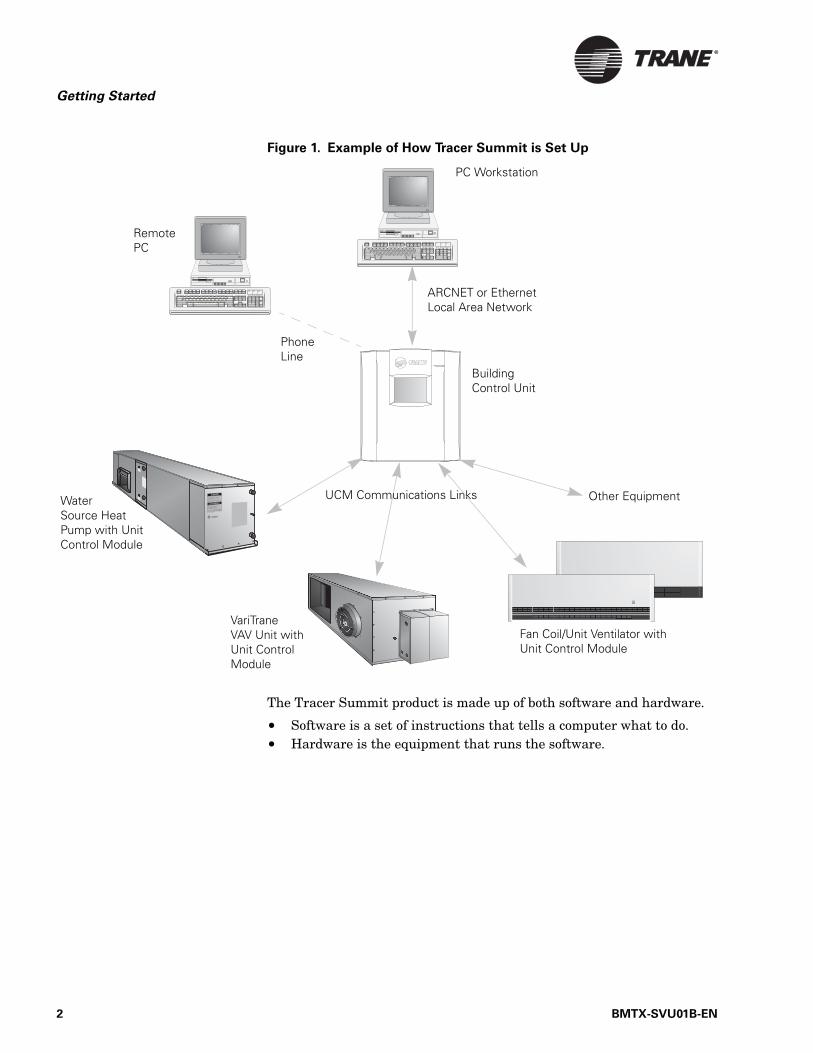
Tracer Summit is a building control system designed to manage a facil-ity’s comfort, lighting, and related electrical systems. The Tracer Summit system is made up of Personal Computer (PC) Workstations, building con-trol units (BCUs), and unit control modules (UCMs). Some Tracer Sum-mit software packages also have the ability to monitor Tracer 100 and Tracker (model EMTK) sites.
The PC Workstation runs Tracer Summit software that serves as an interface between you and the system. A local area network connects Tracer Summit to BCUs, which are connected to the heating, ventilation, and air conditioning (HVAC) equipment UCMs (see Figure 1 on page 2). Larger systems can have multiple PC Workstations and BCUs.
BMTX-SVU01B-EN 1
Getting Started
Figure 1. Example of How Tracer Summit is Set Up
The Tracer Summit product is made up of both software and hardware.
• Software is a set of instructions that tells a computer what to do.• Hardware is the equipment that runs the software.
Water Source Heat Pump with Unit Control Module
PC Workstation
Remote PC
Building Control Unit
ARCNET or Ethernet Local Area Network
UCM Communications Links
Phone Line
Other Equipment
Fan Coil/Unit Ventilator with Unit Control Module
VariTrane VAV Unit with Unit Control Module
2 BMTX-SVU01B-EN
Tracer Summit Software
Tracer Summit SoftwareThe Tracer Summit software tells the hardware how to operate. For example, it sends electronic instructions through the building control unit to the unit control modules and on to the HVAC units. The software lets you control the operation of HVAC units located elsewhere in a building.
Tracer Summit Daily Operations Tutorial
The Tracer Summit Daily Operations Tutorial, Focus on Your System, is a four-hour, computer-based training tutorial. The tutorial is designed to teach a daily operator the basic tasks necessary to operate a Tracer Sum-mit system (see Chapter 2, “Using the Daily Operations Tutorial”).
Trane on the Web
Use the Help menu to access Trane materials on the Web. From the Help menu, select one of the following:
• MyTraneControls.com: To access the MyTraneControls Web site (see “MyTraneControls.com” below)
• Send Feedback: To send your comments and questions to Trane• Trane Home Page: To access the trane.com site where you can learn
more about Trane and its products and services, read the latest Trane news, and access contact information.
MyTraneControls.com
You can find additional information and online support for your Tracer Summit system by registering with MyTraneControls.com. It provides:
• Tips, techniques, and articles to teach you more about how to use the system
• Factory direct technical support via e-mail• Latest versions of software delivered directly to you at no charge• Service packs to keep your system updated• Users forums to share ideas and issues with other users• Libraries of graphics and custom programs• Other valuable online content
Becoming a member:
Membership to MyTraneControls.com is provided free of charge to Tracer Summit owners and operators. As a new Tracer Summit owner, you auto-matically become a member. More information is available from your local Trane sales office or at www.tracersummit.trane.com.
BMTX-SVU01B-EN 3
Getting Started
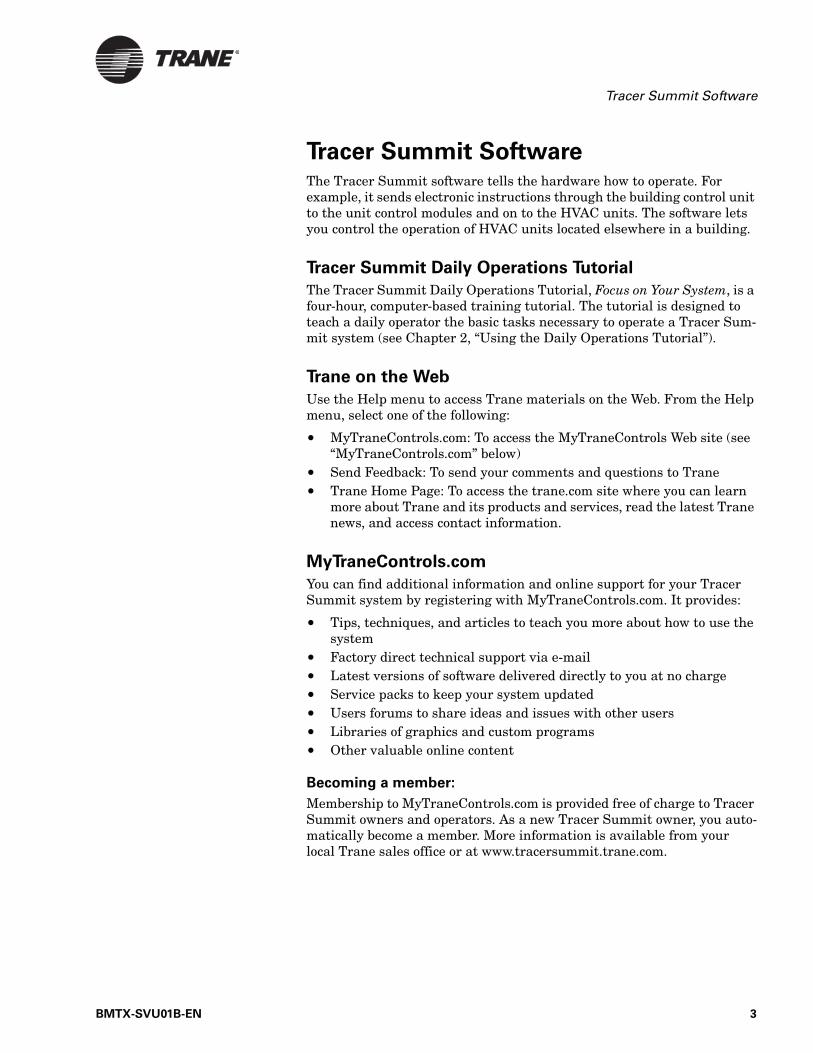
Accessing MyTraneControls.com
You can easily go to the MyTraneControls by:
• Clicking the My Trane Controls button on the standard site graphic (see Figure 2),
• Selecting MyTraneControls.com from the Help menu, or • Clicking the shortcut icon added to your desktop when Tracer Sum-
mit was installed.
Figure 2. MyTraneControls.com button
Tracer Summit HardwareTracer Summit’s hardware consists of the following items:
• PC Workstation• Building control units (BCUs)• Unit control modules (UCMs)
Other hardware you may have includes:
• Tracer 100 series panels• Tracker panels (EMTK Version 6.x and lower)
The PC Workstation, building control units, and unit control modules are described in the following sections of this chapter. See Table 1 on page 5 for user guides containing descriptions of the Tracer 100 and Tracker EMTK series panels.
Click here to go to the MyTraneControls Web site
4 BMTX-SVU01B-EN
Tracer Summit Hardware
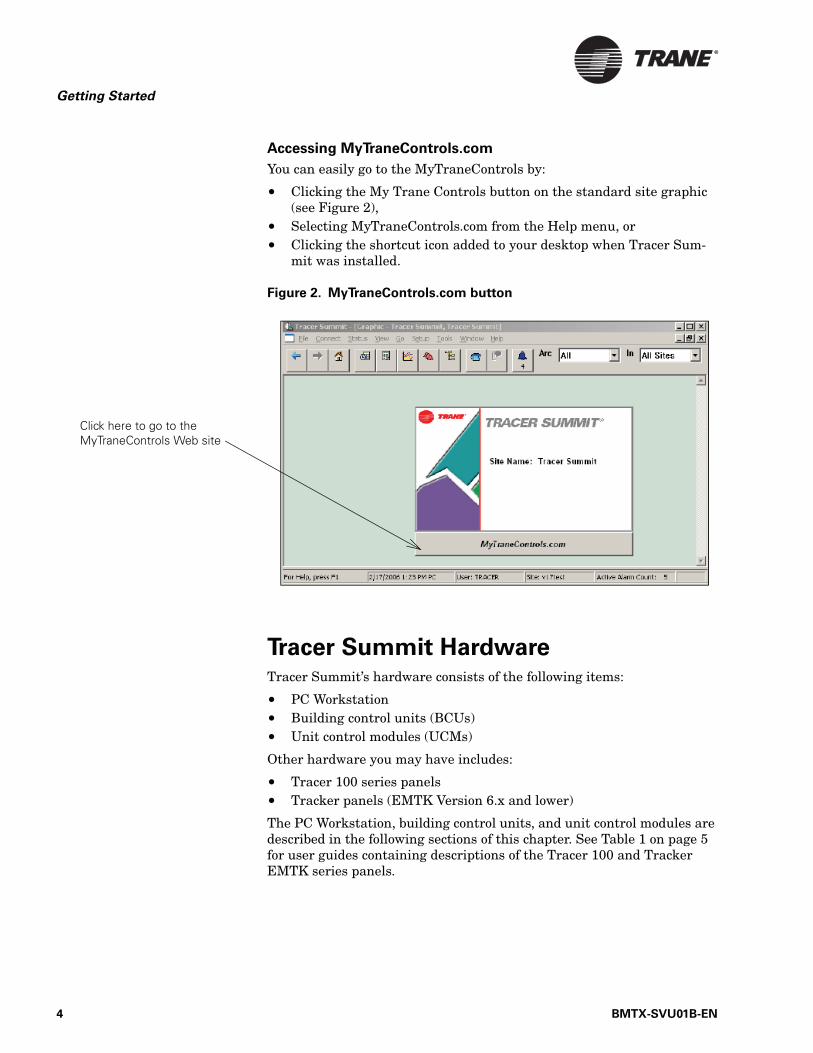
PC Workstation
You perform all of the daily operations tasks at the PC Workstation using the Tracer Summit software. The PC Workstation and Tracer Summit software are connected to the building control units and the unit control modules.
The workstation consists of these main components:
• Computer monitor• CPU (central processing unit)• Mouse• Keyboard
You may have additional equipment, such as a printer (see Figure 3).
Figure 3. PC Workstation Components
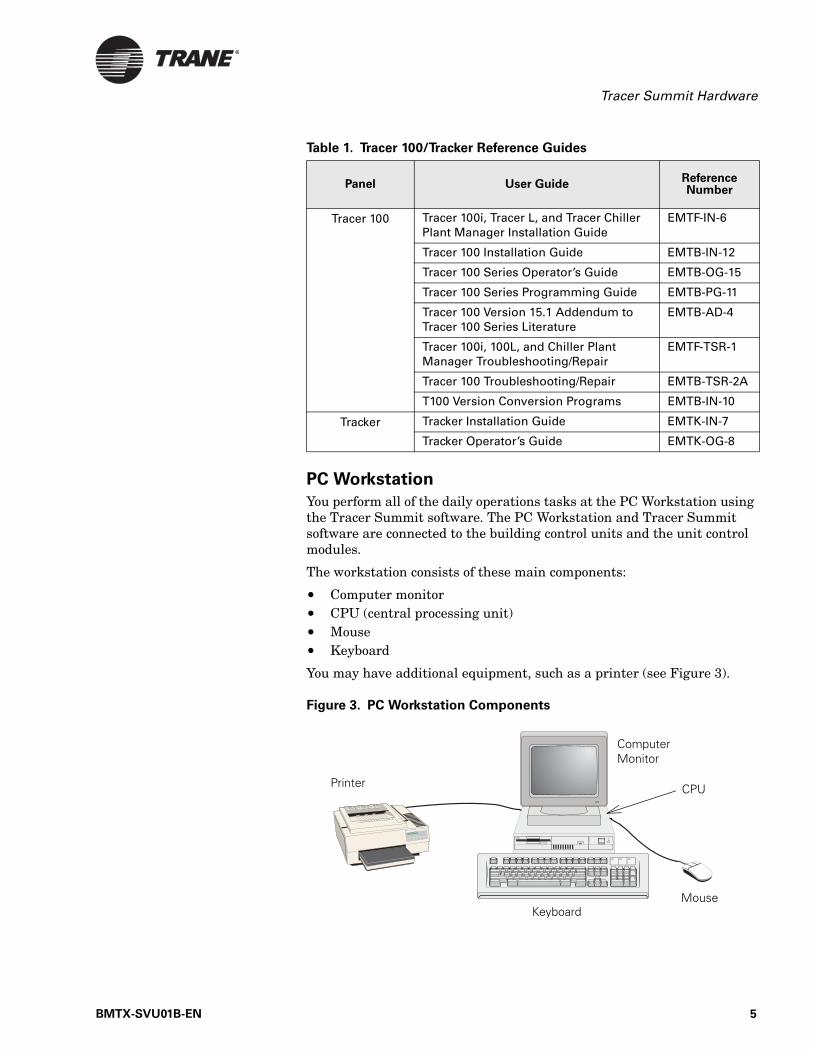
Table 1. Tracer 100/Tracker Reference Guides
Panel User GuideReference Number
Tracer 100 Tracer 100i, Tracer L, and Tracer Chiller Plant Manager Installation Guide
EMTF-IN-6
Tracer 100 Installation Guide EMTB-IN-12
Tracer 100 Series Operator’s Guide EMTB-OG-15
Tracer 100 Series Programming Guide EMTB-PG-11
Tracer 100 Version 15.1 Addendum to Tracer 100 Series Literature
EMTB-AD-4
Tracer 100i, 100L, and Chiller Plant Manager Troubleshooting/Repair
EMTF-TSR-1
Tracer 100 Troubleshooting/Repair EMTB-TSR-2A
T100 Version Conversion Programs EMTB-IN-10
Tracker Tracker Installation Guide EMTK-IN-7
Tracker Operator’s Guide EMTK-OG-8
Computer Monitor
CPU
Mouse
Printer
Keyboard
BMTX-SVU01B-EN 5
Getting Started
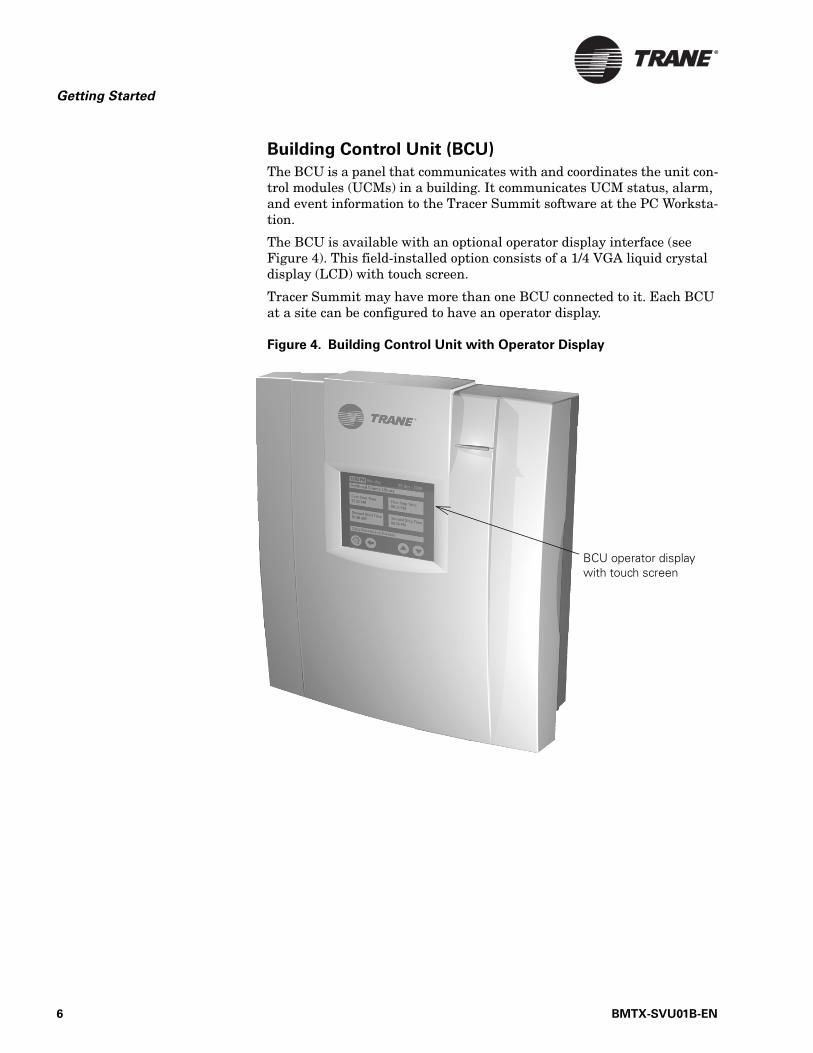
Building Control Unit (BCU)
The BCU is a panel that communicates with and coordinates the unit con-trol modules (UCMs) in a building. It communicates UCM status, alarm, and event information to the Tracer Summit software at the PC Worksta-tion.
The BCU is available with an optional operator display interface (see Figure 4). This field-installed option consists of a 1/4 VGA liquid crystal display (LCD) with touch screen.
Tracer Summit may have more than one BCU connected to it. Each BCU at a site can be configured to have an operator display.
Figure 4. Building Control Unit with Operator Display
BCU operator display with touch screen
6 BMTX-SVU01B-EN

Tracer Summit Hardware
Unit Control Modules (UCMs)
A UCM is a control panel that is located on or near an HVAC unit (see Figure 5). An HVAC unit is a piece of equipment such as a chiller or a rooftop unit.
Figure 5. Unit Control Module
The UCM controls how the HVAC unit operates. For example, the UCM for a rooftop unit controls things such as its cooling setpoint and when its compressor turns off.
UCM
BMTX-SVU01B-EN 7

Getting Started
8 BMTX-SVU01B-EN

Chapter 2
Using the Daily Operations
Tutorial
The daily operations tutorial Focus on Your System can be used in two ways. You can use the tutorial as a self-paced training course to get train-ing on basic Tracer Summit operations. Or you can access the tutorial from the Tracer Summit software to get training on a specific task before performing it within Tracer Summit.
This chapter is divided into two sections:
• Using the Tutorial within Tracer Summit Software• Using the Tutorial as a Stand-alone Training Course
Using the Tutorial within Tracer Summit
SoftwareTo use the Tracer Summit Daily Operations Tutorial, you must first run the tutorial installation program on your PC. (Refer to the Tracer Summit Hardware and Software Installation guide.) After you have installed the program, tutorial buttons appear on the following:
• Schedule window• Overrides dialog box• Event Log window• Chiller Plant Status screen• Reports window• Backup dialog box• Restore Site dialog box
Figure 6 on page 10 shows an example of a tutorial button in Tracer Sum-mit. The tutorial buttons give you access to specific training modules on the tutorial CD-ROM. To access the training modules, you must have the Daily Operations Tutorial CD-ROM in the CD-ROM drive of your PC.
BMTX-SVU01B-EN 9

Using the Daily Operations Tutorial
Figure 6. Schedule Screen—Tutorial Button
To access a training module from Tracer Summit:
1. From the appropriate screen, window, or dialog box, click the Tutorial button. The Tracer Summit Tutorial Menu displays (see Figure 7 on page 11).
Tutorial button
10 BMTX-SVU01B-EN

Using the Tutorial within Tracer Summit Software
Figure 7. Tutorial Task-based Menu
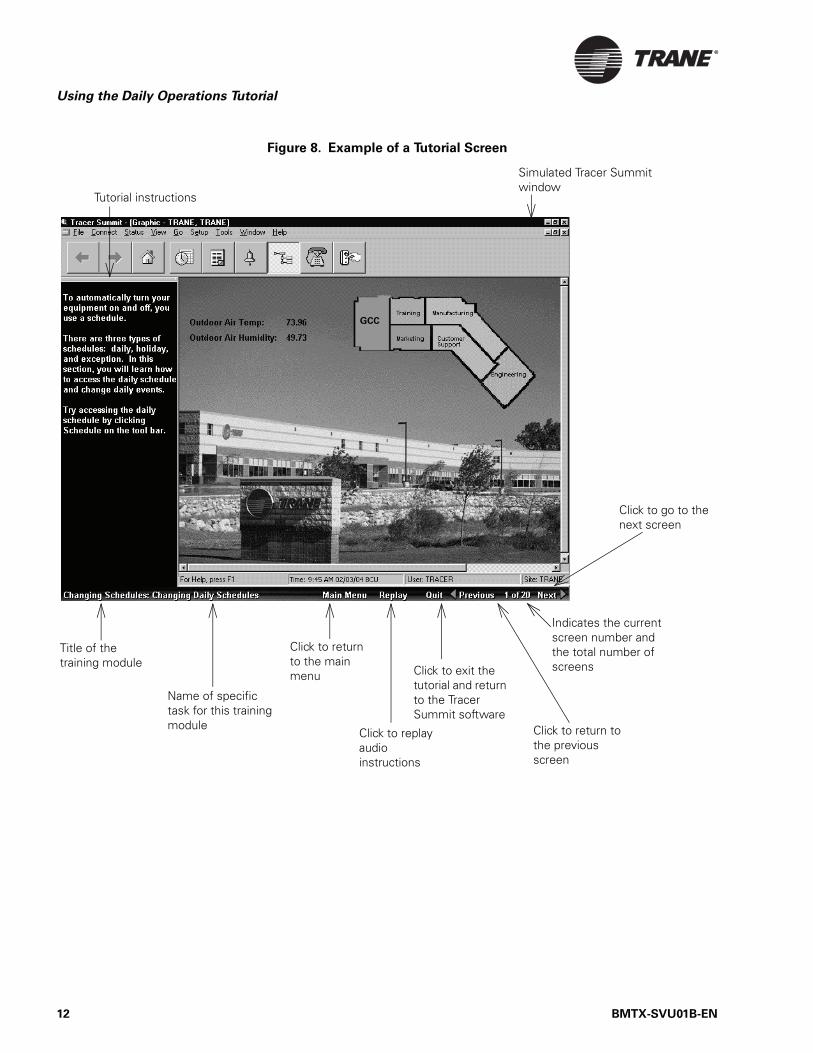
2. Click on a training module to start the tutorial. Figure 8 on page 12 shows an example of a Tracer Summit tutorial screen.
3. Work through the examples by following the instructions.
4. To return to the Tracer Summit software, click the Quit button at the bottom of the tutorial screen.
Note:
When the tutorial menu is accessed from the Tracer Summit software, it shows only training modules for a specific task. To access the complete tutorial, refer to “Using the Tutorial as a Stand-alone Training Course” on page 21.
BMTX-SVU01B-EN 11
Using the Daily Operations Tutorial
Figure 8. Example of a Tutorial Screen
Click to go to the next screen
Simulated Tracer Summit window
Tutorial instructions
Title of the training module
Name of specific task for this training module
Click to return to the main menu
Click to replay audio instructions
Click to exit the tutorial and return to the Tracer Summit software
Click to return to the previous screen
Indicates the current screen number and the total number of screens
GCC
12 BMTX-SVU01B-EN
Using the Tutorial within Tracer Summit Software
Accessing the Training Modules within Tracer Summit
To access the training modules, you must have the Daily Operations Tutorial CD-ROM in the CD-ROM drive of your PC.
Schedule Training Modules
The Schedule screen is linked to the following training modules:
• Changing Daily Schedules• Changing Exception Templates• Practice Changing Schedules
To access the Schedule training modules:
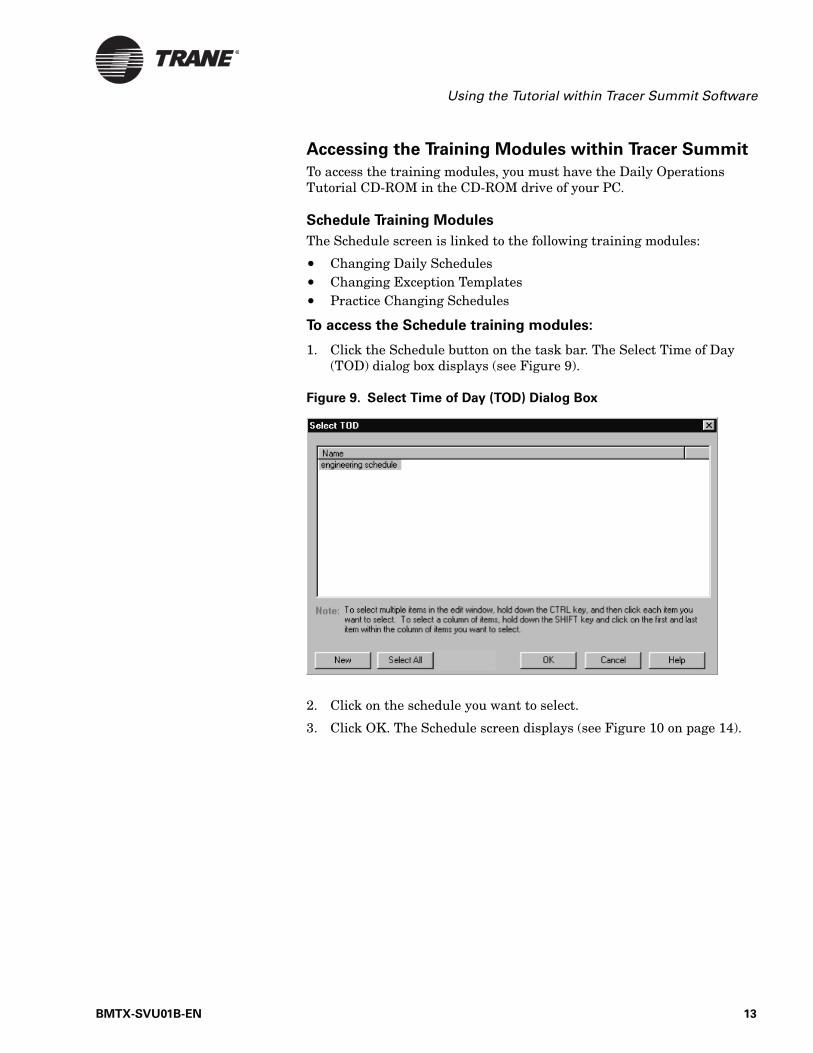
1. Click the Schedule button on the task bar. The Select Time of Day (TOD) dialog box displays (see Figure 9).
Figure 9. Select Time of Day (TOD) Dialog Box
2. Click on the schedule you want to select.
3. Click OK. The Schedule screen displays (see Figure 10 on page 14).
BMTX-SVU01B-EN 13
Using the Daily Operations Tutorial
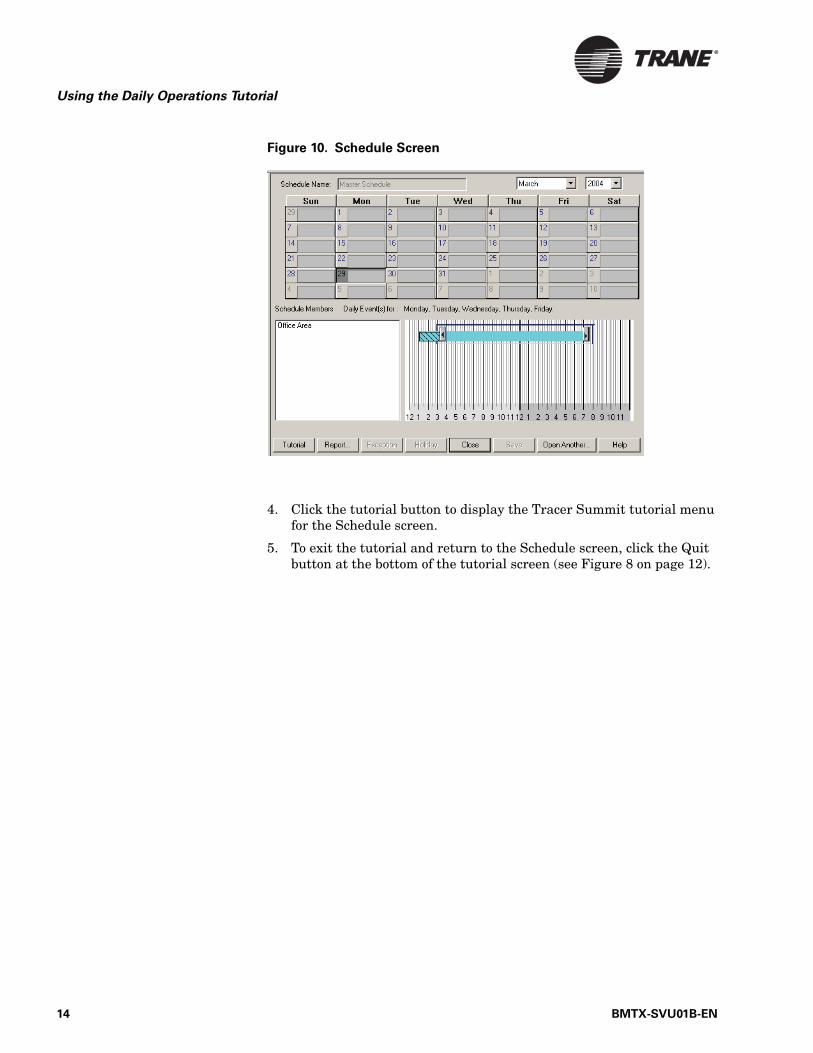
Figure 10. Schedule Screen
4. Click the tutorial button to display the Tracer Summit tutorial menu for the Schedule screen.
5. To exit the tutorial and return to the Schedule screen, click the Quit button at the bottom of the tutorial screen (see Figure 8 on page 12).
14 BMTX-SVU01B-EN
Using the Tutorial within Tracer Summit Software
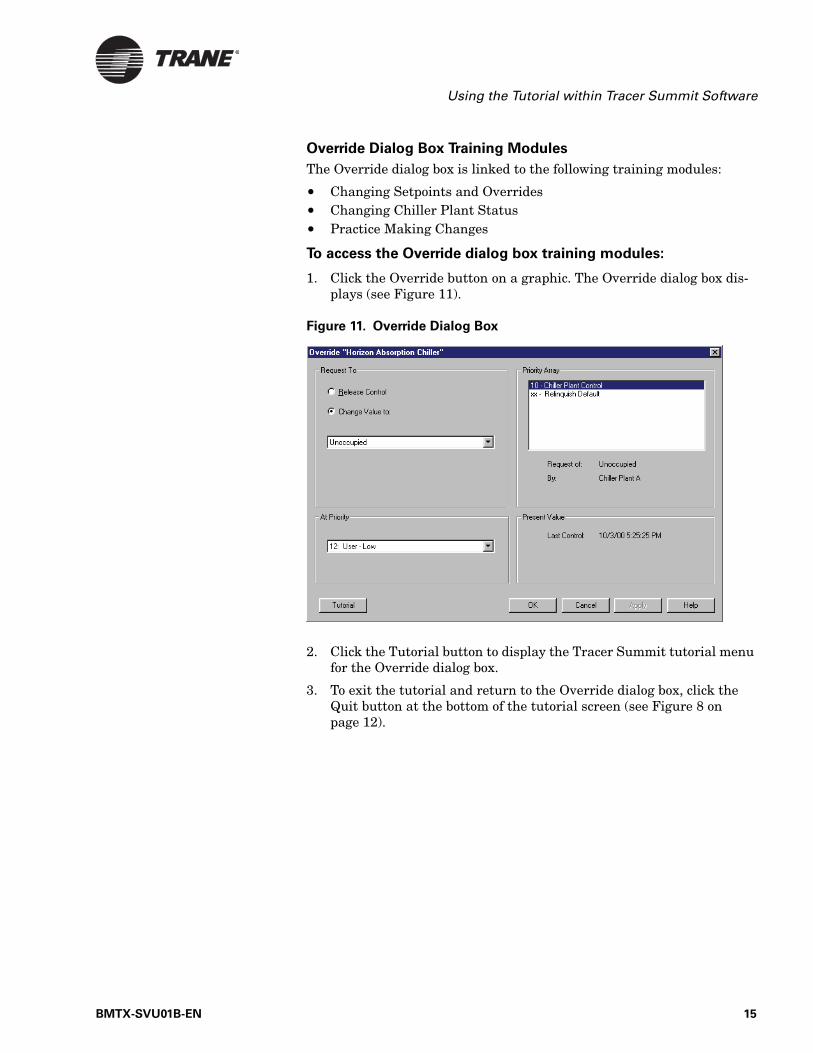
Override Dialog Box Training Modules
The Override dialog box is linked to the following training modules:
• Changing Setpoints and Overrides• Changing Chiller Plant Status• Practice Making Changes
To access the Override dialog box training modules:
1. Click the Override button on a graphic. The Override dialog box dis-plays (see Figure 11).
Figure 11. Override Dialog Box
2. Click the Tutorial button to display the Tracer Summit tutorial menu for the Override dialog box.
3. To exit the tutorial and return to the Override dialog box, click the Quit button at the bottom of the tutorial screen (see Figure 8 on page 12).
BMTX-SVU01B-EN 15

Using the Daily Operations Tutorial
Event Log Training Modules
The event log is linked to the following training modules:
• Alarms and Events• Using the Event Log• Event Log Maintenance• Practice with the Event Log
To access the Event Log training modules:
1. Click the Alarm button on the task bar. The event log displays (see Figure 12).
Figure 12. Alarm and Event Log
2. Click the Tutorial button to display the Tracer Summit tutorial menu for the event log.
3. To exit the tutorial and return to the event log, click the Quit button at the bottom of the tutorial screen (see Figure 8 on page 12).
Tutorial button
16 BMTX-SVU01B-EN
Using the Tutorial within Tracer Summit Software
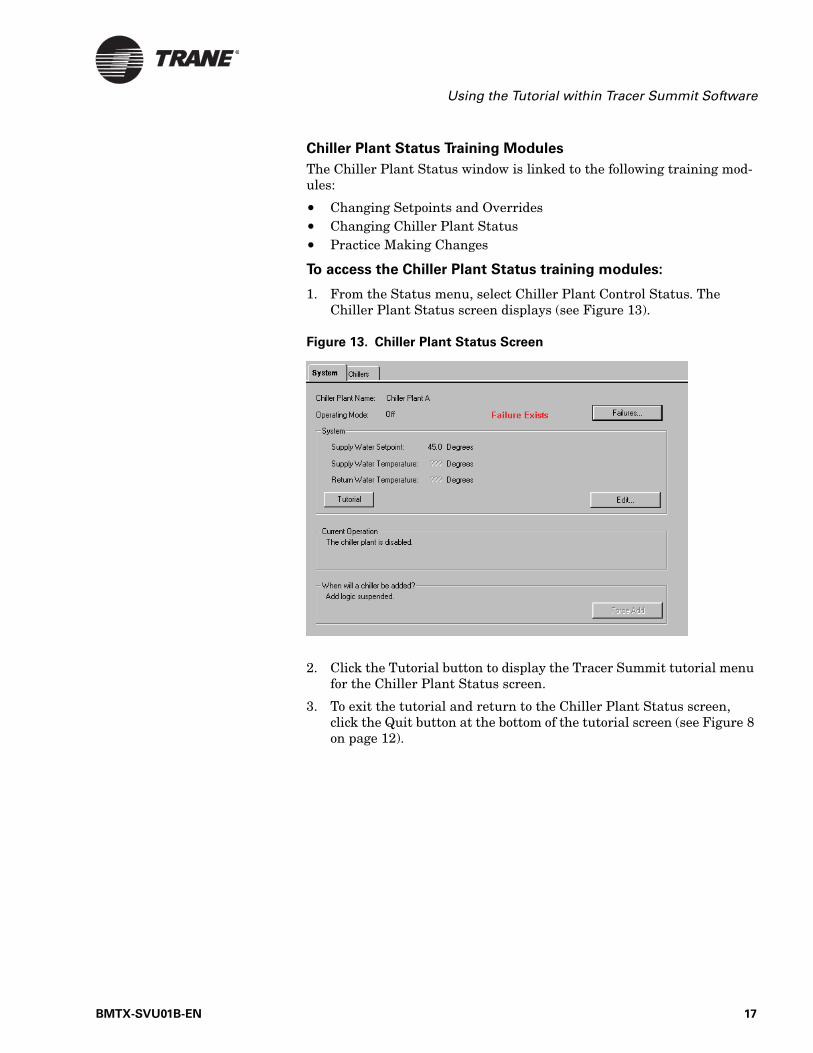
Chiller Plant Status Training Modules
The Chiller Plant Status window is linked to the following training mod-ules:
• Changing Setpoints and Overrides• Changing Chiller Plant Status• Practice Making Changes
To access the Chiller Plant Status training modules:
1. From the Status menu, select Chiller Plant Control Status. The Chiller Plant Status screen displays (see Figure 13).
Figure 13. Chiller Plant Status Screen
2. Click the Tutorial button to display the Tracer Summit tutorial menu for the Chiller Plant Status screen.
3. To exit the tutorial and return to the Chiller Plant Status screen, click the Quit button at the bottom of the tutorial screen (see Figure 8 on page 12).
BMTX-SVU01B-EN 17
Using the Daily Operations Tutorial
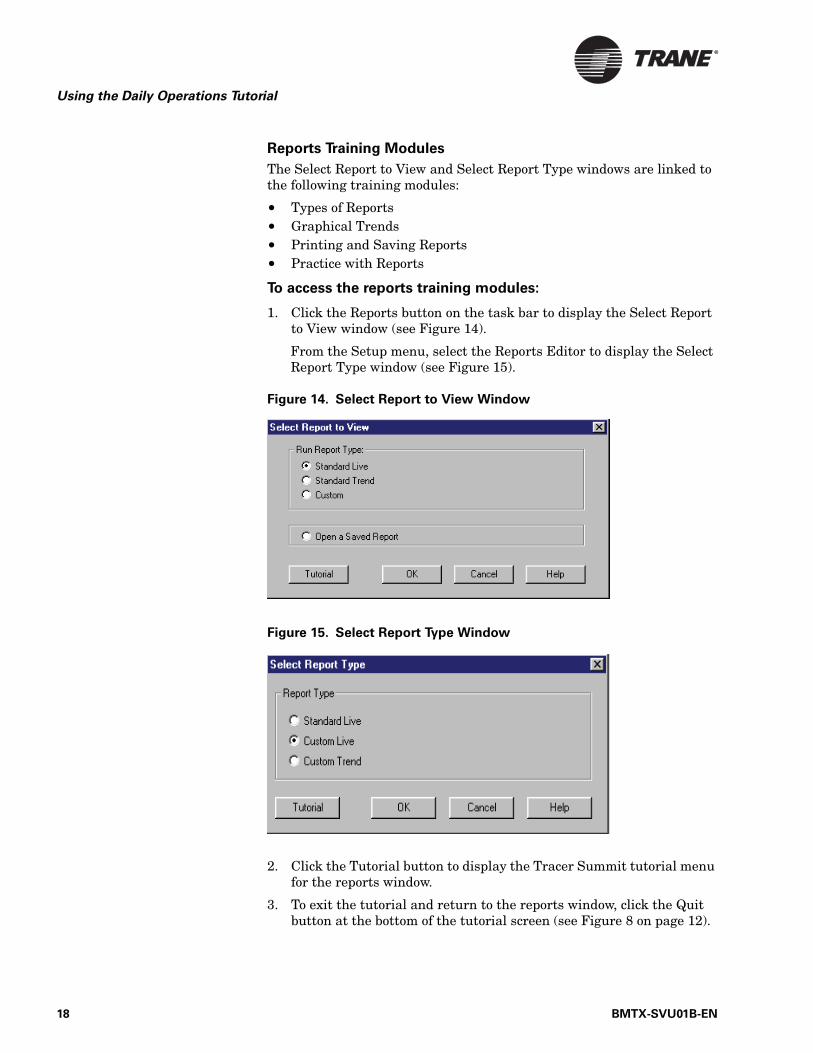
Reports Training Modules
The Select Report to View and Select Report Type windows are linked to the following training modules:
• Types of Reports• Graphical Trends• Printing and Saving Reports• Practice with Reports
To access the reports training modules:
1. Click the Reports button on the task bar to display the Select Report to View window (see Figure 14).
From the Setup menu, select the Reports Editor to display the Select Report Type window (see Figure 15).
Figure 14. Select Report to View Window
Figure 15. Select Report Type Window
2. Click the Tutorial button to display the Tracer Summit tutorial menu for the reports window.
3. To exit the tutorial and return to the reports window, click the Quit button at the bottom of the tutorial screen (see Figure 8 on page 12).
18 BMTX-SVU01B-EN

Using the Tutorial within Tracer Summit Software
Backup and Restore Training Modules
The Backup Site, Backup Graphic, and Restore Site windows are linked to the following training modules:
• Performing Backups• Practice Backups
To access the Backup training modules:
1. From the Tools menu, select Backup Site or Backup Graphic. The appropriate dialog box displays. (Figure 16 is the window for Backup Site.)
Figure 16. Backup Site Dialog Box
2. Click the Tutorial button to display the Tracer Summit tutorial menu for the Backup window.
3. To exit the tutorial and return to the Backup window, click the Quit button at the bottom of the tutorial screen (see Figure 8 on page 12).
BMTX-SVU01B-EN 19

Using the Daily Operations Tutorial
To access the Restore Site training modules:
1. From the Tools menu, select Restore Site. The Restore Site window displays. (see Figure 17).
Figure 17. Restore Site Dialog Box
2. Click the Tutorial button to display the Tracer Summit tutorial menu for the Restore Site window.
3. To exit the tutorial and return to the Restore Site window, click the Quit button at the bottom of the tutorial screen (see Figure 8 on page 12).
20 BMTX-SVU01B-EN

Using the Tutorial as a Stand-alone Training Course
Using the Tutorial as a Stand-alone
Training CourseAs a stand-alone training course, the Daily Operations Tutorial offers you an opportunity to gain basic skills in operating a Tracer Summit system. The training course parallels the information in the Tracer Summit Daily Operations guide and focuses on the basic daily tasks you will need to perform. Since the stand-alone training course is run entirely from the Daily Operations Tutorial CD-ROM, it is not necessary to have Tracer Summit installed.
Accessing the Stand-alone Tutorial
After you have installed the tutorial on your PC, a Tracer Summit Tuto-rial icon is automatically placed on your Windows desktop. (Installation instructions are included in the tutorial CD-ROM case and in the Hard-ware and Software Installation guide.) To run the tutorial program, you must have the Daily Operations Tutorial CD-ROM in the CD-ROM drive of your PC.
To access the tutorial:
1. Double-click the Tracer Summit Tutorial icon. The tutorial opens and the logon dialog box is displayed.
2. In the User ID field, type a user ID. (The User ID can be anything you want.)
3. In the Password field, type a password. (The password can be any-thing you want.)
4. In the Verify field, type the password again and press the Enter key. The Daily Operations Tutorial Main Menu displays (see Figure 18 on page 22).
For the tutorial to keep track of which modules have been completed, you must log on to the tutorial with the same user name and password each time you run the tutorial.
Note:
If you are entering a new user name and password for the first time, a message box is displayed asking you to confirm that this is your first visit to the course. If this is not your first visit, recheck your user name and password.
Note:
Each user should set up his or her own user name and pass-word for running the tutorial.
BMTX-SVU01B-EN 21
Using the Daily Operations Tutorial
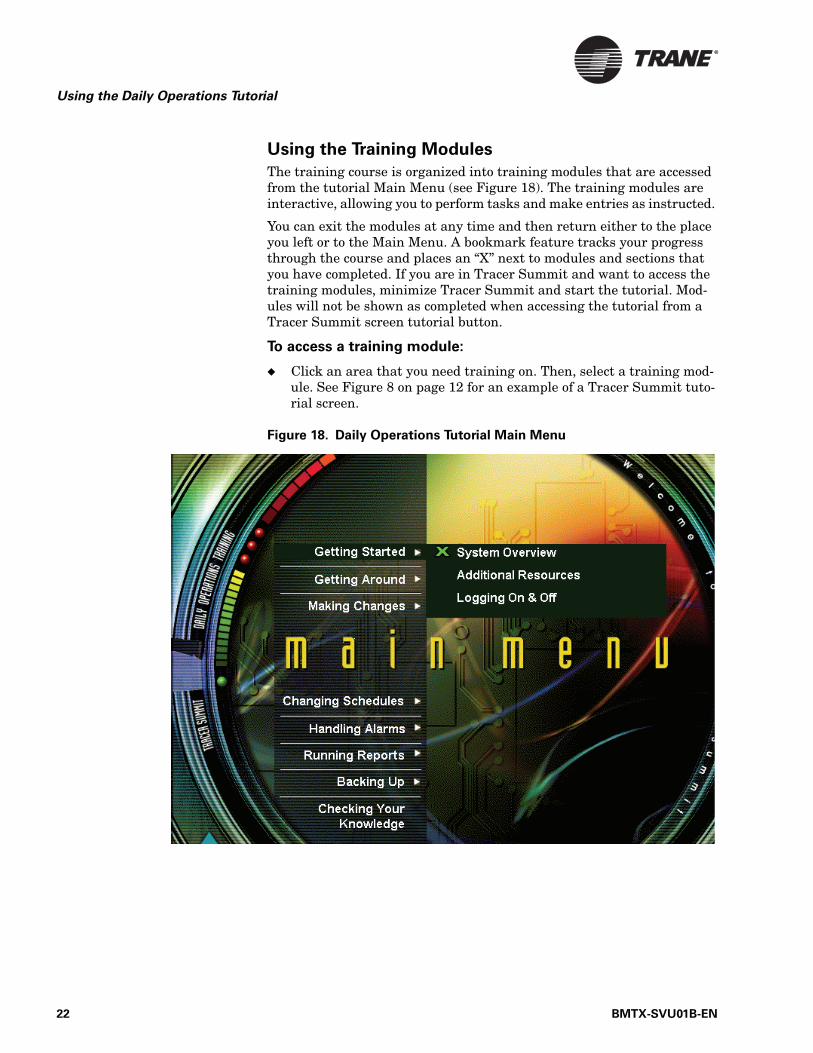
Using the Training Modules
The training course is organized into training modules that are accessed from the tutorial Main Menu (see Figure 18). The training modules are interactive, allowing you to perform tasks and make entries as instructed.
You can exit the modules at any time and then return either to the place you left or to the Main Menu. A bookmark feature tracks your progress through the course and places an “X” next to modules and sections that you have completed. If you are in Tracer Summit and want to access the training modules, minimize Tracer Summit and start the tutorial. Mod-ules will not be shown as completed when accessing the tutorial from a Tracer Summit screen tutorial button.
To access a training module:
◆ Click an area that you need training on. Then, select a training mod-ule. See Figure 8 on page 12 for an example of a Tracer Summit tuto-rial screen.
Figure 18. Daily Operations Tutorial Main Menu
22 BMTX-SVU01B-EN
Using the Tutorial as a Stand-alone Training Course
Checking Your Knowledge
When you have completed the training modules or have mastered the basic skills, you can take a final unguided test.
To check your knowledge:
1. Click Checking Your Knowledge.
2. Take the test. You must complete the entire test and pass it before you can print a certificate of completion.
• If you passed, congratulations! Follow the instructions for print-ing out a certificate of completion.
• If you did not pass, you should return to the course and review the modules.
If you leave the test prior to completion, your answers are not saved. Also, you will need to begin the test again at the first question.
Obtaining Continuing Education Credit
Successful completion of the tutorial entitles you to 0.4 continuing educa-tion credits (CEUs).
To receive your CEUs:
◆ Send the certificate of completion along with your name and address to your local Trane office.
The local office will forward your information to the ICS Institute. The ICS Institute will mail back to you an official ICS Institute certificate, showing the CEUs that have been awarded.
BMTX-SVU01B-EN 23

Using the Daily Operations Tutorial
24 BMTX-SVU01B-EN

Chapter 3
Opening and Closing Tracer
Summit
Opening Tracer Summit1. Using the mouse, move the pointer on the screen to the Tracer Sum-
mit icon (see Figure 19).
Figure 19. Tracer Summit Icon
2. Click the left mouse button twice. The Tracer Summit Log On window displays (see Figure 20).
Figure 20. Tracer Summit Log On Window
For information on logging on to Tracer Summit, refer to the section “Logging On to Tracer Summit” on page 29.
Note:
You may not have access to all of the tasks presented in this guide. Your access privileges depend on your user profile. Con-tact your supervisor for information.
BMTX-SVU01B-EN 25
Opening and Closing Tracer Summit
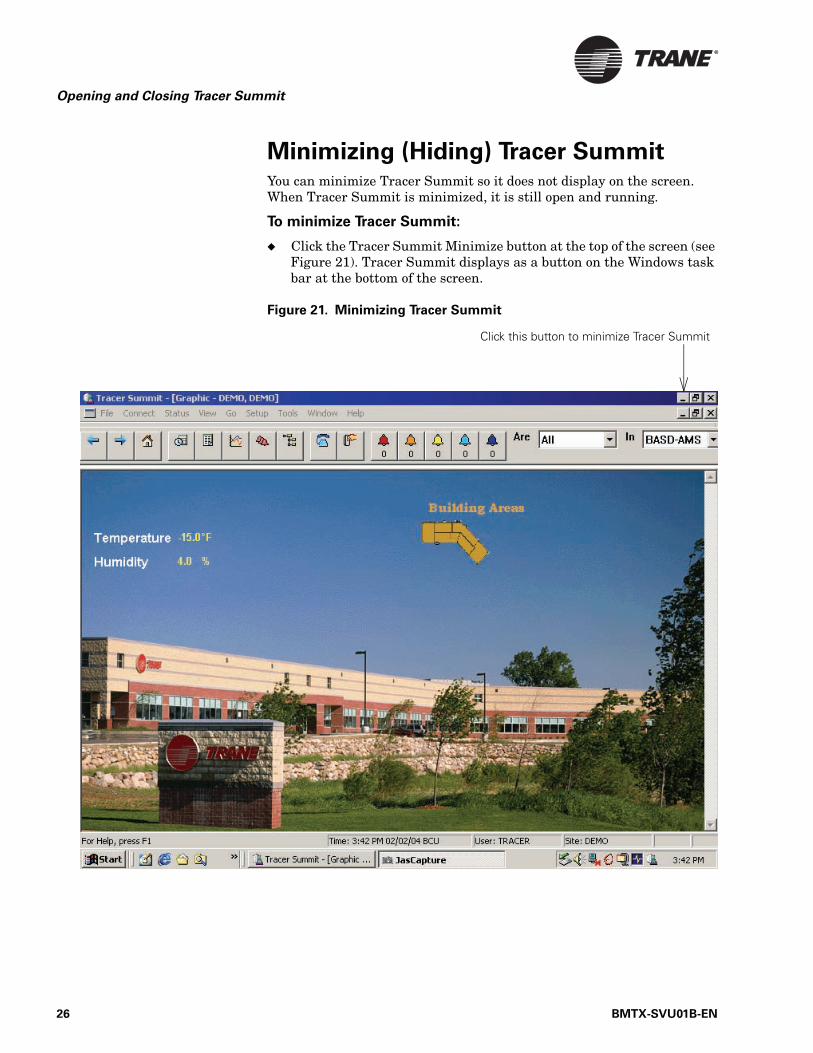
Minimizing (Hiding) Tracer SummitYou can minimize Tracer Summit so it does not display on the screen. When Tracer Summit is minimized, it is still open and running.
To minimize Tracer Summit:
◆ Click the Tracer Summit Minimize button at the top of the screen (see Figure 21). Tracer Summit displays as a button on the Windows task bar at the bottom of the screen.
Figure 21. Minimizing Tracer Summit
Click this button to minimize Tracer Summit
26 BMTX-SVU01B-EN
Minimizing (Hiding) Tracer Summit
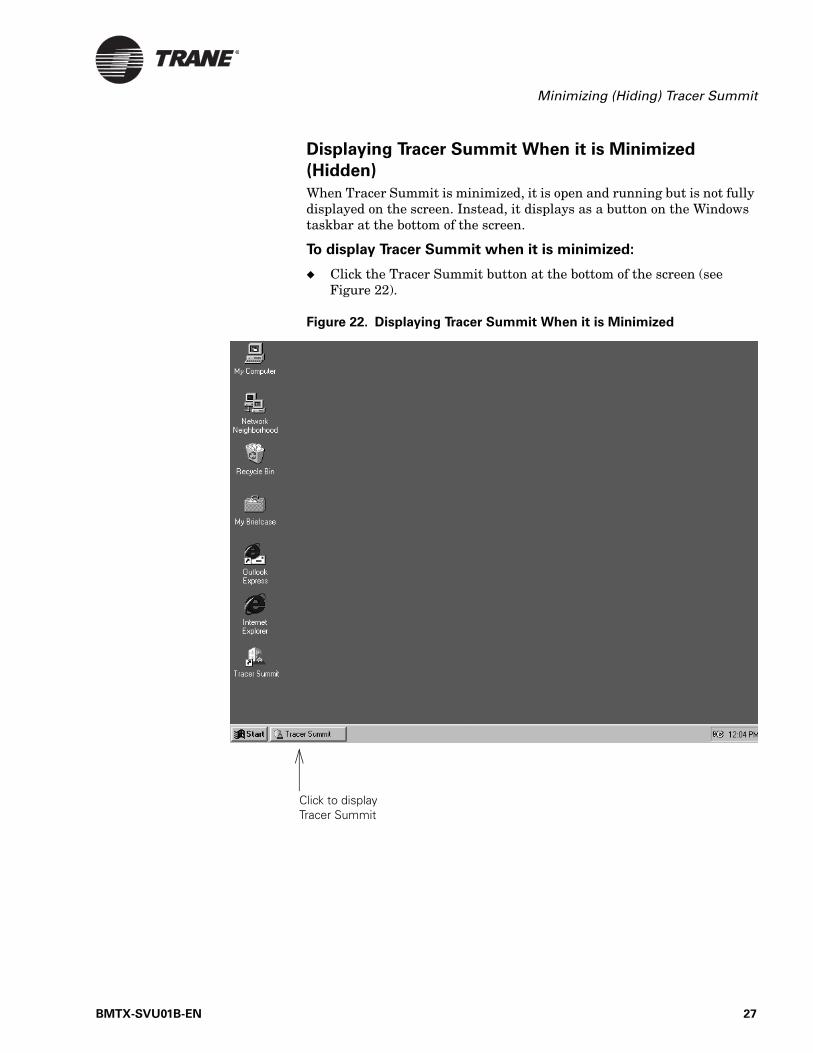
Displaying Tracer Summit When it is Minimized
(Hidden)
When Tracer Summit is minimized, it is open and running but is not fully displayed on the screen. Instead, it displays as a button on the Windows taskbar at the bottom of the screen.
To display Tracer Summit when it is minimized:
◆ Click the Tracer Summit button at the bottom of the screen (see Figure 22).
Figure 22. Displaying Tracer Summit When it is Minimized
Click to display Tracer Summit
BMTX-SVU01B-EN 27
Opening and Closing Tracer Summit
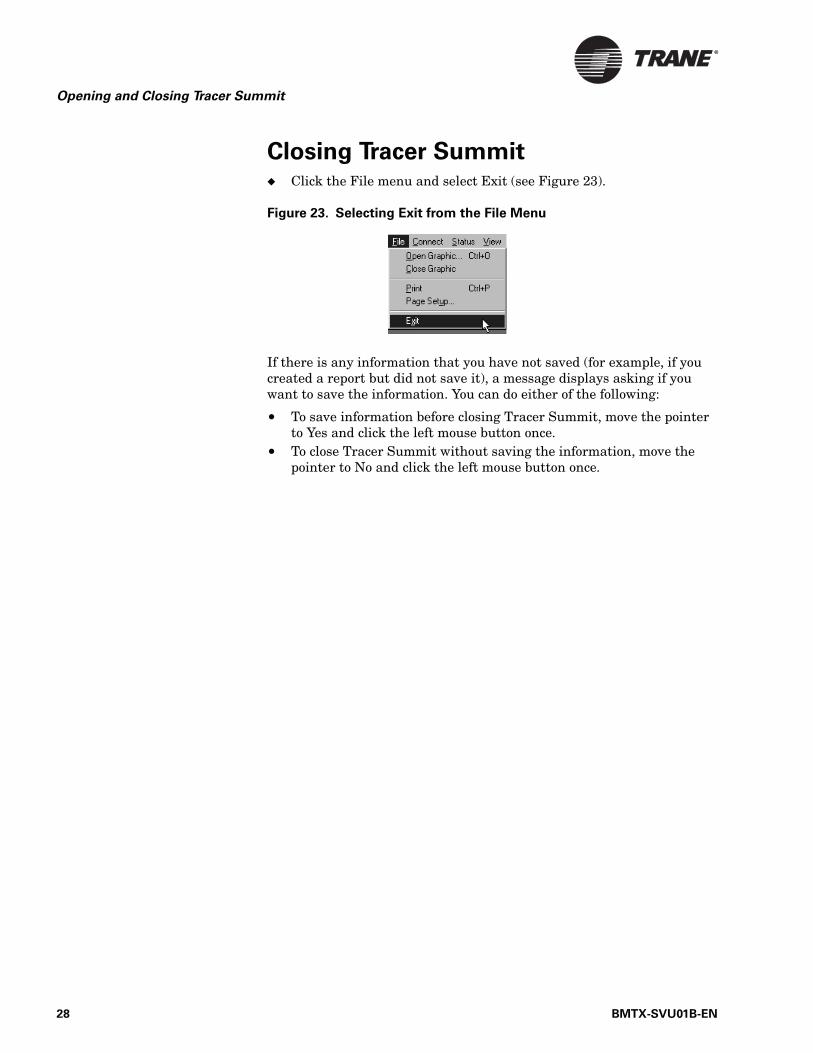
Closing Tracer Summit◆ Click the File menu and select Exit (see Figure 23).
Figure 23. Selecting Exit from the File Menu
If there is any information that you have not saved (for example, if you created a report but did not save it), a message displays asking if you want to save the information. You can do either of the following:
• To save information before closing Tracer Summit, move the pointer to Yes and click the left mouse button once.
• To close Tracer Summit without saving the information, move the pointer to No and click the left mouse button once.
28 BMTX-SVU01B-EN
Chapter 4
Logging On to and Off of
Tracer Summit
You must have a valid user name and password to log on to Tracer Sum-mit. Contact your system supervisor if you have not been assigned a user name and password.
IMPORTANTTo prevent unauthorized personnel from using Tracer Summit, you
should log off after completing your task(s).
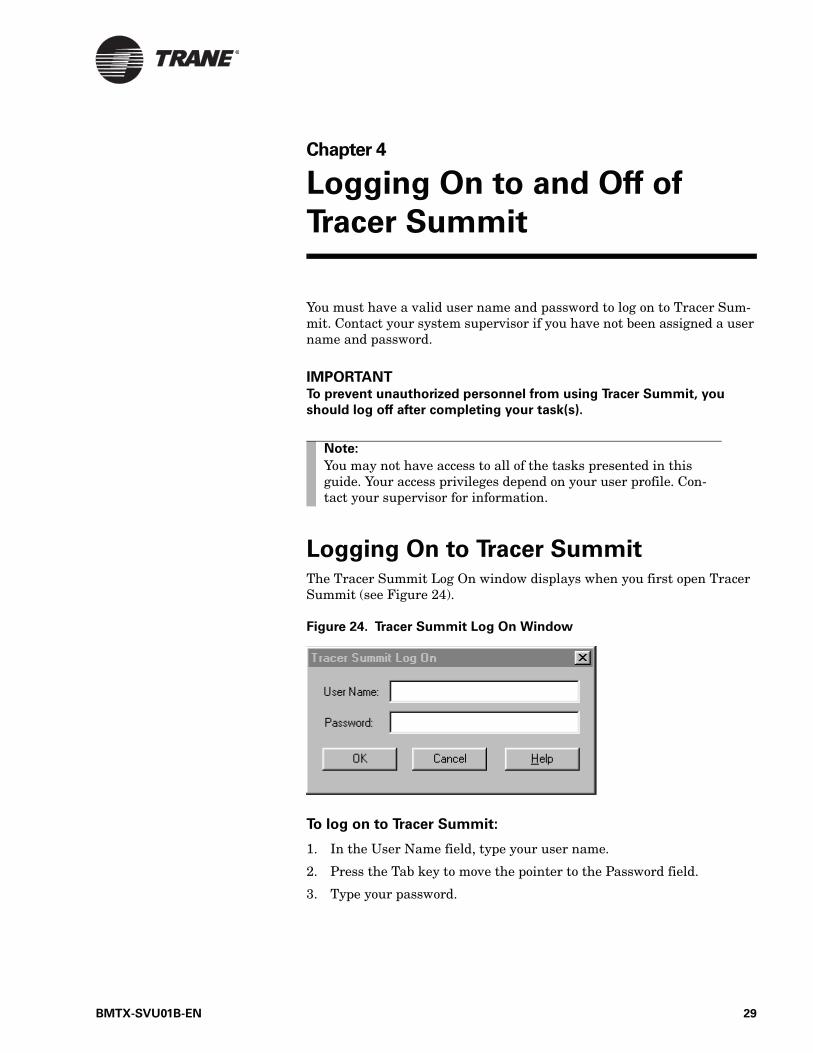
Logging On to Tracer SummitThe Tracer Summit Log On window displays when you first open Tracer Summit (see Figure 24).
Figure 24. Tracer Summit Log On Window
To log on to Tracer Summit:
1. In the User Name field, type your user name.
2. Press the Tab key to move the pointer to the Password field.
3. Type your password.
Note:
You may not have access to all of the tasks presented in this guide. Your access privileges depend on your user profile. Con-tact your supervisor for information.
BMTX-SVU01B-EN 29
Logging On to and Off of Tracer Summit
4. Press the Enter key to display the Tracer Summit main window.
If Tracer Summit is already running, you need to display the Tracer Sum-mit Log On window and log on as a new user.
To log on to Tracer Summit as a new user:
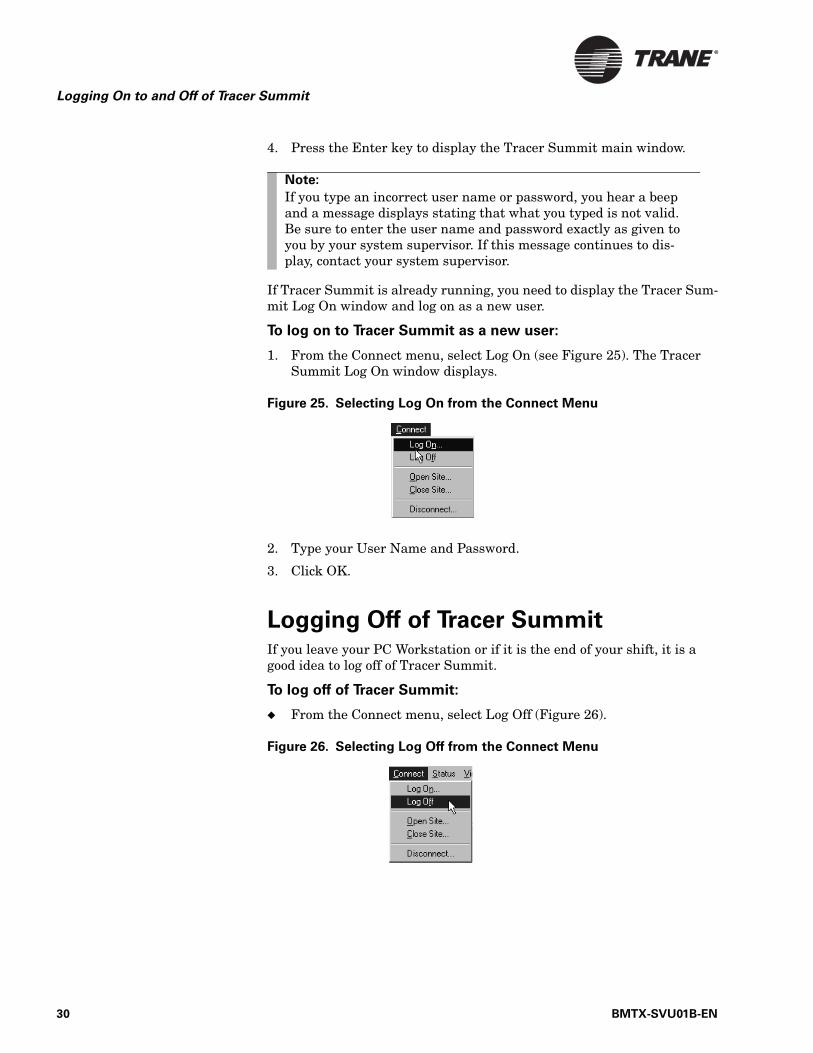
1. From the Connect menu, select Log On (see Figure 25). The Tracer Summit Log On window displays.
Figure 25. Selecting Log On from the Connect Menu
2. Type your User Name and Password.
3. Click OK.
Logging Off of Tracer SummitIf you leave your PC Workstation or if it is the end of your shift, it is a good idea to log off of Tracer Summit.
To log off of Tracer Summit:
◆ From the Connect menu, select Log Off (Figure 26).
Figure 26. Selecting Log Off from the Connect Menu
Note:
If you type an incorrect user name or password, you hear a beep and a message displays stating that what you typed is not valid. Be sure to enter the user name and password exactly as given to you by your system supervisor. If this message continues to dis-play, contact your system supervisor.
30 BMTX-SVU01B-EN

Logging Off of Tracer Summit
If there is any information that you have not saved (for example, if you created a report but did not save it), a message displays asking if you want to save the information. You can do either of the following:
• To save information before logging off of Tracer Summit, click Yes.• To log off of Tracer Summit without saving the information, click No.
BMTX-SVU01B-EN 31

Logging On to and Off of Tracer Summit
32 BMTX-SVU01B-EN
Chapter 5
Finding Your Way Around
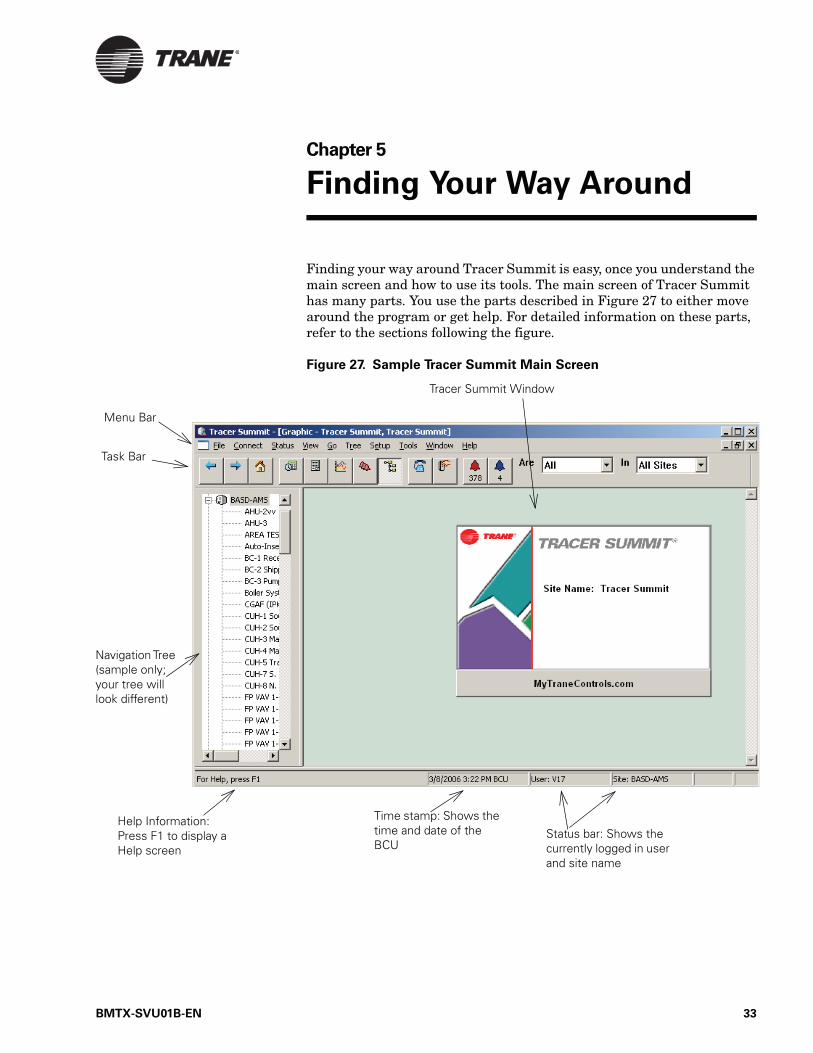
Finding your way around Tracer Summit is easy, once you understand the main screen and how to use its tools. The main screen of Tracer Summit has many parts. You use the parts described in Figure 27 to either move around the program or get help. For detailed information on these parts, refer to the sections following the figure.
Figure 27. Sample Tracer Summit Main Screen
Menu Bar
Task Bar
Navigation Tree (sample only; your tree will look different)
Tracer Summit Window
Help Information: Press F1 to display a Help screen
Time stamp: Shows the time and date of the BCU
Status bar: Shows the currently logged in user and site name
BMTX-SVU01B-EN 33
Finding Your Way Around
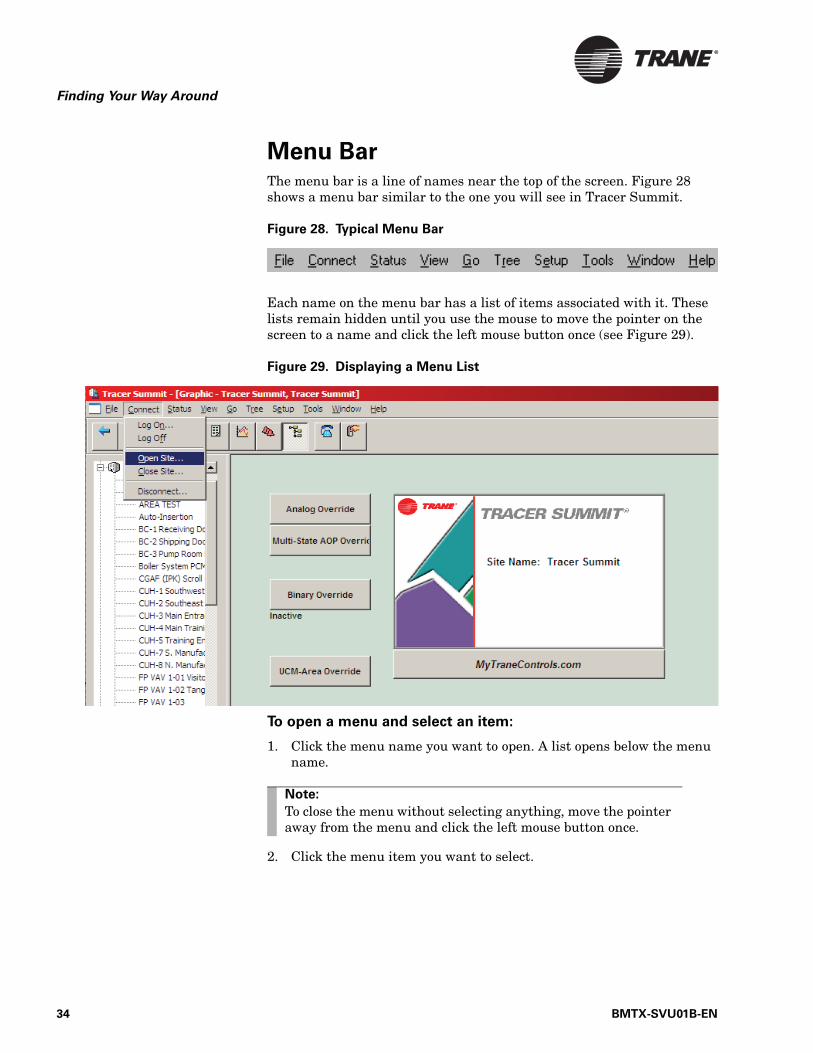
Menu BarThe menu bar is a line of names near the top of the screen. Figure 28 shows a menu bar similar to the one you will see in Tracer Summit.
Figure 28. Typical Menu Bar
Each name on the menu bar has a list of items associated with it. These lists remain hidden until you use the mouse to move the pointer on the screen to a name and click the left mouse button once (see Figure 29).
Figure 29. Displaying a Menu List
To open a menu and select an item:
1. Click the menu name you want to open. A list opens below the menu name.
2. Click the menu item you want to select.
Note:
To close the menu without selecting anything, move the pointer away from the menu and click the left mouse button once.
34 BMTX-SVU01B-EN

Task Bar
Task BarThe task bar is made up of buttons with icons (pictures) on them, as shown in Figure 30. Each button has a specific purpose.
You can see the full name of a button by using the mouse to move the pointer onto the button, then waiting 1–2 seconds (do not click the mouse button). A small window containing a description displays next to the but-ton.
Figure 30. Task Bar
To use the task bar:
1. Move the pointer on the screen to the button representing the task you want.
2. Click the left mouse button once. Tracer Summit performs the task. For example, if you click the Schedule button, the scheduling screen displays.
For more information about the task bar, see Table 2.Navigation Tree
Use this button to connect and disconnect from a site.
This button appears when timed override is enabled and you have security access.
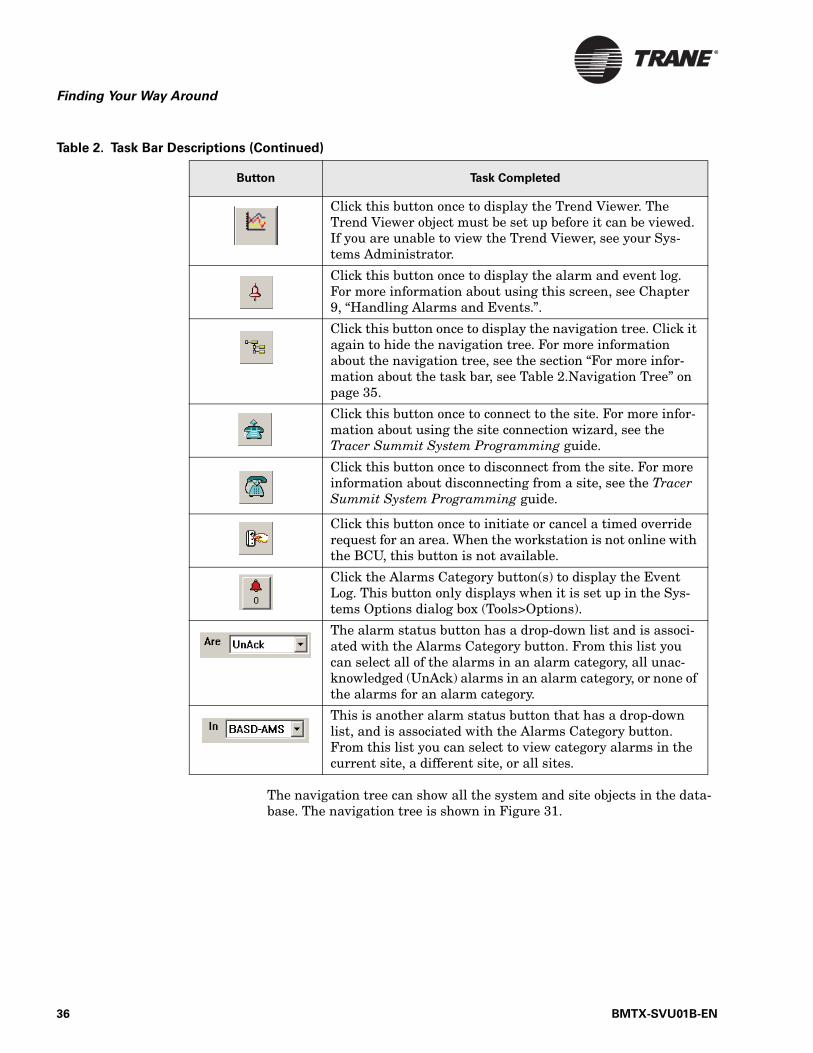
Table 2. Task Bar Descriptions
Button Task Completed
Click this button once to display the previously displayed graphic (picture) in the Tracer Summit window.
Click this button once to return to a graphic (picture) after selecting the Back button.
Click this button once to display the main graphic (home graphic) selected for your Tracer Summit system.
Click this button once to display the scheduling screen. For more information about using this screen, see Chapter 8, “Changing Schedules.”.
Click this button once to display reports. For more informa-tion about using this screen, see Chapter 10, “Running Reports.”.
BMTX-SVU01B-EN 35
Finding Your Way Around
The navigation tree can show all the system and site objects in the data-base. The navigation tree is shown in Figure 31.
Click this button once to display the Trend Viewer. The Trend Viewer object must be set up before it can be viewed. If you are unable to view the Trend Viewer, see your Sys-tems Administrator.
Click this button once to display the alarm and event log. For more information about using this screen, see Chapter 9, “Handling Alarms and Events.”.
Click this button once to display the navigation tree. Click it again to hide the navigation tree. For more information about the navigation tree, see the section “For more infor-mation about the task bar, see Table 2.Navigation Tree” on page 35.
Click this button once to connect to the site. For more infor-mation about using the site connection wizard, see the Tracer Summit System Programming guide.
Click this button once to disconnect from the site. For more information about disconnecting from a site, see the Tracer Summit System Programming guide.
Click this button once to initiate or cancel a timed override request for an area. When the workstation is not online with the BCU, this button is not available.
Click the Alarms Category button(s) to display the Event Log. This button only displays when it is set up in the Sys-tems Options dialog box (Tools>Options).
The alarm status button has a drop-down list and is associ-ated with the Alarms Category button. From this list you can select all of the alarms in an alarm category, all unac-knowledged (UnAck) alarms in an alarm category, or none of the alarms for an alarm category.
This is another alarm status button that has a drop-down list, and is associated with the Alarms Category button. From this list you can select to view category alarms in the current site, a different site, or all sites.
Table 2. Task Bar Descriptions (Continued)
Button Task Completed
36 BMTX-SVU01B-EN
Task Bar
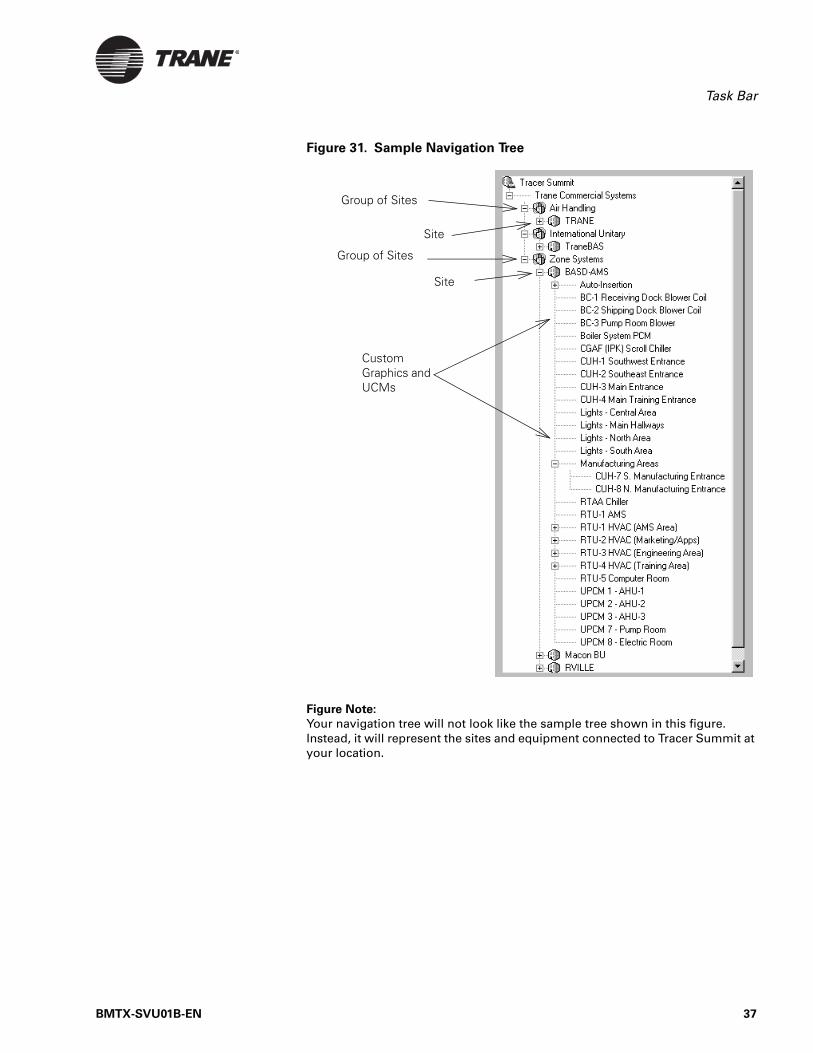
Figure 31. Sample Navigation Tree
Figure Note:
Your navigation tree will not look like the sample tree shown in this figure. Instead, it will represent the sites and equipment connected to Tracer Summit at your location.
Site
Group of Sites
Custom Graphics and UCMs
Group of Sites
Site
BMTX-SVU01B-EN 37
Finding Your Way Around
Using the Navigation Tree
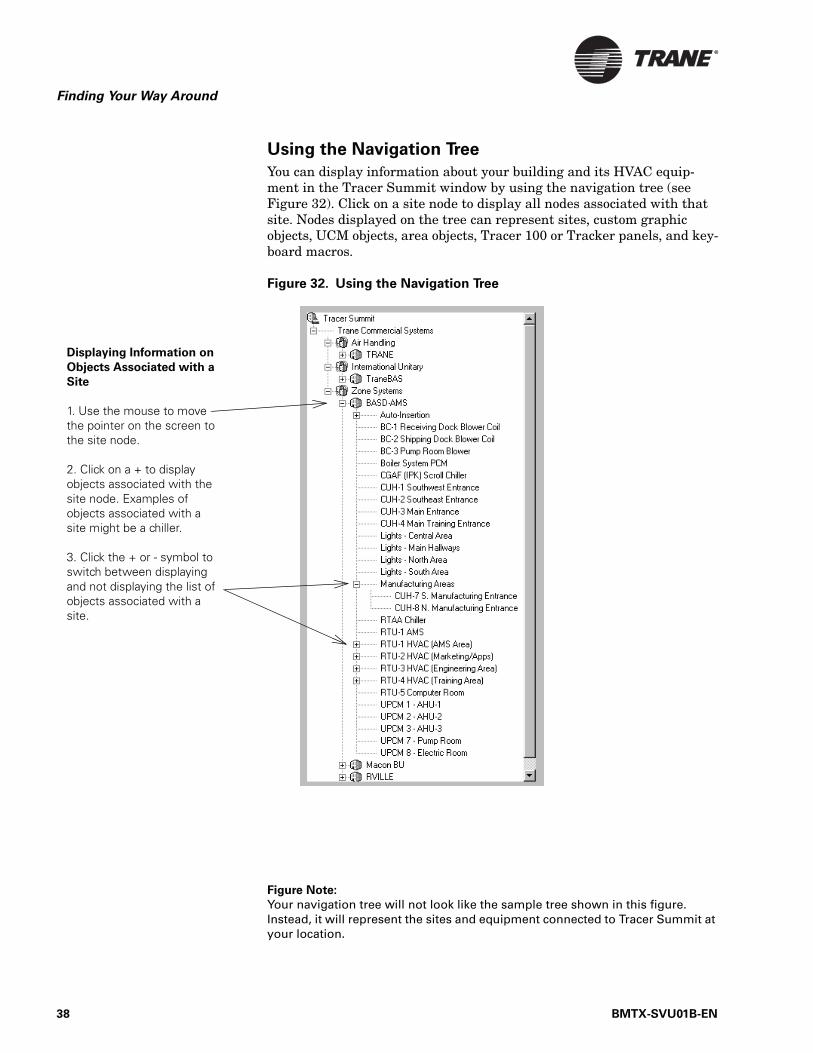
You can display information about your building and its HVAC equip-ment in the Tracer Summit window by using the navigation tree (see Figure 32). Click on a site node to display all nodes associated with that site. Nodes displayed on the tree can represent sites, custom graphic objects, UCM objects, area objects, Tracer 100 or Tracker panels, and key-board macros.
Figure 32. Using the Navigation Tree
Figure Note:
Your navigation tree will not look like the sample tree shown in this figure. Instead, it will represent the sites and equipment connected to Tracer Summit at your location.
Displaying Information on
Objects Associated with a
Site
1. Use the mouse to move the pointer on the screen to the site node.
2. Click on a + to display objects associated with the site node. Examples of objects associated with a site might be a chiller.
3. Click the + or - symbol to switch between displaying and not displaying the list of objects associated with a site.
38 BMTX-SVU01B-EN
Opening a Site
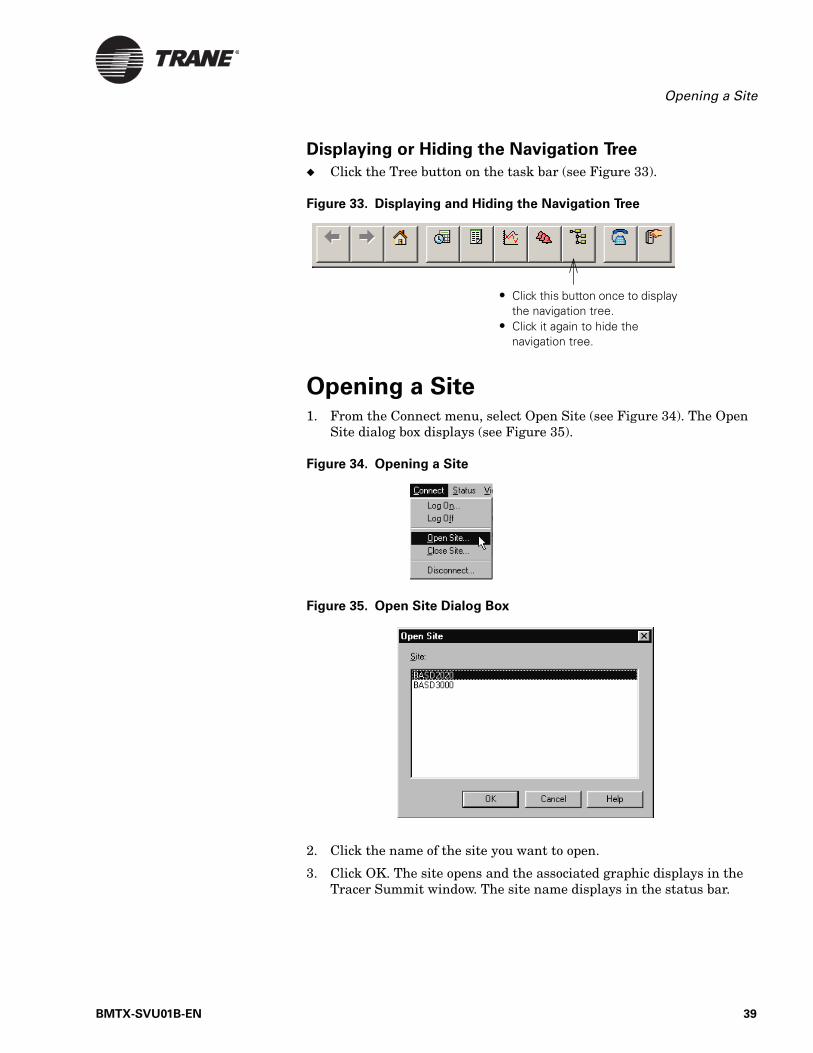
Displaying or Hiding the Navigation Tree
◆ Click the Tree button on the task bar (see Figure 33).
Figure 33. Displaying and Hiding the Navigation Tree
Opening a Site1. From the Connect menu, select Open Site (see Figure 34). The Open
Site dialog box displays (see Figure 35).
Figure 34. Opening a Site
Figure 35. Open Site Dialog Box
2. Click the name of the site you want to open.
3. Click OK. The site opens and the associated graphic displays in the Tracer Summit window. The site name displays in the status bar.
• Click this button once to display the navigation tree.
• Click it again to hide the navigation tree.
BMTX-SVU01B-EN 39

Finding Your Way Around
Opening Other SitesYou can open additional sites from Tracer Summit. Examples of other sites you may want to open include Tracker, Tracer 100 or other BCU sites. See “Opening Tracer 100/Tracker Sites” on page 40 for instructions on opening a Tracer 100 site.
◆ Open the navigation tree and double-click on a site.
Opening Tracer 100/Tracker SitesTracer Summit interacts with Tracer 100 and Tracker (model EMTK) sites primarily through terminal emulation. Terminal emulation is a user interface for Tracer 100 and Tracker panels. If you have multiple Tracer 100 panels, terminal emulation runs for only one panel at a time. Tracer Summit enables you to switch from one panel to another.
See “Using Terminal Emulation and Keyboard Macros” on page 43 for more information on terminal emulation.
To switch to another panel:
1. From the Connect menu, select Select Remote. The Select Remote dialog box displays.
2. Select the desired Tracer 100 or Tracker panel that you want to open.
3. Click OK. The workstation disconnects from the currently connected panel and connects to the newly selected panel. The Remote Unit Name field displays the name of the Tracer 100 panel.
Note:
The following happens when you open another site:
• Tracer Summit continues to display information for the first site in a window behind the newly opened site.
• The first site remains open until you close it. See the sec-tion “Closing a Site” on page 41 for details.
• The site you just opened is the active site. Any actions you take (for example, changing a schedule) are made to the site you just opened, and not to any other open sites.
Note:
Tracer Summit always displays the terminal emulation session by default each time you connect to a Tracer 100 or Tracker site.
Note:
Terminal emulation sessions that you forget to close can delay scheduled scans.
40 BMTX-SVU01B-EN
Closing a Site
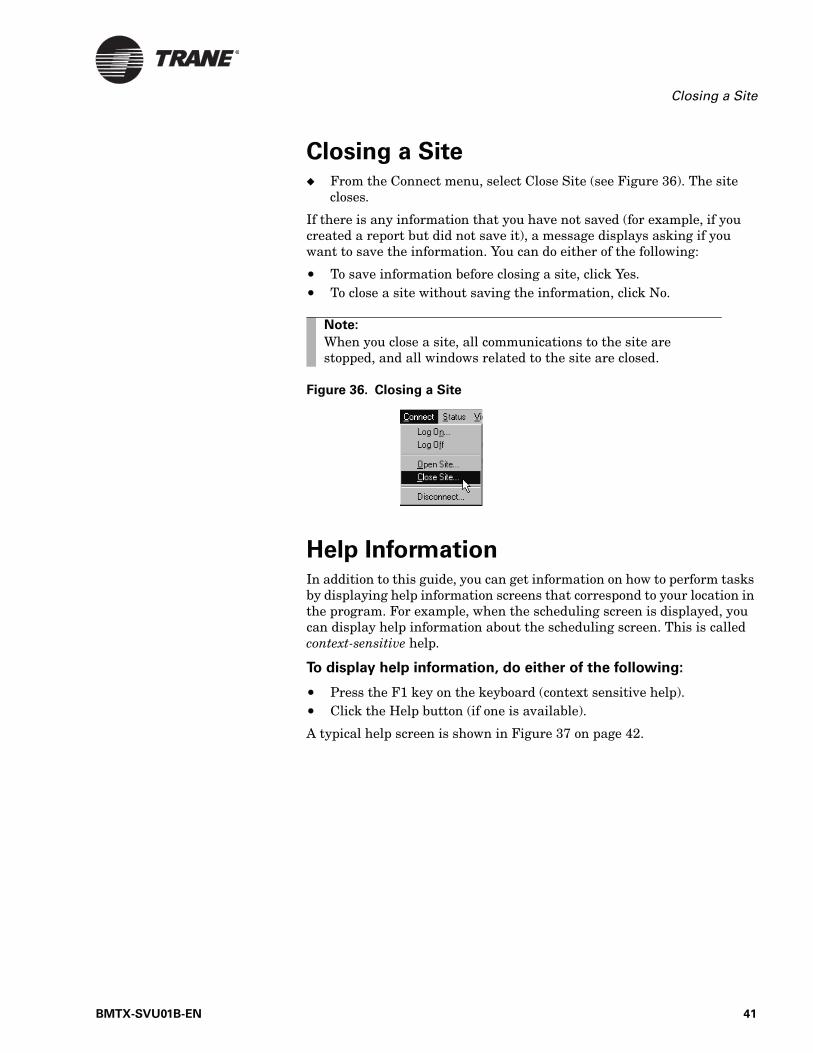
Closing a Site◆ From the Connect menu, select Close Site (see Figure 36). The site
closes.
If there is any information that you have not saved (for example, if you created a report but did not save it), a message displays asking if you want to save the information. You can do either of the following:
• To save information before closing a site, click Yes.• To close a site without saving the information, click No.
Figure 36. Closing a Site
Help InformationIn addition to this guide, you can get information on how to perform tasks by displaying help information screens that correspond to your location in the program. For example, when the scheduling screen is displayed, you can display help information about the scheduling screen. This is called context-sensitive help.
To display help information, do either of the following:
• Press the F1 key on the keyboard (context sensitive help). • Click the Help button (if one is available).
A typical help screen is shown in Figure 37 on page 42.
Note:
When you close a site, all communications to the site are stopped, and all windows related to the site are closed.
BMTX-SVU01B-EN 41

Finding Your Way Around
Figure 37. Typical Help Screen
42 BMTX-SVU01B-EN

Chapter 6
Using Terminal Emulation
and Keyboard Macros
The terminal emulation interface enables you to access a Tracer 100 or Tracker (model EMTK) site to perform daily operator functions. During a terminal emulation session, you can perform the following tasks:
• View the status of Tracer 100 and Tracker panels• Edit Tracer 100 schedules• Send keyboard macros to a Tracer 100 or Tracker panel• Capture information to a file or send it to a printer
When a Tracer 100 or Tracker panel is the active site, a terminal emula-tion window displays in the Tracer Summit main window (see Figure 38).
Figure 38. Terminal Emulation Interface Screen
BMTX-SVU01B-EN 43
Using Terminal Emulation and Keyboard Macros
Accessing Terminal EmulationUse the following procedure to start a terminal emulation session.
IMPORTANTAll letter keys must be in upper-case characters when you use them to
communicate with a Tracer 100 or Tracker.
To access a terminal emulation session:
1. Log on to the desired Tracer 100 or Tracker site.
2. From the Connect menu, click Connect Site.
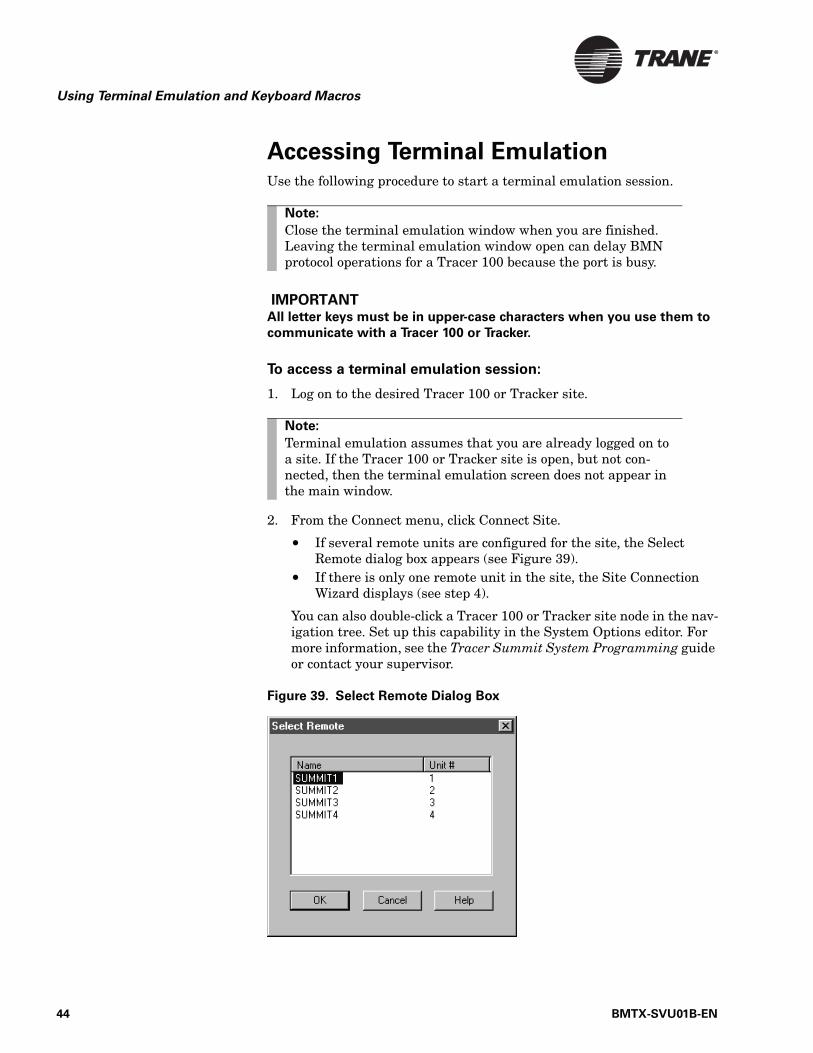
• If several remote units are configured for the site, the Select Remote dialog box appears (see Figure 39).
• If there is only one remote unit in the site, the Site Connection Wizard displays (see step 4).
You can also double-click a Tracer 100 or Tracker site node in the nav-igation tree. Set up this capability in the System Options editor. For more information, see the Tracer Summit System Programming guide or contact your supervisor.
Figure 39. Select Remote Dialog Box
Note:
Close the terminal emulation window when you are finished. Leaving the terminal emulation window open can delay BMN protocol operations for a Tracer 100 because the port is busy.
Note:
Terminal emulation assumes that you are already logged on to a site. If the Tracer 100 or Tracker site is open, but not con-nected, then the terminal emulation screen does not appear in the main window.
44 BMTX-SVU01B-EN
Accessing Keyboard Macros
3. If required, select the desired site from the Select Remote dialog box and click OK. The Site Connection Wizard displays.
4. Select the type of connection you are making with the panel. The Con-nection Manager dialog box displays.
• Click the Modem button if you are connecting by way of a modem. • Click the Hardwired button if you are connecting by way of a
direct connection.
5. Click OK. The workstation connects to the site and the terminal emu-lation screen displays after a brief period.
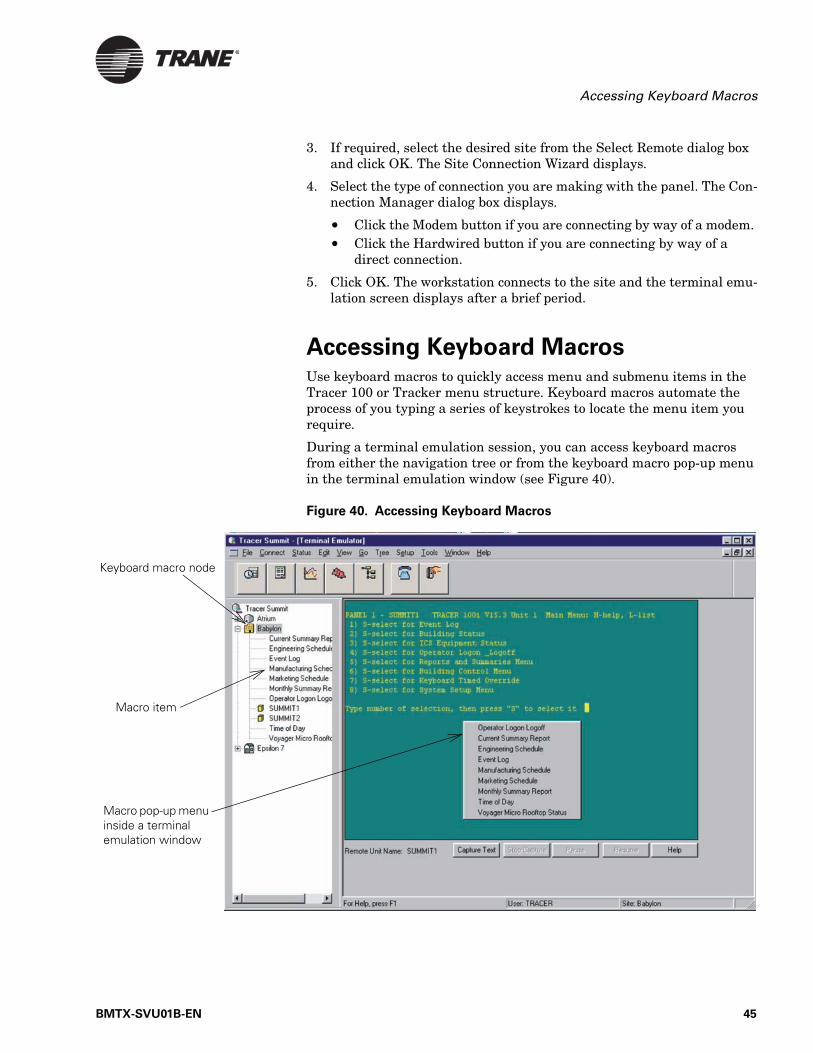
Accessing Keyboard MacrosUse keyboard macros to quickly access menu and submenu items in the Tracer 100 or Tracker menu structure. Keyboard macros automate the process of you typing a series of keystrokes to locate the menu item you require.
During a terminal emulation session, you can access keyboard macros from either the navigation tree or from the keyboard macro pop-up menu in the terminal emulation window (see Figure 40).
Figure 40. Accessing Keyboard Macros
Keyboard macro node
Macro item
Macro pop-up menu inside a terminal emulation window
BMTX-SVU01B-EN 45
Using Terminal Emulation and Keyboard Macros
To run macros from the navigation tree:
1. After connecting to a site, double-click the desired macro node in the navigation tree (see Figure 40 on page 45).
If the site has several unit-to-unit panels defined for it, and you want to run a macro in one of these other panels, double-click the site node on the tree. Select the desired panel from the Select Remote dialog box. Then double-click the macro again.
2. Click the desired macro item. The terminal emulation session runs the keystroke macro that is assigned to the node.
To run macros from the terminal emulation window:
1. Right-click the mouse anywhere inside the terminal emulation win-dow. The macro pop-up menu displays (see Figure 40 on page 45).
2. From the pop-up menu, select the desired macro. The Tracer Summit software runs the macro.
Switching to Another Panel in the Site Use the following procedure to switch to a different Tracer 100 panel while you are already connected to a Tracer 100 panel. You can only switch panels in a unit-to-unit site.
To switch to another panel:
1. From the Connect menu, select Select Remote. The Select Remote dialog box appears.
2. Select the desired Tracer 100 panel to which you want to connect.
3. Click OK. The workstation disconnects from the currently connected panel and connects to the newly selected panel. The Remote Unit Name field displays the name of the connected panel.
Using Terminal Emulation Screen
OptionsDuring a terminal emulation session, you can perform the following edit-ing tasks:
• Save text to a file• Output text to a printer• Change the text and background colors• Copy text to another application
46 BMTX-SVU01B-EN
Using Terminal Emulation Screen Options
Saving Screen Text to a File
To capture the current settings of a Tracer 100 or Tracker panel or to troubleshoot a panel, you might want to save the text that appears in the terminal emulation screen to a file.
To save text to a file:
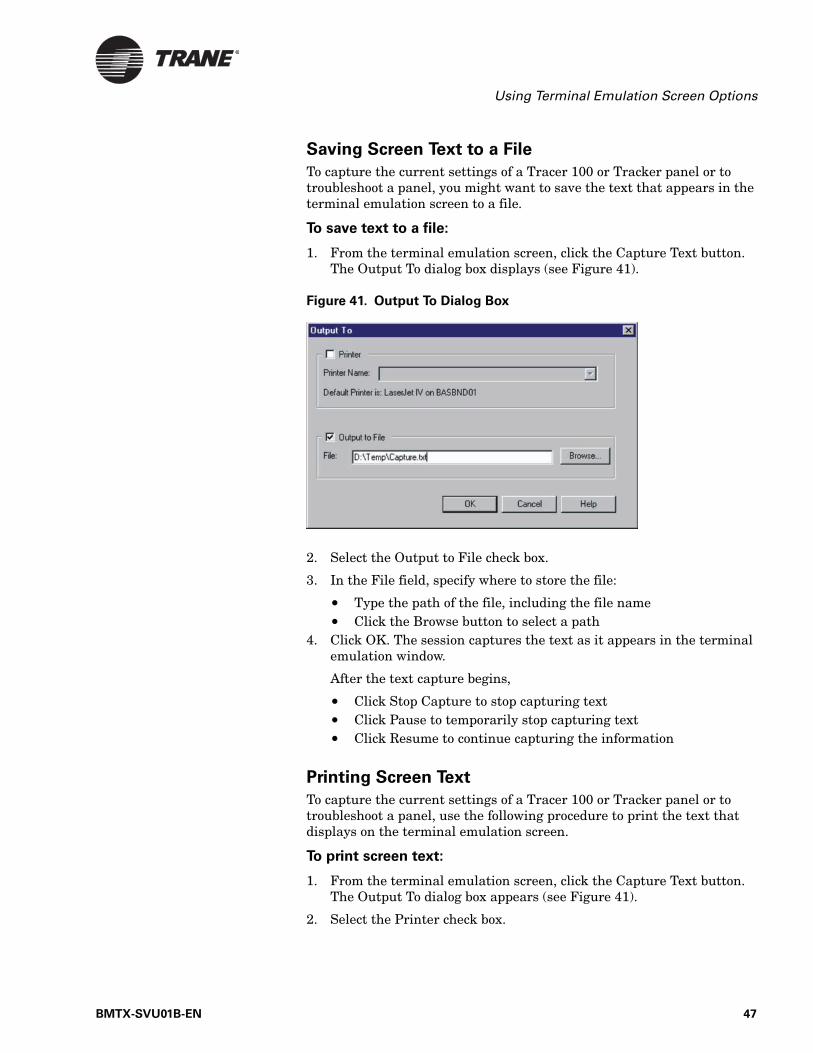
1. From the terminal emulation screen, click the Capture Text button. The Output To dialog box displays (see Figure 41).
Figure 41. Output To Dialog Box
2. Select the Output to File check box.
3. In the File field, specify where to store the file:
• Type the path of the file, including the file name• Click the Browse button to select a path
4. Click OK. The session captures the text as it appears in the terminal emulation window.
After the text capture begins,
• Click Stop Capture to stop capturing text• Click Pause to temporarily stop capturing text• Click Resume to continue capturing the information
Printing Screen Text
To capture the current settings of a Tracer 100 or Tracker panel or to troubleshoot a panel, use the following procedure to print the text that displays on the terminal emulation screen.
To print screen text:
1. From the terminal emulation screen, click the Capture Text button. The Output To dialog box appears (see Figure 41).
2. Select the Printer check box.
BMTX-SVU01B-EN 47
Using Terminal Emulation and Keyboard Macros
3. From the Printer Name list, select the printer to which you want to print.
4. Click OK. The session captures the text as it appears in the terminal emulation screen and sends it to the selected printer.
After the print capture begins,
• Click Stop Capture to stop printing text• Click Pause to temporarily stop printing text• Click Resume to continue printing the information
Copying Text
To capture the current settings of a Tracer 100 or Tracker panel or to troubleshoot a panel, you might want to copy and paste the text that appears in the terminal emulation screen to an e-mail or another applica-tion.
1. With the terminal emulation window open, from the Edit menu, select Copy. The text in the terminal emulation window is copied to the operating system clipboard.
2. Open the application to which you want to paste the text, such as an e-mail or a word processing program, and select Paste from the Edit menu of that application. The text is pasted where you indicated.
Changing the Window Color Scheme
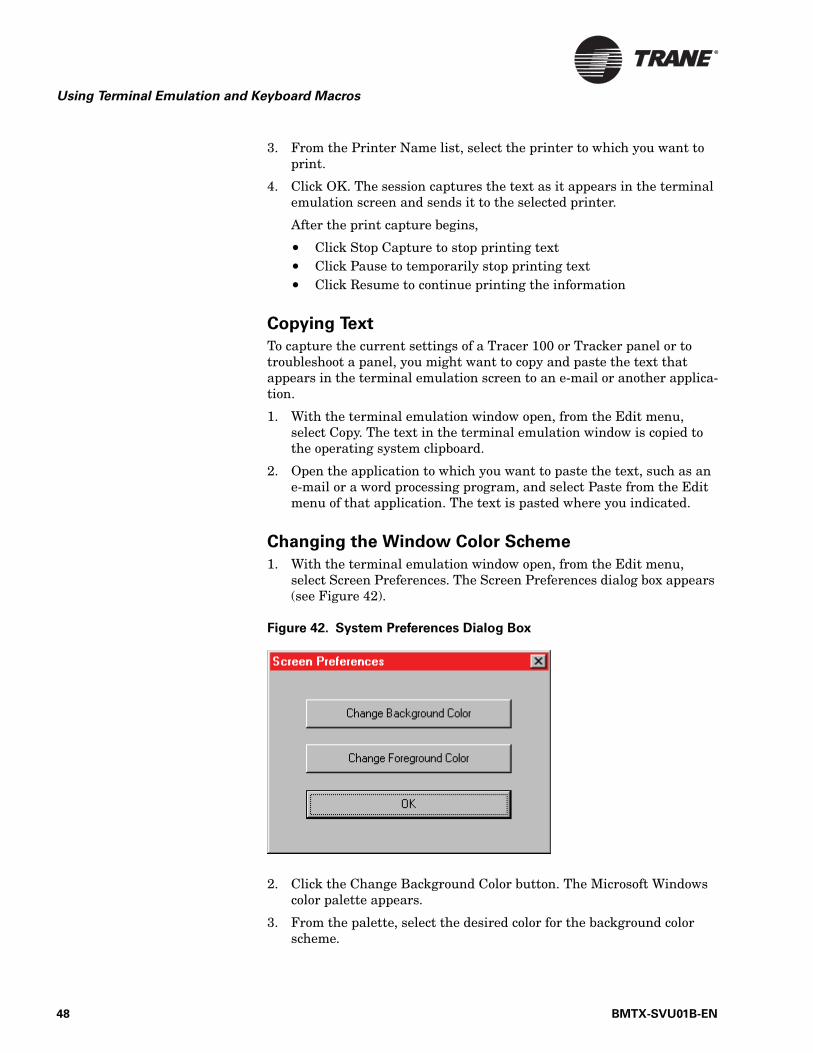
1. With the terminal emulation window open, from the Edit menu, select Screen Preferences. The Screen Preferences dialog box appears (see Figure 42).
Figure 42. System Preferences Dialog Box
2. Click the Change Background Color button. The Microsoft Windows color palette appears.
3. From the palette, select the desired color for the background color scheme.
48 BMTX-SVU01B-EN

Using Terminal Emulation Screen Options
4. Click the Change Foreground Color button. The Microsoft Windows color palette appears.
5. From the palette, select the desired color for the foreground color scheme.
6. Click OK. The changes you selected are saved and the new color scheme displays in the terminal emulation window.
BMTX-SVU01B-EN 49

Using Terminal Emulation and Keyboard Macros
50 BMTX-SVU01B-EN
Chapter 7
Displaying and Changing
Status Information
You can display and change system status information using Tracer Sum-mit graphical displays, which are available with BCU sites. These dis-plays allow you to check system status information and perform operator overrides.
Tracer 100 sites enable you to override calculated binary and calculated analog settings. See “Changing System Values (Overrides and Setpoints)” on page 55 for details.
The topics that are covered in this chapter are:
• Displaying status information on graphics• Changing system values for BCU and Tracer 100 sites• Using the pop-up menu for graphics
Displaying Status Information on
GraphicsLive data (such as temperature and humidity) are regularly displayed on graphics. Any data from the system can be displayed.
You can create custom graphic displays to provide a dynamic view of your building. You can create and view graphic displays of items such as build-ings, floor plans, and HVAC equipment. Graphic displays can be ani-mated. For example, graphics can be displayed to simulate a damper opening or closing.
Standard graphics are furnished for Trane equipment, such as chillers, variable air volume (VAV) boxes, PCMs, Universal PCMs, and thermostat control modules (TCMs). You can create customized graphics using the included HVAC graphics library or by importing graphics from other drawing packages such as Paintshop Pro, CorelDRAW or AutoCAD. You
Note:
References to graphics in this chapter do not apply to Tracer 100 sites.
Note:
You may not have access to all of the tasks presented in this guide. Your access privileges depend on your user profile. Con-tact your security supervisor for information.
BMTX-SVU01B-EN 51
Displaying and Changing Status Information
can also obtain graphics using digital cameras or scanners or by down-loading images from the Internet.
You can launch a graphic from:
• The navigation tree• A target field on another graphic• The Area Control Editor and all UCM editors• The main menu• The task bar buttons
Tracer Summit also displays a graphic when you open a site or start the system.
Viewing a Graphic From the Navigation Tree
In the navigation tree, double-click the name of the graphic you want to display.
Viewing a Graphic from a Graphic with a Target Field
When you move the mouse pointer over a target field on a graphic, the pointer changes to a pointing finger cursor. The target field can be text, an image, or a button.
To use a target field to view a graphic:
1. On a displayed graphic, move the mouse pointer to the target field (see Figure 43 on page 53).
2. Click the target field.
52 BMTX-SVU01B-EN
Displaying Status Information on Graphics
Figure 43. Graphic with a Target Field
Viewing a Graphic from an Editor
You can view an object’s graphic from any UCM editor or from the Area editor.
To view a graphic from an editor:
1. When any editor is displayed, select the Status tab.
2. Click the Graphic button. The standard graphic displays.
Viewing a Graphic Using the Main Menu
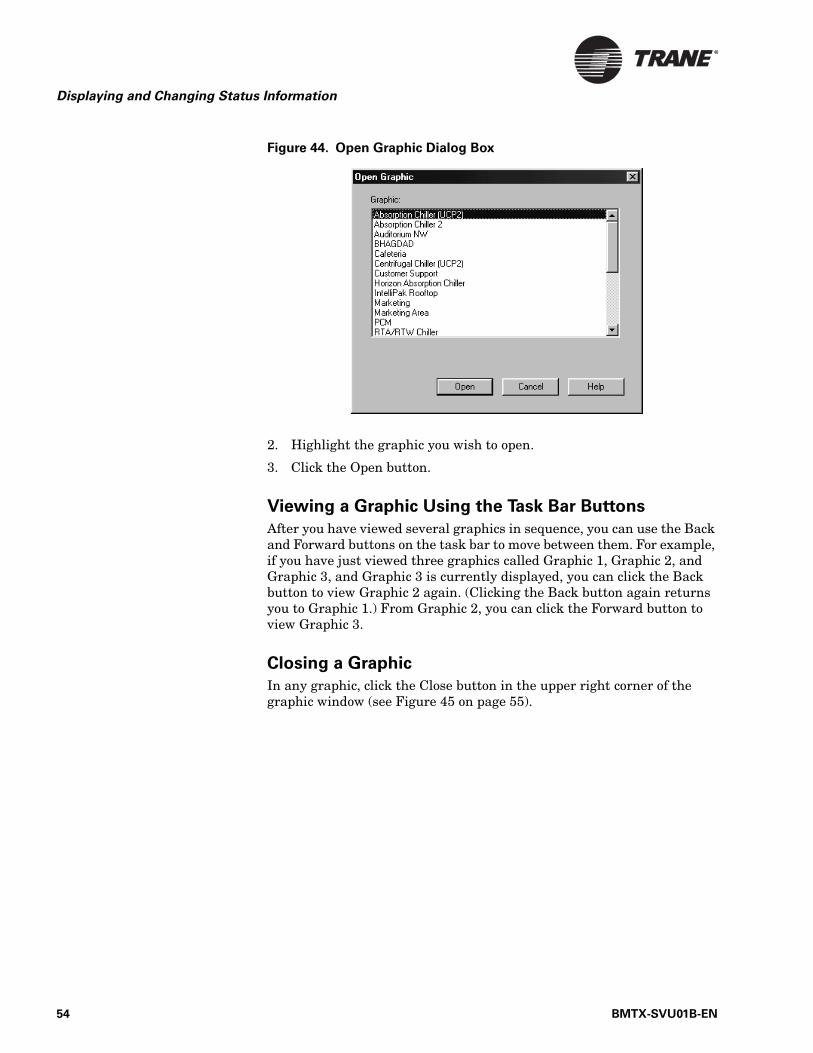
1. From the Status menu, select Graphics. The Open Graphic dialog box displays (see Figure 44 on page 54). The list displays all objects asso-ciated with the active site that have graphics linked to them.
Target field
BMTX-SVU01B-EN 53
Displaying and Changing Status Information
Figure 44. Open Graphic Dialog Box
2. Highlight the graphic you wish to open.
3. Click the Open button.
Viewing a Graphic Using the Task Bar Buttons
After you have viewed several graphics in sequence, you can use the Back and Forward buttons on the task bar to move between them. For example, if you have just viewed three graphics called Graphic 1, Graphic 2, and Graphic 3, and Graphic 3 is currently displayed, you can click the Back button to view Graphic 2 again. (Clicking the Back button again returns you to Graphic 1.) From Graphic 2, you can click the Forward button to view Graphic 3.
Closing a Graphic
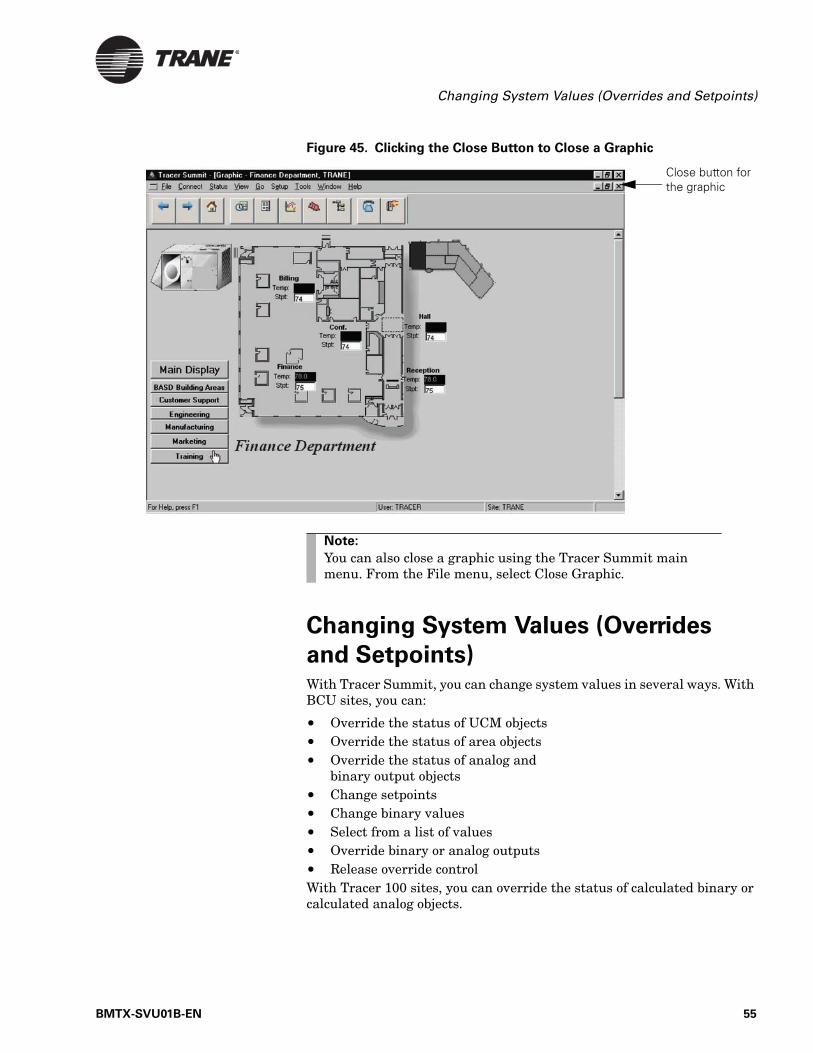
In any graphic, click the Close button in the upper right corner of the graphic window (see Figure 45 on page 55).
54 BMTX-SVU01B-EN
Changing System Values (Overrides and Setpoints)
Figure 45. Clicking the Close Button to Close a Graphic
Changing System Values (Overrides
and Setpoints)With Tracer Summit, you can change system values in several ways. With BCU sites, you can:
• Override the status of UCM objects• Override the status of area objects• Override the status of analog and
binary output objects• Change setpoints• Change binary values• Select from a list of values• Override binary or analog outputs• Release override controlWith Tracer 100 sites, you can override the status of calculated binary or calculated analog objects.
Note:
You can also close a graphic using the Tracer Summit main menu. From the File menu, select Close Graphic.
Close button for the graphic
BMTX-SVU01B-EN 55

Displaying and Changing Status Information
With a BCU site, you can change all of these items using different control types within a graphical display. Figure 46 shows an example graphic with the four main control types.
Figure 46. Control Types within a Graphic
Overriding System Values
You can override the system control of the present value property for an object by selecting the override control. When the override control is on a graphic, you can display status information by right-clicking on the Over-ride control button to open either the Simplified Override dialog box or the Advanced Override dialog box.
This gives you information on what system applications are currently controlling the object (see Figure 52 on page 61 and Figure 62 on page 73).
When a “hand” icon is displayed on an override button, it indicates that the present value of the object is in manual override (see Figure 47). To set up this feature, see “Displaying Override Status” on page 57.
Figure 47. Manual Override Icon
Override Control
Binary Check Box Control
Selection List Control
Setpoint Control
56 BMTX-SVU01B-EN
Changing System Values (Overrides and Setpoints)
The Override button for UCMs is active if the BCU is up and communi-cating with the UCM and your workstation, and if the UCM is not under local control. The Override button for an area object is active if the BCU that the area object is saved in is communicating to your workstation.
Displaying Override Status
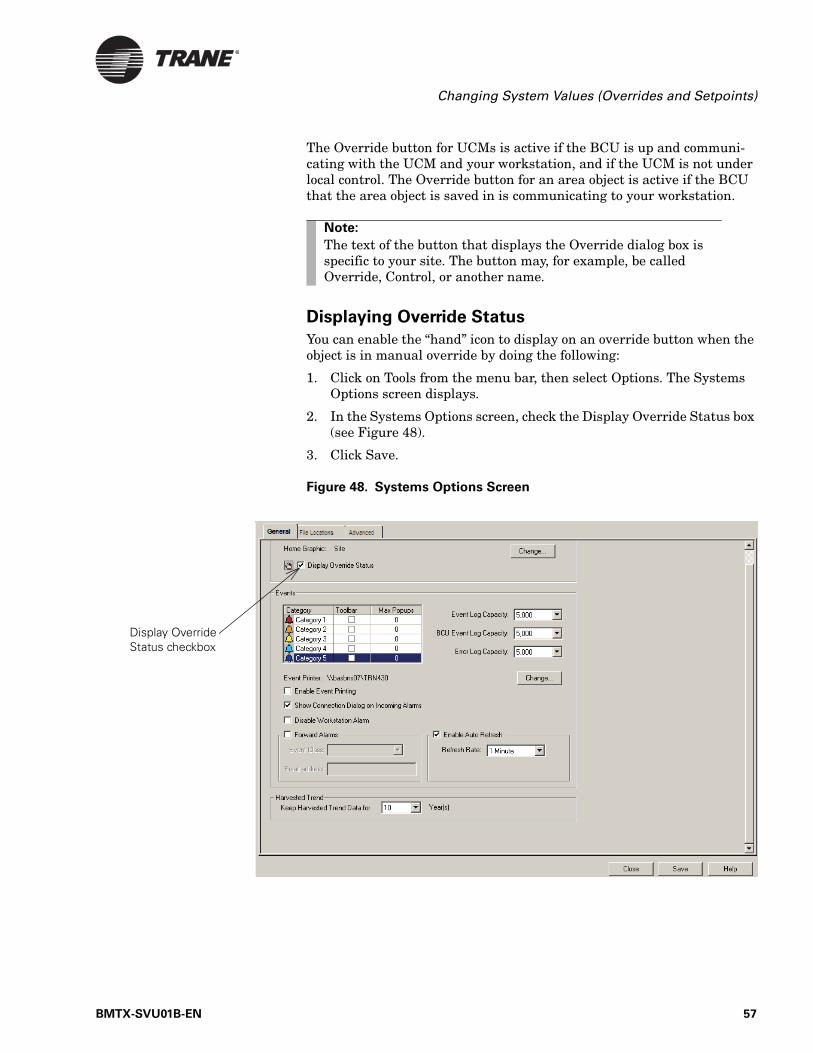
You can enable the “hand” icon to display on an override button when the object is in manual override by doing the following:
1. Click on Tools from the menu bar, then select Options. The Systems Options screen displays.
2. In the Systems Options screen, check the Display Override Status box (see Figure 48).
3. Click Save.
Figure 48. Systems Options Screen
Note:
The text of the button that displays the Override dialog box is specific to your site. The button may, for example, be called Override, Control, or another name.
Display Override Status checkbox
BMTX-SVU01B-EN 57
Displaying and Changing Status Information
Setting Up the Simplified Override
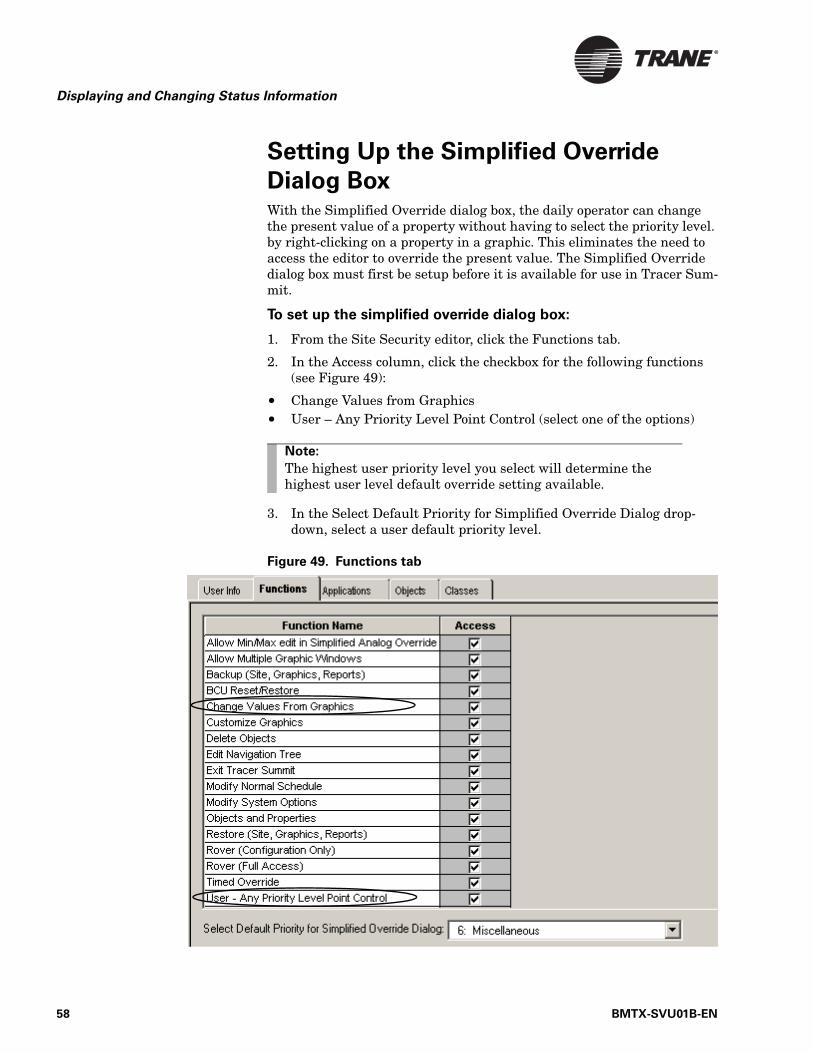
Dialog BoxWith the Simplified Override dialog box, the daily operator can change the present value of a property without having to select the priority level. by right-clicking on a property in a graphic. This eliminates the need to access the editor to override the present value. The Simplified Override dialog box must first be setup before it is available for use in Tracer Sum-mit.
To set up the simplified override dialog box:
1. From the Site Security editor, click the Functions tab.
2. In the Access column, click the checkbox for the following functions (see Figure 49):
• Change Values from Graphics• User – Any Priority Level Point Control (select one of the options)
3. In the Select Default Priority for Simplified Override Dialog drop-down, select a user default priority level.
Figure 49. Functions tab
Note:
The highest user priority level you select will determine the highest user level default override setting available.
58 BMTX-SVU01B-EN
Setting Up the Simplified Override Dialog Box
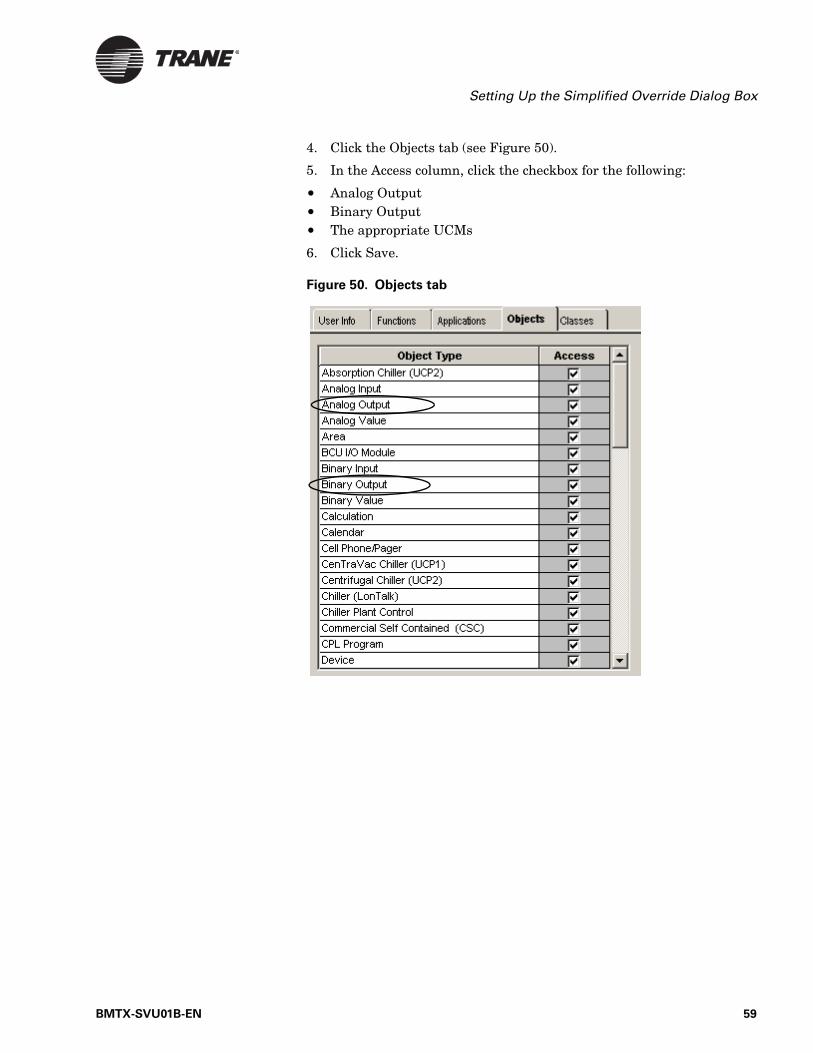
4. Click the Objects tab (see Figure 50).
5. In the Access column, click the checkbox for the following:
• Analog Output• Binary Output• The appropriate UCMs
6. Click Save.
Figure 50. Objects tab
BMTX-SVU01B-EN 59
Displaying and Changing Status Information
Accessing the Simplified Override
Dialog boxThe Simplified Override dialog box can only be accessed through a graphic. You can access it by using either the Override Control button or a pop-up menu. With the Simplified Override dialog box you can override the present value of:
• Analog outputs• Multi-state analog outputs• Binary outputs• UCMs and applications• Non-Trane BACnet points
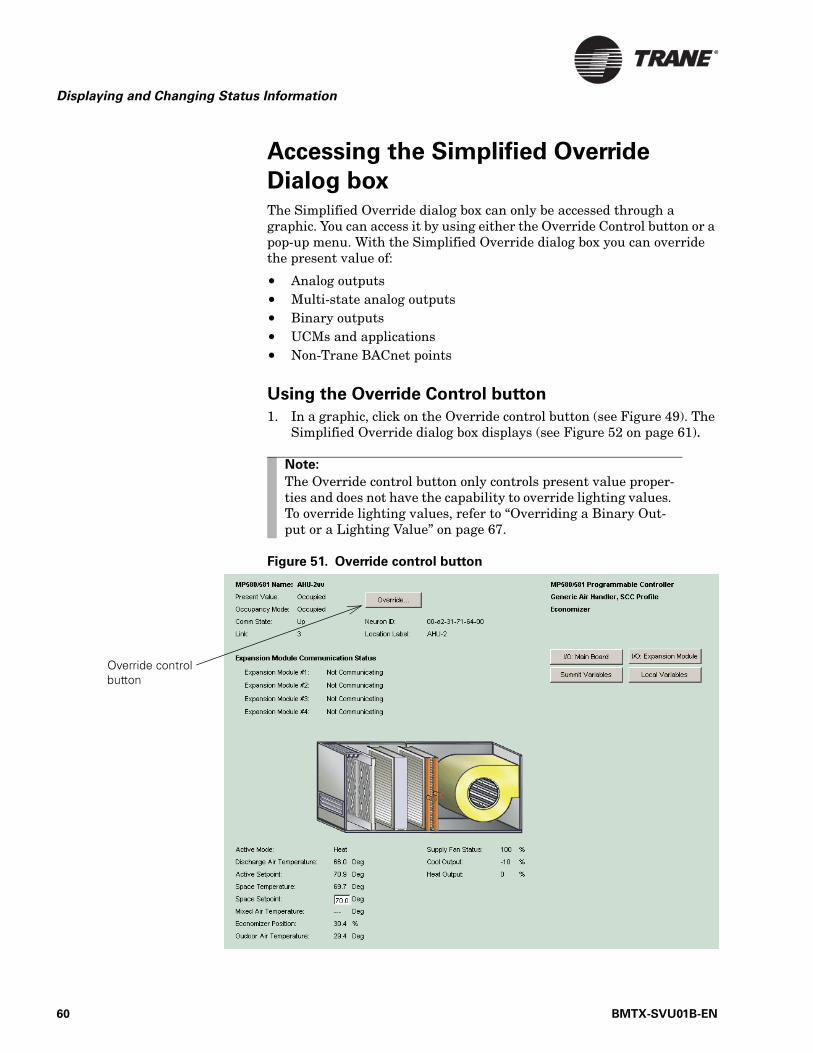
Using the Override Control button
1. In a graphic, click on the Override control button (see Figure 49). The Simplified Override dialog box displays (see Figure 52 on page 61).
Figure 51. Override control button
Note:
The Override control button only controls present value proper-ties and does not have the capability to override lighting values. To override lighting values, refer to “Overriding a Binary Out-put or a Lighting Value” on page 67.
Override control button
60 BMTX-SVU01B-EN
Accessing the Simplified Override Dialog box
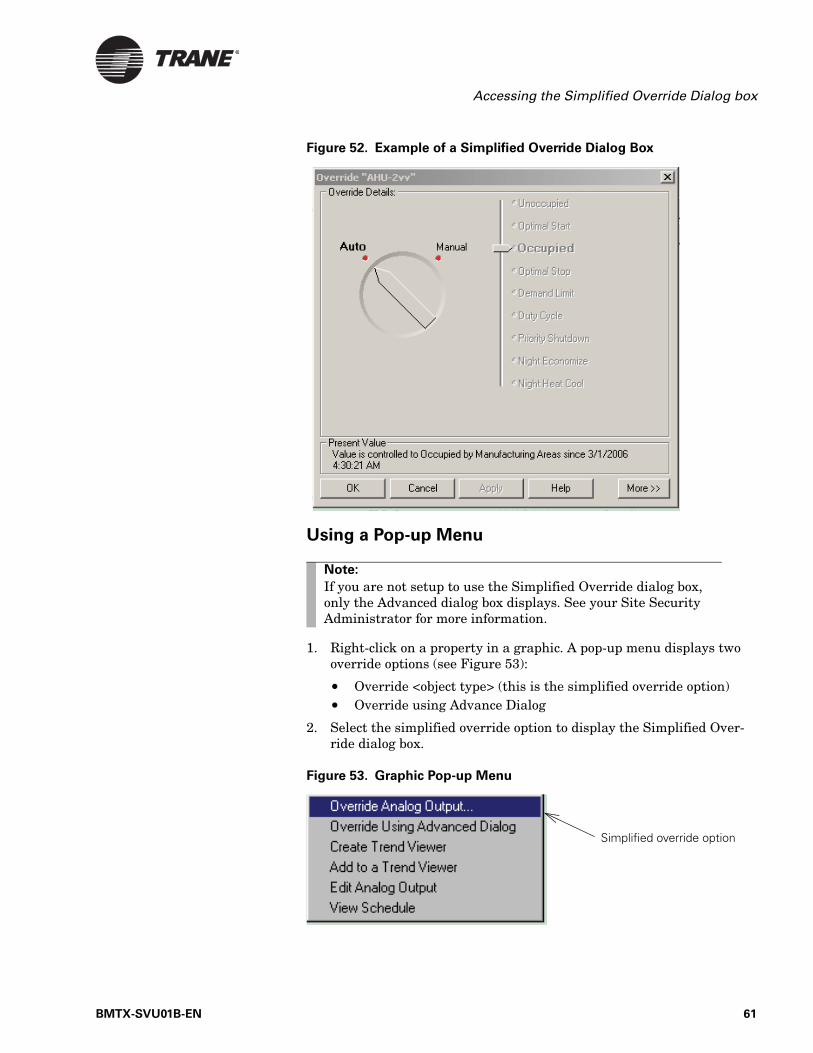
Figure 52. Example of a Simplified Override Dialog Box
Using a Pop-up Menu
1. Right-click on a property in a graphic. A pop-up menu displays two override options (see Figure 53):
• Override <object type> (this is the simplified override option)• Override using Advance Dialog
2. Select the simplified override option to display the Simplified Over-ride dialog box.
Figure 53. Graphic Pop-up Menu
Note:
If you are not setup to use the Simplified Override dialog box, only the Advanced dialog box displays. See your Site Security Administrator for more information.
Simplified override option
BMTX-SVU01B-EN 61
Displaying and Changing Status Information
Using the Simplified Override Dialog
BoxWith the Simplified Override dialog box you can easily override the fol-lowing:
• Analog outputs• Binary outputs• Multi-state analog outputs• UCMs• Non-Trane BACnet points
Overriding an Analog Output
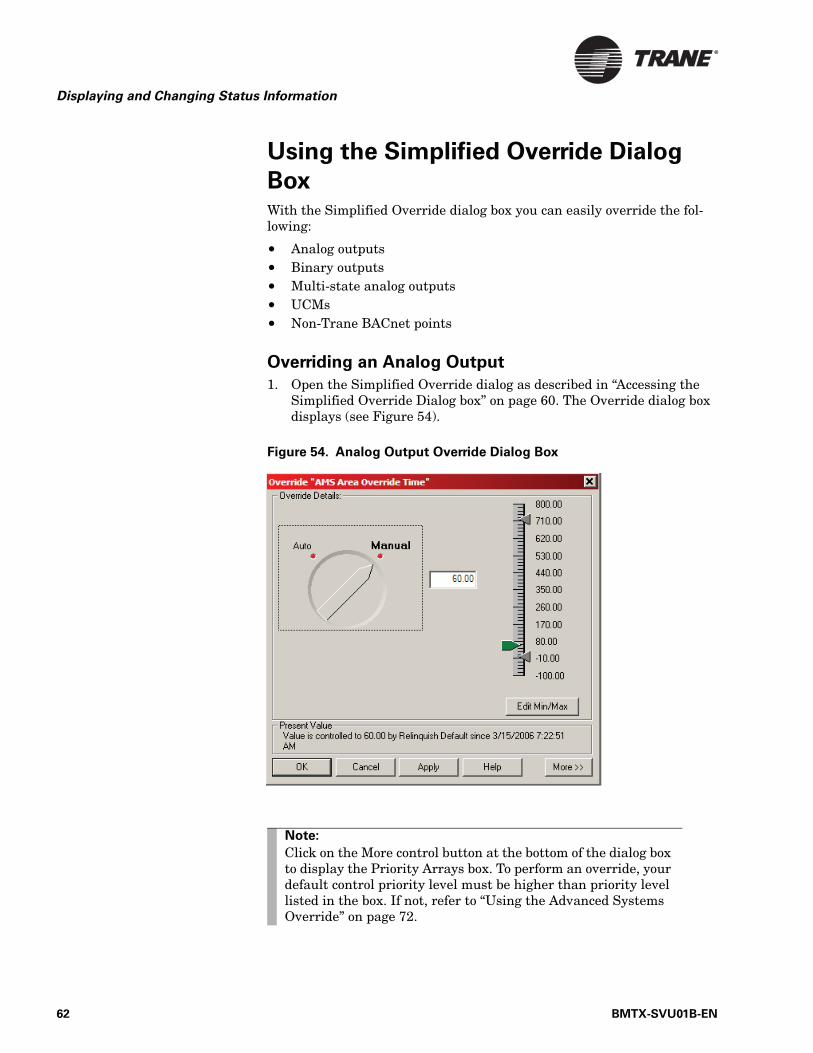
1. Open the Simplified Override dialog as described in “Accessing the Simplified Override Dialog box” on page 60. The Override dialog box displays (see Figure 54).
Figure 54. Analog Output Override Dialog Box
Note:
Click on the More control button at the bottom of the dialog box to display the Priority Arrays box. To perform an override, your default control priority level must be higher than priority level listed in the box. If not, refer to “Using the Advanced Systems Override” on page 72.
62 BMTX-SVU01B-EN
Using the Simplified Override Dialog Box
2. Click on the Manual option in the Auto/Manual knob. This enables the slider bar and text field.
3. Click in the text field and enter a new value. The green indicator in the slider bar moves to reflect the new value.
4. Click the Apply button to apply the override and view the results, or click OK to apply the changes and close the dialog box.
Changing the Min/Max Output Range
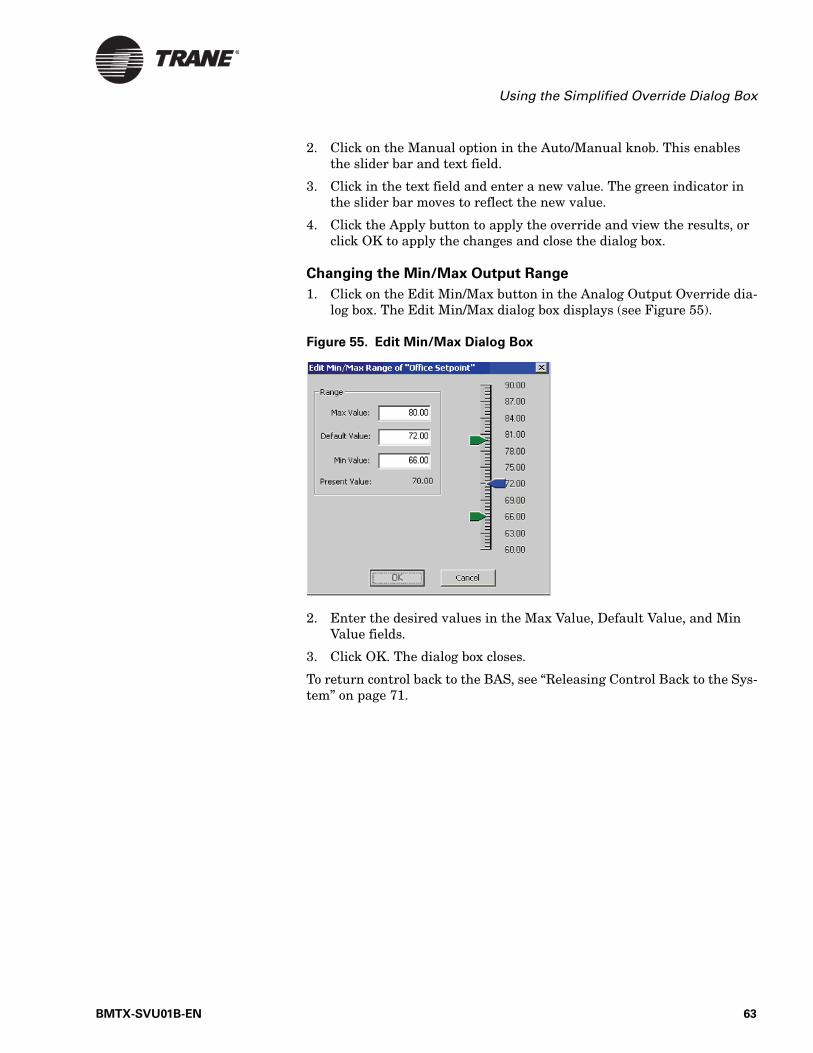
1. Click on the Edit Min/Max button in the Analog Output Override dia-log box. The Edit Min/Max dialog box displays (see Figure 55).
Figure 55. Edit Min/Max Dialog Box
2. Enter the desired values in the Max Value, Default Value, and Min Value fields.
3. Click OK. The dialog box closes.
To return control back to the BAS, see “Releasing Control Back to the Sys-tem” on page 71.
BMTX-SVU01B-EN 63
Displaying and Changing Status Information
Overriding an Analog Output or Analog Value in a Non-
Trane BACnet Device
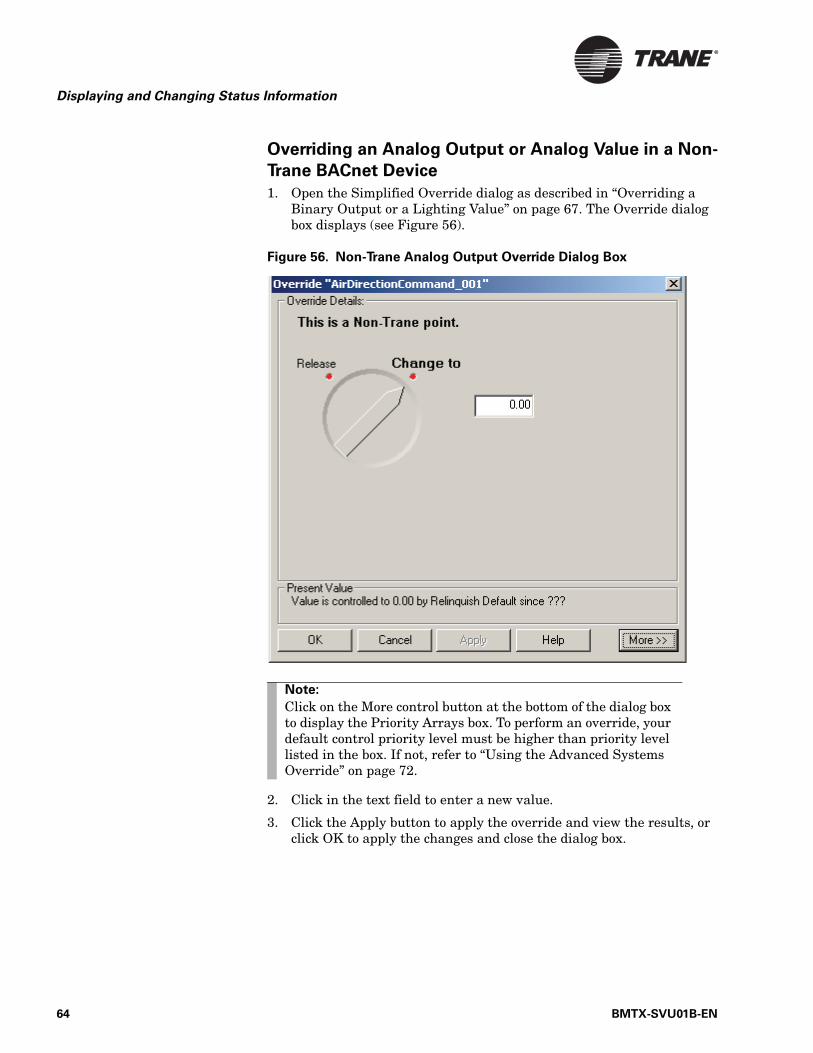
1. Open the Simplified Override dialog as described in “Overriding a Binary Output or a Lighting Value” on page 67. The Override dialog box displays (see Figure 56).
Figure 56. Non-Trane Analog Output Override Dialog Box
2. Click in the text field to enter a new value.
3. Click the Apply button to apply the override and view the results, or click OK to apply the changes and close the dialog box.
Note:
Click on the More control button at the bottom of the dialog box to display the Priority Arrays box. To perform an override, your default control priority level must be higher than priority level listed in the box. If not, refer to “Using the Advanced Systems Override” on page 72.
64 BMTX-SVU01B-EN
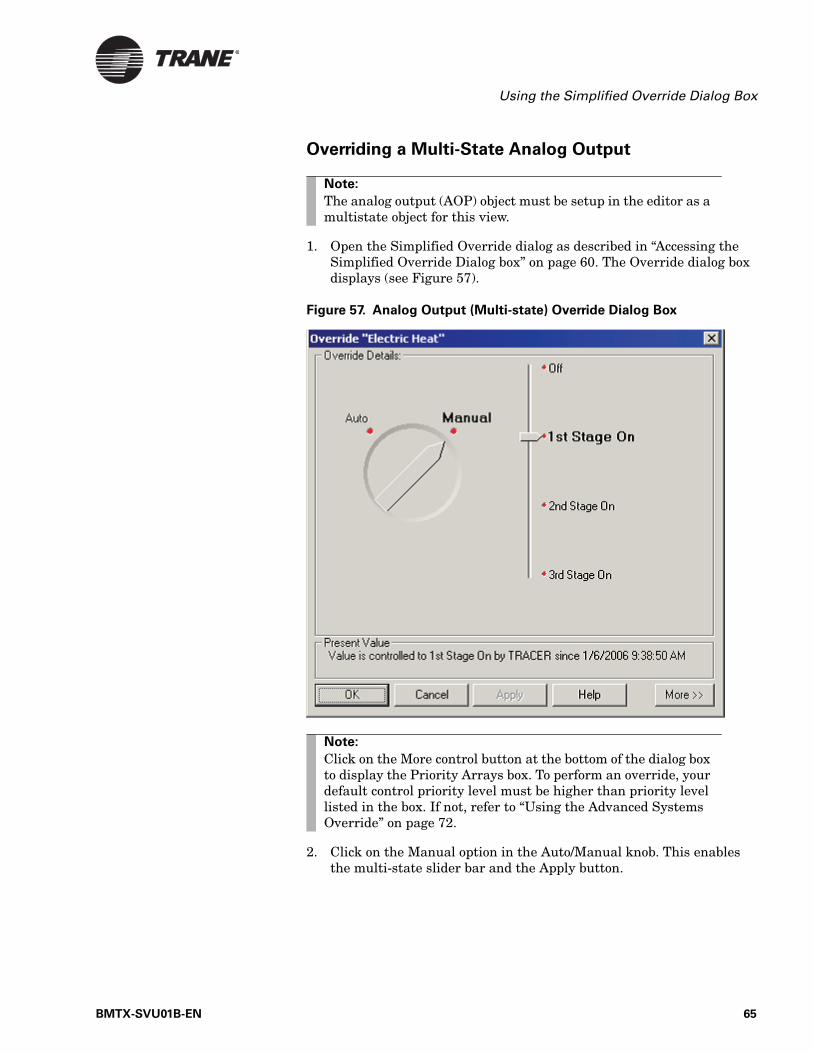
Using the Simplified Override Dialog Box
Overriding a Multi-State Analog Output
1. Open the Simplified Override dialog as described in “Accessing the Simplified Override Dialog box” on page 60. The Override dialog box displays (see Figure 57).
Figure 57. Analog Output (Multi-state) Override Dialog Box
2. Click on the Manual option in the Auto/Manual knob. This enables the multi-state slider bar and the Apply button.
Note:
The analog output (AOP) object must be setup in the editor as a multistate object for this view.
Note:
Click on the More control button at the bottom of the dialog box to display the Priority Arrays box. To perform an override, your default control priority level must be higher than priority level listed in the box. If not, refer to “Using the Advanced Systems Override” on page 72.
BMTX-SVU01B-EN 65

Displaying and Changing Status Information
3. Click and drag the indicator in the slider bar to the desired setting.
4. Click the Apply button to apply the override and view the results, or click OK to apply the changes and close the dialog box.
To return control back to the BAS, see “Releasing Control Back to the Sys-tem” on page 71.
Overriding a Multi-State Output in a non-Trane BACnet
Device
1. Open the Simplified Override dialog as described in “Accessing the Simplified Override Dialog box” on page 60. The Override dialog box displays (see Figure 58).
Figure 58. Non-Trane Analog Output (Multi-state) Override Dialog Box
2. Verify that the Control knob is in the Change to position.
3. Click and drag the indicator in the slider bar to the desired setting.
Note:
Click on the More control button at the bottom of the dialog box to display the Priority Arrays box. To perform an override, your default control priority level must be higher than priority level listed in the box. If not, refer to “Using the Advanced Systems Override” on page 72.
66 BMTX-SVU01B-EN
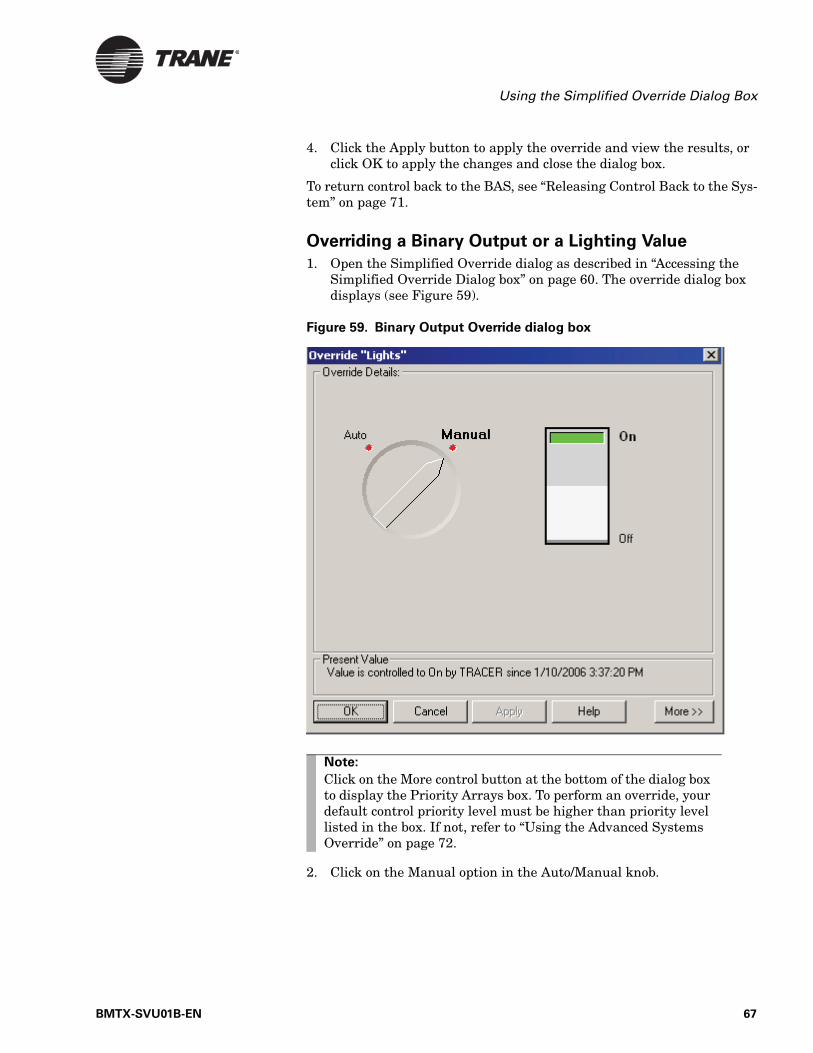
Using the Simplified Override Dialog Box
4. Click the Apply button to apply the override and view the results, or click OK to apply the changes and close the dialog box.
To return control back to the BAS, see “Releasing Control Back to the Sys-tem” on page 71.
Overriding a Binary Output or a Lighting Value
1. Open the Simplified Override dialog as described in “Accessing the Simplified Override Dialog box” on page 60. The override dialog box displays (see Figure 59).
Figure 59. Binary Output Override dialog box
2. Click on the Manual option in the Auto/Manual knob.
Note:
Click on the More control button at the bottom of the dialog box to display the Priority Arrays box. To perform an override, your default control priority level must be higher than priority level listed in the box. If not, refer to “Using the Advanced Systems Override” on page 72.
BMTX-SVU01B-EN 67
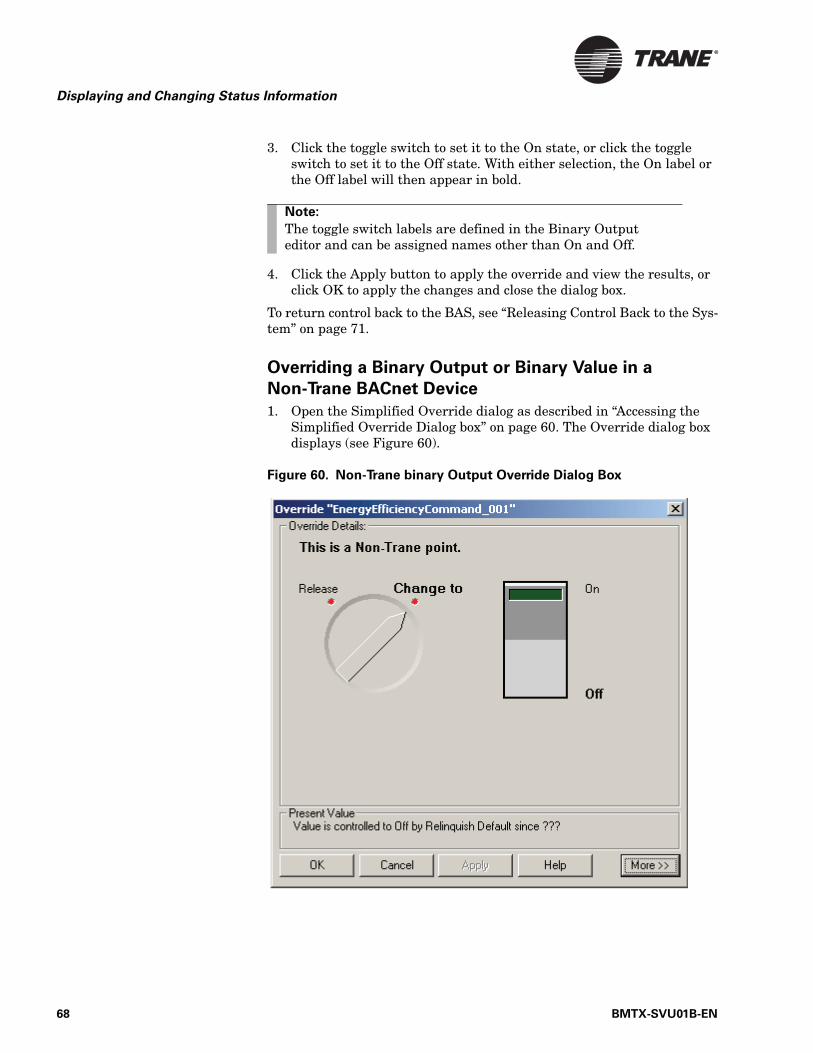
Displaying and Changing Status Information
3. Click the toggle switch to set it to the On state, or click the toggle switch to set it to the Off state. With either selection, the On label or the Off label will then appear in bold.
4. Click the Apply button to apply the override and view the results, or click OK to apply the changes and close the dialog box.
To return control back to the BAS, see “Releasing Control Back to the Sys-tem” on page 71.
Overriding a Binary Output or Binary Value in a
Non-Trane BACnet Device
1. Open the Simplified Override dialog as described in “Accessing the Simplified Override Dialog box” on page 60. The Override dialog box displays (see Figure 60).
Figure 60. Non-Trane binary Output Override Dialog Box
Note:
The toggle switch labels are defined in the Binary Output editor and can be assigned names other than On and Off.
68 BMTX-SVU01B-EN
Using the Simplified Override Dialog Box
2. Verify the control knob is in the Change to position.
3. Click the toggle switch to set it to the On state, or click the toggle switch to set it to the Off state. With either selection, the On or Off label will then appear in bold.
4. Click the Apply button to apply the override and view the results, or click OK to apply the changes and close the dialog box.
To return control back to the BAS, see “Releasing Control Back to the Sys-tem” on page 71.
Note:
Click on the More control button at the bottom of the dialog box to display the Priority Arrays box. To perform an override, your default control priority level must be higher than priority level listed in the box. If not, refer to “Using the Advanced Systems Override” on page 72.
Note:
The toggle switch labels are defined in the Binary Output editor and can be assigned names other than On and Off.
BMTX-SVU01B-EN 69
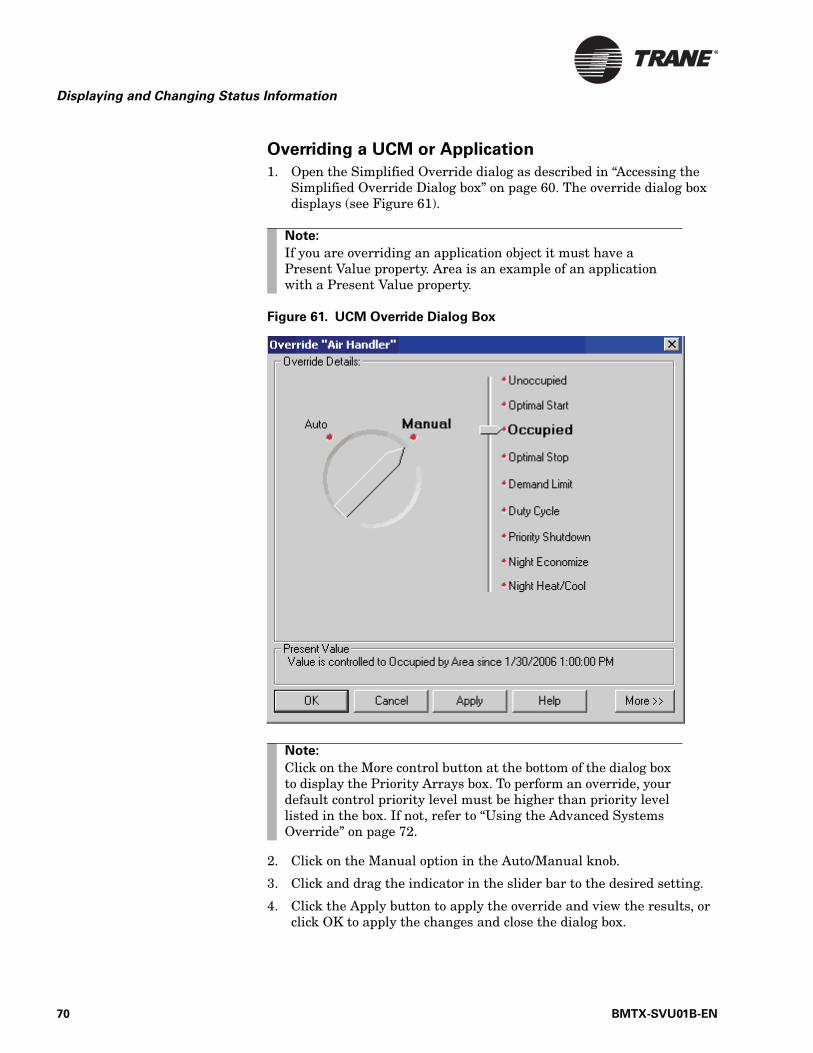
Displaying and Changing Status Information
Overriding a UCM or Application
1. Open the Simplified Override dialog as described in “Accessing the Simplified Override Dialog box” on page 60. The override dialog box displays (see Figure 61).
Figure 61. UCM Override Dialog Box
2. Click on the Manual option in the Auto/Manual knob.
3. Click and drag the indicator in the slider bar to the desired setting.
4. Click the Apply button to apply the override and view the results, or click OK to apply the changes and close the dialog box.
Note:
If you are overriding an application object it must have a Present Value property. Area is an example of an application with a Present Value property.
Note:
Click on the More control button at the bottom of the dialog box to display the Priority Arrays box. To perform an override, your default control priority level must be higher than priority level listed in the box. If not, refer to “Using the Advanced Systems Override” on page 72.
70 BMTX-SVU01B-EN
Using the Simplified Override Dialog Box
To return control back to the BAS, see “Releasing Control Back to the Sys-tem” on page 71.
Releasing Control Back to the System
To return control back to the BAS after performing an override, do the fol-lowing:
Trane Objects
1. In the Simplified Override dialog box, click Auto in the Auto/Manual knob.
2. Click OK to close the dialog box, or click Apply to view the updated Present Value field and priority arrays.
Non-Trane BACnet devices
1. In the Simplified Override dialog box, click on the Release in the Release/Change to knob.
2. Click OK to close the dialog box, or click Apply to view the updated Present Value field and priority arrays.
Note:
Clicking on Auto to release control back to the BAS also removes all user overrides from the priority array.
BMTX-SVU01B-EN 71

Displaying and Changing Status Information
Using the Advanced Systems OverrideWith the Advanced Override dialog box you can perform the following overrides:
• Control the object to a different mode or value. By controlling UCMs and applications, you change the mode. By controlling analog outputs, you change the numerical value. By controlling binary outputs, you change the binary selection or value.
• With BCU sites, you can set the priority at which the value takes effect. Priority is the level or rank assigned to a command source, such as a system application or a user command. Control priority var-ies from 1 (highest) to 16 (lowest). You will usually override at the user-high (level 4) or user-low (level 12) level.
• Release the control of a system application or user override on the specific object. If the released priority is the highest, the next highest priority is applied to the object.
To open the Advanced Override dialog box:
1. From a graphic, right-click the button that controls the object’s value or mode (Override, Control, etc.). A pop-up menu displays.
2. From the pop-up menu, select Override using Advanced Dialog. The Advanced dialog box displays (see Figure 62 on page 73).
• If you are operating a Tracer 100 site, select Calculated Analog or Calculated Binary from the Setup menu. When the Select Calculated Analog or Select Calculated Binary dialog box displays, select a name, then click OK. Select the Override tab, then click the Override button The Override dialog box displays
Note:
The Advanced Override dialog box will not display if the default-priority value is selected.
Note:
If you are using the Tracer 100 site, you can use the Override dialog box to override or release present value control (see “Overriding the Present Value Control” on page 73 or “Releas-ing Control with Present Value Control” on page 73).
72 BMTX-SVU01B-EN
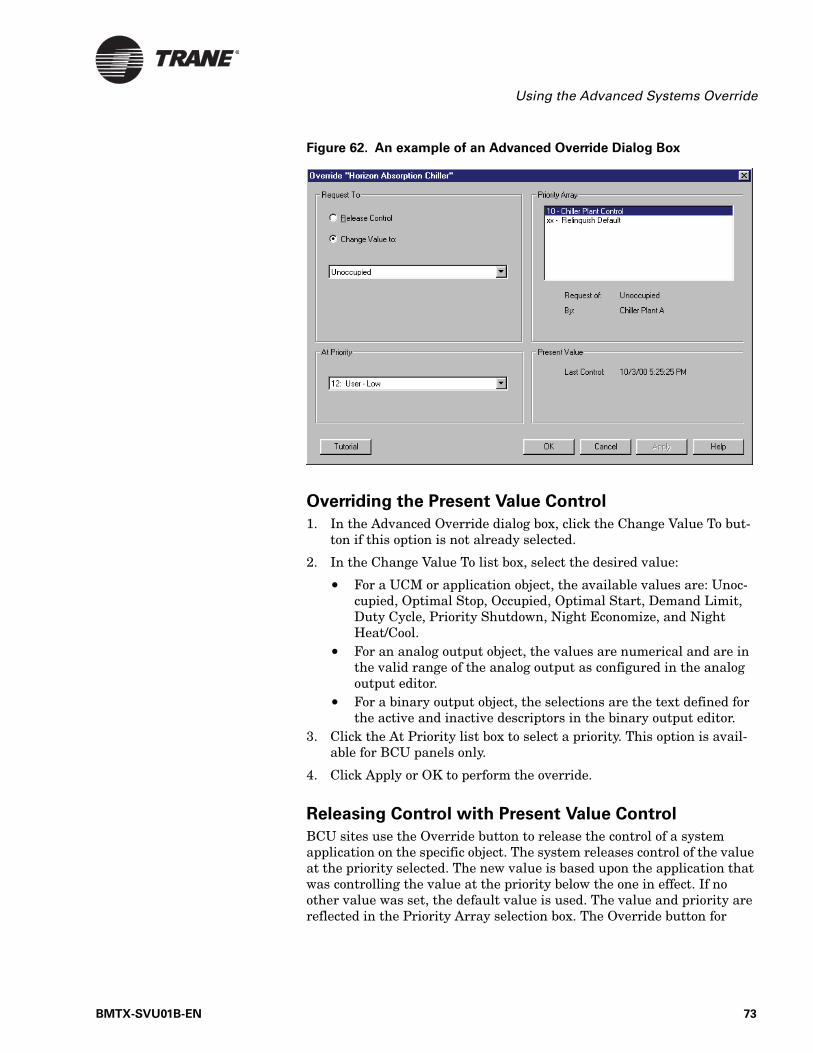
Using the Advanced Systems Override
Figure 62. An example of an Advanced Override Dialog Box
Overriding the Present Value Control
1. In the Advanced Override dialog box, click the Change Value To but-ton if this option is not already selected.
2. In the Change Value To list box, select the desired value:
• For a UCM or application object, the available values are: Unoc-cupied, Optimal Stop, Occupied, Optimal Start, Demand Limit, Duty Cycle, Priority Shutdown, Night Economize, and Night Heat/Cool.
• For an analog output object, the values are numerical and are in the valid range of the analog output as configured in the analog output editor.
• For a binary output object, the selections are the text defined for the active and inactive descriptors in the binary output editor.
3. Click the At Priority list box to select a priority. This option is avail-able for BCU panels only.
4. Click Apply or OK to perform the override.
Releasing Control with Present Value Control
BCU sites use the Override button to release the control of a system application on the specific object. The system releases control of the value at the priority selected. The new value is based upon the application that was controlling the value at the priority below the one in effect. If no other value was set, the default value is used. The value and priority are reflected in the Priority Array selection box. The Override button for
BMTX-SVU01B-EN 73
Displaying and Changing Status Information
UCMs is active if the BCU is up and communicating with the UCM and your workstation, and if the UCM is not under local control.
To release control with present value control:
1. At the Advanced Override dialog box, click the Release Control but-ton. The Change Value To button becomes inactive and the system selects the highest priority from the At Priority list box.
2. Click the Apply button to perform the release.
Changing Setpoints
You can manually adjust setpoints for pieces of equipment using setpoint control fields. The setpoint control field is used for any analog value in the system. Figure 46 on page 56 shows an example setpoint control field.
This section applies to BCU sites only.
To change a setpoint:
1. With a graphic displayed, move the mouse pointer over the setpoint control field. The mouse pointer changes to the insertion point.
2. Click the field to highlight the value.
3. Type in the value to be used and press Enter. The new value displays and is sent to the system for control. If the value is not valid, an error message displays, explaining the reason for the error.
Changing Binary Values with Binary Check Box
Controls
You can manually control a binary value in the system using the binary check box control field. Figure 46 on page 56 shows an example binary check box control field.
This section applies to BCU sites only.
To change the binary control value:
◆ With a graphic displayed, click the check box of a binary control field to place or clear the check mark. Click anywhere outside the check box. The new value is sent to the system for control. If the value is not valid, an error message displays, explaining why the change did not take place.
Changing System Values with Selection List Controls
You can manually select desired states of system values using selection list control fields. These fields are drop-down lists of available selections.
Note:
On BCU sites, the name of the Override button is specific to your site. For example, the button may be called Override, Con-trol or another name.
74 BMTX-SVU01B-EN
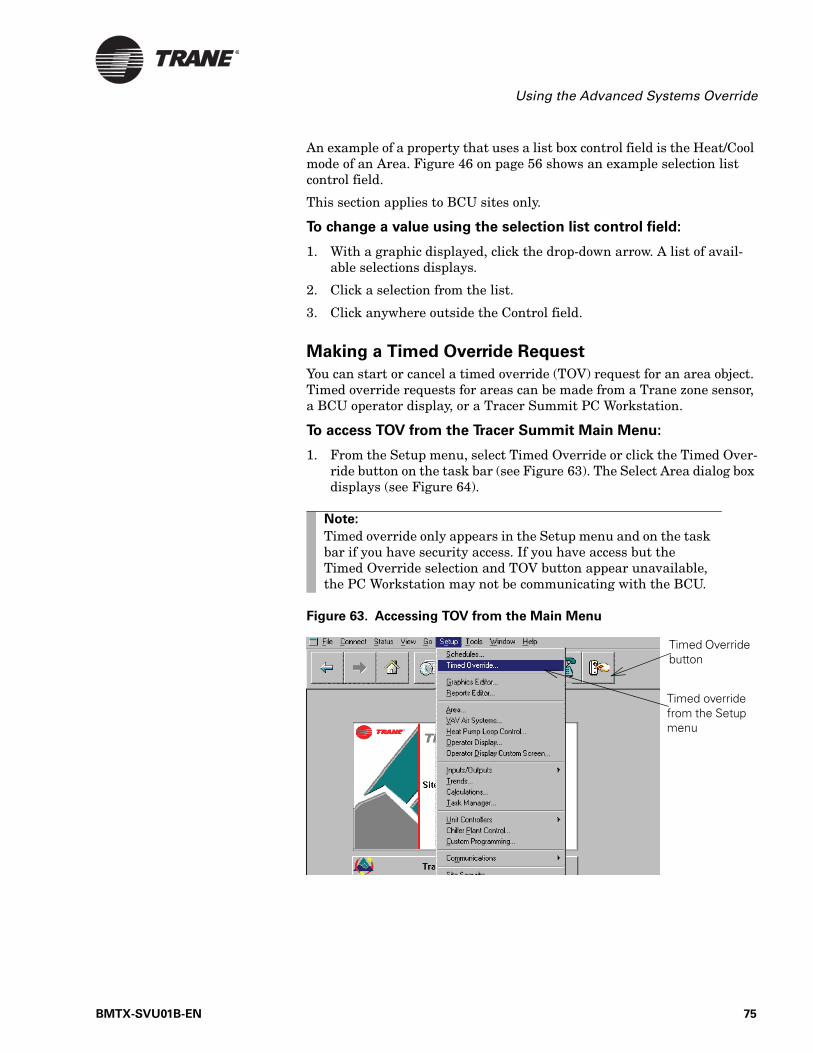
Using the Advanced Systems Override
An example of a property that uses a list box control field is the Heat/Cool mode of an Area. Figure 46 on page 56 shows an example selection list control field.
This section applies to BCU sites only.
To change a value using the selection list control field:
1. With a graphic displayed, click the drop-down arrow. A list of avail-able selections displays.
2. Click a selection from the list.
3. Click anywhere outside the Control field.
Making a Timed Override Request
You can start or cancel a timed override (TOV) request for an area object. Timed override requests for areas can be made from a Trane zone sensor, a BCU operator display, or a Tracer Summit PC Workstation.
To access TOV from the Tracer Summit Main Menu:
1. From the Setup menu, select Timed Override or click the Timed Over-ride button on the task bar (see Figure 63). The Select Area dialog box displays (see Figure 64).
Figure 63. Accessing TOV from the Main Menu
Note:
Timed override only appears in the Setup menu and on the task bar if you have security access. If you have access but the Timed Override selection and TOV button appear unavailable, the PC Workstation may not be communicating with the BCU.
Timed Override button
Timed override from the Setup menu
BMTX-SVU01B-EN 75
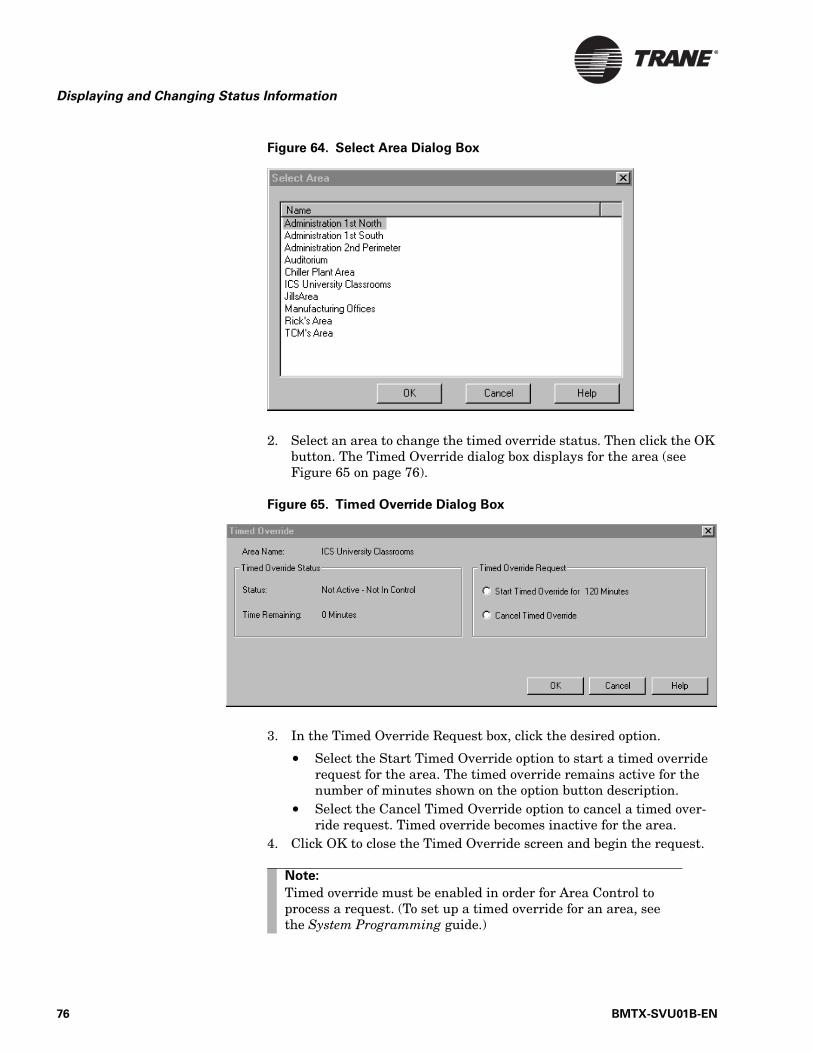
Displaying and Changing Status Information
Figure 64. Select Area Dialog Box
2. Select an area to change the timed override status. Then click the OK button. The Timed Override dialog box displays for the area (see Figure 65 on page 76).
Figure 65. Timed Override Dialog Box
3. In the Timed Override Request box, click the desired option.
• Select the Start Timed Override option to start a timed override request for the area. The timed override remains active for the number of minutes shown on the option button description.
• Select the Cancel Timed Override option to cancel a timed over-ride request. Timed override becomes inactive for the area.
4. Click OK to close the Timed Override screen and begin the request.
Note:
Timed override must be enabled in order for Area Control to process a request. (To set up a timed override for an area, see the System Programming guide.)
76 BMTX-SVU01B-EN

Using the Graphics Pop-up Menu
Using the Graphics Pop-up MenuTracer Summit graphics help lead you through the system. From a graphic you can easily reach the Trend Viewer, editor, schedule and report for the selected piece of equipment, either by using a graphics pop-up menu or by using the task bar buttons. Access the graphics pop-up menu by right-clicking on the graphic itself and on most fields. The pop-up menu contains the following menu items: Open Trend Viewer, Edit area, View Schedule, and View Report (see Figure 66).
Figure 66. Graphics Pop-Up Menu
Open Trend Viewer
Selecting the Open Trend Viewer displays a graphical representation of data collected by the trend object. It displays both live and historical data. It will only display as an option if a Trend Viewer was previously created for the object. If not, Create a Trend Viewer will display instead.
Edit
Selecting the Edit item displays the editor for the object in the selected status or control field. The name of the menu item is dependent upon the object type that is being displayed in the status or control field. In Figure 66, the Edit item is specific to Area.
View Schedule
Selecting View Schedule displays the Scheduling application with the schedule for the object for which the field is displaying data. The object has to be a member of a schedule or of an area that is a member of a schedule. If the object is not a member of a schedule, the schedule applica-tion displays as if you are creating a new schedule. For more information about schedules, refer to Chapter 8, “Changing Schedules.”
View Report
Selecting View Report displays the Report Viewer application with the specific report for the field of the selected object. If there is more than one report defined for an object, the system displays the Select Standard Live Report window.
Note:
These menu items are available only if you have access privileges.
The Edit item changes based on the object type that is being displayed
This option will only appear if a Trend Viewer was previously created for the object.
BMTX-SVU01B-EN 77

Displaying and Changing Status Information
Displaying Information on a Graph
With Tracer Summit, you can display information about an object in a Trend Viewer.
A Trend Viewer is a graphical representation of data collected by a trend object. By right-clicking on a graphic, you can create a Trend Viewer or open or add to an existing one. For more information on how to setup and access a Trend Viewer, refer to Chapter 11, “Using the Trend Viewer.”
78 BMTX-SVU01B-EN
Chapter 8
Changing Schedules
A schedule is a set of events (instructions) that tells the HVAC (heating, ventilating, air conditioning) equipment connected to Tracer Summit what to do and when to do it. For example, an event in a schedule tells a rooftop unit when to turn on and off. When you display a schedule on the scheduling screen, you see all the events that are scheduled for a particu-lar day.
There are three types of events in a schedule:
• Daily Events: These types of events occur every day, unless you over-ride them with a holiday or exception. (An example daily event is a change in building occupancy at 6 p.m.) Each day of the week can have separate events. Any combination of days can share the same events. For example, Monday, Wednesday, and Friday can have the same events, and Tuesday and Thursday could each have a different set of events or share the same events.
• Holidays: These types of events override specific daily events. You can define specific days on which holiday events override the daily events.
• Exceptions: These types of events override both daily events and holidays. Like a holiday event, you can define a specific day(s) that the exception will override.
This chapter provides scheduling information for the following sites:
• BCU panels• Tracer 100 panels
These sets of instructions are the same for both sites except where indi-cated.
Note:
You may not have access to all of the tasks presented in this guide. Your access privileges depend on your user profile. Con-tact your supervisor for information.
BMTX-SVU01B-EN 79
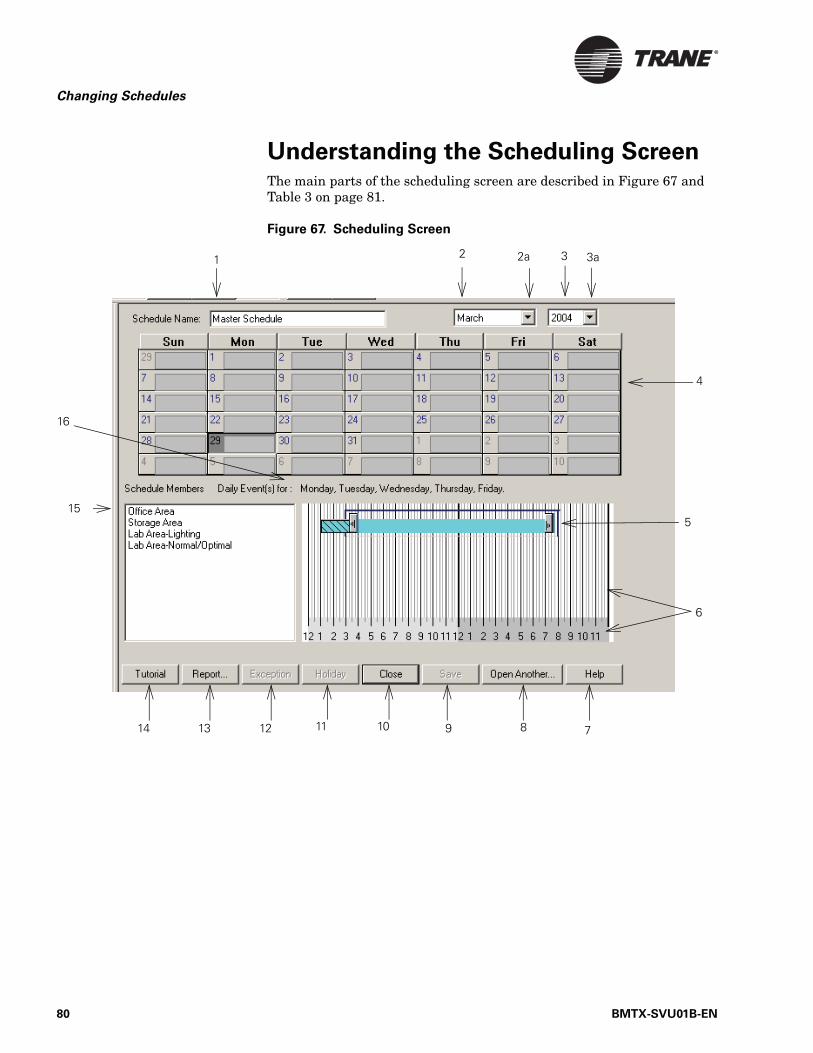
Changing Schedules
Understanding the Scheduling ScreenThe main parts of the scheduling screen are described in Figure 67 and Table 3 on page 81.
Figure 67. Scheduling Screen
1 2 2a 3 3a
781214
4
5
6
16
15
11 91013
80 BMTX-SVU01B-EN
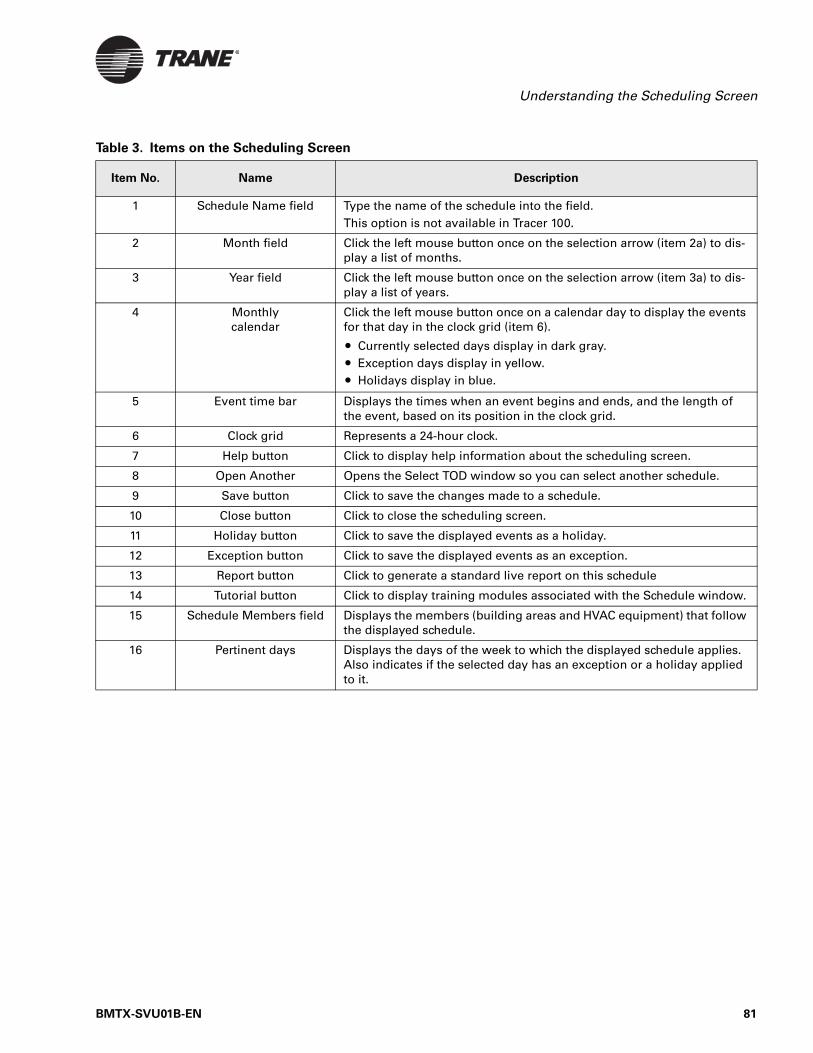
Understanding the Scheduling Screen
Table 3. Items on the Scheduling Screen
Item No. Name Description
1 Schedule Name field Type the name of the schedule into the field.This option is not available in Tracer 100.
2 Month field Click the left mouse button once on the selection arrow (item 2a) to dis-play a list of months.
3 Year field Click the left mouse button once on the selection arrow (item 3a) to dis-play a list of years.
4 Monthlycalendar
Click the left mouse button once on a calendar day to display the events for that day in the clock grid (item 6).
• Currently selected days display in dark gray.• Exception days display in yellow.• Holidays display in blue.
5 Event time bar Displays the times when an event begins and ends, and the length of the event, based on its position in the clock grid.
6 Clock grid Represents a 24-hour clock.
7 Help button Click to display help information about the scheduling screen.
8 Open Another Opens the Select TOD window so you can select another schedule.
9 Save button Click to save the changes made to a schedule.
10 Close button Click to close the scheduling screen.
11 Holiday button Click to save the displayed events as a holiday.
12 Exception button Click to save the displayed events as an exception.
13 Report button Click to generate a standard live report on this schedule
14 Tutorial button Click to display training modules associated with the Schedule window.
15 Schedule Members field Displays the members (building areas and HVAC equipment) that follow the displayed schedule.
16 Pertinent days Displays the days of the week to which the displayed schedule applies. Also indicates if the selected day has an exception or a holiday applied to it.
BMTX-SVU01B-EN 81
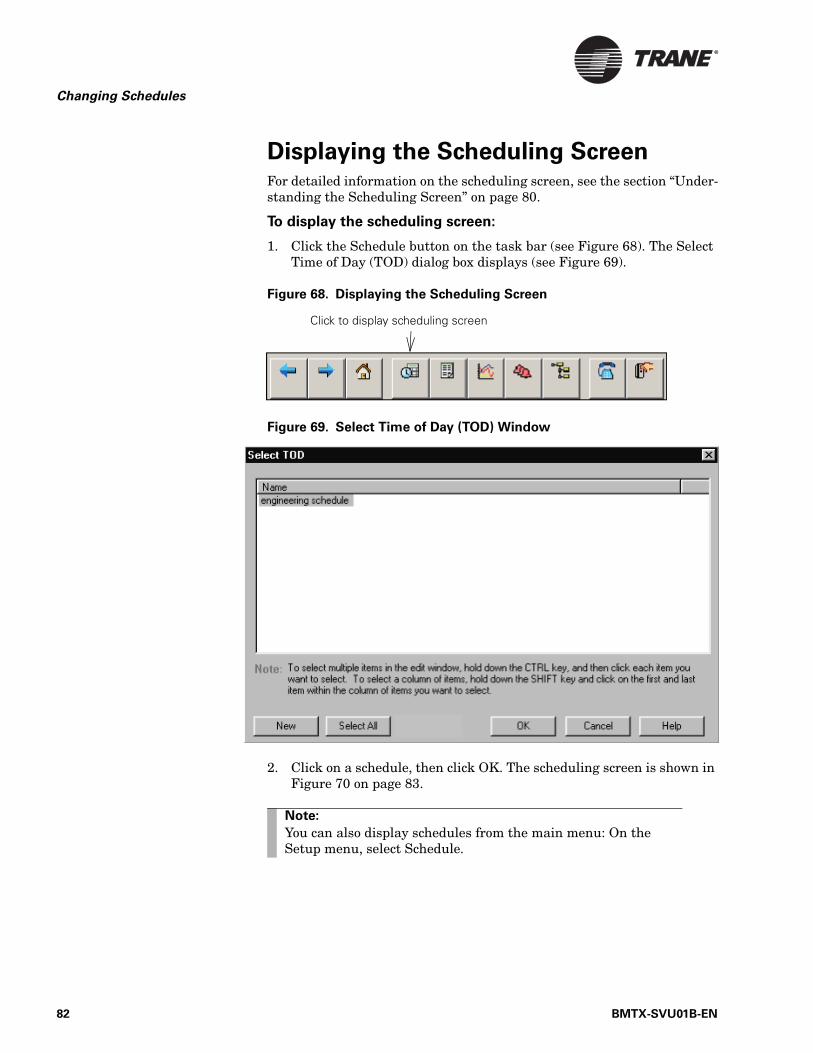
Changing Schedules
Displaying the Scheduling ScreenFor detailed information on the scheduling screen, see the section “Under-standing the Scheduling Screen” on page 80.
To display the scheduling screen:
1. Click the Schedule button on the task bar (see Figure 68). The Select Time of Day (TOD) dialog box displays (see Figure 69).
Figure 68. Displaying the Scheduling Screen
Figure 69. Select Time of Day (TOD) Window
2. Click on a schedule, then click OK. The scheduling screen is shown in Figure 70 on page 83.
Click to display scheduling screen
Note:
You can also display schedules from the main menu: On the Setup menu, select Schedule.
82 BMTX-SVU01B-EN
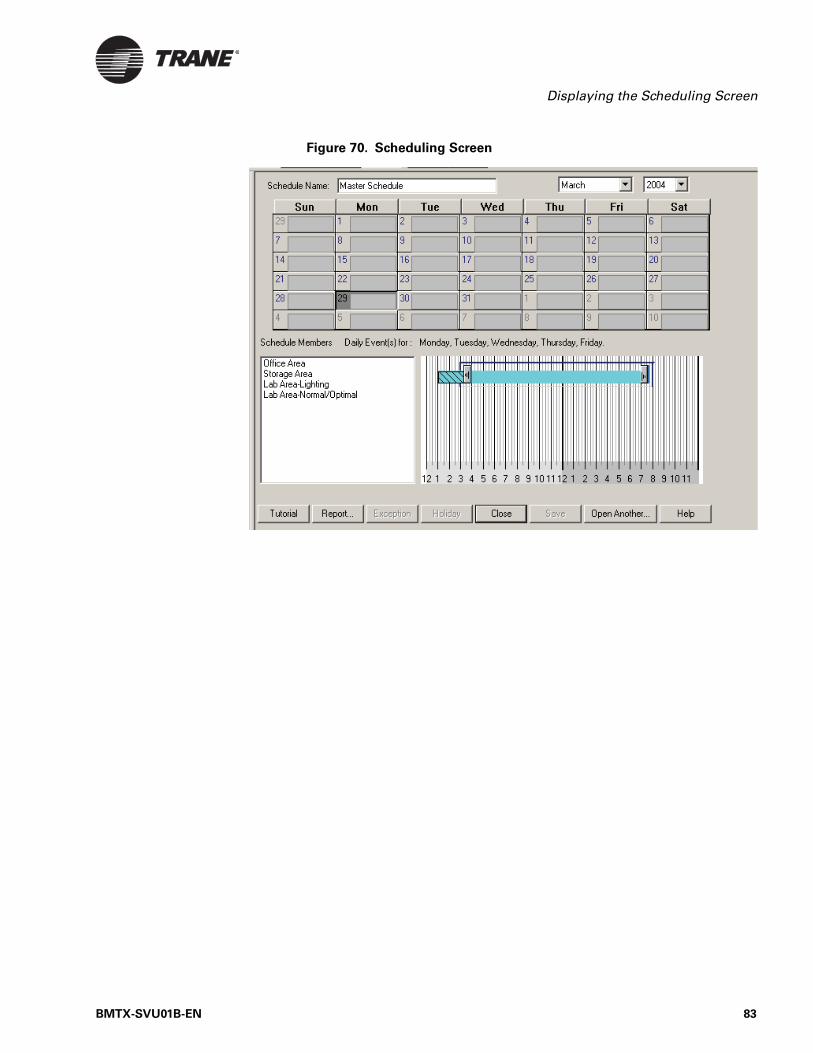
Displaying the Scheduling Screen
Figure 70. Scheduling Screen
BMTX-SVU01B-EN 83
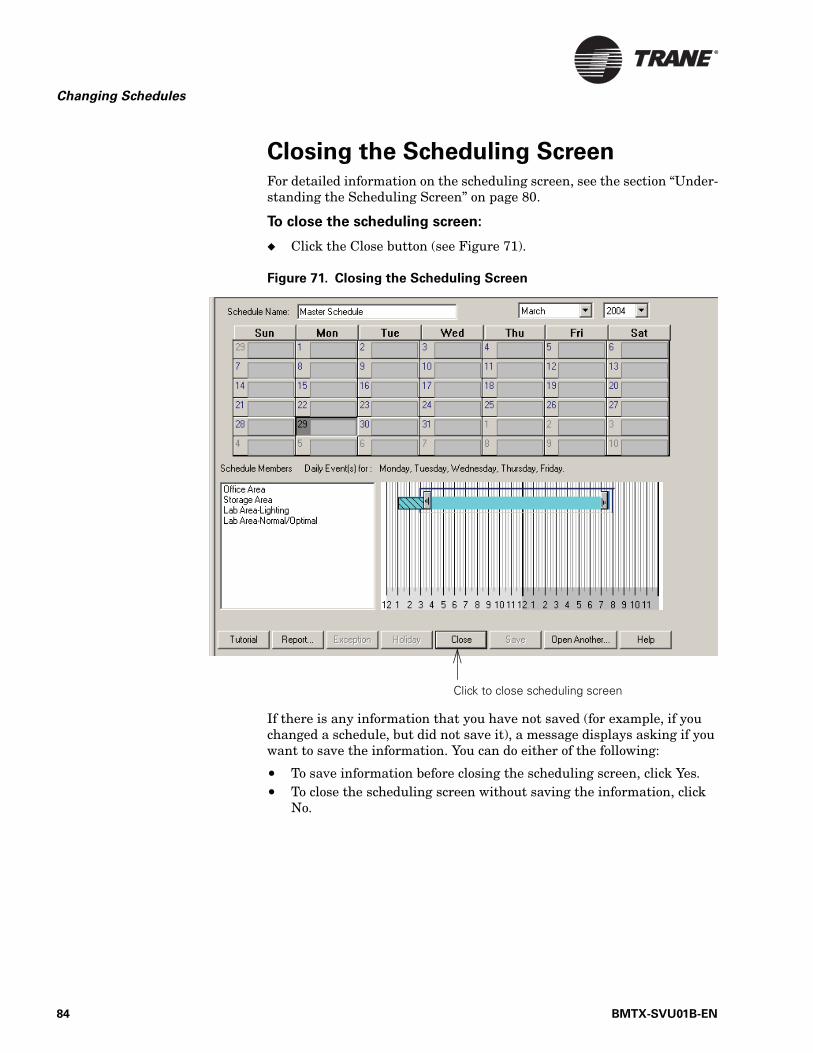
Changing Schedules
Closing the Scheduling ScreenFor detailed information on the scheduling screen, see the section “Under-standing the Scheduling Screen” on page 80.
To close the scheduling screen:
◆ Click the Close button (see Figure 71).
Figure 71. Closing the Scheduling Screen
If there is any information that you have not saved (for example, if you changed a schedule, but did not save it), a message displays asking if you want to save the information. You can do either of the following:
• To save information before closing the scheduling screen, click Yes.• To close the scheduling screen without saving the information, click
No.
Click to close scheduling screen
84 BMTX-SVU01B-EN
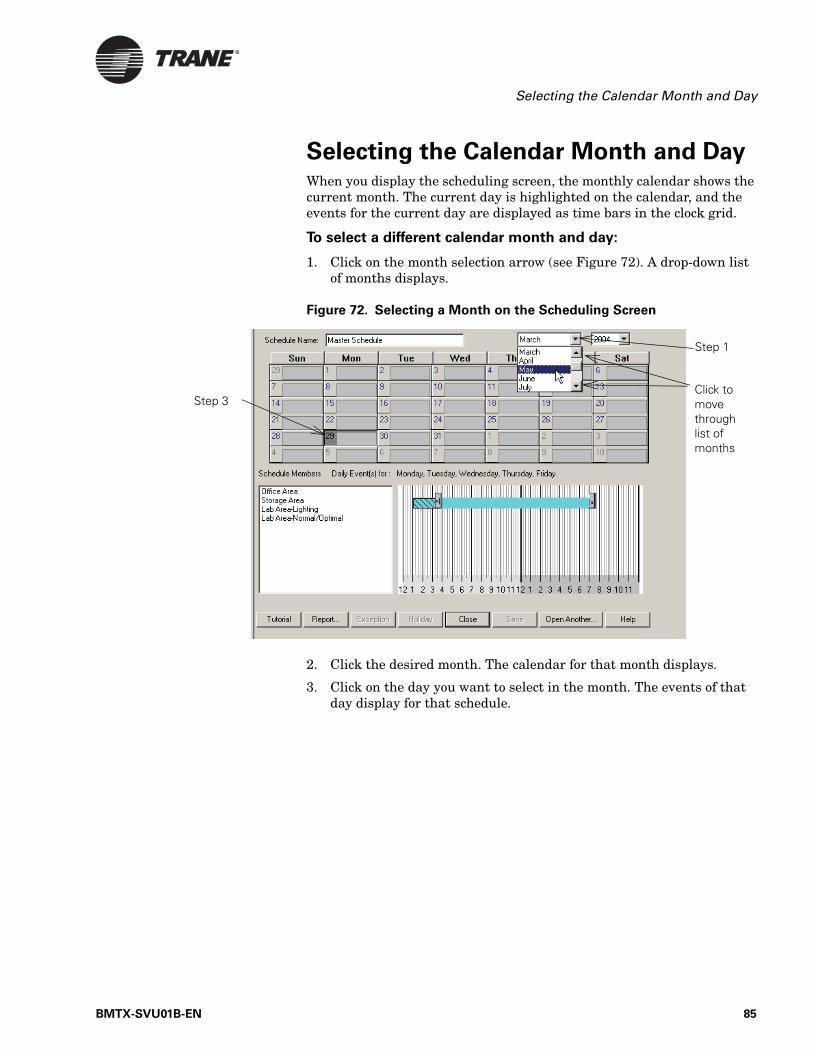
Selecting the Calendar Month and Day
Selecting the Calendar Month and DayWhen you display the scheduling screen, the monthly calendar shows the current month. The current day is highlighted on the calendar, and the events for the current day are displayed as time bars in the clock grid.
To select a different calendar month and day:
1. Click on the month selection arrow (see Figure 72). A drop-down list of months displays.
Figure 72. Selecting a Month on the Scheduling Screen
2. Click the desired month. The calendar for that month displays.
3. Click on the day you want to select in the month. The events of that day display for that schedule.
Step 1
Step 3Click to move through list of months
BMTX-SVU01B-EN 85
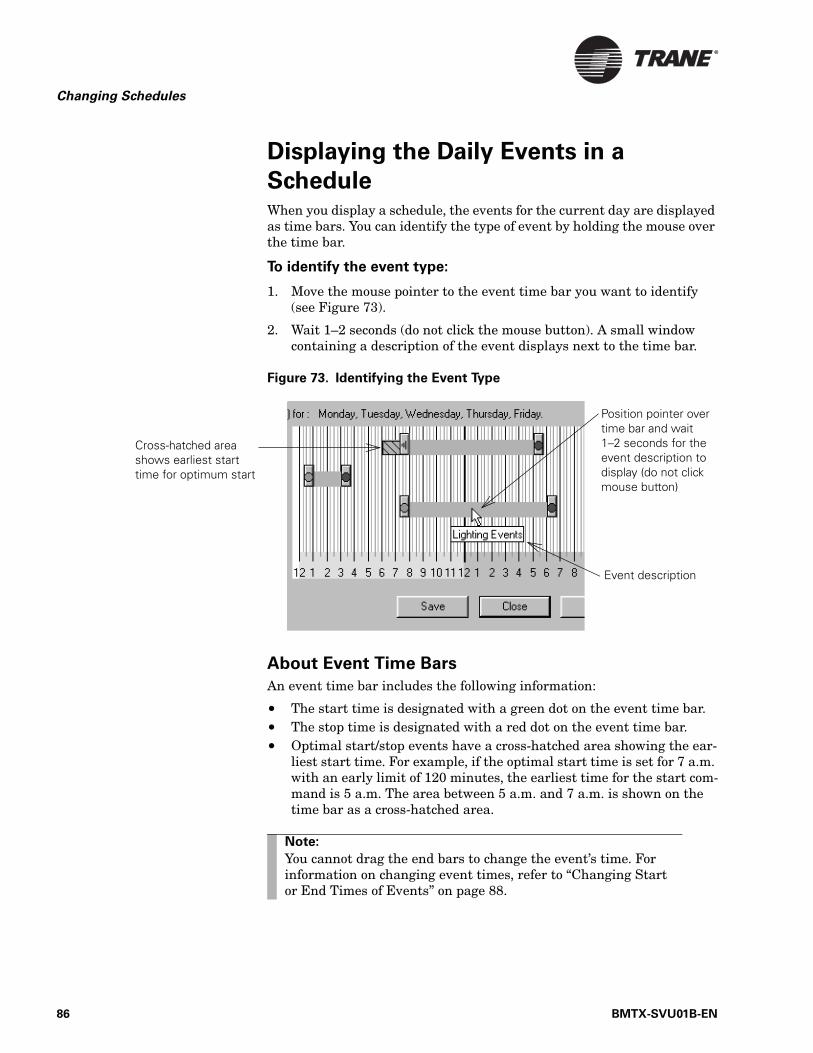
Changing Schedules
Displaying the Daily Events in a
ScheduleWhen you display a schedule, the events for the current day are displayed as time bars. You can identify the type of event by holding the mouse over the time bar.
To identify the event type:
1. Move the mouse pointer to the event time bar you want to identify (see Figure 73).
2. Wait 1–2 seconds (do not click the mouse button). A small window containing a description of the event displays next to the time bar.
Figure 73. Identifying the Event Type
About Event Time Bars
An event time bar includes the following information:
• The start time is designated with a green dot on the event time bar.• The stop time is designated with a red dot on the event time bar.• Optimal start/stop events have a cross-hatched area showing the ear-
liest start time. For example, if the optimal start time is set for 7 a.m. with an early limit of 120 minutes, the earliest time for the start com-mand is 5 a.m. The area between 5 a.m. and 7 a.m. is shown on the time bar as a cross-hatched area.
Position pointer over time bar and wait 1–2 seconds for the event description to display (do not click mouse button)
Event description
Cross-hatched area shows earliest start time for optimum start
Note:
You cannot drag the end bars to change the event’s time. For information on changing event times, refer to “Changing Start or End Times of Events” on page 88.
86 BMTX-SVU01B-EN
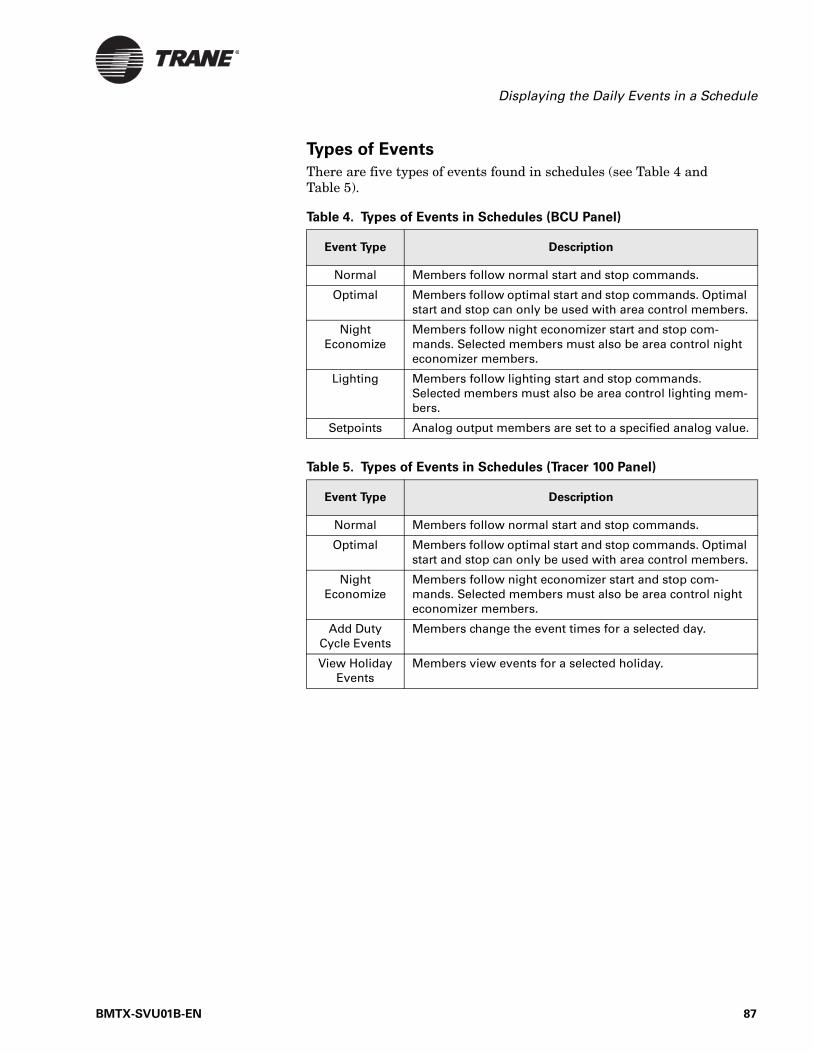
Displaying the Daily Events in a Schedule
Types of Events
There are five types of events found in schedules (see Table 4 and Table 5).
Table 4. Types of Events in Schedules (BCU Panel)
Event Type Description
Normal Members follow normal start and stop commands.
Optimal Members follow optimal start and stop commands. Optimal start and stop can only be used with area control members.
Night Economize
Members follow night economizer start and stop com-mands. Selected members must also be area control night economizer members.
Lighting Members follow lighting start and stop commands. Selected members must also be area control lighting mem-bers.
Setpoints Analog output members are set to a specified analog value.
Table 5. Types of Events in Schedules (Tracer 100 Panel)
Event Type Description
Normal Members follow normal start and stop commands.
Optimal Members follow optimal start and stop commands. Optimal start and stop can only be used with area control members.
Night Economize
Members follow night economizer start and stop com-mands. Selected members must also be area control night economizer members.
Add Duty Cycle Events
Members change the event times for a selected day.
View Holiday Events
Members view events for a selected holiday.
BMTX-SVU01B-EN 87
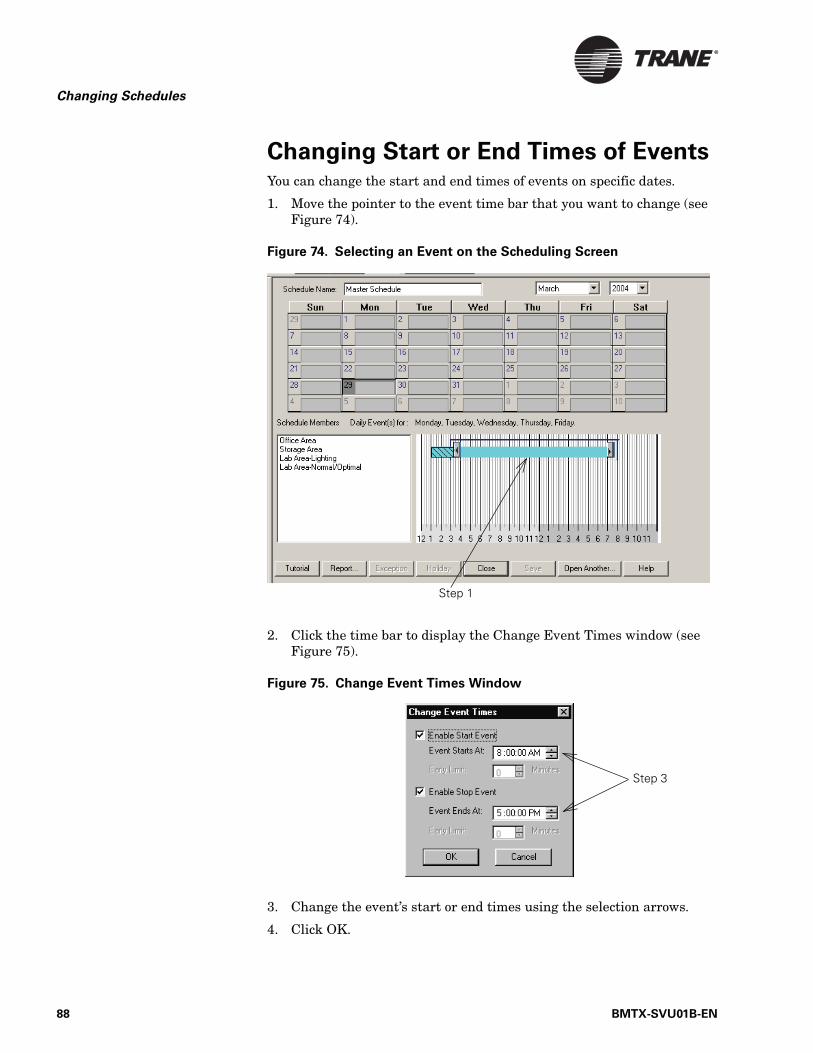
Changing Schedules
Changing Start or End Times of EventsYou can change the start and end times of events on specific dates.
1. Move the pointer to the event time bar that you want to change (see Figure 74).
Figure 74. Selecting an Event on the Scheduling Screen
2. Click the time bar to display the Change Event Times window (see Figure 75).
Figure 75. Change Event Times Window
3. Change the event’s start or end times using the selection arrows.
4. Click OK.
Step 1
Step 3
88 BMTX-SVU01B-EN
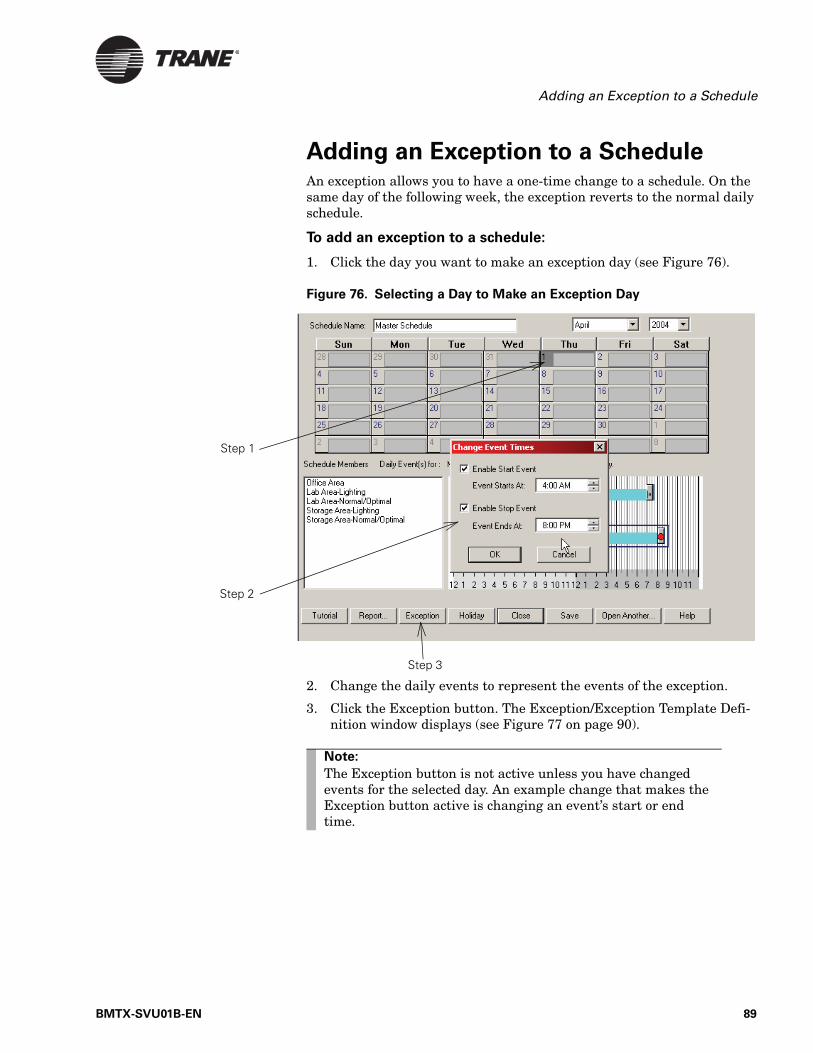
Adding an Exception to a Schedule
Adding an Exception to a ScheduleAn exception allows you to have a one-time change to a schedule. On the same day of the following week, the exception reverts to the normal daily schedule.
To add an exception to a schedule:
1. Click the day you want to make an exception day (see Figure 76).
Figure 76. Selecting a Day to Make an Exception Day
2. Change the daily events to represent the events of the exception.
3. Click the Exception button. The Exception/Exception Template Defi-nition window displays (see Figure 77 on page 90).
Step 1
Step 3
Step 2
Note:
The Exception button is not active unless you have changed events for the selected day. An example change that makes the Exception button active is changing an event’s start or end time.
BMTX-SVU01B-EN 89
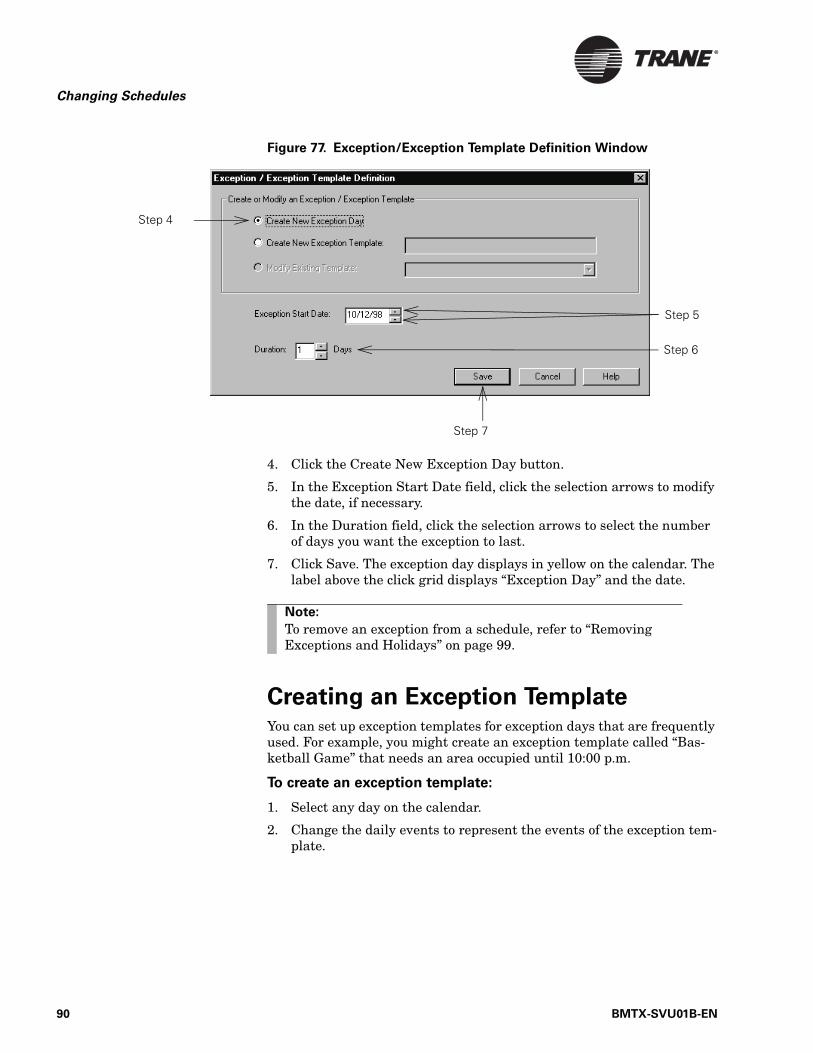
Changing Schedules
Figure 77. Exception/Exception Template Definition Window
4. Click the Create New Exception Day button.
5. In the Exception Start Date field, click the selection arrows to modify the date, if necessary.
6. In the Duration field, click the selection arrows to select the number of days you want the exception to last.
7. Click Save. The exception day displays in yellow on the calendar. The label above the click grid displays “Exception Day” and the date.
Creating an Exception TemplateYou can set up exception templates for exception days that are frequently used. For example, you might create an exception template called “Bas-ketball Game” that needs an area occupied until 10:00 p.m.
To create an exception template:
1. Select any day on the calendar.
2. Change the daily events to represent the events of the exception tem-plate.
Step 4
Step 5
Step 6
Step 7
Note:
To remove an exception from a schedule, refer to “Removing Exceptions and Holidays” on page 99.
90 BMTX-SVU01B-EN
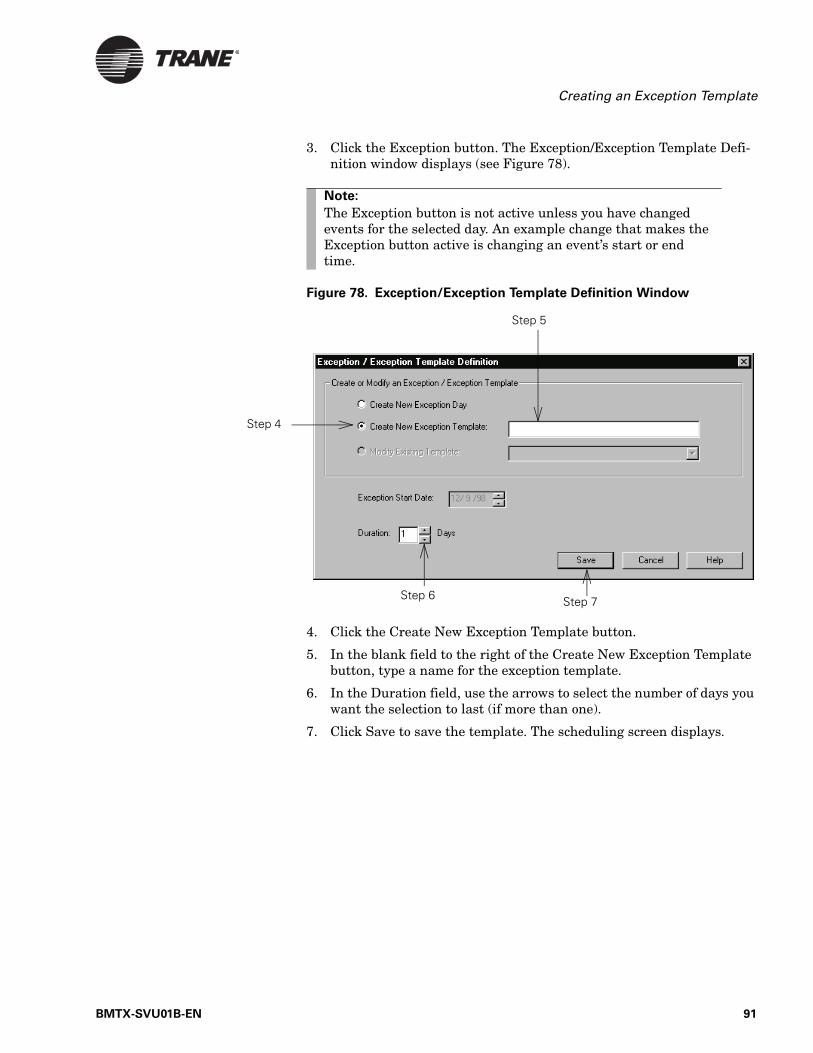
Creating an Exception Template
3. Click the Exception button. The Exception/Exception Template Defi-nition window displays (see Figure 78).
Figure 78. Exception/Exception Template Definition Window
4. Click the Create New Exception Template button.
5. In the blank field to the right of the Create New Exception Template button, type a name for the exception template.
6. In the Duration field, use the arrows to select the number of days you want the selection to last (if more than one).
7. Click Save to save the template. The scheduling screen displays.
Note:
The Exception button is not active unless you have changed events for the selected day. An example change that makes the Exception button active is changing an event’s start or end time.
Step 4
Step 5
Step 6 Step 7
BMTX-SVU01B-EN 91
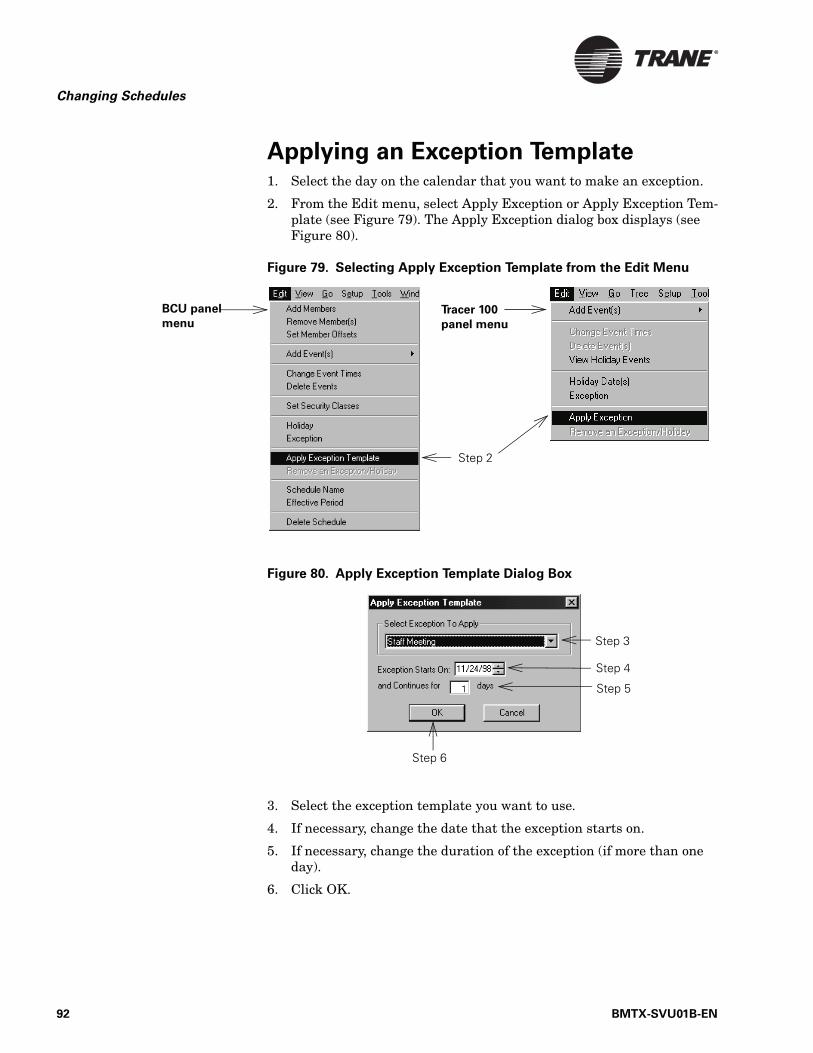
Changing Schedules
Applying an Exception Template1. Select the day on the calendar that you want to make an exception.
2. From the Edit menu, select Apply Exception or Apply Exception Tem-plate (see Figure 79). The Apply Exception dialog box displays (see Figure 80).
Figure 79. Selecting Apply Exception Template from the Edit Menu
Figure 80. Apply Exception Template Dialog Box
3. Select the exception template you want to use.
4. If necessary, change the date that the exception starts on.
5. If necessary, change the duration of the exception (if more than one day).
6. Click OK.
Step 2
BCU panel
menuTracer 100
panel menu
Step 3
Step 4
Step 5
Step 6
92 BMTX-SVU01B-EN
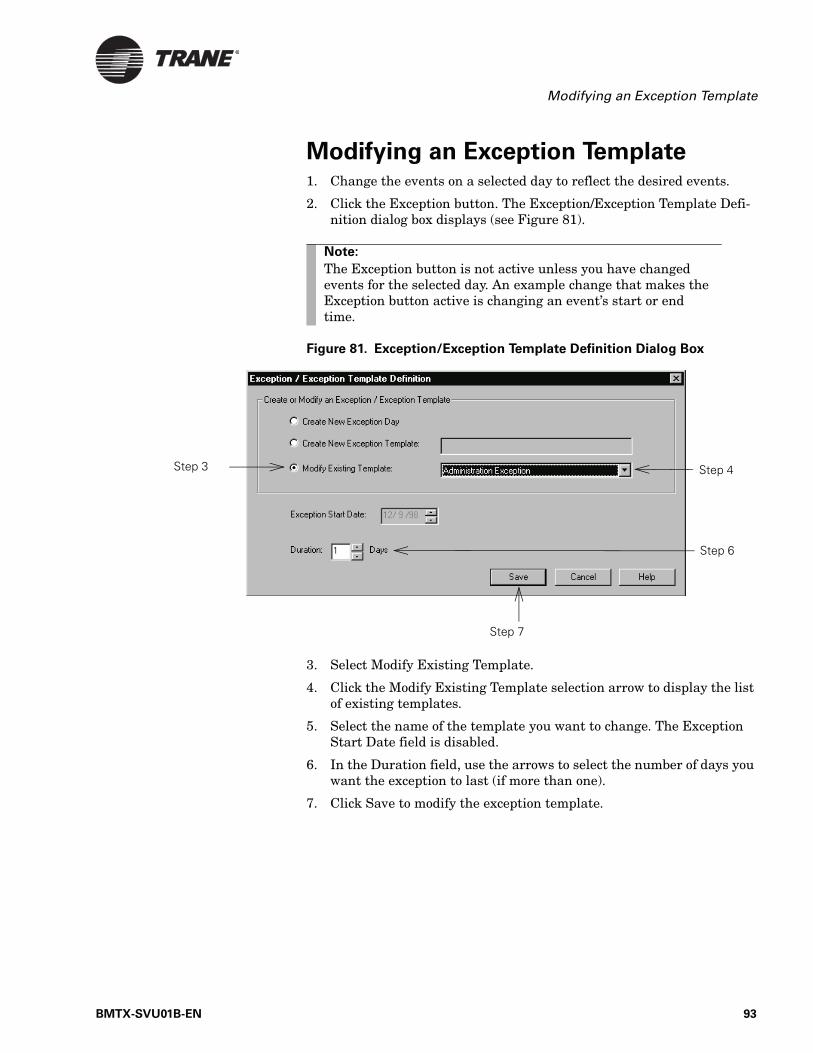
Modifying an Exception Template
Modifying an Exception Template1. Change the events on a selected day to reflect the desired events.
2. Click the Exception button. The Exception/Exception Template Defi-nition dialog box displays (see Figure 81).
Figure 81. Exception/Exception Template Definition Dialog Box
3. Select Modify Existing Template.
4. Click the Modify Existing Template selection arrow to display the list of existing templates.
5. Select the name of the template you want to change. The Exception Start Date field is disabled.
6. In the Duration field, use the arrows to select the number of days you want the exception to last (if more than one).
7. Click Save to modify the exception template.
Note:
The Exception button is not active unless you have changed events for the selected day. An example change that makes the Exception button active is changing an event’s start or end time.
Step 3 Step 4
Step 6
Step 7
BMTX-SVU01B-EN 93
Changing Schedules
Handling Holidays for BCU PanelsYou can define holidays for BCU and Tracer 100 sites. If you are using a Tracer 100 panel, see the section “Handling Holidays for Tracer 100 Pan-els” on page 98.
Apply an Existing Holiday to a Schedule
You can apply a holiday (for example, New Year’s Day) to a schedule by following the steps in this section.
To apply an existing holiday to a schedule:
1. Select the desired day on the calendar and change the daily events to represent the holiday.
2. Click the Holiday button (see Figure 82 on page 95). The Define Holi-day window displays (see Figure 83 on page 95).
3. Select the Existing Holiday button.
4. Select the desired holiday from the Existing Holiday list box.
5. Click Save. The holiday displays in blue on the calendar. The name of the holiday displays above the clock grid.
Note:
The Holiday button is not active unless you have changed events for the selected day. If you want to simply apply a holi-day and not change a day’s events, click once on an event time bar for the day, then click OK at the Change Event Times win-dow. The Holiday button becomes active.
94 BMTX-SVU01B-EN
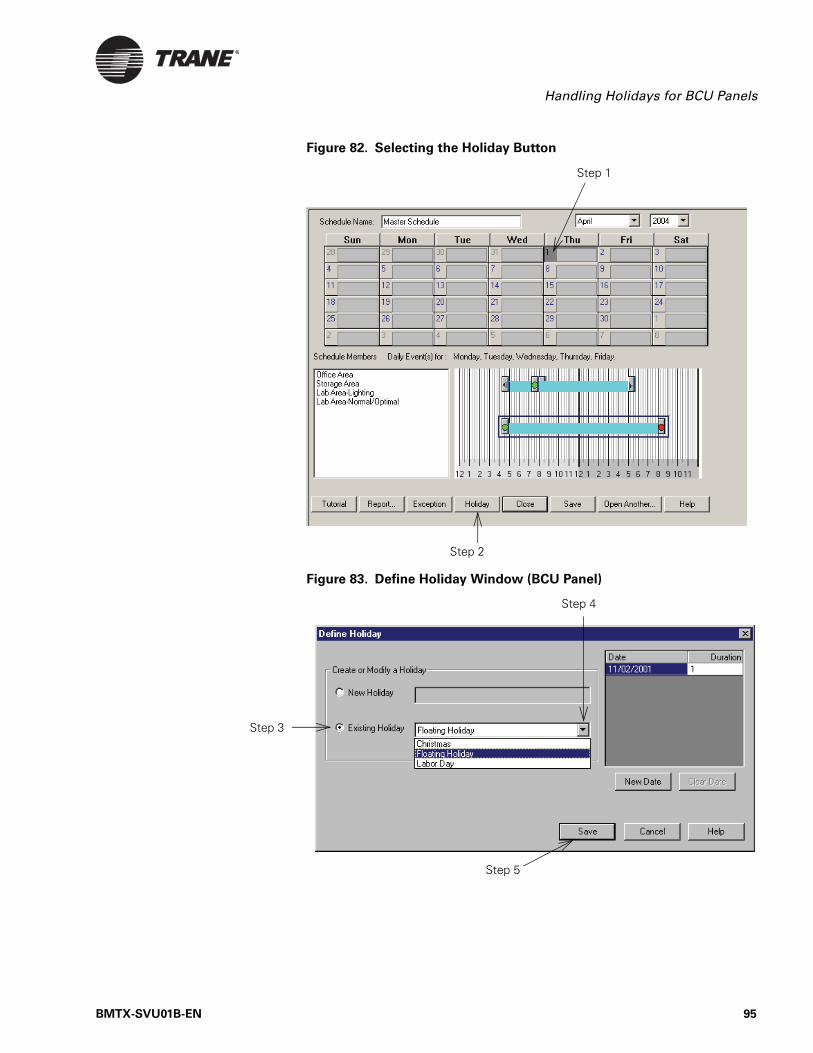
Handling Holidays for BCU Panels
Figure 82. Selecting the Holiday Button
Figure 83. Define Holiday Window (BCU Panel)
Step 1
Step 2
Step 3
Step 4
Step 5
BMTX-SVU01B-EN 95

Changing Schedules
Defining a New Holiday
You can define a new holiday that does not already exist.
To define a new holiday on a BCU panel:
1. Select the desired day on the calendar and change the daily events to represent the new holiday.
2. Click the Holiday button. The Define Holiday window displays (see Figure 84).
Figure 84. Define Holiday Window
3. Select the New Holiday button.
4. In the field to the right of the new Holiday button, type the name of the new holiday.
5. Set the start date and the duration of the holiday.
6. To add additional dates, click the New Date button and type the new date in the Start Date column. To clear a date, click the Clear Date button.
7. Click Save. The holiday displays in blue on the calendar. The name of the holiday displays above the clock grid.
Note:
The Holiday button is not active unless you have changed events for the selected day. An example change that makes the Holiday button active is changing an event’s start or end time.
Step 3
Step 4
Step 7Step 6
Step 5
Note:
If you know the date of a holiday for the next several years (for example, New Year’s Day always occurs on January 1), you can enter the dates for those years using the New Date button. In the following years you will not need to apply the holiday.
96 BMTX-SVU01B-EN
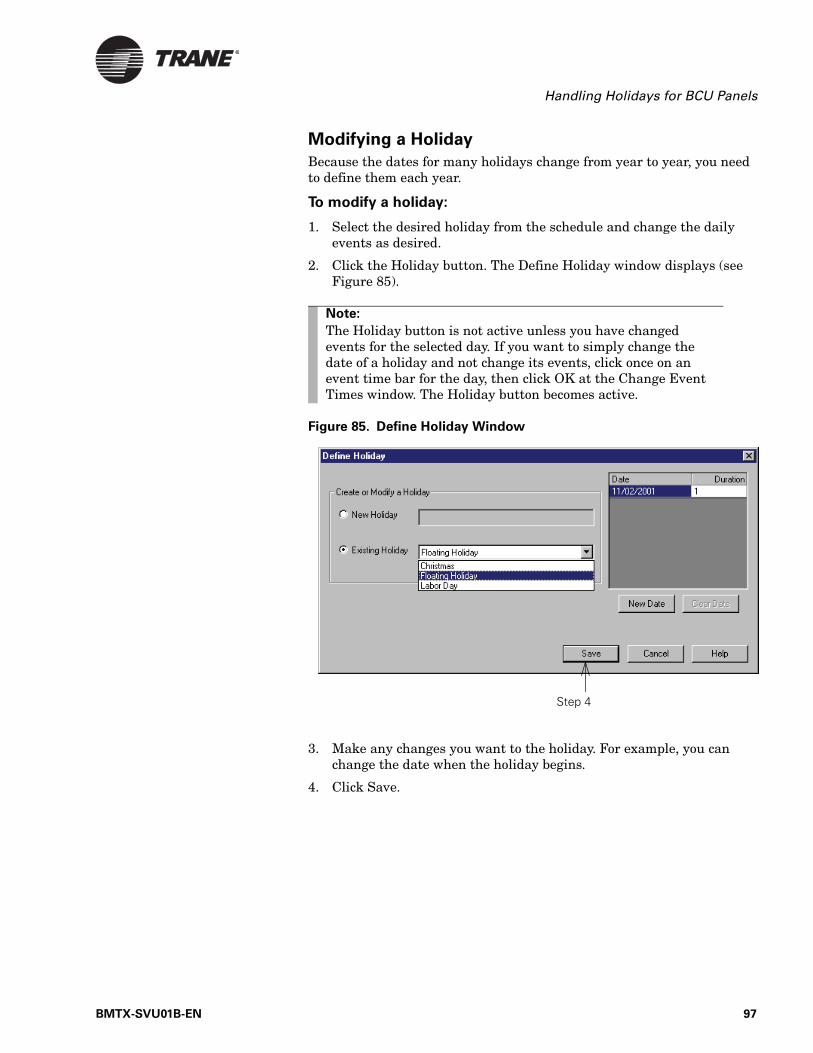
Handling Holidays for BCU Panels
Modifying a Holiday
Because the dates for many holidays change from year to year, you need to define them each year.
To modify a holiday:
1. Select the desired holiday from the schedule and change the daily events as desired.
2. Click the Holiday button. The Define Holiday window displays (see Figure 85).
Figure 85. Define Holiday Window
3. Make any changes you want to the holiday. For example, you can change the date when the holiday begins.
4. Click Save.
Note:
The Holiday button is not active unless you have changed events for the selected day. If you want to simply change the date of a holiday and not change its events, click once on an event time bar for the day, then click OK at the Change Event Times window. The Holiday button becomes active.
Step 4
BMTX-SVU01B-EN 97

Changing Schedules
Handling Holidays for Tracer 100 PanelsThe instructions in this section apply to Tracer 100 panels only.
Defining New Holiday Dates
You can define one or more dates as holidays.
To define a new date as a holiday:
1. Click the Holiday button. The Holiday Dates window displays (see Figure 86).
Figure 86. Holiday Dates Window
2. Click New Date. The date you selected on the calendar displays in the Date column.
3. Click Save.
Clearing a Holiday Date
1. Click the Holiday Dates button. The Holiday Dates window displays (see Figure 86).
2. Click the date you want removed from the list.
3. Click Clear Date. The date disappears from the list.
4. Click Save.
Note:
When you change a date, it affects all schedules in the Tracer 100 panel.
Step 2
Step 3
98 BMTX-SVU01B-EN
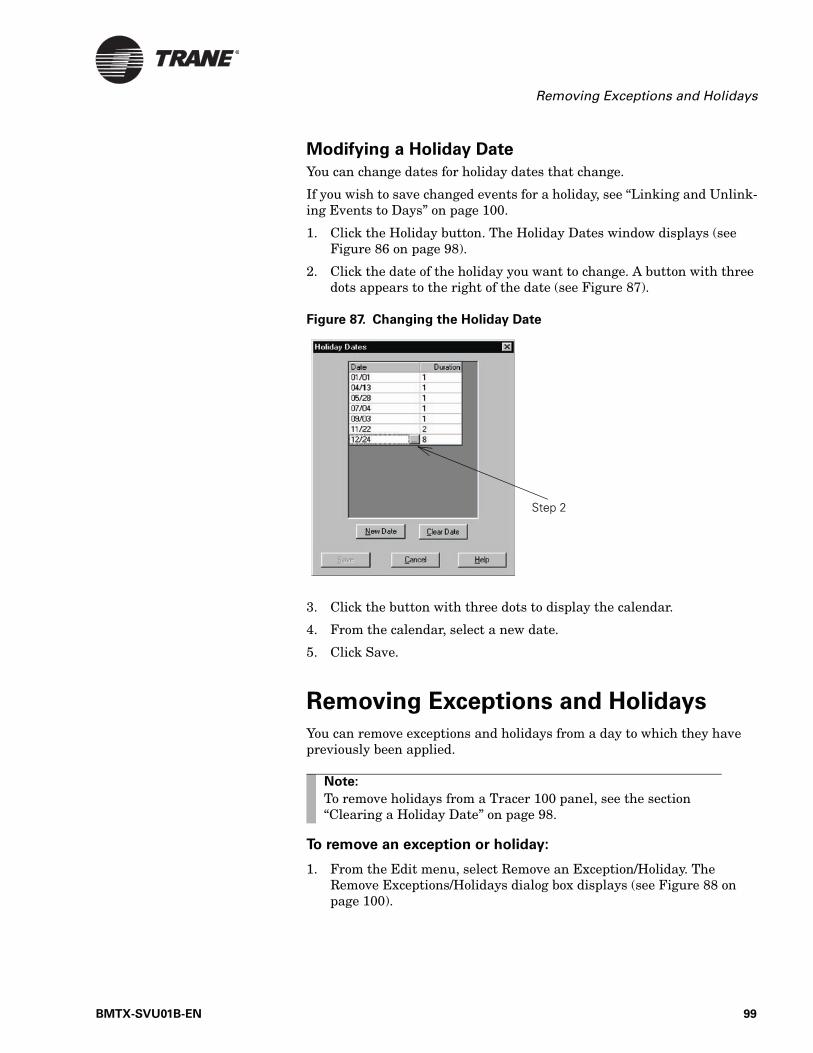
Removing Exceptions and Holidays
Modifying a Holiday Date
You can change dates for holiday dates that change.
If you wish to save changed events for a holiday, see “Linking and Unlink-ing Events to Days” on page 100.
1. Click the Holiday button. The Holiday Dates window displays (see Figure 86 on page 98).
2. Click the date of the holiday you want to change. A button with three dots appears to the right of the date (see Figure 87).
Figure 87. Changing the Holiday Date
3. Click the button with three dots to display the calendar.
4. From the calendar, select a new date.
5. Click Save.
Removing Exceptions and Holidays
You can remove exceptions and holidays from a day to which they have previously been applied.
To remove an exception or holiday:
1. From the Edit menu, select Remove an Exception/Holiday. The Remove Exceptions/Holidays dialog box displays (see Figure 88 on page 100).
Step 2
Note:
To remove holidays from a Tracer 100 panel, see the section “Clearing a Holiday Date” on page 98.
BMTX-SVU01B-EN 99
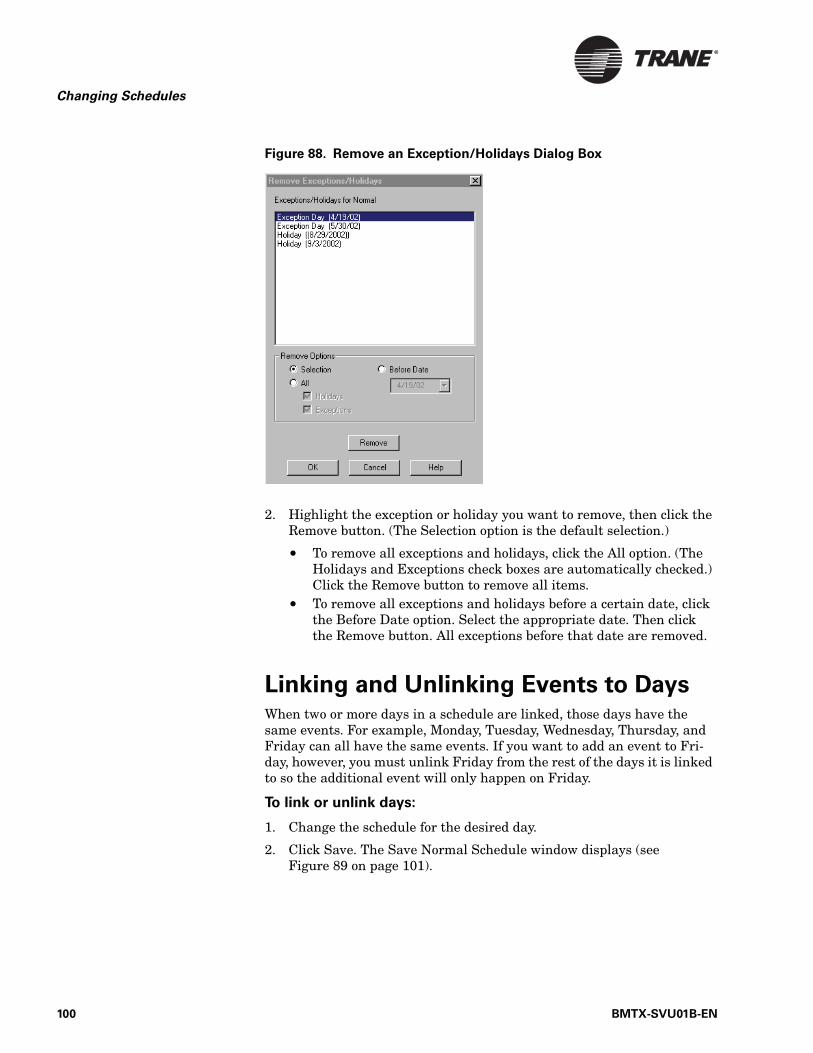
Changing Schedules
Figure 88. Remove an Exception/Holidays Dialog Box
2. Highlight the exception or holiday you want to remove, then click the Remove button. (The Selection option is the default selection.)
• To remove all exceptions and holidays, click the All option. (The Holidays and Exceptions check boxes are automatically checked.) Click the Remove button to remove all items.
• To remove all exceptions and holidays before a certain date, click the Before Date option. Select the appropriate date. Then click the Remove button. All exceptions before that date are removed.
Linking and Unlinking Events to DaysWhen two or more days in a schedule are linked, those days have the same events. For example, Monday, Tuesday, Wednesday, Thursday, and Friday can all have the same events. If you want to add an event to Fri-day, however, you must unlink Friday from the rest of the days it is linked to so the additional event will only happen on Friday.
To link or unlink days:
1. Change the schedule for the desired day.
2. Click Save. The Save Normal Schedule window displays (see Figure 89 on page 101).
100 BMTX-SVU01B-EN
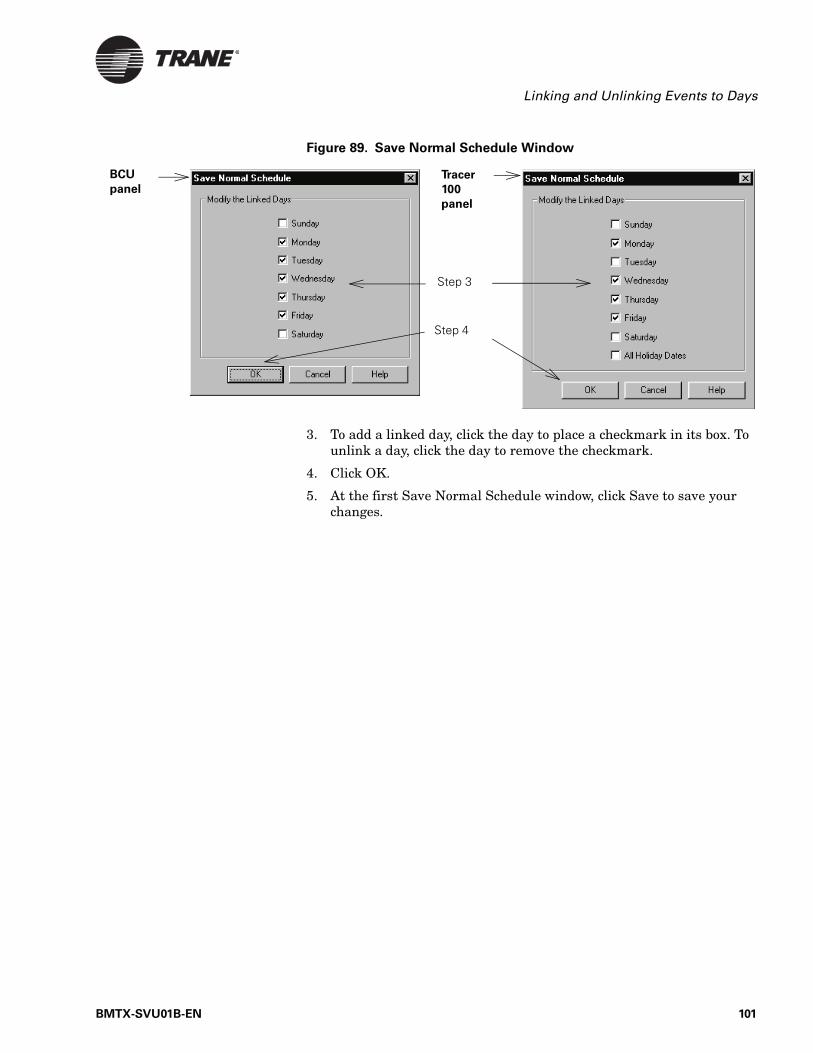
Linking and Unlinking Events to Days
Figure 89. Save Normal Schedule Window
3. To add a linked day, click the day to place a checkmark in its box. To unlink a day, click the day to remove the checkmark.
4. Click OK.
5. At the first Save Normal Schedule window, click Save to save your changes.
Step 4
BCU
panel
Step 3
Tracer
100
panel
BMTX-SVU01B-EN 101
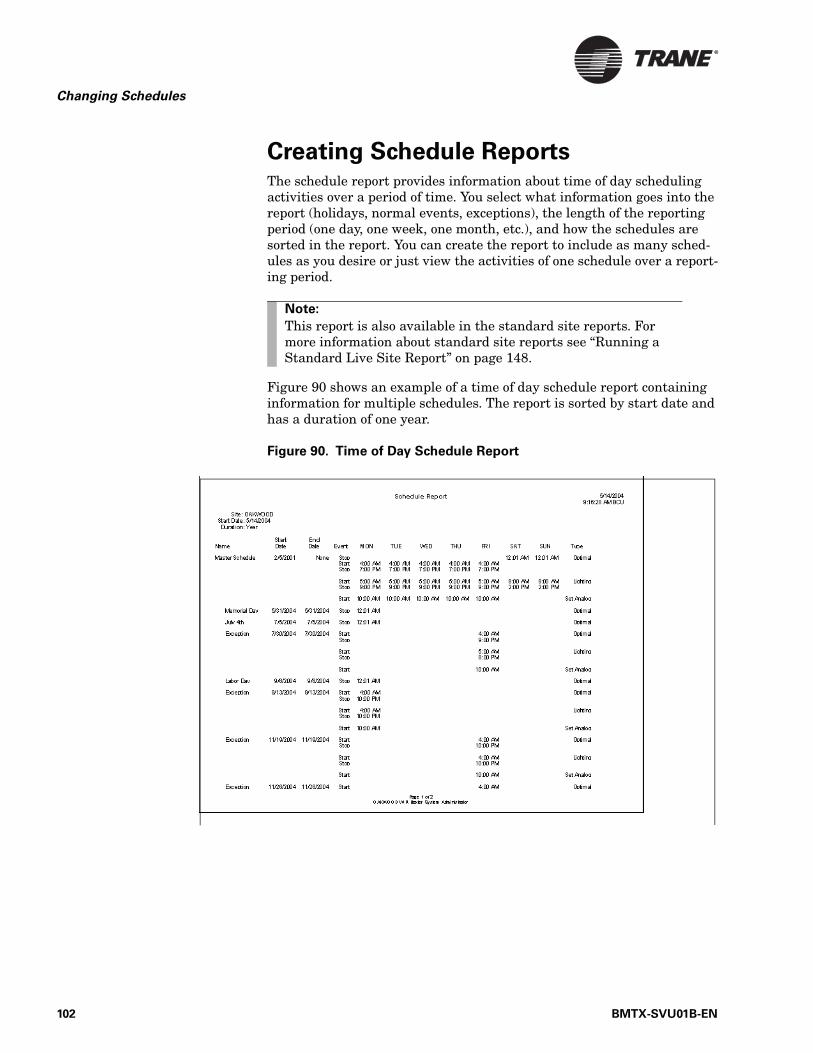
Changing Schedules
Creating Schedule ReportsThe schedule report provides information about time of day scheduling activities over a period of time. You select what information goes into the report (holidays, normal events, exceptions), the length of the reporting period (one day, one week, one month, etc.), and how the schedules are sorted in the report. You can create the report to include as many sched-ules as you desire or just view the activities of one schedule over a report-ing period.
Figure 90 shows an example of a time of day schedule report containing information for multiple schedules. The report is sorted by start date and has a duration of one year.
Figure 90. Time of Day Schedule Report
Note:
This report is also available in the standard site reports. For more information about standard site reports see “Running a Standard Live Site Report” on page 148.
102 BMTX-SVU01B-EN
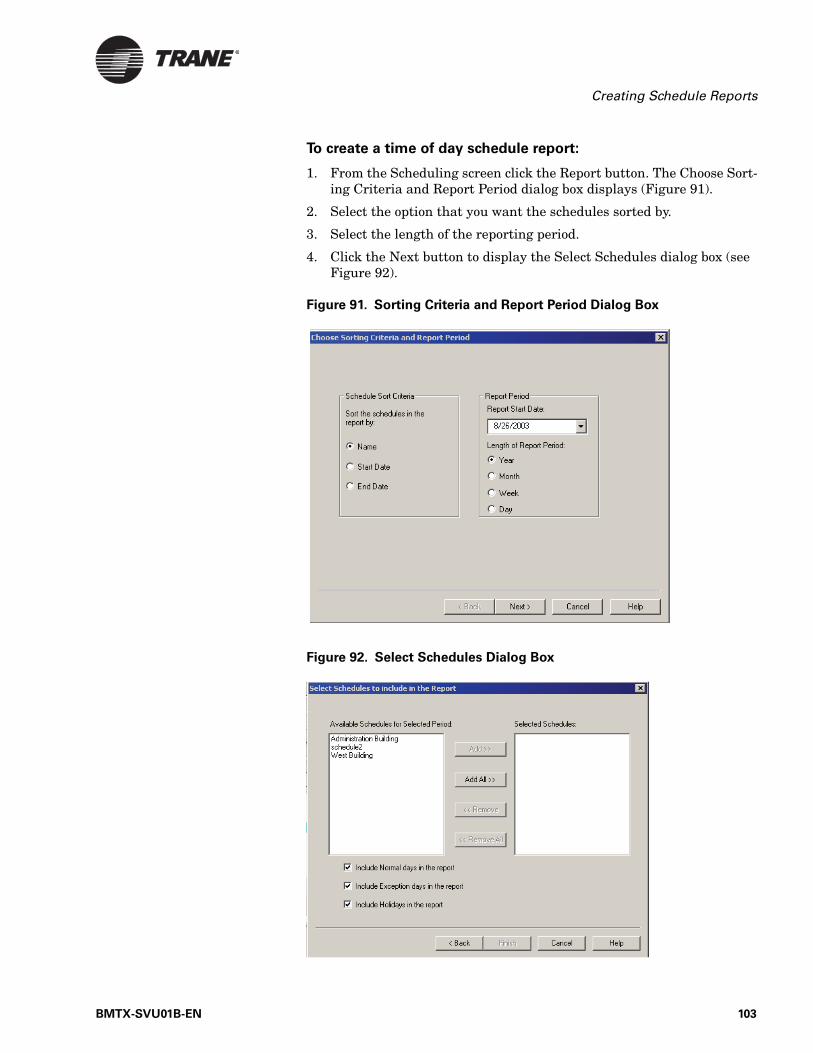
Creating Schedule Reports
To create a time of day schedule report:
1. From the Scheduling screen click the Report button. The Choose Sort-ing Criteria and Report Period dialog box displays (Figure 91).
2. Select the option that you want the schedules sorted by.
3. Select the length of the reporting period.
4. Click the Next button to display the Select Schedules dialog box (see Figure 92).
Figure 91. Sorting Criteria and Report Period Dialog Box
Figure 92. Select Schedules Dialog Box
BMTX-SVU01B-EN 103
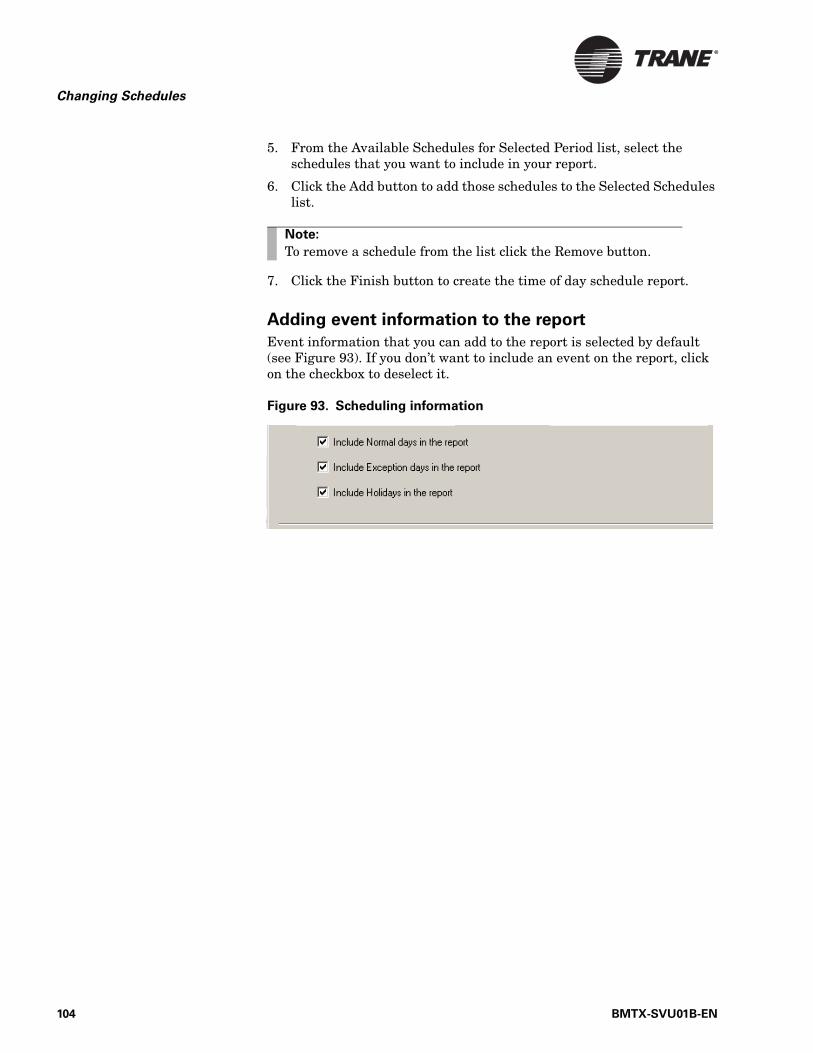
Changing Schedules
5. From the Available Schedules for Selected Period list, select the schedules that you want to include in your report.
6. Click the Add button to add those schedules to the Selected Schedules list.
7. Click the Finish button to create the time of day schedule report.
Adding event information to the report
Event information that you can add to the report is selected by default (see Figure 93). If you don’t want to include an event on the report, click on the checkbox to deselect it.
Figure 93. Scheduling information
Note:
To remove a schedule from the list click the Remove button.
104 BMTX-SVU01B-EN
Chapter 9
Handling Alarms and Events
The event log displays a report of all alarms, events, and error messages received at your workstation.
• Alarms are events with categorys assigned to them. Alarms notify you when heating, ventilation, or air conditioning (HVAC) equipment is not operating correctly. You can configure a Category Alarm Pop-up dialog box to display when an alarm goes off (see “When an alarm or event occurs and Tracer Summit is minimized (it is open but not dis-played on the screen), the alarm or event is added to the event log. If it is a high priority alarm, an audio alarm sounds and the Tracer Summit button flashes at the bottom of the screen (see Figure 95). To display Tracer Summit when it is minimized, click the Tracer Summit button.” on page 107).
• Events notify you when an action that you need to keep track of occurs. An example of an event is when an operator logs on to Tracer Summit.
• Error messages pertaining to site scans and global changes display in the error log.
The event log lists alarms and events in the order they occur in Tracer Summit, with the most recent alarms and events displaying at the top of the event log. You can move through these alarms and events by using the scroll bars on the right side of the event log or by pressing the Page Up and Page Down keys.
Note:
You may not have access to all of the tasks presented in this guide. Your access privileges depend on your user profile. Con-tact your supervisor for information.
BMTX-SVU01B-EN 105

Handling Alarms and Events
When an alarm or event occurs and Tracer Summit is displayed on the screen, the alarm or event is added to the event log and displays on the event log. In addition, high priority alarms sound an alarm and flash a red box in the lower right corner of the Tracer Summit window (see Figure 94). After you acknowledge the alarm, the red box stops flashing.
Figure 94. Alarm Indicator when Tracer Summit is Displayed on Screen
Red box flashes when an alarm or event occurs
106 BMTX-SVU01B-EN
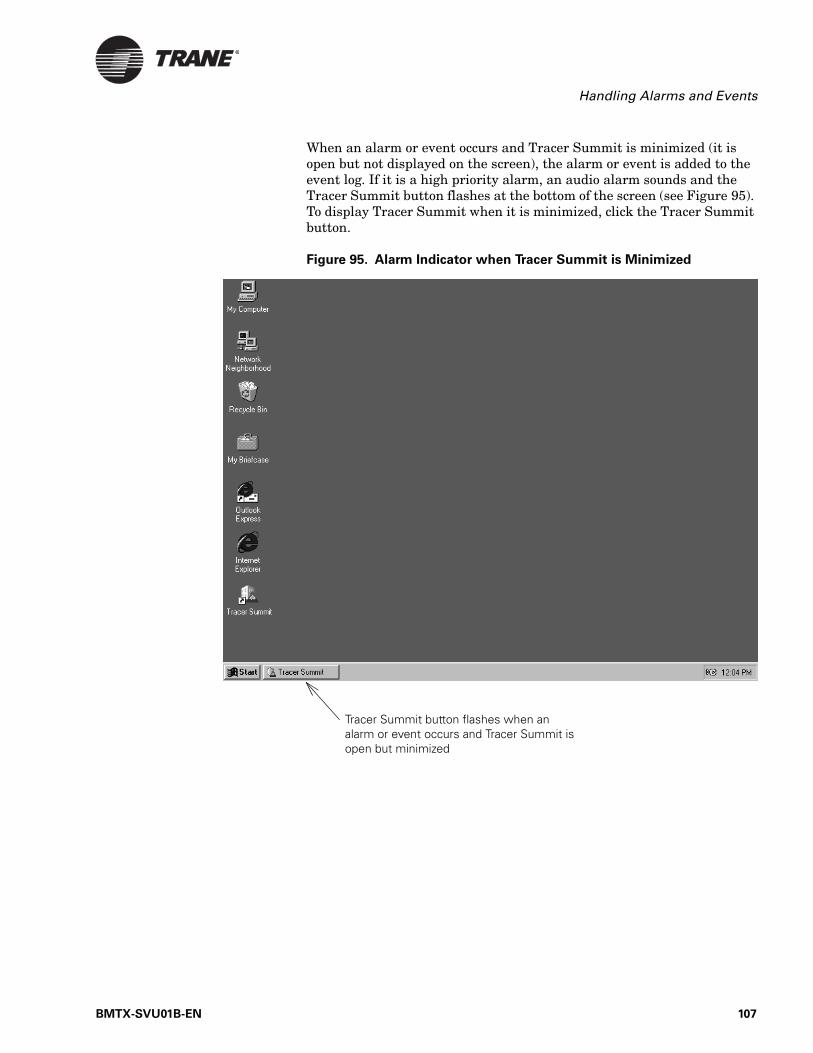
Handling Alarms and Events
When an alarm or event occurs and Tracer Summit is minimized (it is open but not displayed on the screen), the alarm or event is added to the event log. If it is a high priority alarm, an audio alarm sounds and the Tracer Summit button flashes at the bottom of the screen (see Figure 95). To display Tracer Summit when it is minimized, click the Tracer Summit button.
Figure 95. Alarm Indicator when Tracer Summit is Minimized
Tracer Summit button flashes when an alarm or event occurs and Tracer Summit is open but minimized
BMTX-SVU01B-EN 107

Handling Alarms and Events
Displaying the Event LogYou should view the event log to:
• Check the status of your site• Respond to an alarm• Check error messages
To display the event log:
1. Click the Alarms button on the task bar (see Figure 96).
2. View the event log from the Event Log tab or:
• Click the BCU Event Log tab to view alarms of the local event log.• Click the Error Log tab to view errors generated by the worksta-
tion.Periodically refresh the event log to display current alarm and event information. See “Refreshing the Event Log” on page 122 for instructions.
Figure 96. Displaying the Event Log
Click to display the event log
108 BMTX-SVU01B-EN
Understanding the Event Log
Understanding the Event Log The event log consists of three tabs: Event Log, BCU Event Log, and Error Log (see Figure 96 on page 108). The function of each tab is described in the following sections.
Viewing the Event Log Tab
When you open the event log, the Event Log tab is active by default (see Figure 96 on page 108). The event log screen lists all of the alarms and events received by your workstation. You can resize or hide columns in the event log.
If your workstation is set up as an event receiver, the event log screen dis-plays the 100 most recent alarms and events in the BCU database (an event receiver can be a workstation or a cell phone pager). The new alarms are displayed in addition to the alarms already present in the database.
When there is more than one event receiver set up at your BCU site, the alarms are divided up among the event receivers in equal portions.
If your Tracer Summit version supports T100 or Tracker communica-tions, alarms from Tracer 100 or Tracker sites also display here.
The parts of the event log screen are described in Figure 97 on page 110 and Table 6 on page 110.
BMTX-SVU01B-EN 109
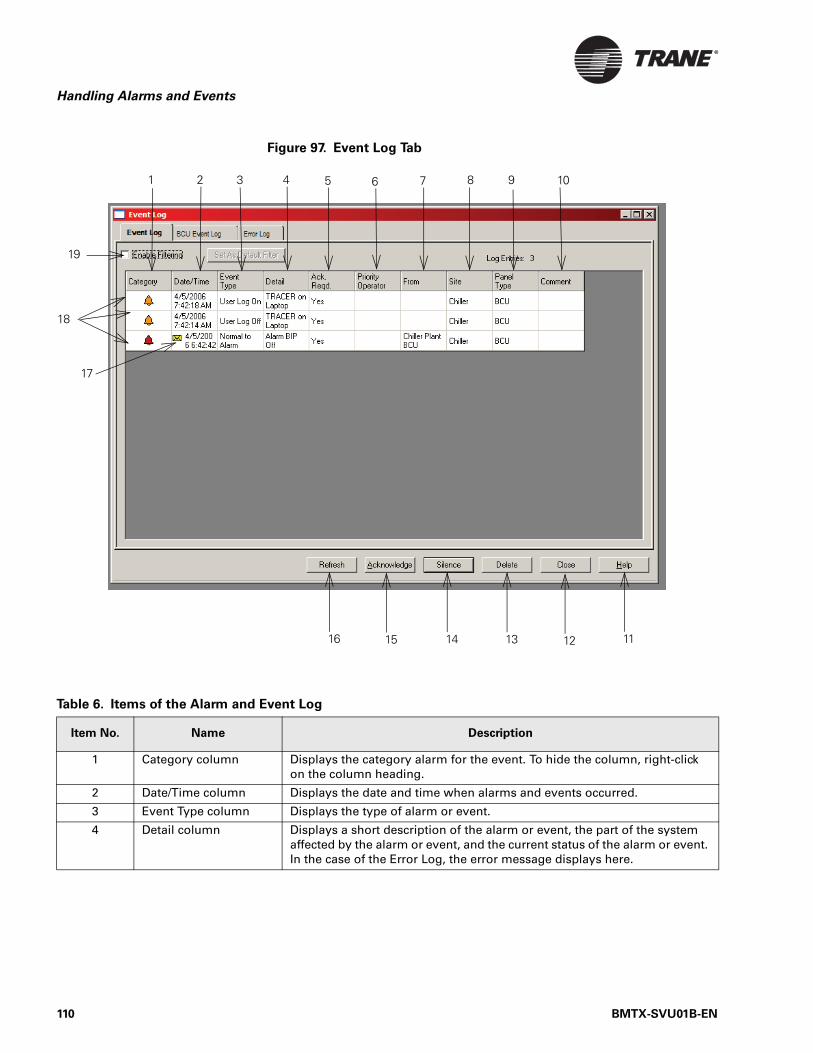
Handling Alarms and Events
Figure 97. Event Log Tab
Table 6. Items of the Alarm and Event Log
Item No. Name Description
1 Category column Displays the category alarm for the event. To hide the column, right-click on the column heading.
2 Date/Time column Displays the date and time when alarms and events occurred.
3 Event Type column Displays the type of alarm or event.
4 Detail column Displays a short description of the alarm or event, the part of the system affected by the alarm or event, and the current status of the alarm or event. In the case of the Error Log, the error message displays here.
18
17
19
2 3 4 5 6 7 8
111213141516
9 101
110 BMTX-SVU01B-EN
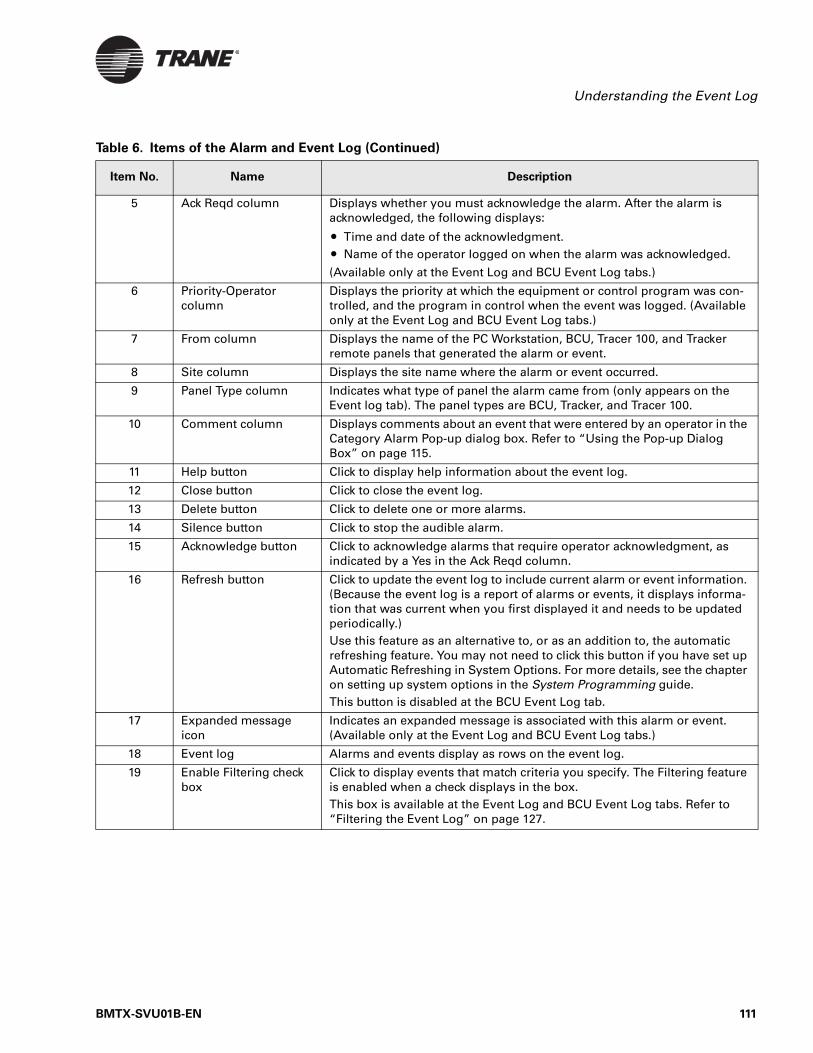
Understanding the Event Log
5 Ack Reqd column Displays whether you must acknowledge the alarm. After the alarm is acknowledged, the following displays:
• Time and date of the acknowledgment.• Name of the operator logged on when the alarm was acknowledged.
(Available only at the Event Log and BCU Event Log tabs.)
6 Priority-Operator column
Displays the priority at which the equipment or control program was con-trolled, and the program in control when the event was logged. (Available only at the Event Log and BCU Event Log tabs.)
7 From column Displays the name of the PC Workstation, BCU, Tracer 100, and Tracker remote panels that generated the alarm or event.
8 Site column Displays the site name where the alarm or event occurred.
9 Panel Type column Indicates what type of panel the alarm came from (only appears on the Event log tab). The panel types are BCU, Tracker, and Tracer 100.
10 Comment column Displays comments about an event that were entered by an operator in the Category Alarm Pop-up dialog box. Refer to “Using the Pop-up Dialog Box” on page 115.
11 Help button Click to display help information about the event log.
12 Close button Click to close the event log.
13 Delete button Click to delete one or more alarms.
14 Silence button Click to stop the audible alarm.
15 Acknowledge button Click to acknowledge alarms that require operator acknowledgment, as indicated by a Yes in the Ack Reqd column.
16 Refresh button Click to update the event log to include current alarm or event information. (Because the event log is a report of alarms or events, it displays informa-tion that was current when you first displayed it and needs to be updated periodically.)Use this feature as an alternative to, or as an addition to, the automatic refreshing feature. You may not need to click this button if you have set up Automatic Refreshing in System Options. For more details, see the chapter on setting up system options in the System Programming guide.This button is disabled at the BCU Event Log tab.
17 Expanded message icon
Indicates an expanded message is associated with this alarm or event. (Available only at the Event Log and BCU Event Log tabs.)
18 Event log Alarms and events display as rows on the event log.
19 Enable Filtering check box
Click to display events that match criteria you specify. The Filtering feature is enabled when a check displays in the box.This box is available at the Event Log and BCU Event Log tabs. Refer to “Filtering the Event Log” on page 127.
Table 6. Items of the Alarm and Event Log (Continued)
Item No. Name Description
BMTX-SVU01B-EN 111
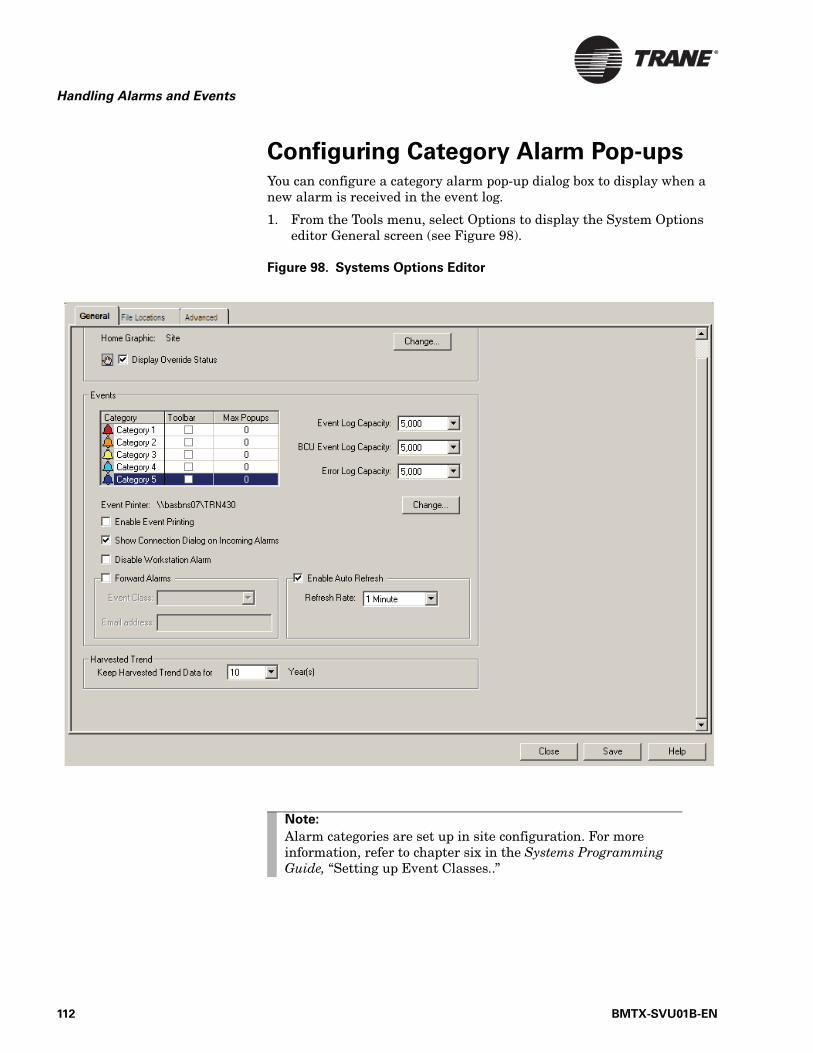
Handling Alarms and Events
Configuring Category Alarm Pop-upsYou can configure a category alarm pop-up dialog box to display when a new alarm is received in the event log.
1. From the Tools menu, select Options to display the System Options editor General screen (see Figure 98).
Figure 98. Systems Options Editor
Note:
Alarm categories are set up in site configuration. For more information, refer to chapter six in the Systems Programming Guide, “Setting up Event Classes..”
112 BMTX-SVU01B-EN
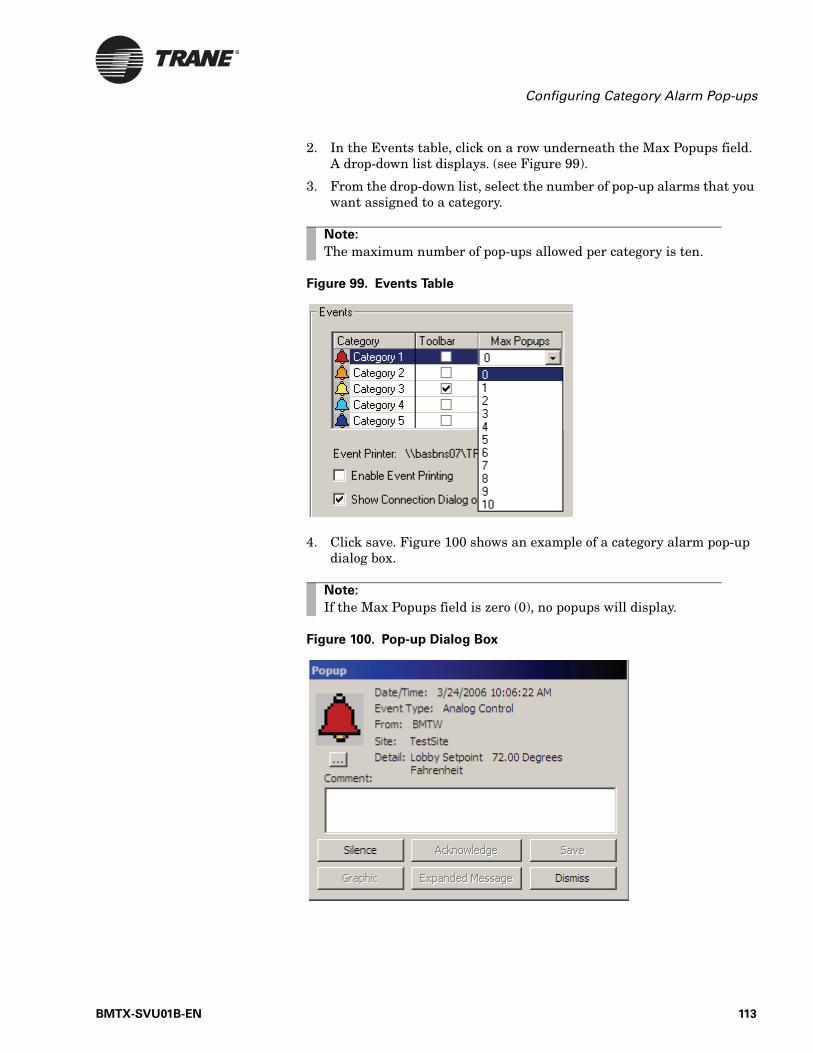
Configuring Category Alarm Pop-ups
2. In the Events table, click on a row underneath the Max Popups field. A drop-down list displays. (see Figure 99).
3. From the drop-down list, select the number of pop-up alarms that you want assigned to a category.
Figure 99. Events Table
4. Click save. Figure 100 shows an example of a category alarm pop-up dialog box.
Figure 100. Pop-up Dialog Box
Note:
The maximum number of pop-ups allowed per category is ten.
Note:
If the Max Popups field is zero (0), no popups will display.
BMTX-SVU01B-EN 113

Handling Alarms and Events
Temporarily Disabling a Category Alarm Pop-up
There may be periods when you will want to temporarily disable category alarm pop-ups from displaying on your screen. For example, in the event that your system goes down and then comes up again, all category alarm pop-ups that occured during the down-time will display simultaneously.
1. With the Event Log open, click Alarm from the menu bar.
2. Click Popups from the Alarm list. The Snooze Dialog box displays (see Figure 101).
Figure 101. Snooze Dialog Box
3. Click Dismiss All Popups.
4. Click Appy. All category alarm pop-ups that are currently displaying on your screen will be dismissed.
To view category alarm pop-ups at a later time:
1. From the drop-down list in the Snooze area, select a pre-set time.
2. Click Apply. All current category alarm pop-ups will display at the selected time.
114 BMTX-SVU01B-EN
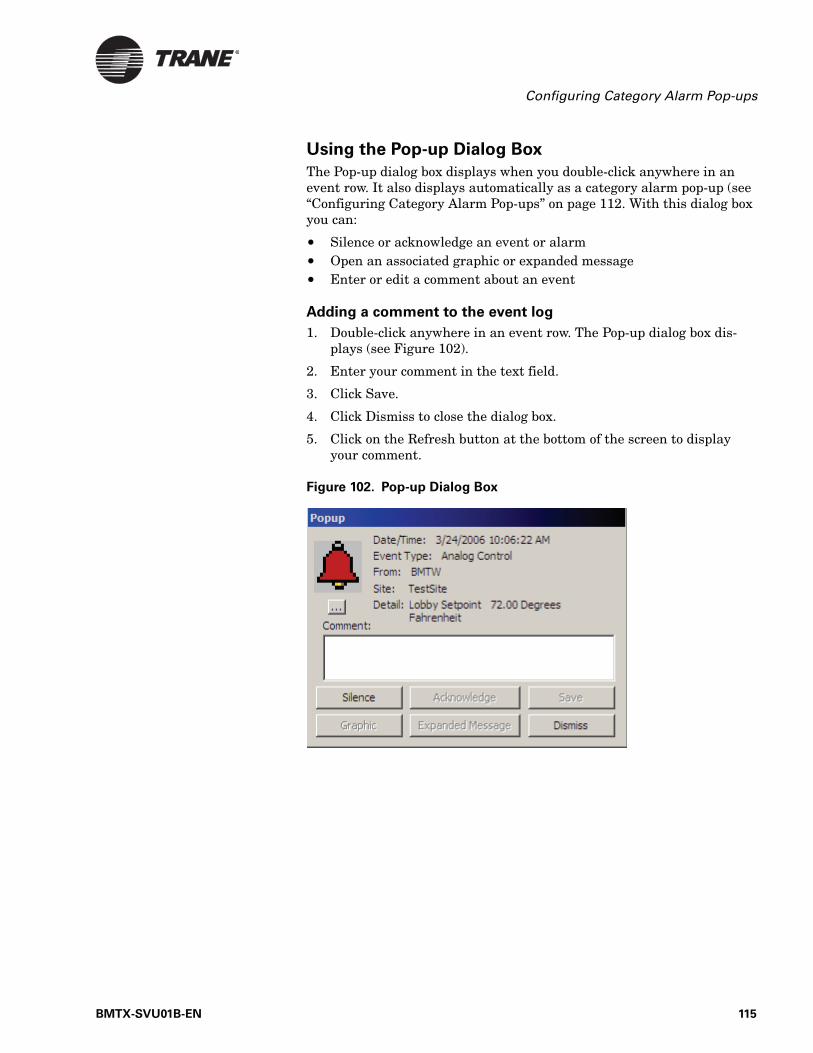
Configuring Category Alarm Pop-ups
Using the Pop-up Dialog Box
The Pop-up dialog box displays when you double-click anywhere in an event row. It also displays automatically as a category alarm pop-up (see “Configuring Category Alarm Pop-ups” on page 112. With this dialog box you can:
• Silence or acknowledge an event or alarm• Open an associated graphic or expanded message• Enter or edit a comment about an event
Adding a comment to the event log
1. Double-click anywhere in an event row. The Pop-up dialog box dis-plays (see Figure 102).
2. Enter your comment in the text field.
3. Click Save.
4. Click Dismiss to close the dialog box.
5. Click on the Refresh button at the bottom of the screen to display your comment.
Figure 102. Pop-up Dialog Box
BMTX-SVU01B-EN 115
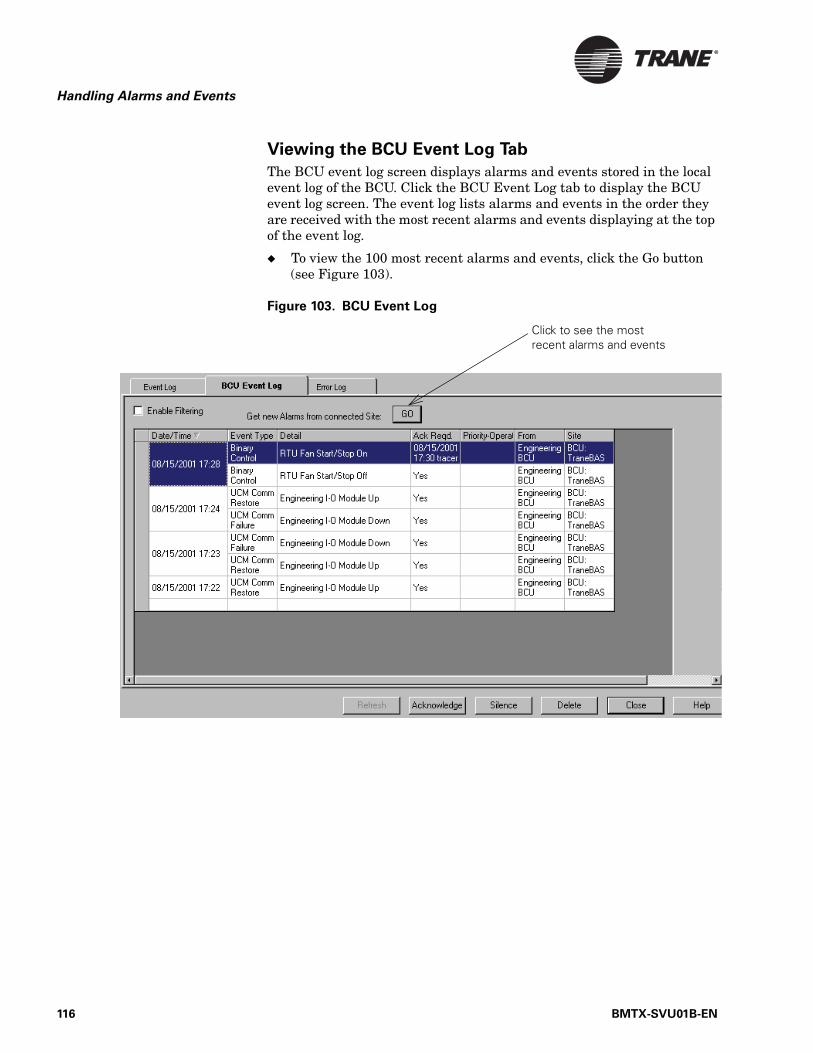
Handling Alarms and Events
Viewing the BCU Event Log Tab
The BCU event log screen displays alarms and events stored in the local event log of the BCU. Click the BCU Event Log tab to display the BCU event log screen. The event log lists alarms and events in the order they are received with the most recent alarms and events displaying at the top of the event log.
◆ To view the 100 most recent alarms and events, click the Go button (see Figure 103).
Figure 103. BCU Event Log
Click to see the most recent alarms and events
116 BMTX-SVU01B-EN

Configuring Category Alarm Pop-ups
Viewing the Error Log
The error log stores messages regarding global changes, scan tasks and database errors. Click the Error Log tab to display the error log screen (see Figure 104). When this tab is selected, you can delete errors and refresh the error log grid.
To refresh the error log:
◆ Click the Refresh button.
To delete error messages:
1. Highlight the line that you want to delete.
2. Click the Delete button.
Figure 104. Error Log Tab
BMTX-SVU01B-EN 117
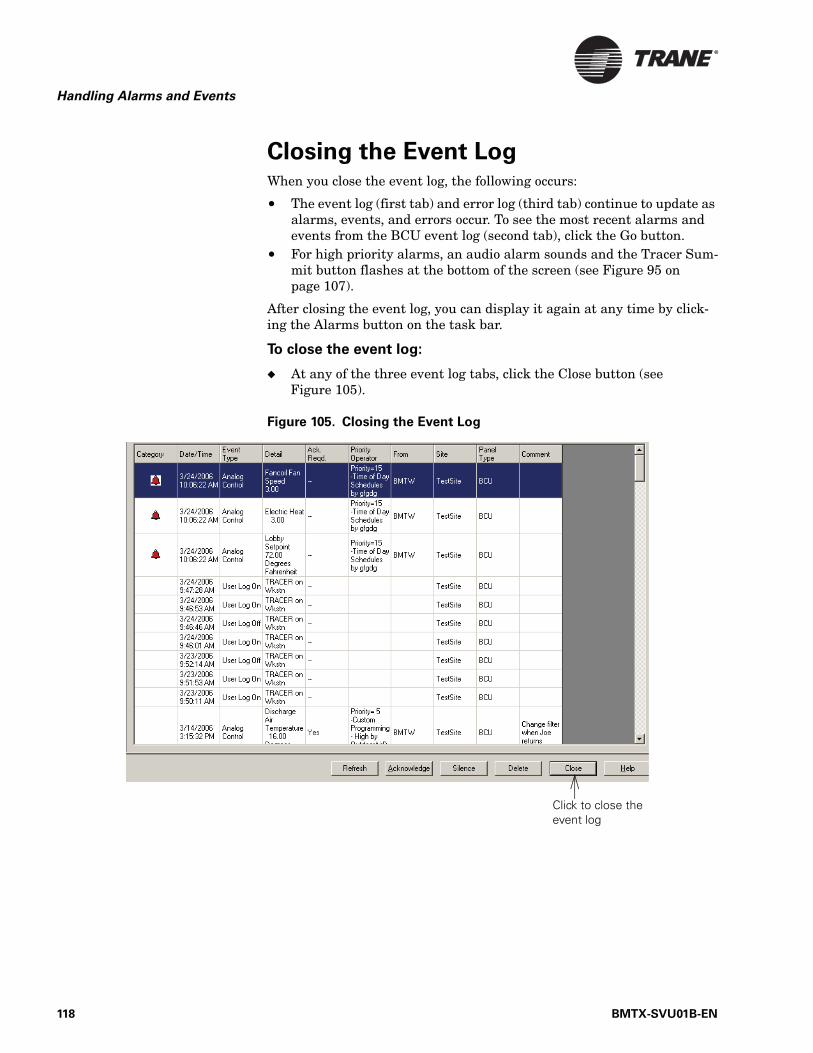
Handling Alarms and Events
Closing the Event LogWhen you close the event log, the following occurs:
• The event log (first tab) and error log (third tab) continue to update as alarms, events, and errors occur. To see the most recent alarms and events from the BCU event log (second tab), click the Go button.
• For high priority alarms, an audio alarm sounds and the Tracer Sum-mit button flashes at the bottom of the screen (see Figure 95 on page 107).
After closing the event log, you can display it again at any time by click-ing the Alarms button on the task bar.
To close the event log:
◆ At any of the three event log tabs, click the Close button (see Figure 105).
Figure 105. Closing the Event Log
Click to close the event log
118 BMTX-SVU01B-EN
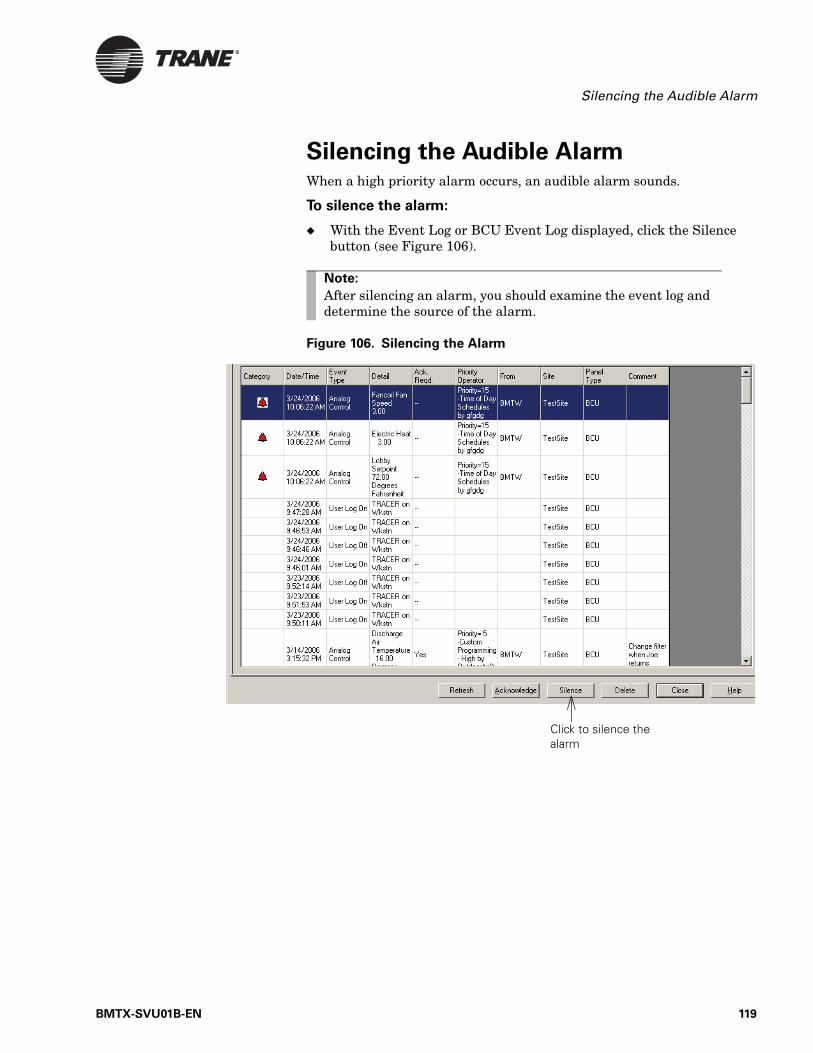
Silencing the Audible Alarm
Silencing the Audible AlarmWhen a high priority alarm occurs, an audible alarm sounds.
To silence the alarm:
◆ With the Event Log or BCU Event Log displayed, click the Silence button (see Figure 106).
Figure 106. Silencing the Alarm
Note:
After silencing an alarm, you should examine the event log and determine the source of the alarm.
Click to silence the alarm
BMTX-SVU01B-EN 119
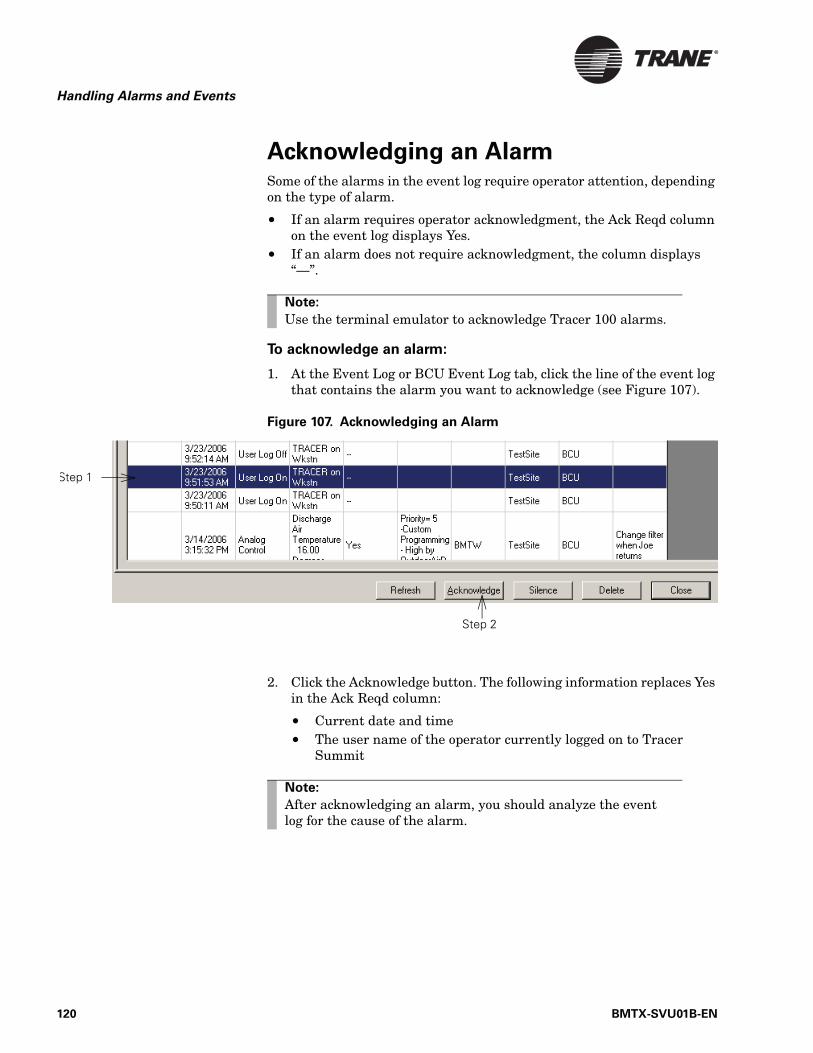
Handling Alarms and Events
Acknowledging an AlarmSome of the alarms in the event log require operator attention, depending on the type of alarm.
• If an alarm requires operator acknowledgment, the Ack Reqd column on the event log displays Yes.
• If an alarm does not require acknowledgment, the column displays “—”.
To acknowledge an alarm:
1. At the Event Log or BCU Event Log tab, click the line of the event log that contains the alarm you want to acknowledge (see Figure 107).
Figure 107. Acknowledging an Alarm
2. Click the Acknowledge button. The following information replaces Yes in the Ack Reqd column:
• Current date and time• The user name of the operator currently logged on to Tracer
Summit
Note:
Use the terminal emulator to acknowledge Tracer 100 alarms.
Step 1
Step 2
Note:
After acknowledging an alarm, you should analyze the event log for the cause of the alarm.
120 BMTX-SVU01B-EN
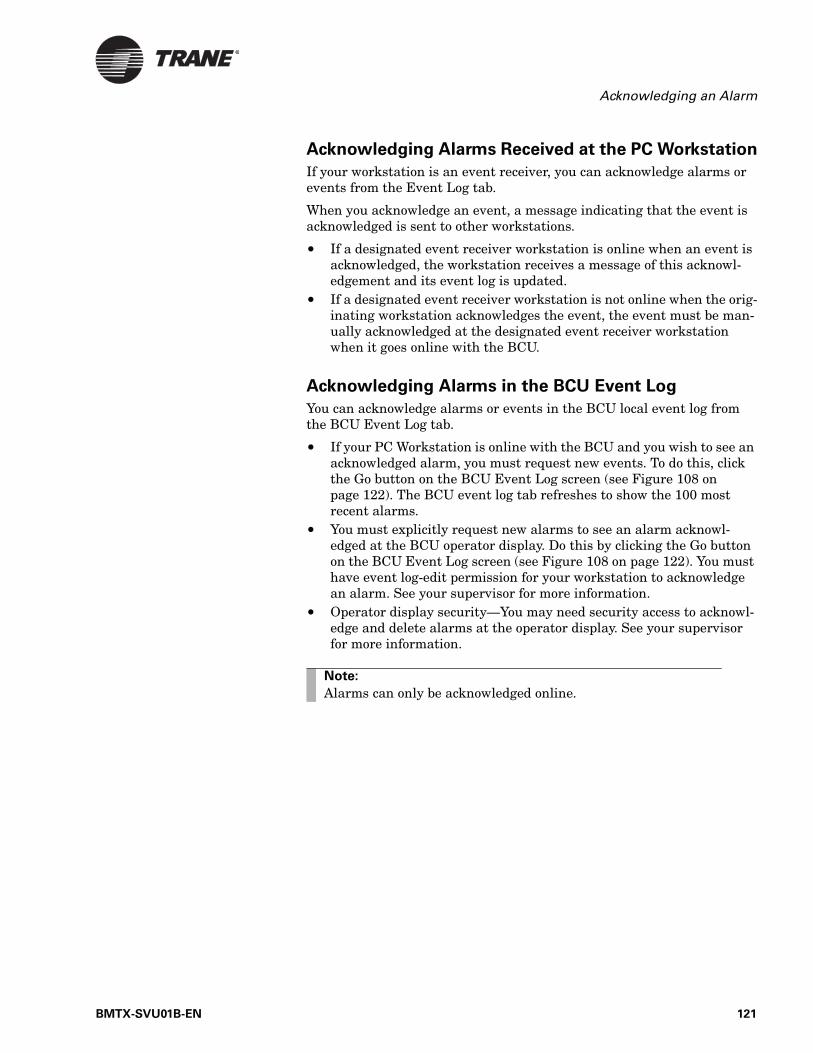
Acknowledging an Alarm
Acknowledging Alarms Received at the PC Workstation
If your workstation is an event receiver, you can acknowledge alarms or events from the Event Log tab.
When you acknowledge an event, a message indicating that the event is acknowledged is sent to other workstations.
• If a designated event receiver workstation is online when an event is acknowledged, the workstation receives a message of this acknowl-edgement and its event log is updated.
• If a designated event receiver workstation is not online when the orig-inating workstation acknowledges the event, the event must be man-ually acknowledged at the designated event receiver workstation when it goes online with the BCU.
Acknowledging Alarms in the BCU Event Log
You can acknowledge alarms or events in the BCU local event log from the BCU Event Log tab.
• If your PC Workstation is online with the BCU and you wish to see an acknowledged alarm, you must request new events. To do this, click the Go button on the BCU Event Log screen (see Figure 108 on page 122). The BCU event log tab refreshes to show the 100 most recent alarms.
• You must explicitly request new alarms to see an alarm acknowl-edged at the BCU operator display. Do this by clicking the Go button on the BCU Event Log screen (see Figure 108 on page 122). You must have event log-edit permission for your workstation to acknowledge an alarm. See your supervisor for more information.
• Operator display security—You may need security access to acknowl-edge and delete alarms at the operator display. See your supervisor for more information.
Note:
Alarms can only be acknowledged online.
BMTX-SVU01B-EN 121
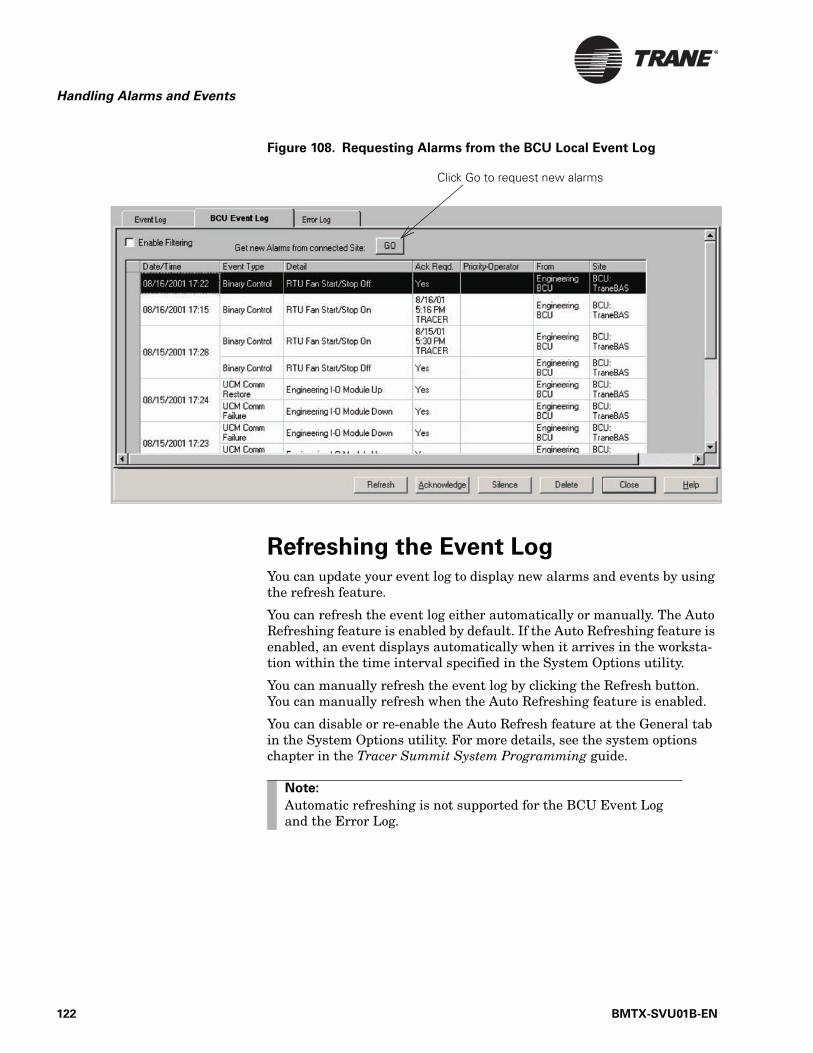
Handling Alarms and Events
Figure 108. Requesting Alarms from the BCU Local Event Log
Refreshing the Event LogYou can update your event log to display new alarms and events by using the refresh feature.
You can refresh the event log either automatically or manually. The Auto Refreshing feature is enabled by default. If the Auto Refreshing feature is enabled, an event displays automatically when it arrives in the worksta-tion within the time interval specified in the System Options utility.
You can manually refresh the event log by clicking the Refresh button. You can manually refresh when the Auto Refreshing feature is enabled.
You can disable or re-enable the Auto Refresh feature at the General tab in the System Options utility. For more details, see the system options chapter in the Tracer Summit System Programming guide.
Click Go to request new alarms
Note:
Automatic refreshing is not supported for the BCU Event Log and the Error Log.
122 BMTX-SVU01B-EN

Refreshing the Event Log
To manually refresh the event log at the Event Log or Error Log
tab:
◆ At the appropriate event log tab, click the Refresh button (see Figure 109).
Figure 109. Refreshing the Event Log
To manually refresh the BCU event log:
◆ Click the Go button (see Figure 108 on page 122).
Click Refresh to display the latest version of the event log
Note:
When you close an event log and return to it later, the Event Log and Error Log tabs update automatically.
Expanded Message button
BMTX-SVU01B-EN 123
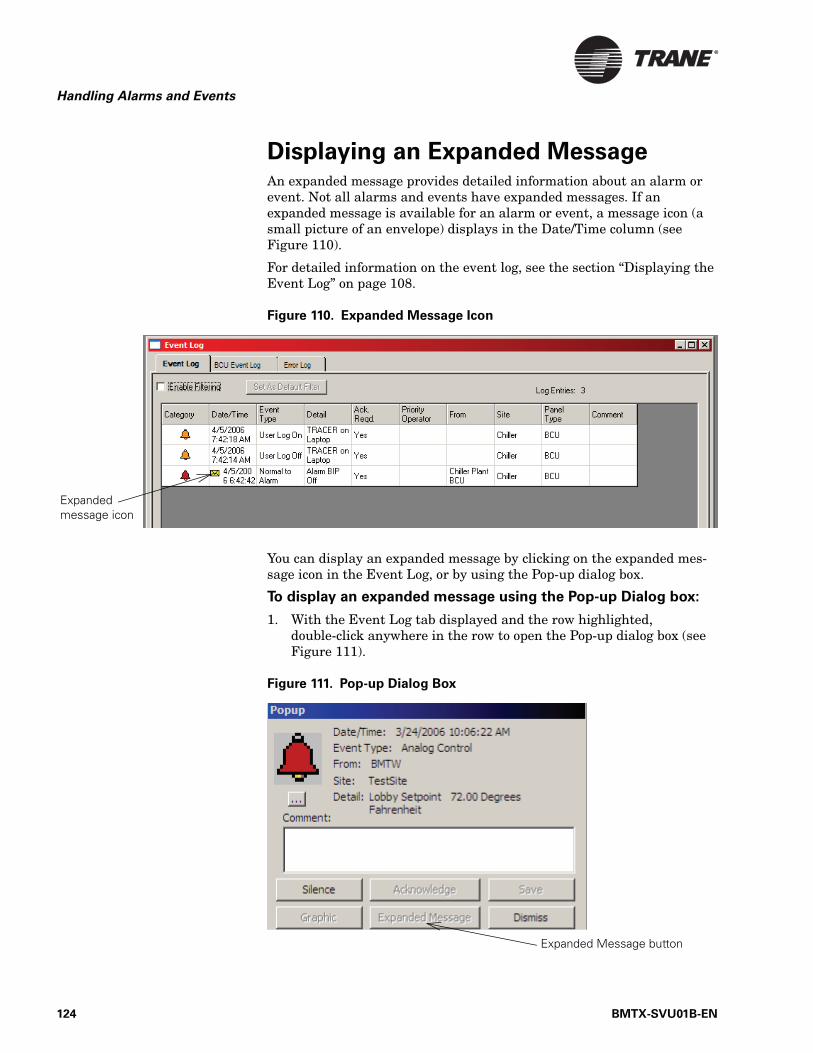
Handling Alarms and Events
Displaying an Expanded MessageAn expanded message provides detailed information about an alarm or event. Not all alarms and events have expanded messages. If an expanded message is available for an alarm or event, a message icon (a small picture of an envelope) displays in the Date/Time column (see Figure 110).
For detailed information on the event log, see the section “Displaying the Event Log” on page 108.
Figure 110. Expanded Message Icon
You can display an expanded message by clicking on the expanded mes-sage icon in the Event Log, or by using the Pop-up dialog box.
To display an expanded message using the Pop-up Dialog box:
1. With the Event Log tab displayed and the row highlighted, double-click anywhere in the row to open the Pop-up dialog box (see Figure 111).
Figure 111. Pop-up Dialog Box
Expanded message icon
Expanded Message button
124 BMTX-SVU01B-EN
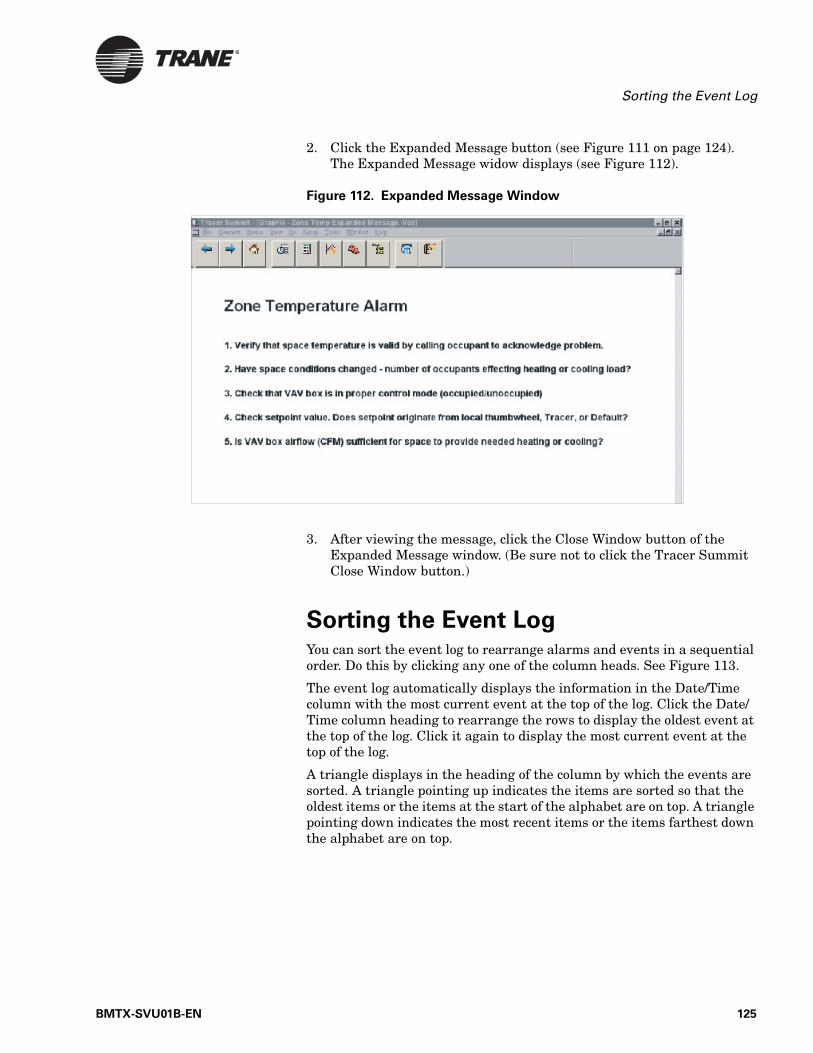
Sorting the Event Log
2. Click the Expanded Message button (see Figure 111 on page 124). The Expanded Message widow displays (see Figure 112).
Figure 112. Expanded Message Window
3. After viewing the message, click the Close Window button of the Expanded Message window. (Be sure not to click the Tracer Summit Close Window button.)
Sorting the Event LogYou can sort the event log to rearrange alarms and events in a sequential order. Do this by clicking any one of the column heads. See Figure 113.
The event log automatically displays the information in the Date/Time column with the most current event at the top of the log. Click the Date/Time column heading to rearrange the rows to display the oldest event at the top of the log. Click it again to display the most current event at the top of the log.
A triangle displays in the heading of the column by which the events are sorted. A triangle pointing up indicates the items are sorted so that the oldest items or the items at the start of the alphabet are on top. A triangle pointing down indicates the most recent items or the items farthest down the alphabet are on top.
BMTX-SVU01B-EN 125

Handling Alarms and Events
Figure 113. Sorting the Event Log
To sort the event log:
1. Click on the Event Log or BCU Event Log tab.
2. With the event log displayed, click the column heading you want to sort (see Figure 113 on page 126).
Rearranging Columns
◆ In the event log, click a column head and drag to the desired area. When you exit the site, your changes are automatically saved.
Click to sort alarms by category
Click to sort by alarm and event details
Click to sort alarms by acknowledgment requirements
Click to sort by application program priority and program in control
Click to sort alarms and events from a specific BCU or PC Workstation
Click to sort alarms and events by site
Click to sort by panel type
Click to sort alarms and events by date and time
Click to sort by event type
Click to sort all events withcomments
Note:
You can sort based on one criteria only; click one heading by which you wish to sort.
126 BMTX-SVU01B-EN
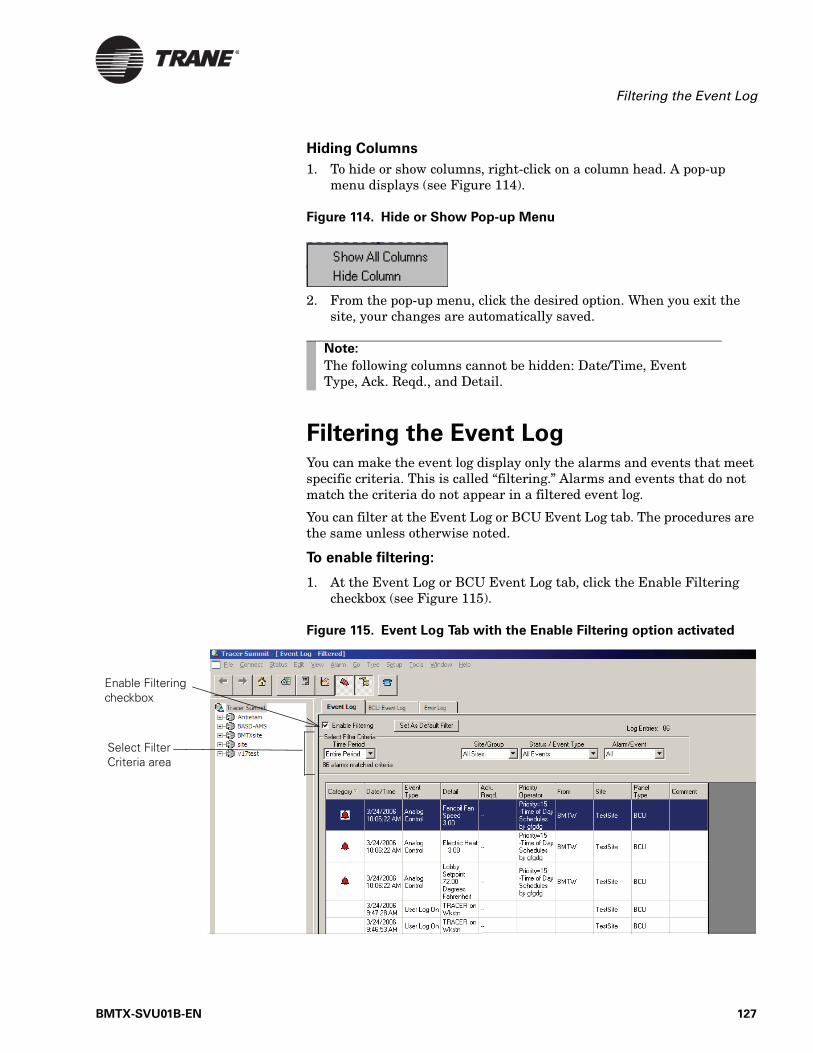
Filtering the Event Log
Hiding Columns
1. To hide or show columns, right-click on a column head. A pop-up menu displays (see Figure 114).
Figure 114. Hide or Show Pop-up Menu
2. From the pop-up menu, click the desired option. When you exit the site, your changes are automatically saved.
Filtering the Event LogYou can make the event log display only the alarms and events that meet specific criteria. This is called “filtering.” Alarms and events that do not match the criteria do not appear in a filtered event log.
You can filter at the Event Log or BCU Event Log tab. The procedures are the same unless otherwise noted.
To enable filtering:
1. At the Event Log or BCU Event Log tab, click the Enable Filtering checkbox (see Figure 115).
Figure 115. Event Log Tab with the Enable Filtering option activated
Note:
The following columns cannot be hidden: Date/Time, Event Type, Ack. Reqd., and Detail.
Enable Filtering checkbox
Select Filter Criteria area
BMTX-SVU01B-EN 127
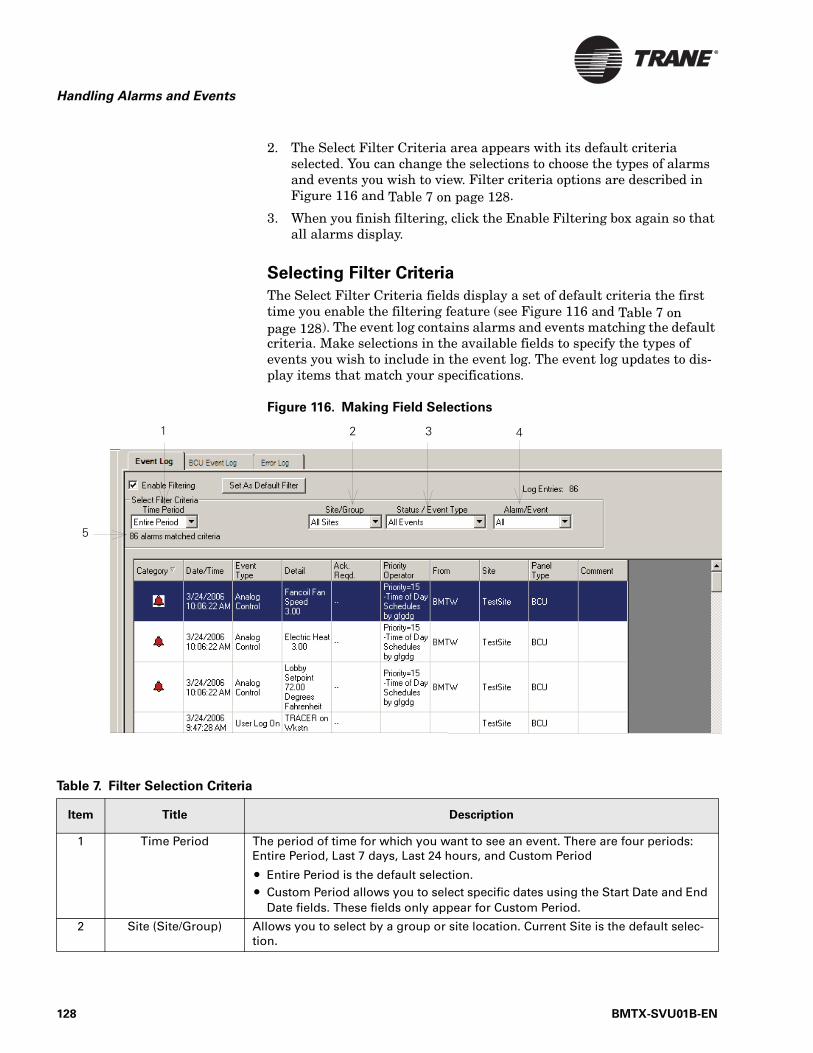
Handling Alarms and Events
2. The Select Filter Criteria area appears with its default criteria selected. You can change the selections to choose the types of alarms and events you wish to view. Filter criteria options are described in Figure 116 and Table 7 on page 128.
3. When you finish filtering, click the Enable Filtering box again so that all alarms display.
Selecting Filter Criteria
The Select Filter Criteria fields display a set of default criteria the first time you enable the filtering feature (see Figure 116 and Table 7 on page 128). The event log contains alarms and events matching the default criteria. Make selections in the available fields to specify the types of events you wish to include in the event log. The event log updates to dis-play items that match your specifications.
Figure 116. Making Field Selections
Table 7. Filter Selection Criteria
Item Title Description
1 Time Period The period of time for which you want to see an event. There are four periods: Entire Period, Last 7 days, Last 24 hours, and Custom Period
• Entire Period is the default selection. • Custom Period allows you to select specific dates using the Start Date and End
Date fields. These fields only appear for Custom Period.
2 Site (Site/Group) Allows you to select by a group or site location. Current Site is the default selec-tion.
1 2 3 4
5
128 BMTX-SVU01B-EN
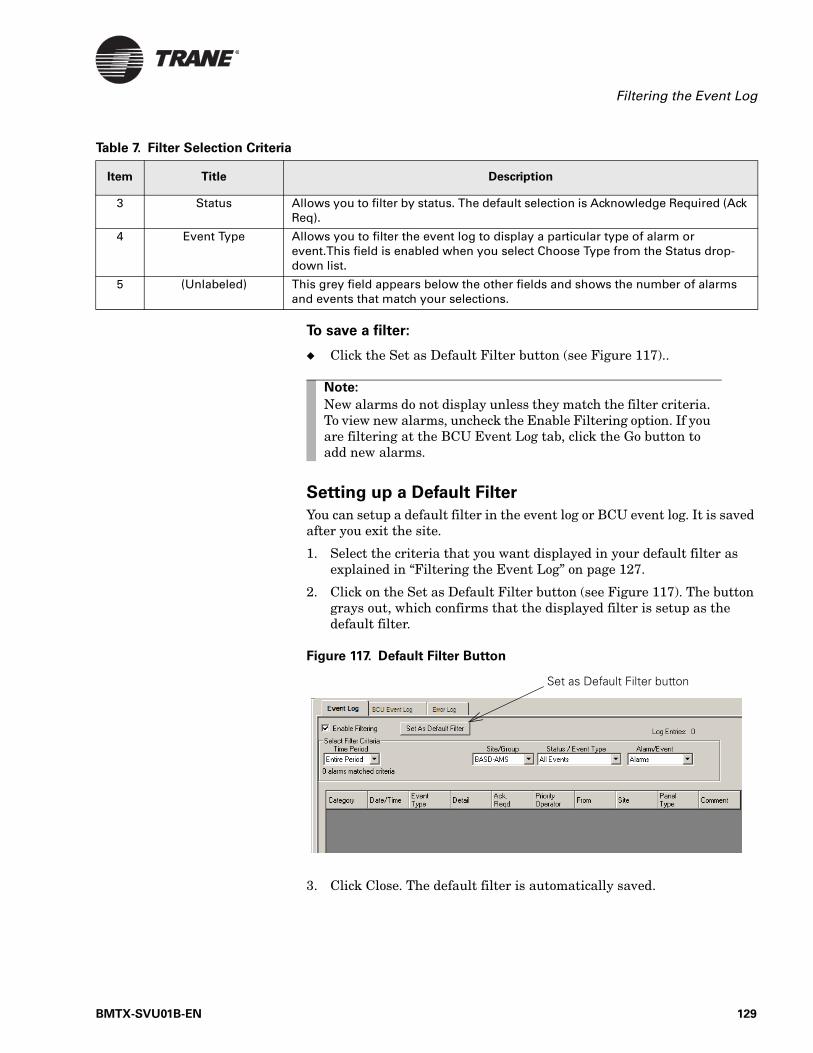
Filtering the Event Log
To save a filter:
◆ Click the Set as Default Filter button (see Figure 117)..
Setting up a Default Filter
You can setup a default filter in the event log or BCU event log. It is saved after you exit the site.
1. Select the criteria that you want displayed in your default filter as explained in “Filtering the Event Log” on page 127.
2. Click on the Set as Default Filter button (see Figure 117). The button grays out, which confirms that the displayed filter is setup as the default filter.
Figure 117. Default Filter Button
3. Click Close. The default filter is automatically saved.
3 Status Allows you to filter by status. The default selection is Acknowledge Required (Ack Req).
4 Event Type Allows you to filter the event log to display a particular type of alarm or event.This field is enabled when you select Choose Type from the Status drop-down list.
5 (Unlabeled) This grey field appears below the other fields and shows the number of alarms and events that match your selections.
Table 7. Filter Selection Criteria
Item Title Description
Note:
New alarms do not display unless they match the filter criteria. To view new alarms, uncheck the Enable Filtering option. If you are filtering at the BCU Event Log tab, click the Go button to add new alarms.
Set as Default Filter button
BMTX-SVU01B-EN 129

Handling Alarms and Events
To change the default filter:
1. Click on any row inside the default filter. The Set as Default Filter button becomes active.
2. Make changes, if any, to the filter.
3. Click the Set as Default Filter button. The button grays out, indicat-ing that a new default filter is setup.
130 BMTX-SVU01B-EN

Printing Alarms and Events
Printing Alarms and EventsYou can print the entire event log, as well as selected alarms and events. You can do this procedure from the Event Log, BCU Event Log or Error Log tab.
Printing the Entire Event Log
1. With the appropriate event log tab displayed, from the File menu select Print (see Figure 118). The Print window displays (see Figure 119).
Figure 118. Selecting Print from the File Menu
Figure 119. Print Window
2. Click the OK button.
Printing Selected Alarms and Events
You can print a single alarm or event, a block of alarms or events, or sev-eral alarms or events that are not adjacent in the event log.
Note:
The following procedures apply to all tabs unless otherwise noted.
Step 1
Step 2
All button
These buttons are not available
BMTX-SVU01B-EN 131
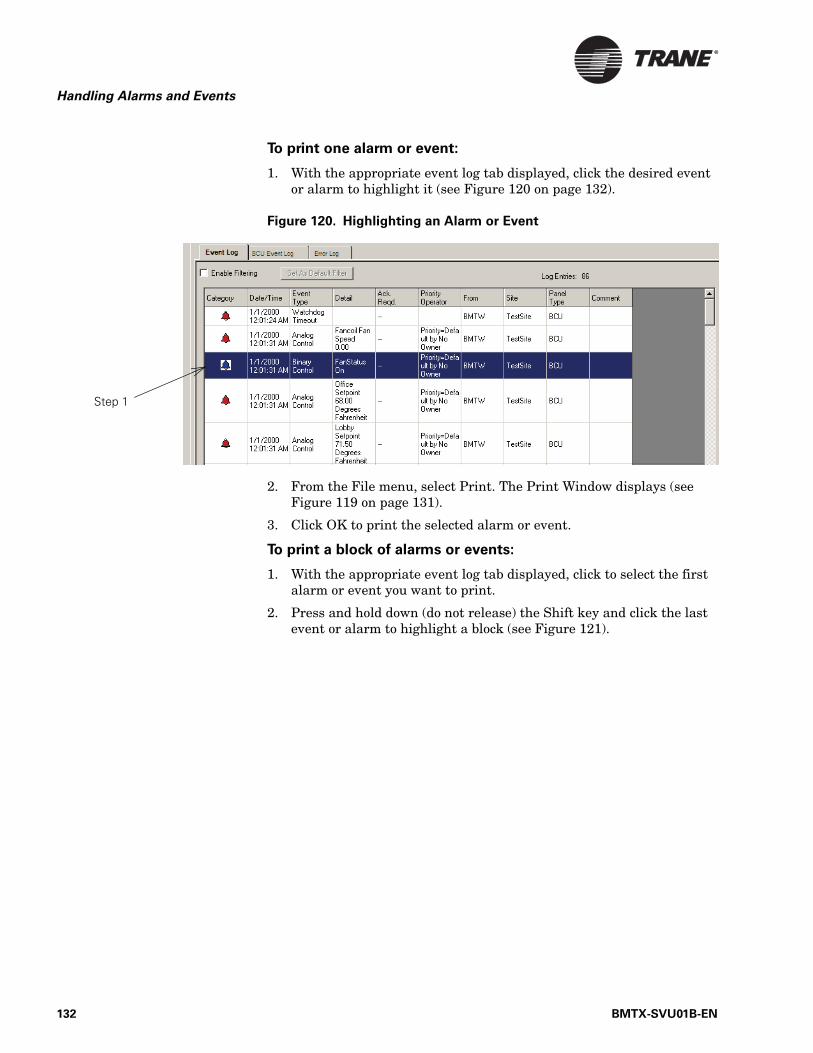
Handling Alarms and Events
To print one alarm or event:
1. With the appropriate event log tab displayed, click the desired event or alarm to highlight it (see Figure 120 on page 132).
Figure 120. Highlighting an Alarm or Event
2. From the File menu, select Print. The Print Window displays (see Figure 119 on page 131).
3. Click OK to print the selected alarm or event.
To print a block of alarms or events:
1. With the appropriate event log tab displayed, click to select the first alarm or event you want to print.
2. Press and hold down (do not release) the Shift key and click the last event or alarm to highlight a block (see Figure 121).
Step 1
132 BMTX-SVU01B-EN
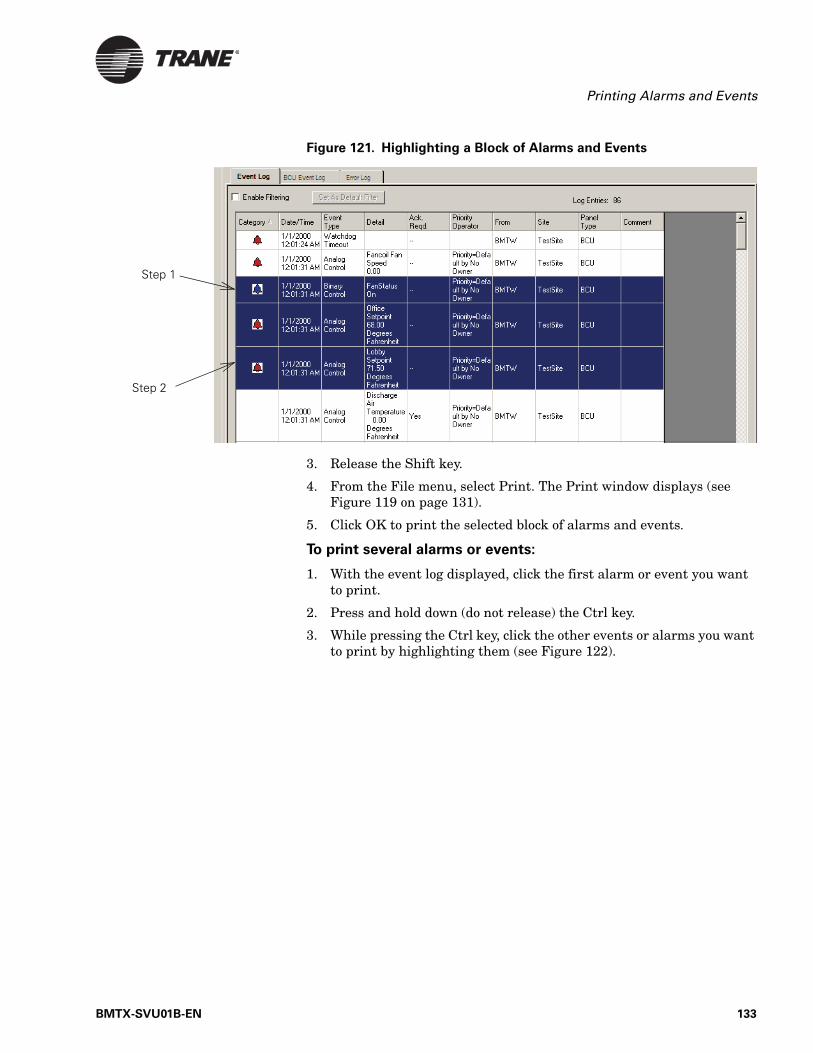
Printing Alarms and Events
Figure 121. Highlighting a Block of Alarms and Events
3. Release the Shift key.
4. From the File menu, select Print. The Print window displays (see Figure 119 on page 131).
5. Click OK to print the selected block of alarms and events.
To print several alarms or events:
1. With the event log displayed, click the first alarm or event you want to print.
2. Press and hold down (do not release) the Ctrl key.
3. While pressing the Ctrl key, click the other events or alarms you want to print by highlighting them (see Figure 122).
Step 1
Step 2
BMTX-SVU01B-EN 133
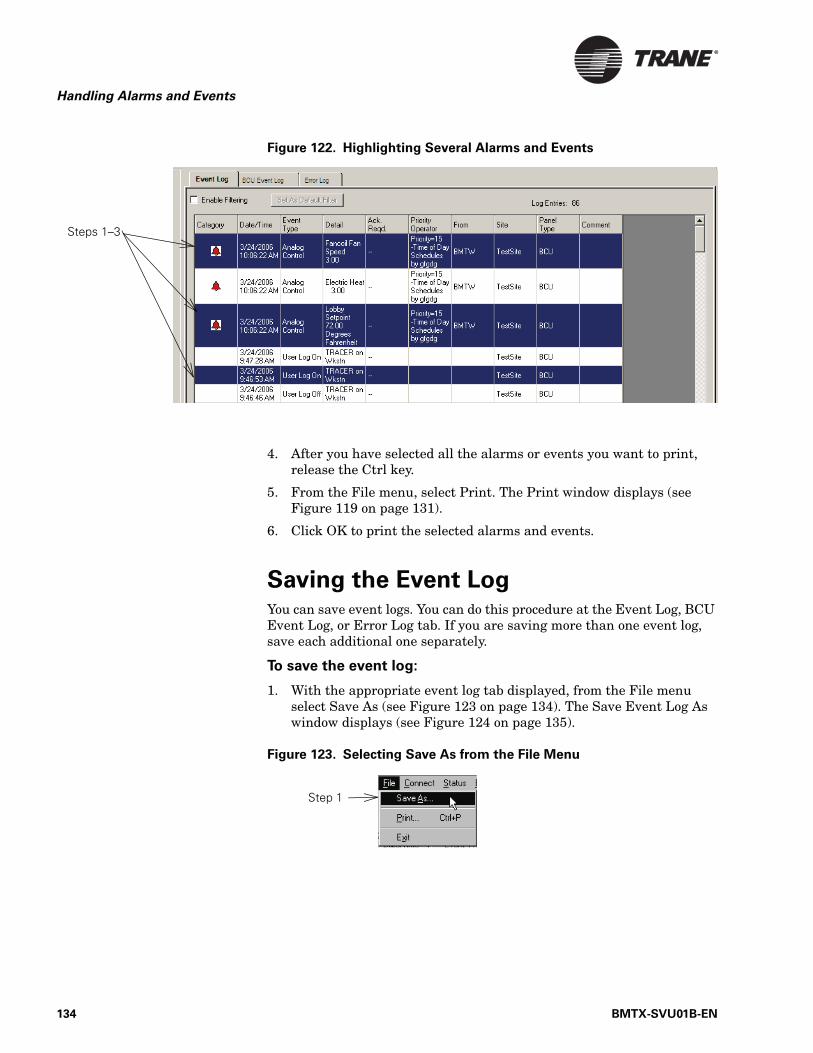
Handling Alarms and Events
Figure 122. Highlighting Several Alarms and Events
4. After you have selected all the alarms or events you want to print, release the Ctrl key.
5. From the File menu, select Print. The Print window displays (see Figure 119 on page 131).
6. Click OK to print the selected alarms and events.
Saving the Event LogYou can save event logs. You can do this procedure at the Event Log, BCU Event Log, or Error Log tab. If you are saving more than one event log, save each additional one separately.
To save the event log:
1. With the appropriate event log tab displayed, from the File menu select Save As (see Figure 123 on page 134). The Save Event Log As window displays (see Figure 124 on page 135).
Figure 123. Selecting Save As from the File Menu
Steps 1–3
Step 1
134 BMTX-SVU01B-EN
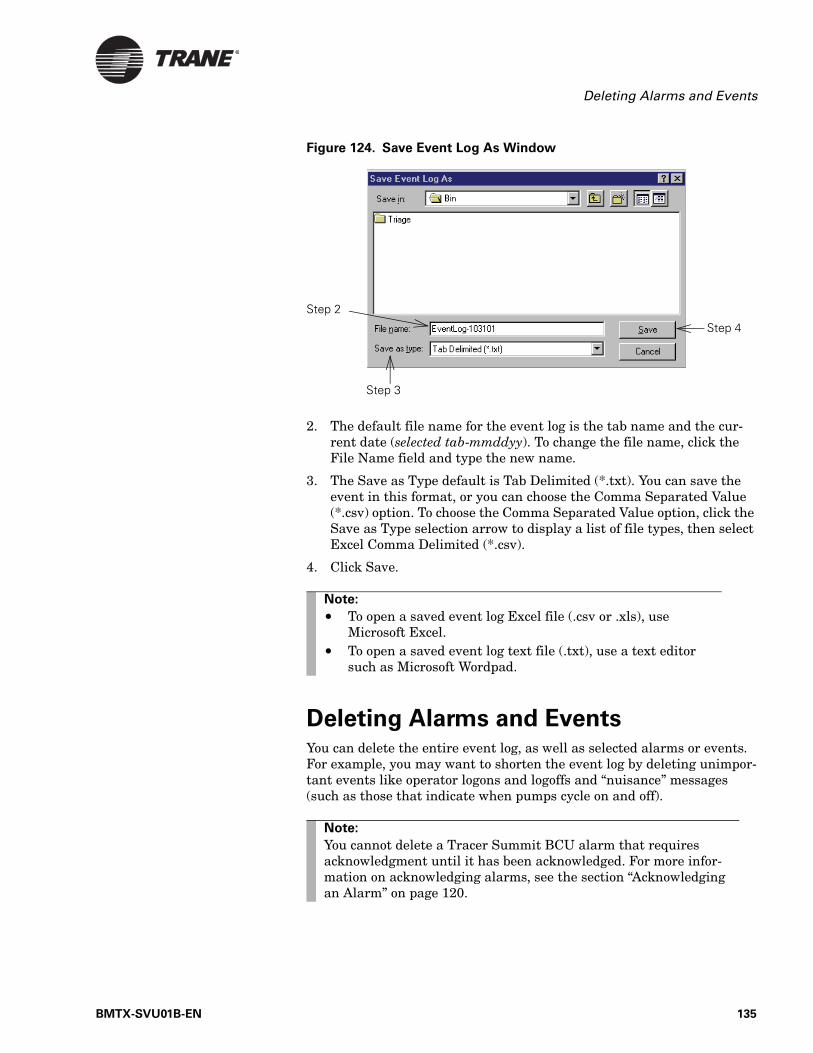
Deleting Alarms and Events
Figure 124. Save Event Log As Window
2. The default file name for the event log is the tab name and the cur-rent date (selected tab-mmddyy). To change the file name, click the File Name field and type the new name.
3. The Save as Type default is Tab Delimited (*.txt). You can save the event in this format, or you can choose the Comma Separated Value (*.csv) option. To choose the Comma Separated Value option, click the Save as Type selection arrow to display a list of file types, then select Excel Comma Delimited (*.csv).
4. Click Save.
Deleting Alarms and EventsYou can delete the entire event log, as well as selected alarms or events. For example, you may want to shorten the event log by deleting unimpor-tant events like operator logons and logoffs and “nuisance” messages (such as those that indicate when pumps cycle on and off).
Step 2
Step 3
Step 4
Note:
• To open a saved event log Excel file (.csv or .xls), use Microsoft Excel.
• To open a saved event log text file (.txt), use a text editor such as Microsoft Wordpad.
Note:
You cannot delete a Tracer Summit BCU alarm that requires acknowledgment until it has been acknowledged. For more infor-mation on acknowledging alarms, see the section “Acknowledging an Alarm” on page 120.
BMTX-SVU01B-EN 135
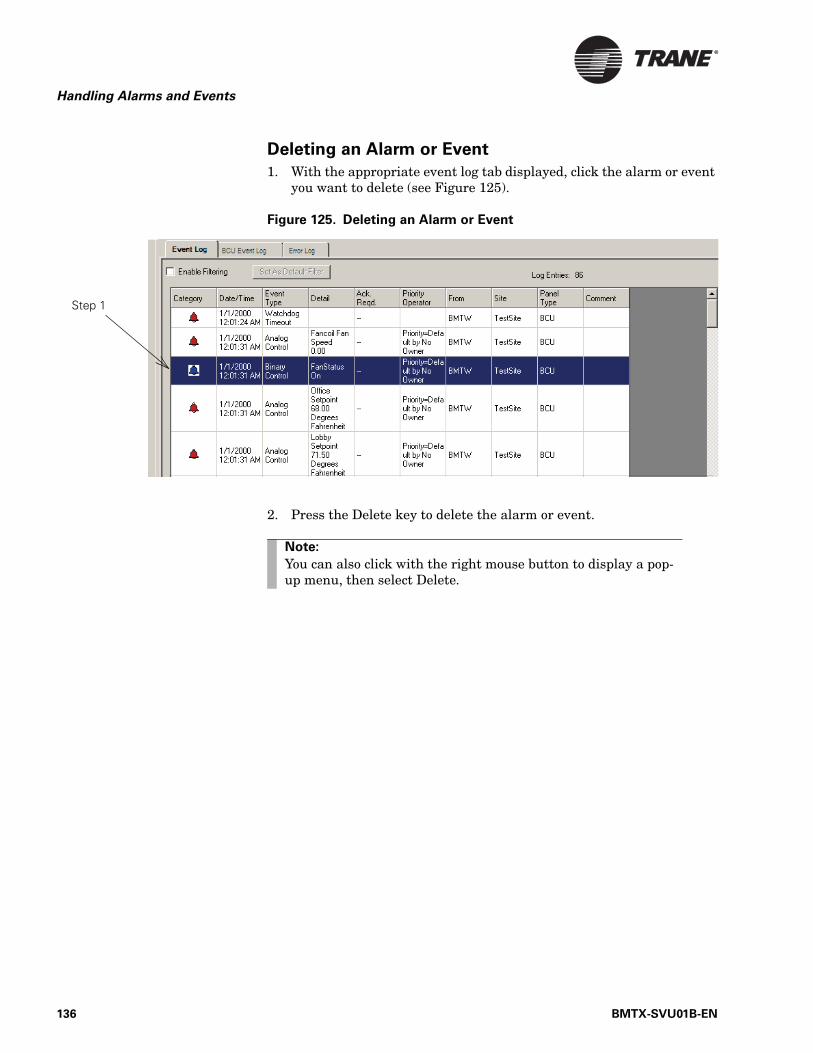
Handling Alarms and Events
Deleting an Alarm or Event
1. With the appropriate event log tab displayed, click the alarm or event you want to delete (see Figure 125).
Figure 125. Deleting an Alarm or Event
2. Press the Delete key to delete the alarm or event.
Step 1
Note:
You can also click with the right mouse button to display a pop-up menu, then select Delete.
136 BMTX-SVU01B-EN
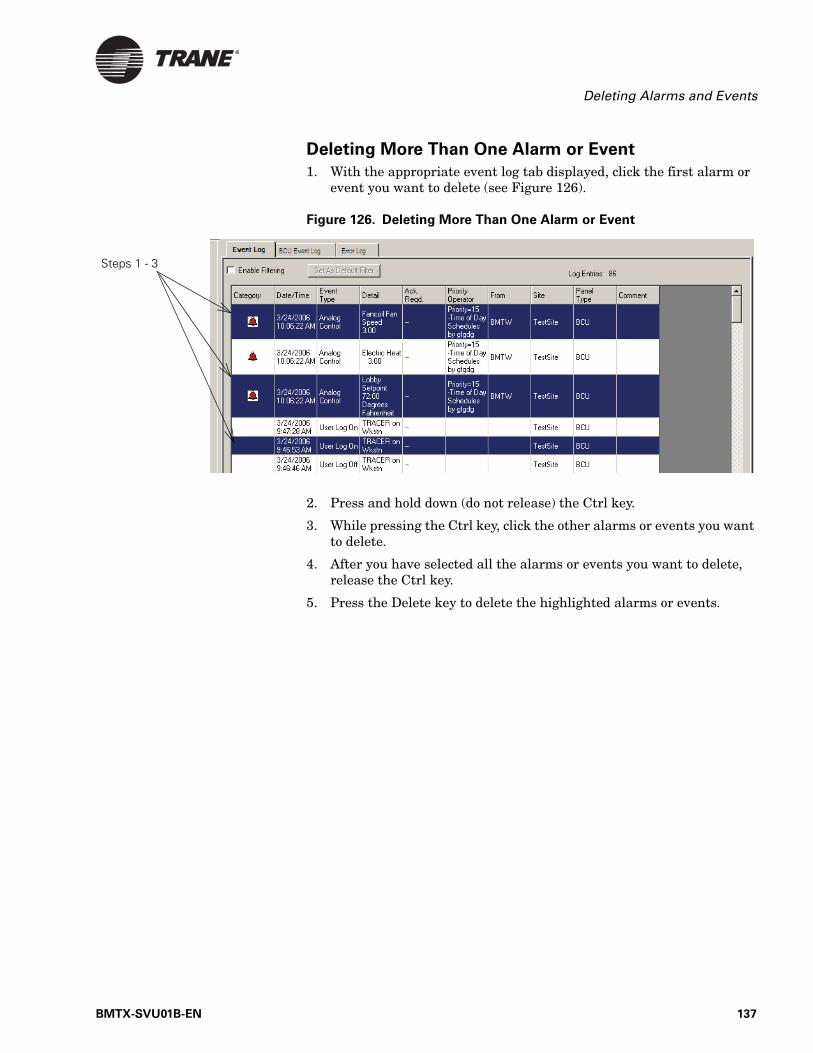
Deleting Alarms and Events
Deleting More Than One Alarm or Event
1. With the appropriate event log tab displayed, click the first alarm or event you want to delete (see Figure 126).
Figure 126. Deleting More Than One Alarm or Event
2. Press and hold down (do not release) the Ctrl key.
3. While pressing the Ctrl key, click the other alarms or events you want to delete.
4. After you have selected all the alarms or events you want to delete, release the Ctrl key.
5. Press the Delete key to delete the highlighted alarms or events.
Steps 1 - 3
BMTX-SVU01B-EN 137

Handling Alarms and Events
Deleting a Block of Alarms or Events
1. With the appropriate event log tab displayed, click the first alarm or event you want to delete (see Figure 127).
Figure 127. Deleting a Block of Alarms and Events
2. Press and hold down (do not release) the Shift key and click the last alarm or event you want to delete. The entire block is highlighted.
3. Release the Shift key.
4. Press the Delete key to delete the highlighted block of alarms or events.
Deleting the Entire Event Log
1. With the appropriate event log tab displayed, from the Edit menu choose Select All (see Figure 128). All of the alarms or events in the displayed event log are now highlighted.
Figure 128. Choosing Select All from the Edit Menu
Step 2
Step 1
Step 1
138 BMTX-SVU01B-EN

Deleting Alarms and Events
2. Press the Delete key. The entire displayed event log is deleted.
Note:
If you select the entire log and then decide you don’t want to delete all of the items, press and hold down the Ctrl key, then left-click on one or more items that you don’t want to delete. The items are now deselected and will not be deleted when you press the Delete key.
BMTX-SVU01B-EN 139

Handling Alarms and Events
140 BMTX-SVU01B-EN
Chapter 10
Running Reports
Tracer Summit allows BCU and Tracer 100 panel users to run standard reports and reports that are tailored to your site. Reports provide infor-mation that you and others can use to make decisions about building operations.
Reports are used for:
• Record keeping and documentation• Energy monitoring• Troubleshooting
Note:
You may not have access to all of the tasks presented in this guide. Your access privileges depend on your user profile. Con-tact your supervisor for information.
This chapter does not apply to Tracker panels.
BMTX-SVU01B-EN 141

Running Reports
Tracer Summit lets you run, display, print, and save three types of reports—standard live reports, standard trend reports, and custom reports. You can also display, print, and save a previously saved report.
• Standard Live Reports. Standard live reports show information about what is happening in the Tracer Summit system at a particular time (see Figure 129).
Figure 129. Sample Live Report
BCU data and time
Page number
Main report title
Body of the report
Site name and name and title of the operator generating the report
142 BMTX-SVU01B-EN
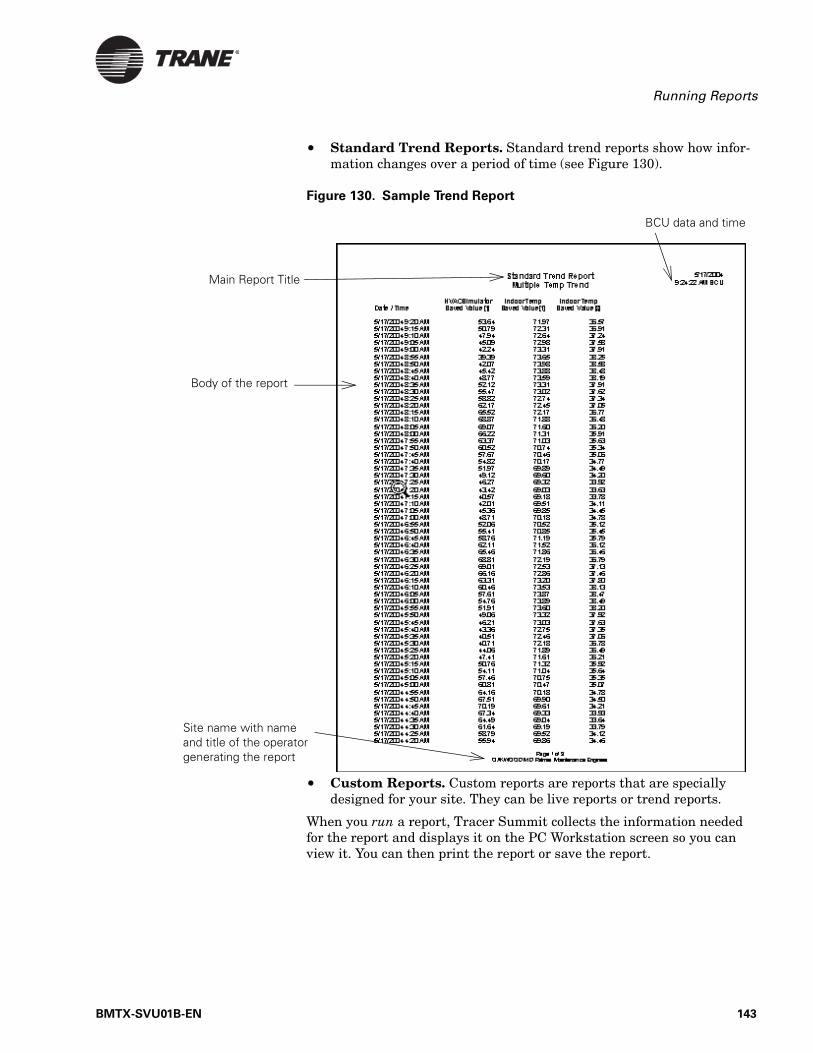
Running Reports
• Standard Trend Reports. Standard trend reports show how infor-mation changes over a period of time (see Figure 130).
Figure 130. Sample Trend Report
• Custom Reports. Custom reports are reports that are specially designed for your site. They can be live reports or trend reports.
When you run a report, Tracer Summit collects the information needed for the report and displays it on the PC Workstation screen so you can view it. You can then print the report or save the report.
Main Report Title
Body of the report
BCU data and time
Site name with name and title of the operator generating the report
BMTX-SVU01B-EN 143
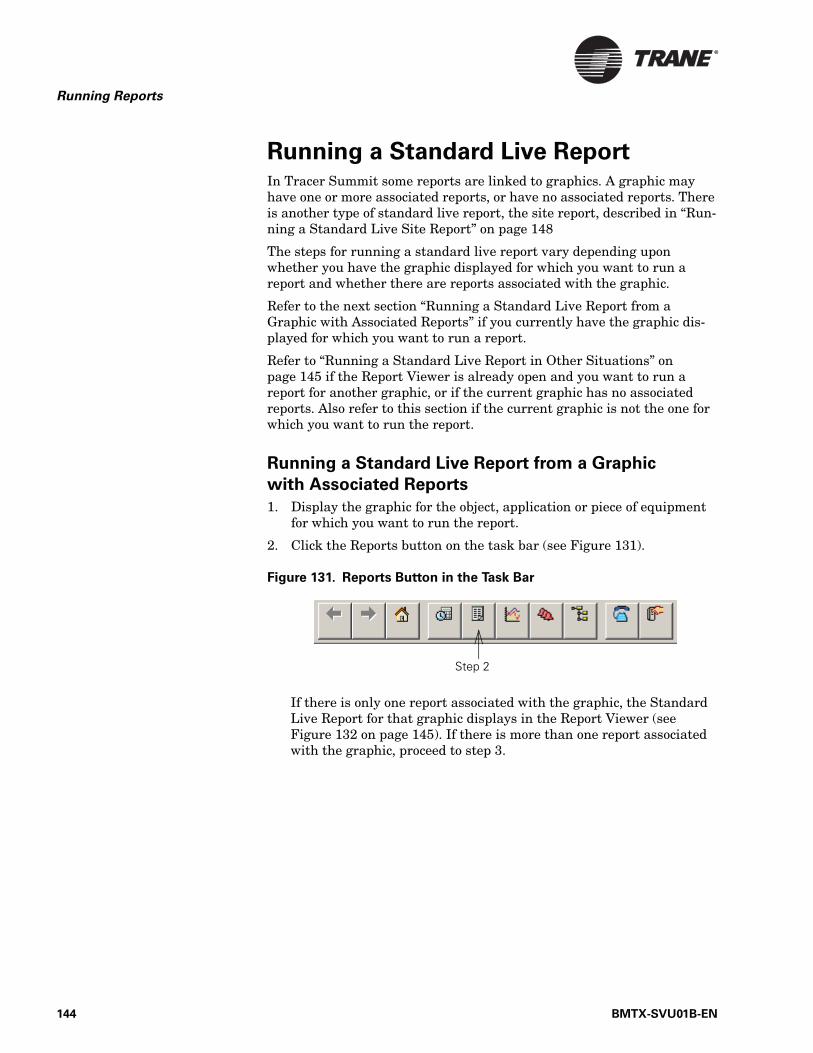
Running Reports
Running a Standard Live ReportIn Tracer Summit some reports are linked to graphics. A graphic may have one or more associated reports, or have no associated reports. There is another type of standard live report, the site report, described in “Run-ning a Standard Live Site Report” on page 148
The steps for running a standard live report vary depending upon whether you have the graphic displayed for which you want to run a report and whether there are reports associated with the graphic.
Refer to the next section “Running a Standard Live Report from a Graphic with Associated Reports” if you currently have the graphic dis-played for which you want to run a report.
Refer to “Running a Standard Live Report in Other Situations” on page 145 if the Report Viewer is already open and you want to run a report for another graphic, or if the current graphic has no associated reports. Also refer to this section if the current graphic is not the one for which you want to run the report.
Running a Standard Live Report from a Graphic
with Associated Reports
1. Display the graphic for the object, application or piece of equipment for which you want to run the report.
2. Click the Reports button on the task bar (see Figure 131).
Figure 131. Reports Button in the Task Bar
If there is only one report associated with the graphic, the Standard Live Report for that graphic displays in the Report Viewer (see Figure 132 on page 145). If there is more than one report associated with the graphic, proceed to step 3.
Step 2
144 BMTX-SVU01B-EN
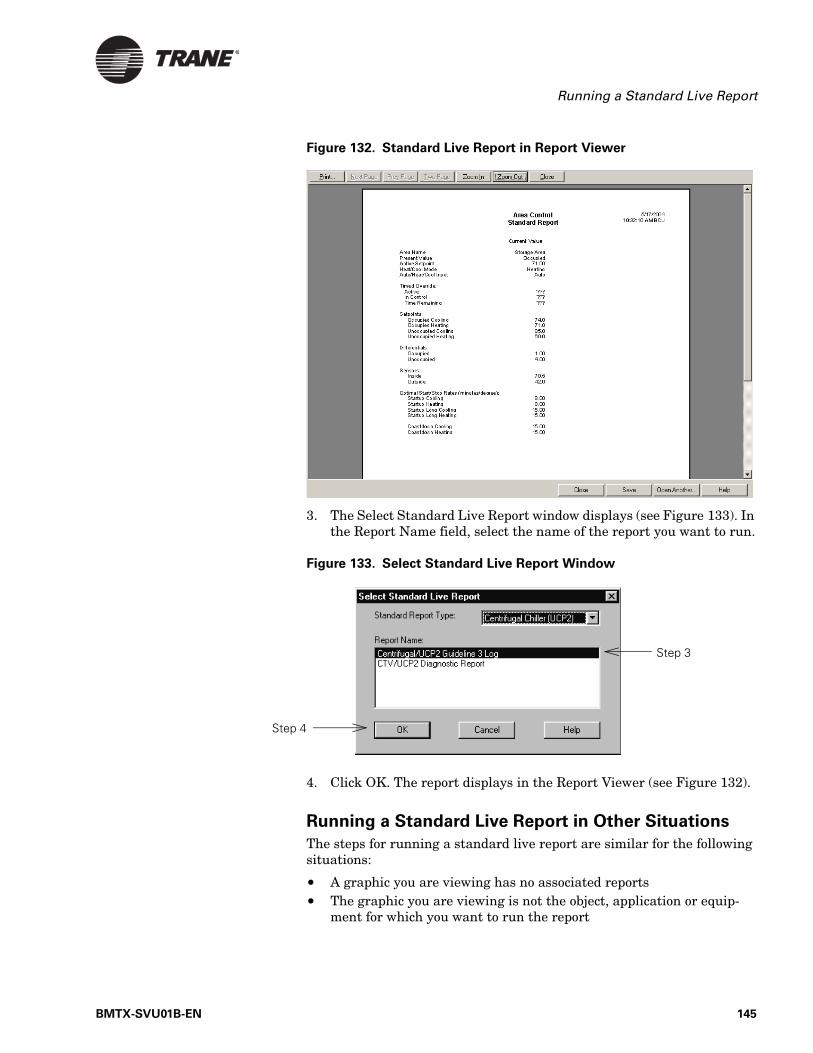
Running a Standard Live Report
Figure 132. Standard Live Report in Report Viewer
3. The Select Standard Live Report window displays (see Figure 133). In the Report Name field, select the name of the report you want to run.
Figure 133. Select Standard Live Report Window
4. Click OK. The report displays in the Report Viewer (see Figure 132).
Running a Standard Live Report in Other Situations
The steps for running a standard live report are similar for the following situations:
• A graphic you are viewing has no associated reports• The graphic you are viewing is not the object, application or equip-
ment for which you want to run the report
Step 3
Step 4
BMTX-SVU01B-EN 145
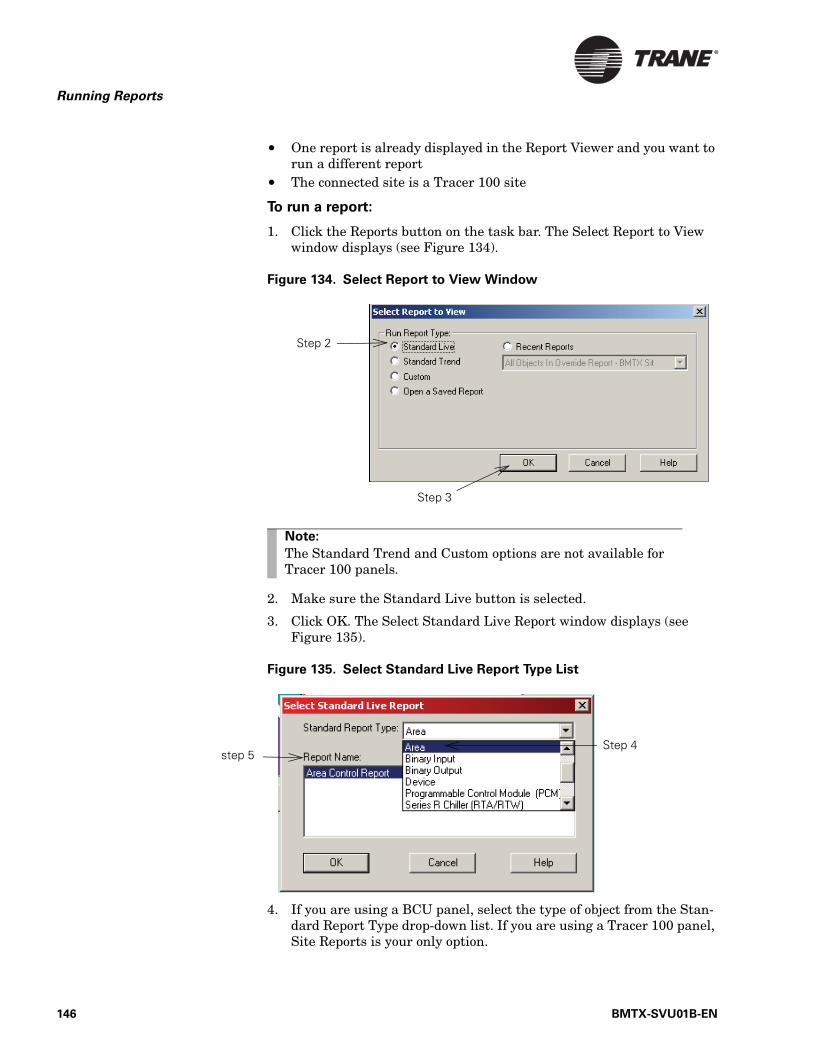
Running Reports
• One report is already displayed in the Report Viewer and you want to run a different report
• The connected site is a Tracer 100 site
To run a report:
1. Click the Reports button on the task bar. The Select Report to View window displays (see Figure 134).
Figure 134. Select Report to View Window
2. Make sure the Standard Live button is selected.
3. Click OK. The Select Standard Live Report window displays (see Figure 135).
Figure 135. Select Standard Live Report Type List
4. If you are using a BCU panel, select the type of object from the Stan-dard Report Type drop-down list. If you are using a Tracer 100 panel, Site Reports is your only option.
Step 3
Step 2
Note:
The Standard Trend and Custom options are not available for Tracer 100 panels.
Step 4step 5
146 BMTX-SVU01B-EN
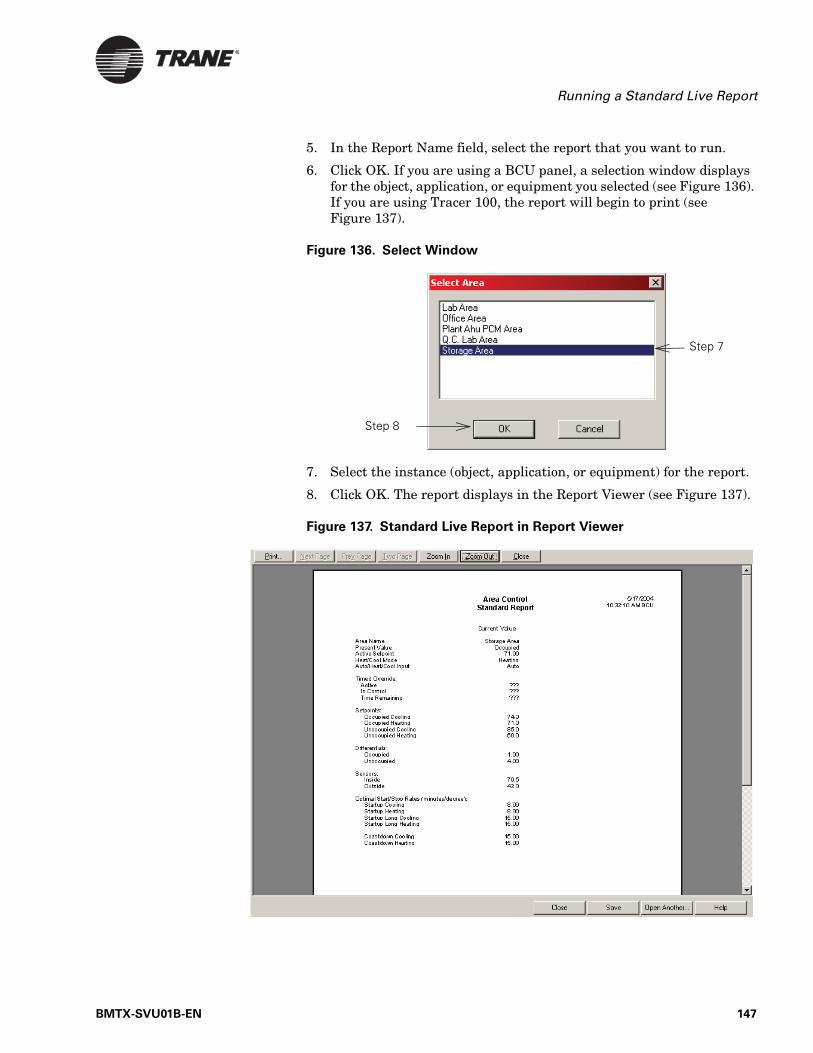
Running a Standard Live Report
5. In the Report Name field, select the report that you want to run.
6. Click OK. If you are using a BCU panel, a selection window displays for the object, application, or equipment you selected (see Figure 136). If you are using Tracer 100, the report will begin to print (see Figure 137).
Figure 136. Select Window
7. Select the instance (object, application, or equipment) for the report.
8. Click OK. The report displays in the Report Viewer (see Figure 137).
Figure 137. Standard Live Report in Report Viewer
Step 7
Step 8
BMTX-SVU01B-EN 147
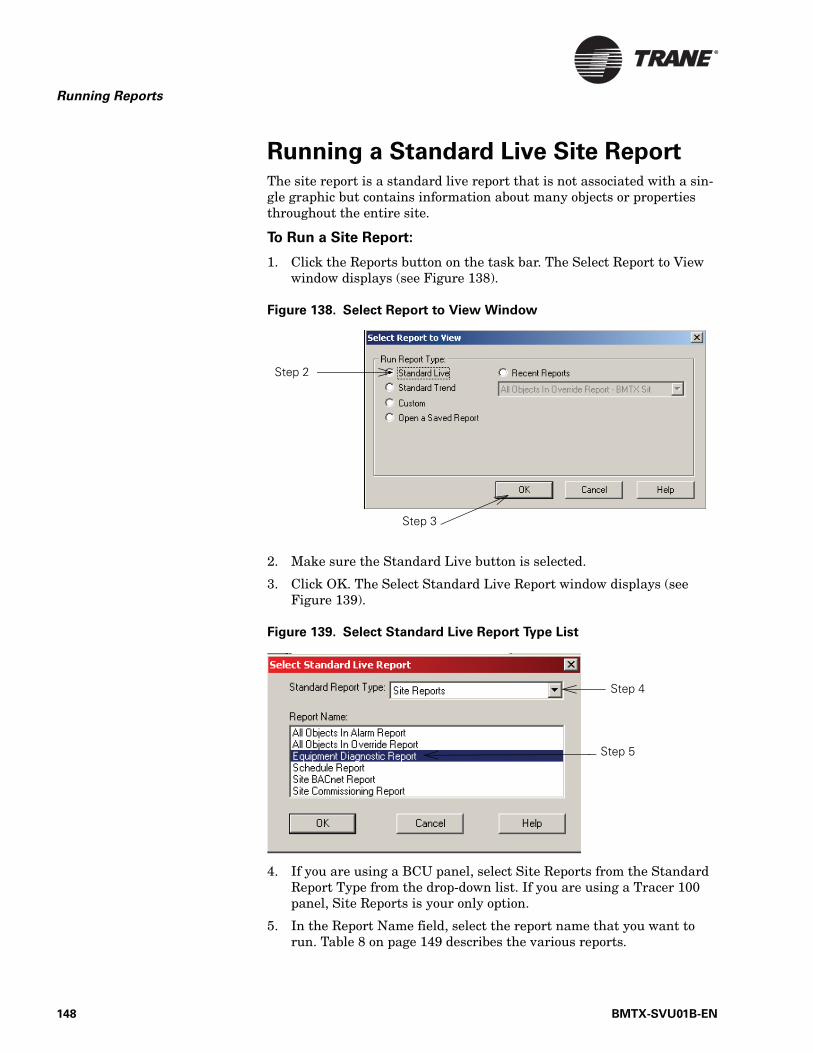
Running Reports
Running a Standard Live Site ReportThe site report is a standard live report that is not associated with a sin-gle graphic but contains information about many objects or properties throughout the entire site.
To Run a Site Report:
1. Click the Reports button on the task bar. The Select Report to View window displays (see Figure 138).
Figure 138. Select Report to View Window
2. Make sure the Standard Live button is selected.
3. Click OK. The Select Standard Live Report window displays (see Figure 139).
Figure 139. Select Standard Live Report Type List
4. If you are using a BCU panel, select Site Reports from the Standard Report Type from the drop-down list. If you are using a Tracer 100 panel, Site Reports is your only option.
5. In the Report Name field, select the report name that you want to run. Table 8 on page 149 describes the various reports.
Step 3
Step 2
Step 4
Step 5
148 BMTX-SVU01B-EN

Running a Standard Live Site Report
Table 8. Site Reports
6. Click OK.
7. A dialog box will display with various options, depending on the type of site report chosen (see options in Table 8). Choose the desired option.
8. Click OK. The report will display in the report viewer window (see Figure 140 on page 150).
Report Type Options Description
All Objects in Alarm Report • analog inputs and outputs• binary inputs and outputs• equipment
Displays every object of the chosen type that is in an alarm state.
All Objects in Override Report
• user overrides• CPL overrides• Timed Overrides (TOV)
Displays every object currently under the chosen type of override.
Equipment Diagnostic Report
Choose one or more than one BCU
Displays all active diagnostics for the equipment associated with the chosen BCU.
Schedule Report choose one or more than one schedule.
Displays a Summary of all information for the chosen schedules.
Site BACnet Report choose one or more than one BCU
Displays a complete list of all the BACnet objects for the chosen BCUs, including analog inputs and outputs and binary inputs and outputs.
Site Commissioning Report Choose a site Displays a comprehensive summary of all objects and devices on the site.
BMTX-SVU01B-EN 149
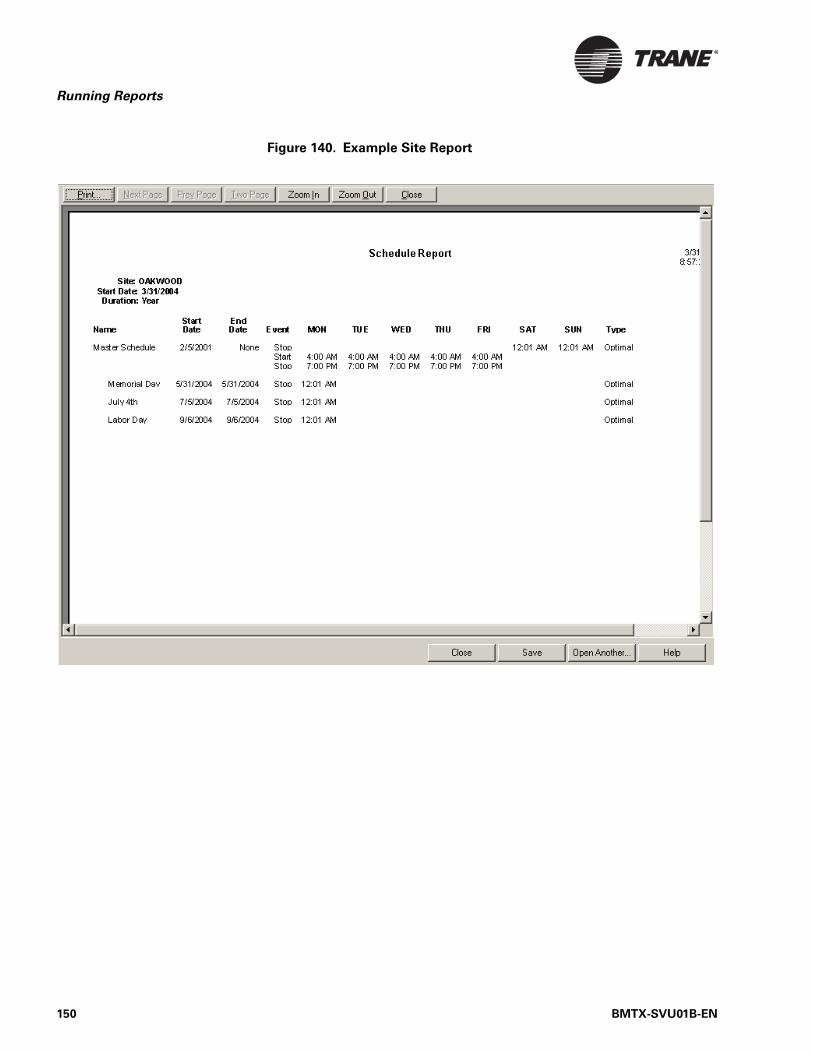
Running Reports
Figure 140. Example Site Report
150 BMTX-SVU01B-EN
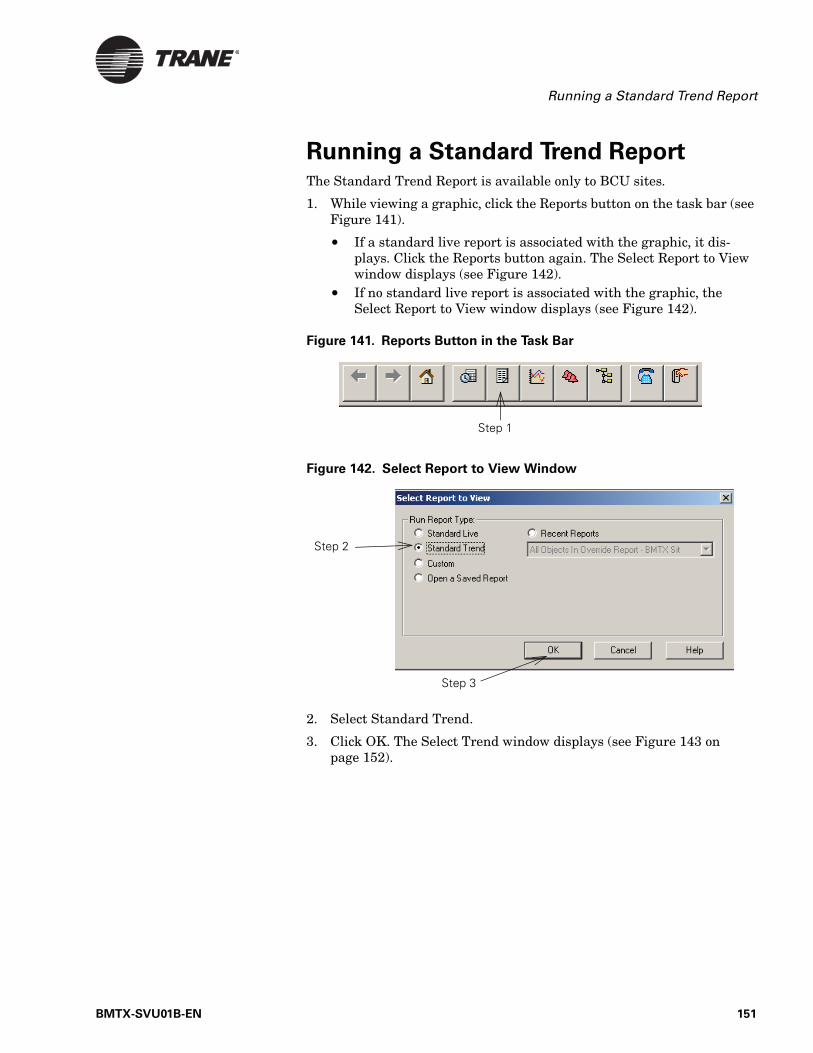
Running a Standard Trend Report
Running a Standard Trend ReportThe Standard Trend Report is available only to BCU sites.
1. While viewing a graphic, click the Reports button on the task bar (see Figure 141).
• If a standard live report is associated with the graphic, it dis-plays. Click the Reports button again. The Select Report to View window displays (see Figure 142).
• If no standard live report is associated with the graphic, the Select Report to View window displays (see Figure 142).
Figure 141. Reports Button in the Task Bar
Figure 142. Select Report to View Window
2. Select Standard Trend.
3. Click OK. The Select Trend window displays (see Figure 143 on page 152).
Step 1
Step 2
Step 3
BMTX-SVU01B-EN 151
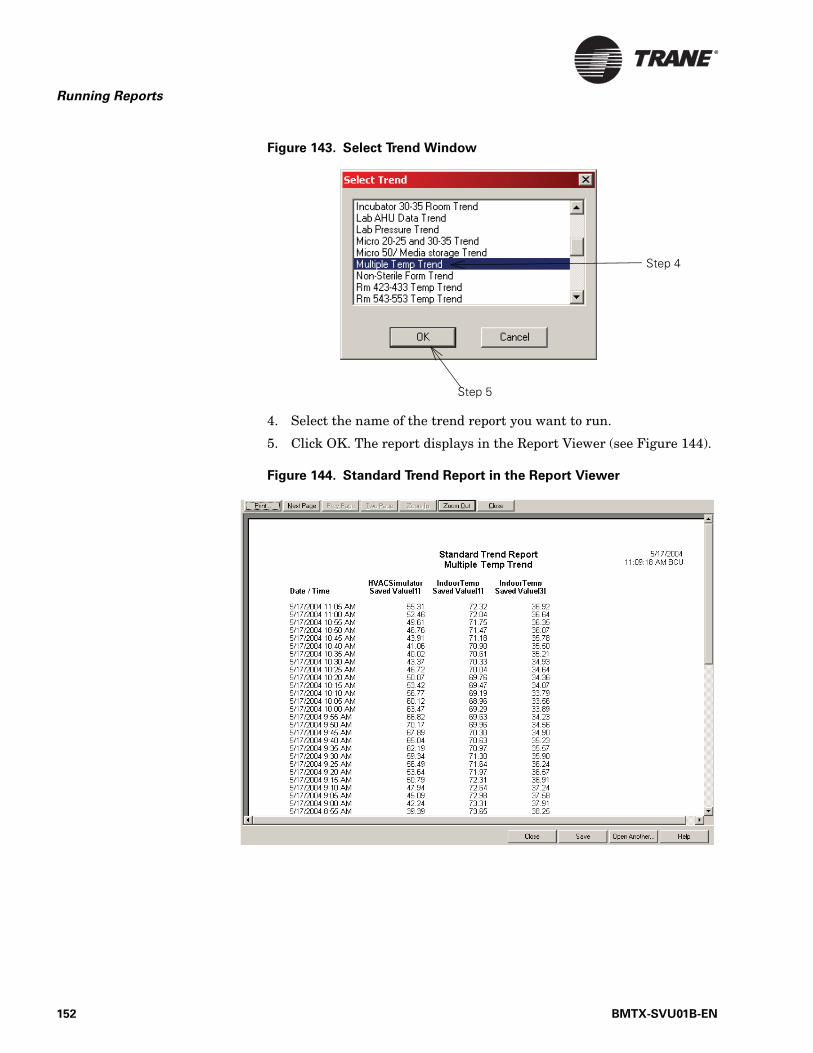
Running Reports
Figure 143. Select Trend Window
4. Select the name of the trend report you want to run.
5. Click OK. The report displays in the Report Viewer (see Figure 144).
Figure 144. Standard Trend Report in the Report Viewer
Step 5
Step 4
152 BMTX-SVU01B-EN

Running a Custom Report
Running a Custom ReportCustom Report is available only to BCU sites.
1. Click the Reports button on the task bar (see Figure 145).
Figure 145. Reports Button in the Task Bar
If a standard live report is associated with the graphic, it displays. Click the Reports button again.
The Select Report to View window displays (see Figure 146).
Figure 146. Select Report to View Window
2. Select Custom.
3. Click OK. The Select Custom Report window displays (see Figure 147 on page 154).
Step 1
Step 2
Step 3
BMTX-SVU01B-EN 153
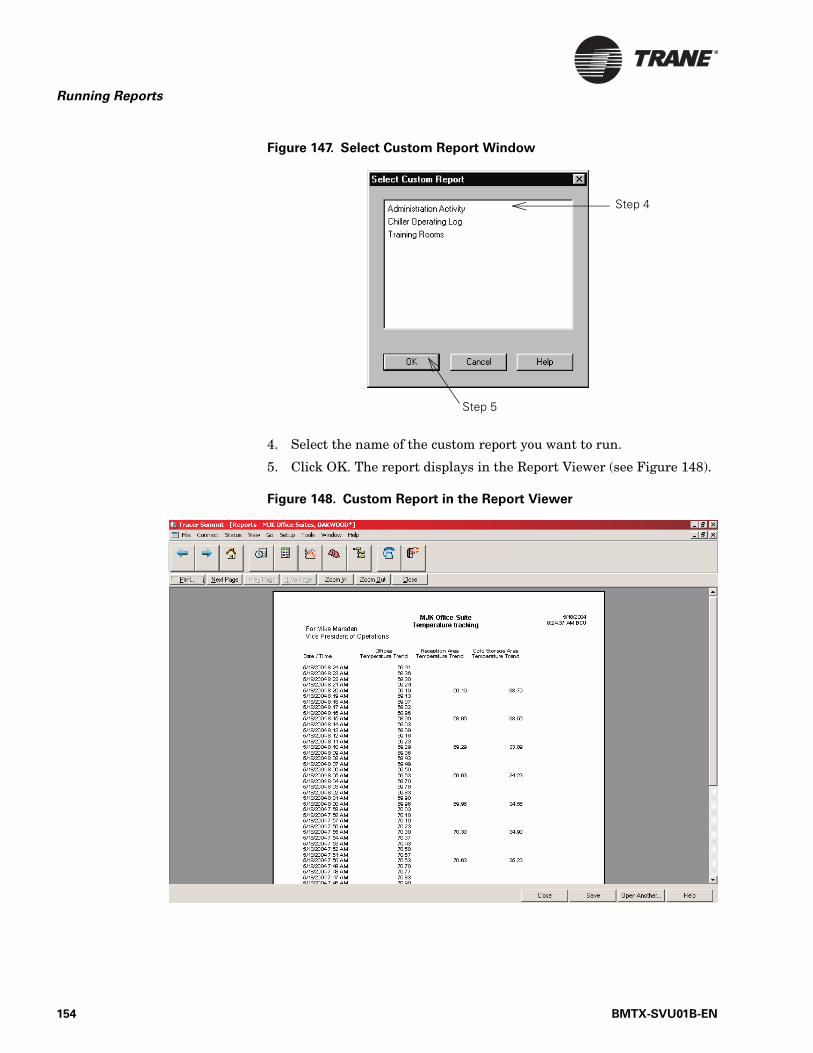
Running Reports
Figure 147. Select Custom Report Window
4. Select the name of the custom report you want to run.
5. Click OK. The report displays in the Report Viewer (see Figure 148).
Figure 148. Custom Report in the Report Viewer
Step 5
Step 4
154 BMTX-SVU01B-EN
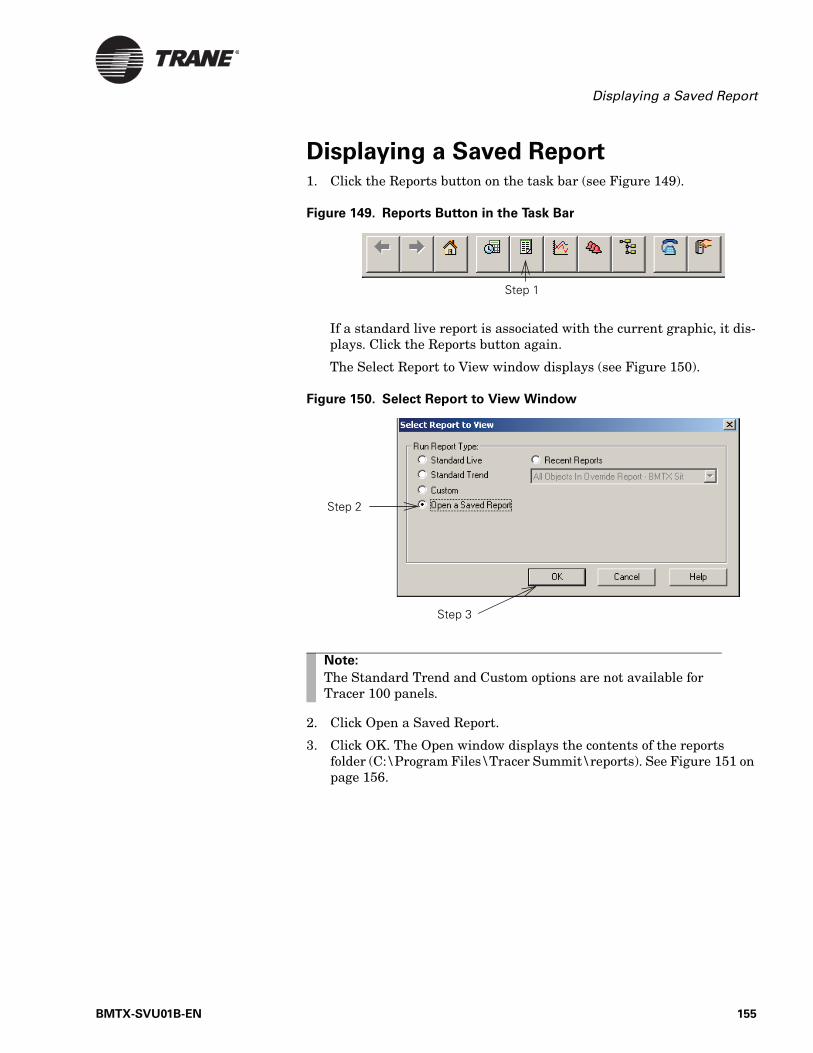
Displaying a Saved Report
Displaying a Saved Report1. Click the Reports button on the task bar (see Figure 149).
Figure 149. Reports Button in the Task Bar
If a standard live report is associated with the current graphic, it dis-plays. Click the Reports button again.
The Select Report to View window displays (see Figure 150).
Figure 150. Select Report to View Window
2. Click Open a Saved Report.
3. Click OK. The Open window displays the contents of the reports folder (C:\Program Files\Tracer Summit\reports). See Figure 151 on page 156.
Step 1
Step 2
Step 3
Note:
The Standard Trend and Custom options are not available for Tracer 100 panels.
BMTX-SVU01B-EN 155

Running Reports
Figure 151. Open Window
4. If the report you wish to open is saved in the reports folder (see “Sav-ing a Report” on page 162), select the name of the report. Then go to step 6.
5. If the report you wish to open is saved in a different folder than the report folder, select that folder, then select the name of the report.
6. Click Open. The report displays in the Report Viewer (see Figure 152 on page 157).
Step 5
156 BMTX-SVU01B-EN
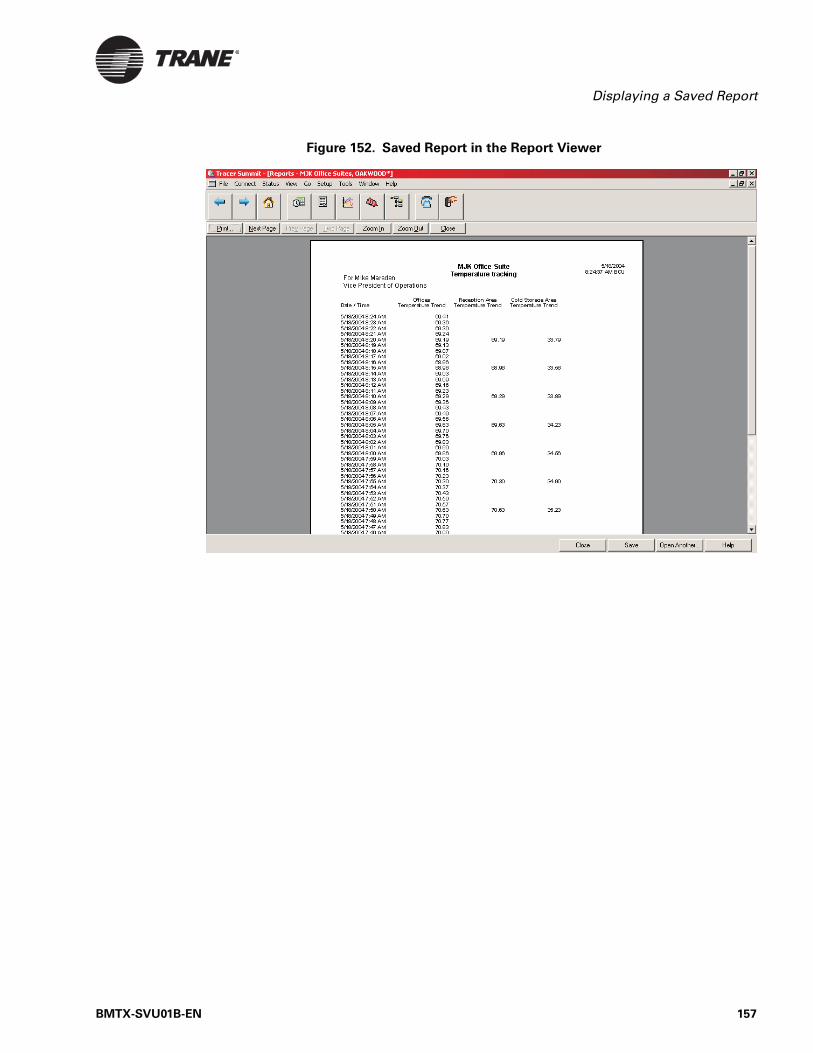
Displaying a Saved Report
Figure 152. Saved Report in the Report Viewer
BMTX-SVU01B-EN 157
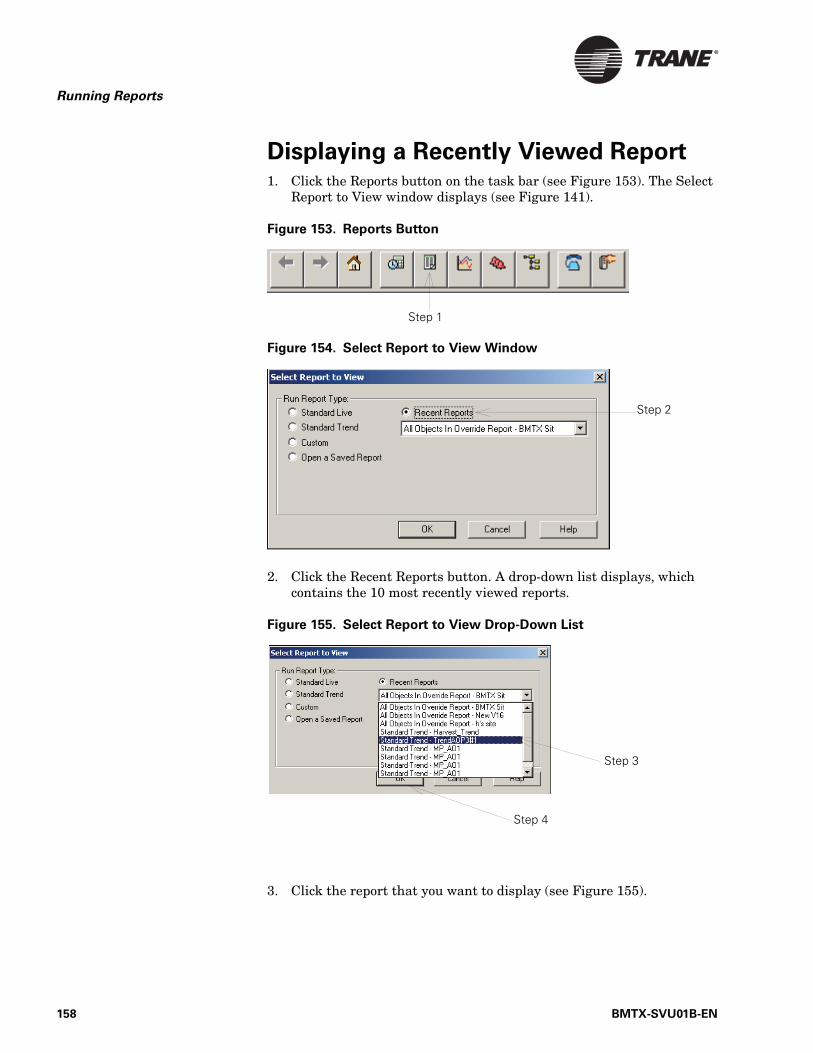
Running Reports
Displaying a Recently Viewed Report1. Click the Reports button on the task bar (see Figure 153). The Select
Report to View window displays (see Figure 141).
Figure 153. Reports Button
Figure 154. Select Report to View Window
2. Click the Recent Reports button. A drop-down list displays, which contains the 10 most recently viewed reports.
Figure 155. Select Report to View Drop-Down List
3. Click the report that you want to display (see Figure 155).
Step 1
Step 2
Step 3
Step 4
158 BMTX-SVU01B-EN

Displaying a Recently Viewed Report
4. Click OK. The report automatically displays in the Report Viewer (see Figure 156).
Figure 156. Recently Viewed Report
BMTX-SVU01B-EN 159

Running Reports
About the Report ViewerWhen you run a report, it displays on your screen in the Report Viewer (see Figure 157). The buttons you use to move around in a report are described in Table 9.
Figure 157. The Report Viewer
Click to save the report
Report nameClick to print the report
Click to close the Report Viewer
Table 9. Buttons in the Report Viewer
Button Description
Print Prints the report.
Next Page Displays the next page of the report.
Prev Page Displays the previous page of the report.
160 BMTX-SVU01B-EN
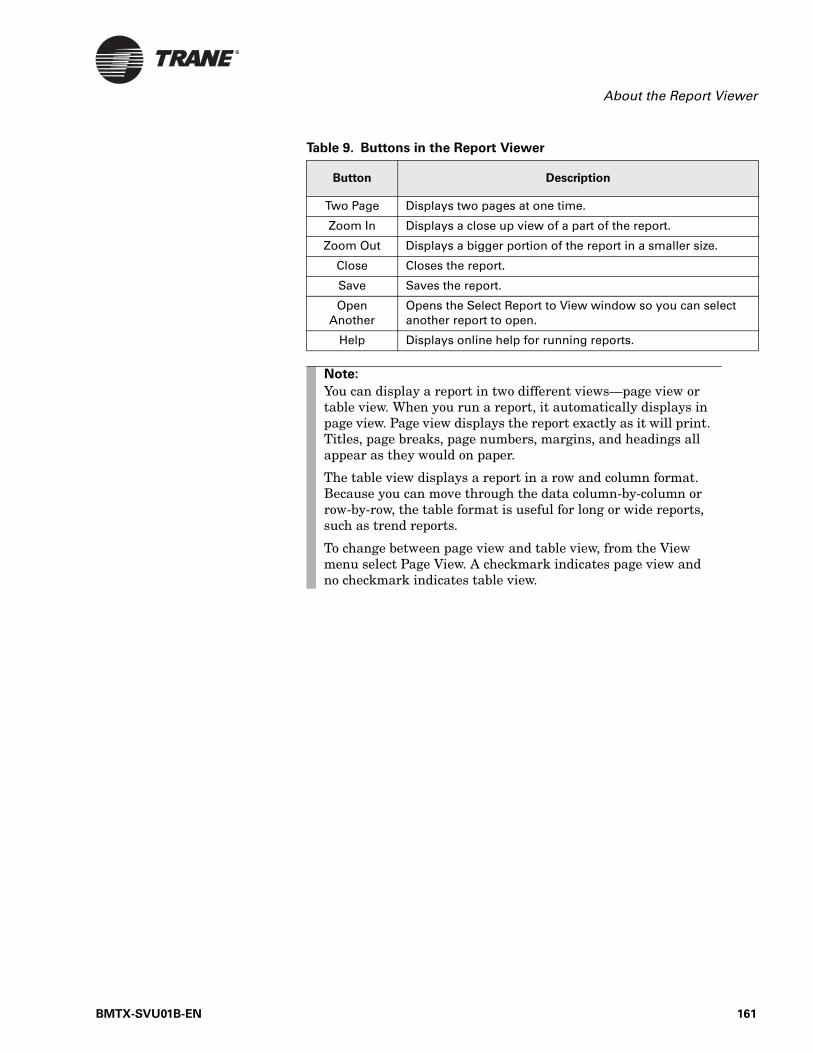
About the Report Viewer
Two Page Displays two pages at one time.
Zoom In Displays a close up view of a part of the report.
Zoom Out Displays a bigger portion of the report in a smaller size.
Close Closes the report.
Save Saves the report.
Open Another
Opens the Select Report to View window so you can select another report to open.
Help Displays online help for running reports.
Table 9. Buttons in the Report Viewer
Button Description
Note:
You can display a report in two different views—page view or table view. When you run a report, it automatically displays in page view. Page view displays the report exactly as it will print. Titles, page breaks, page numbers, margins, and headings all appear as they would on paper.
The table view displays a report in a row and column format. Because you can move through the data column-by-column or row-by-row, the table format is useful for long or wide reports, such as trend reports.
To change between page view and table view, from the View menu select Page View. A checkmark indicates page view and no checkmark indicates table view.
BMTX-SVU01B-EN 161
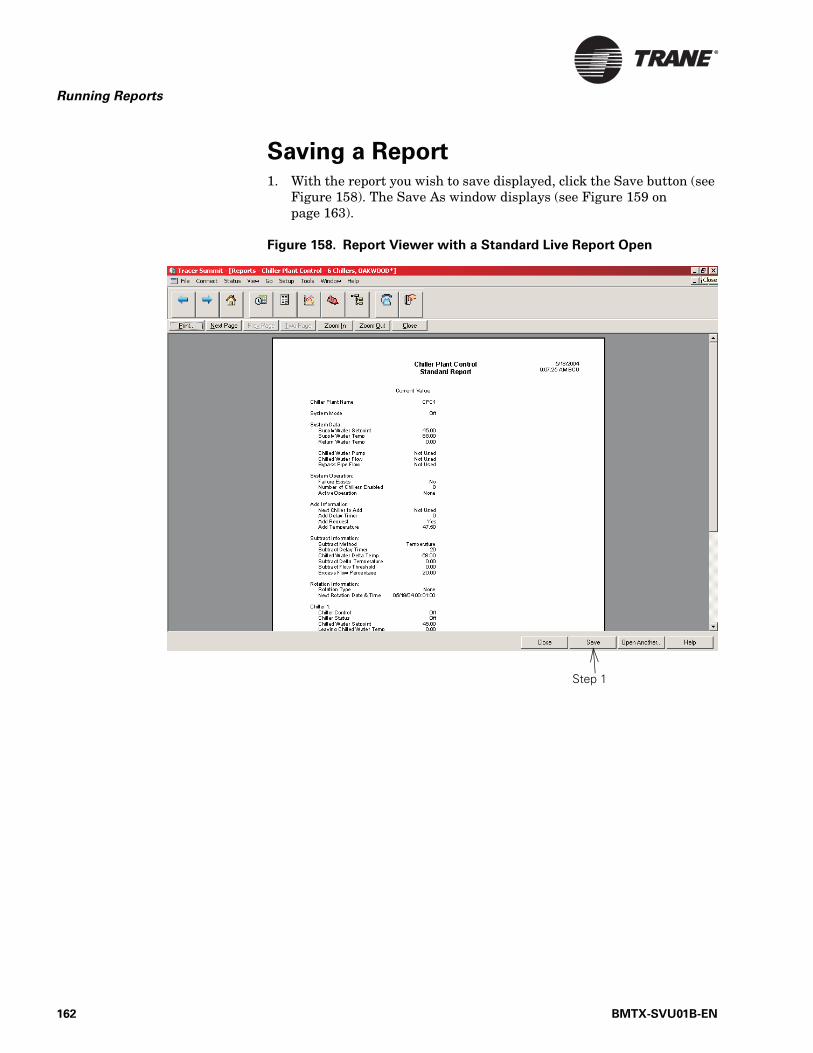
Running Reports
Saving a Report1. With the report you wish to save displayed, click the Save button (see
Figure 158). The Save As window displays (see Figure 159 on page 163).
Figure 158. Report Viewer with a Standard Live Report Open
Step 1
162 BMTX-SVU01B-EN
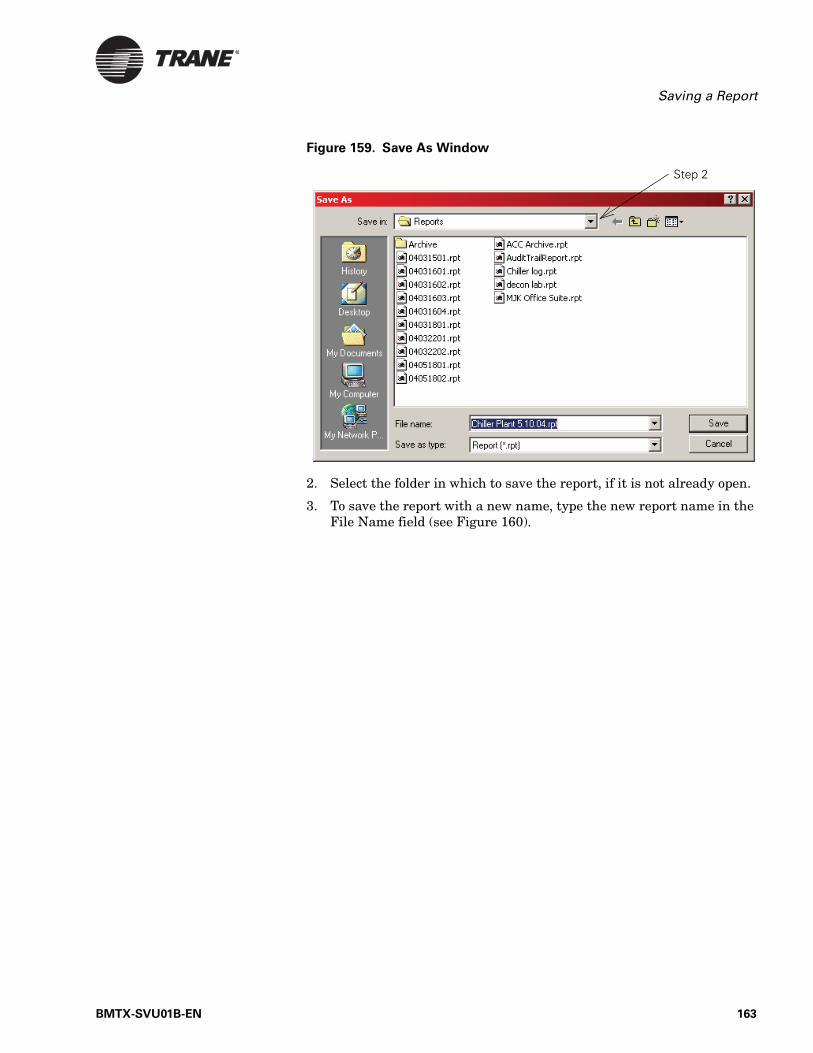
Saving a Report
Figure 159. Save As Window
2. Select the folder in which to save the report, if it is not already open.
3. To save the report with a new name, type the new report name in the File Name field (see Figure 160).
Step 2
BMTX-SVU01B-EN 163
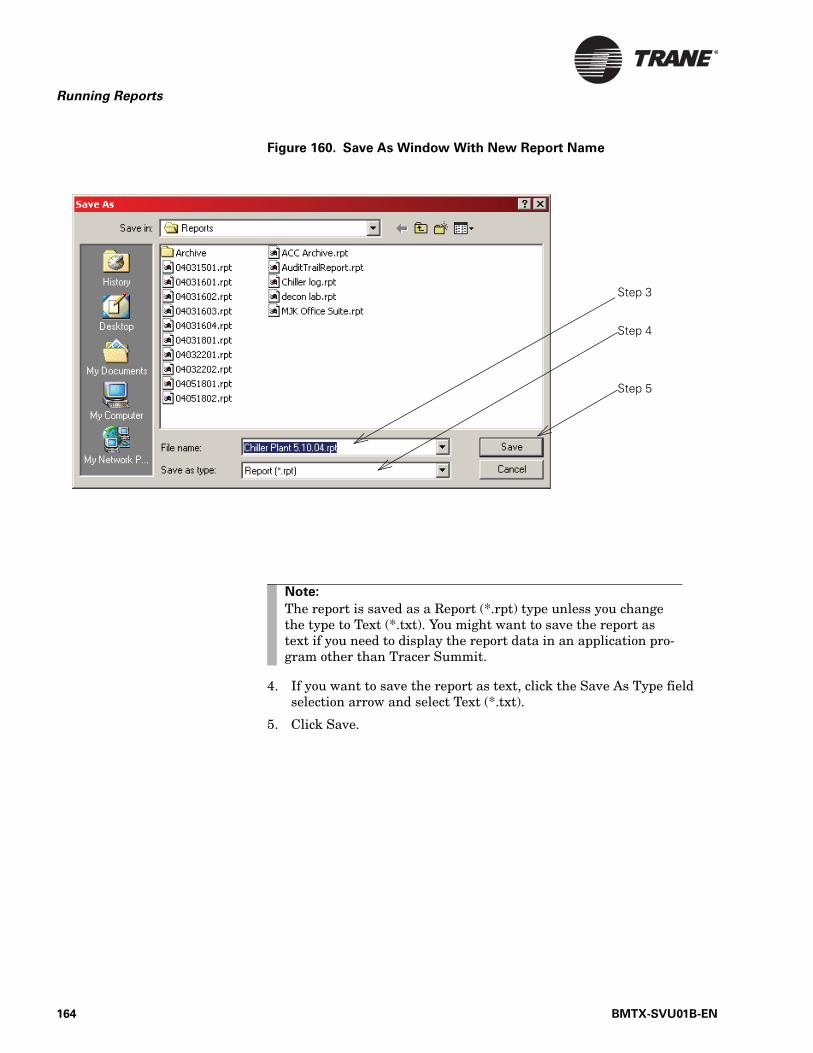
Running Reports
Figure 160. Save As Window With New Report Name
4. If you want to save the report as text, click the Save As Type field selection arrow and select Text (*.txt).
5. Click Save.
Note:
The report is saved as a Report (*.rpt) type unless you change the type to Text (*.txt). You might want to save the report as text if you need to display the report data in an application pro-gram other than Tracer Summit.
Step 3
Step 4
Step 5
164 BMTX-SVU01B-EN
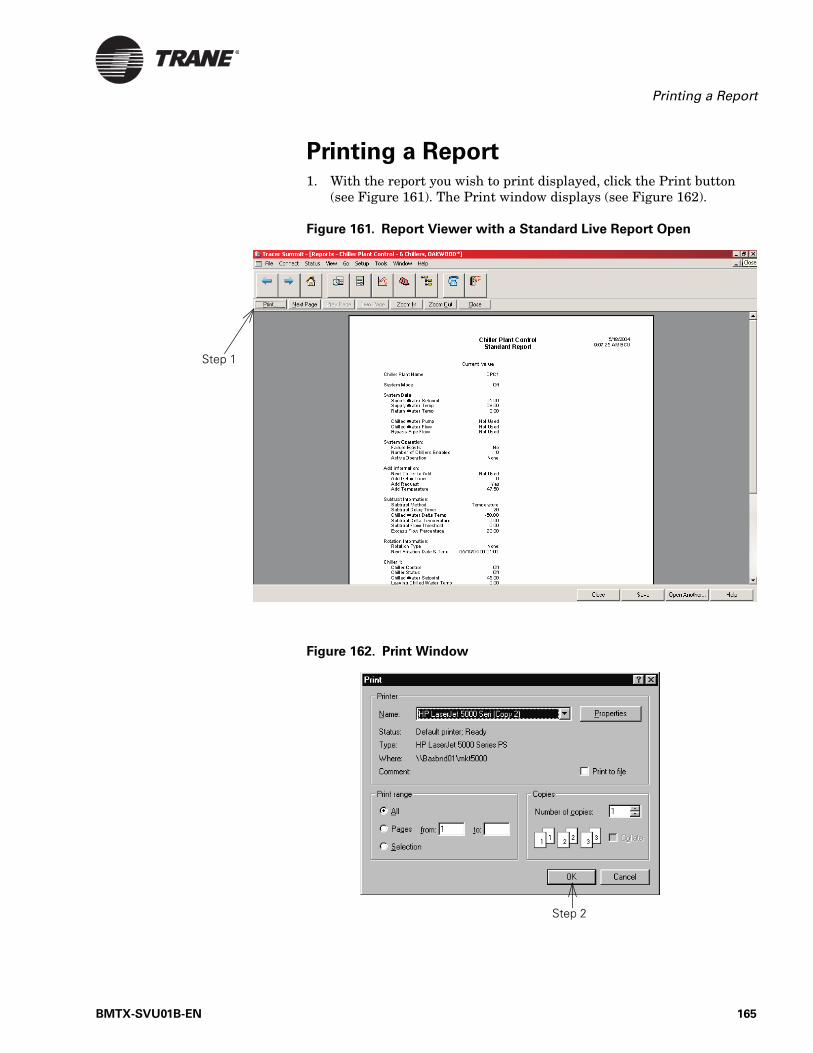
Printing a Report
Printing a Report1. With the report you wish to print displayed, click the Print button
(see Figure 161). The Print window displays (see Figure 162).
Figure 161. Report Viewer with a Standard Live Report Open
Figure 162. Print Window
Step 1
Step 2
BMTX-SVU01B-EN 165

Running Reports
2. To print the entire report, click OK.
Note:
To print selected pages, click the Pages button and type the page range desired in the From and To fields.
166 BMTX-SVU01B-EN
Chapter 11
Using the Trend Viewer
The Trend Viewer is a graphical representation of data collected by a trend object. It displays both live and historical data.
With the Trend Viewer you can:
• Plot overrides, alarms, and events related to the trended point• Plot audit trail data• View up to 10 properties• Save trend data in graphical format or as a CVS file• Print out data• View multiple graphs at one time
This chapter covers the following topics:
• “Setting up the Trend Viewer” on page 168• “Creating a Trend Viewer” on page 174• “Opening a Trend Viewer” on page 177• “Saving a New Trend Viewer” on page 181• “Adding to a Trend Viewer” on page 182• “Historical Trends in the Audit Trail Database” on page 190
Note:
To set up the Trend Viewer you must have security access rights. For further information, see your Site Security Adminis-trator.
BMTX-SVU01B-EN 167
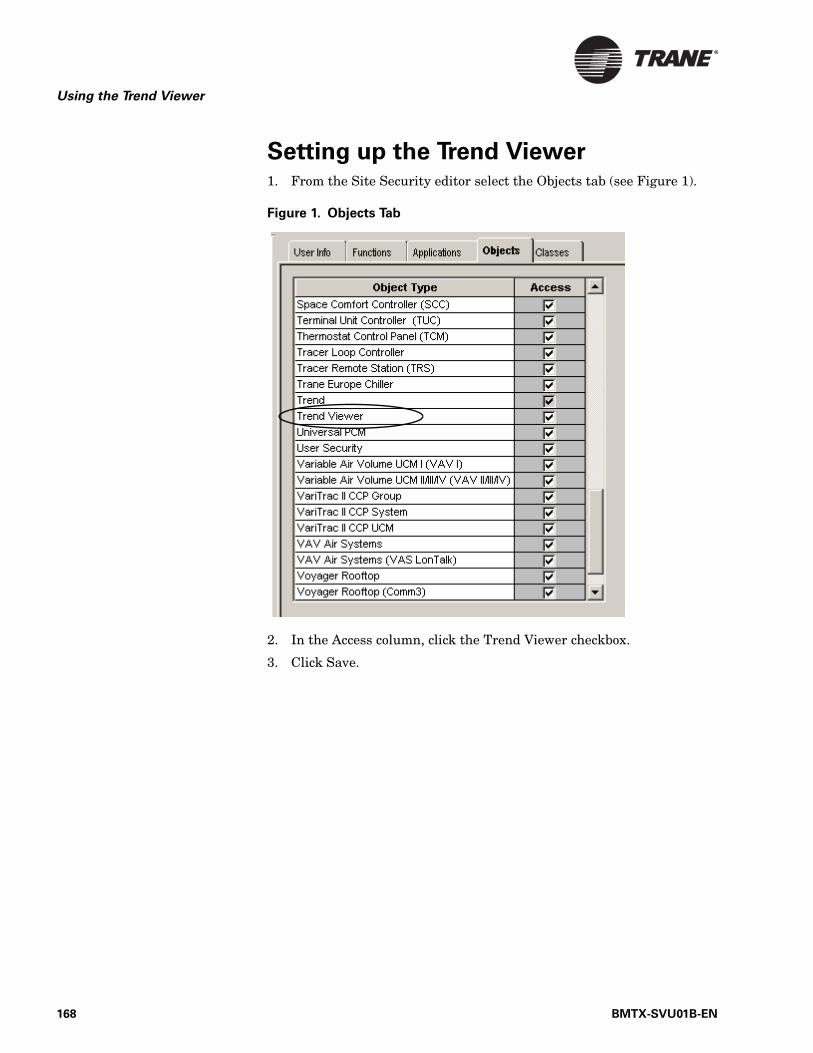
Using the Trend Viewer
Setting up the Trend Viewer1. From the Site Security editor select the Objects tab (see Figure 1).
Figure 1. Objects Tab
2. In the Access column, click the Trend Viewer checkbox.
3. Click Save.
168 BMTX-SVU01B-EN

Setting up the Trend Viewer
4. Click the Applications tab (see Figure 2).
5. Select View Only or View/Edit checkbox for the Trend Viewer.
6. Click Save.
7. Click Close.
Figure 2. Applications Tab
BMTX-SVU01B-EN 169
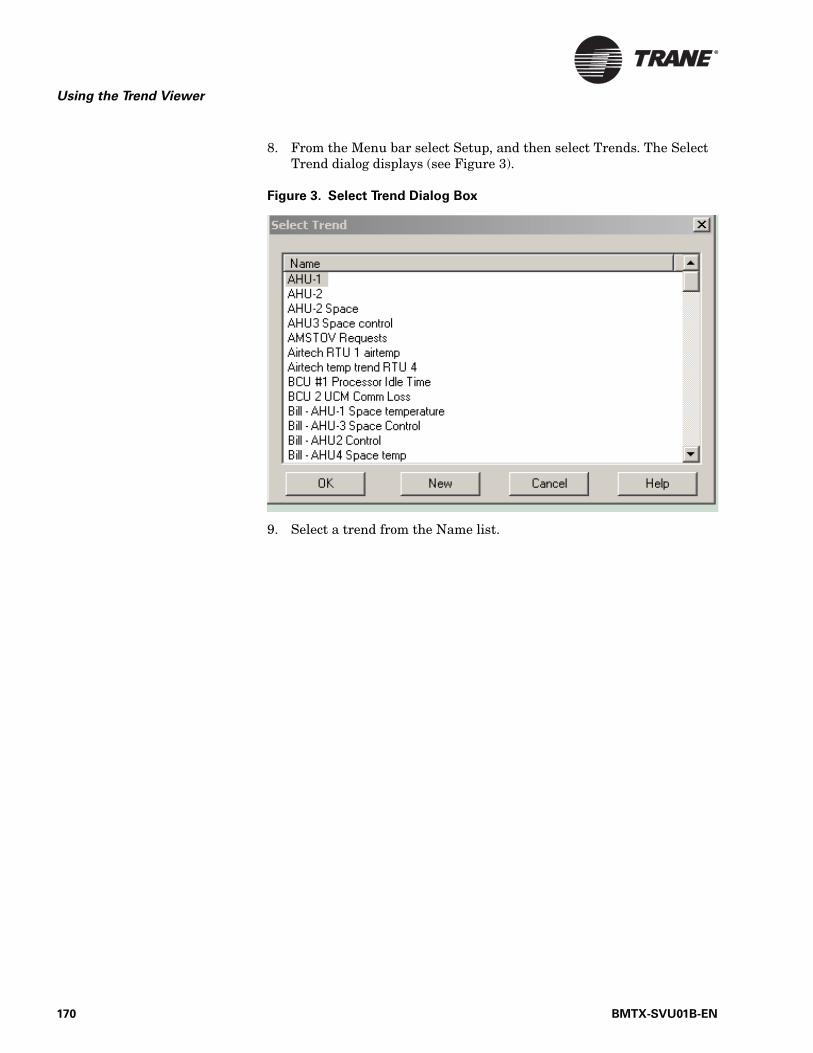
Using the Trend Viewer
8. From the Menu bar select Setup, and then select Trends. The Select Trend dialog displays (see Figure 3).
Figure 3. Select Trend Dialog Box
9. Select a trend from the Name list.
170 BMTX-SVU01B-EN
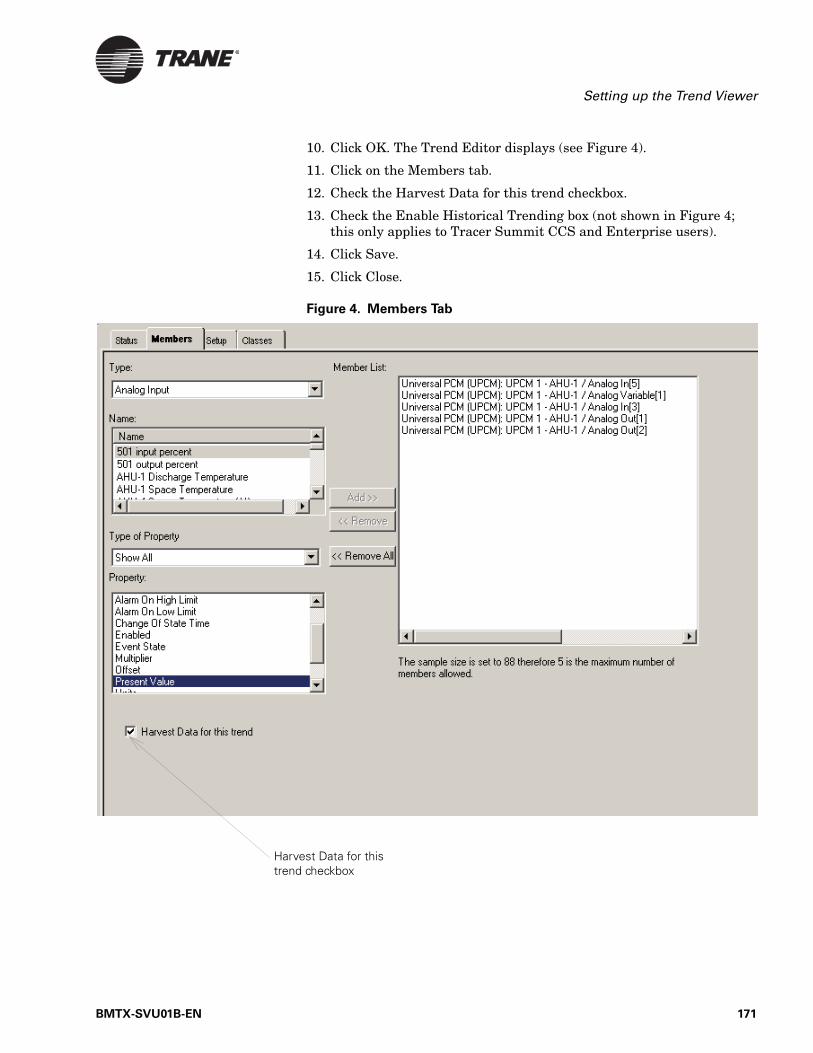
Setting up the Trend Viewer
10. Click OK. The Trend Editor displays (see Figure 4).
11. Click on the Members tab.
12. Check the Harvest Data for this trend checkbox.
13. Check the Enable Historical Trending box (not shown in Figure 4; this only applies to Tracer Summit CCS and Enterprise users).
14. Click Save.
15. Click Close.
Figure 4. Members Tab
Harvest Data for this trend checkbox
BMTX-SVU01B-EN 171
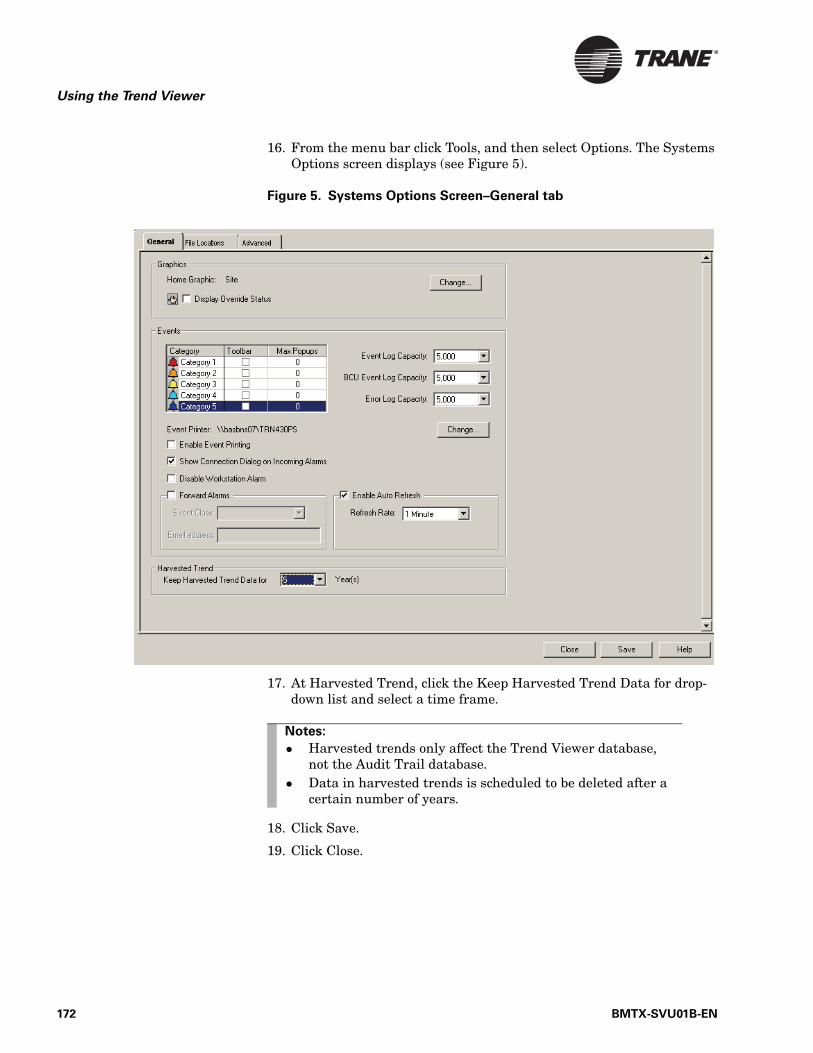
Using the Trend Viewer
16. From the menu bar click Tools, and then select Options. The Systems Options screen displays (see Figure 5).
Figure 5. Systems Options Screen–General tab
17. At Harvested Trend, click the Keep Harvested Trend Data for drop-down list and select a time frame.
18. Click Save.
19. Click Close.
Notes:
• Harvested trends only affect the Trend Viewer database, not the Audit Trail database.
• Data in harvested trends is scheduled to be deleted after a certain number of years.
172 BMTX-SVU01B-EN

Setting up the Trend Viewer
Setting up Properties from Pop-up Menus in a Graphic
In order to display a pop-up window with the Open Trend Viewer option available as shown in Figure 6, a property within a graphic must meet the following conditions:
The property must be trendable
And:
The property must be one of five status points:
• Status text• Analog in 5 color• Binary text• Animation• Slider
Or one of three control point types:
• Setpoint control• Binary checkbox control• Selection list control
Figure 6. Displaying a Pop-up Window from a Graphic
BMTX-SVU01B-EN 173

Using the Trend Viewer
Creating a Trend ViewerYou can create a Trend Viewer from the following:
• The Setup menu• A property in a graphic
Creating a Trend Viewer From the Setup Menu
1. From the Setup menu, select Trend Viewer. The Select Trend Viewer Object dialog box displays (see Figure 7).
Figure 7. The Select Trend Viewer Object Dialog Box
174 BMTX-SVU01B-EN
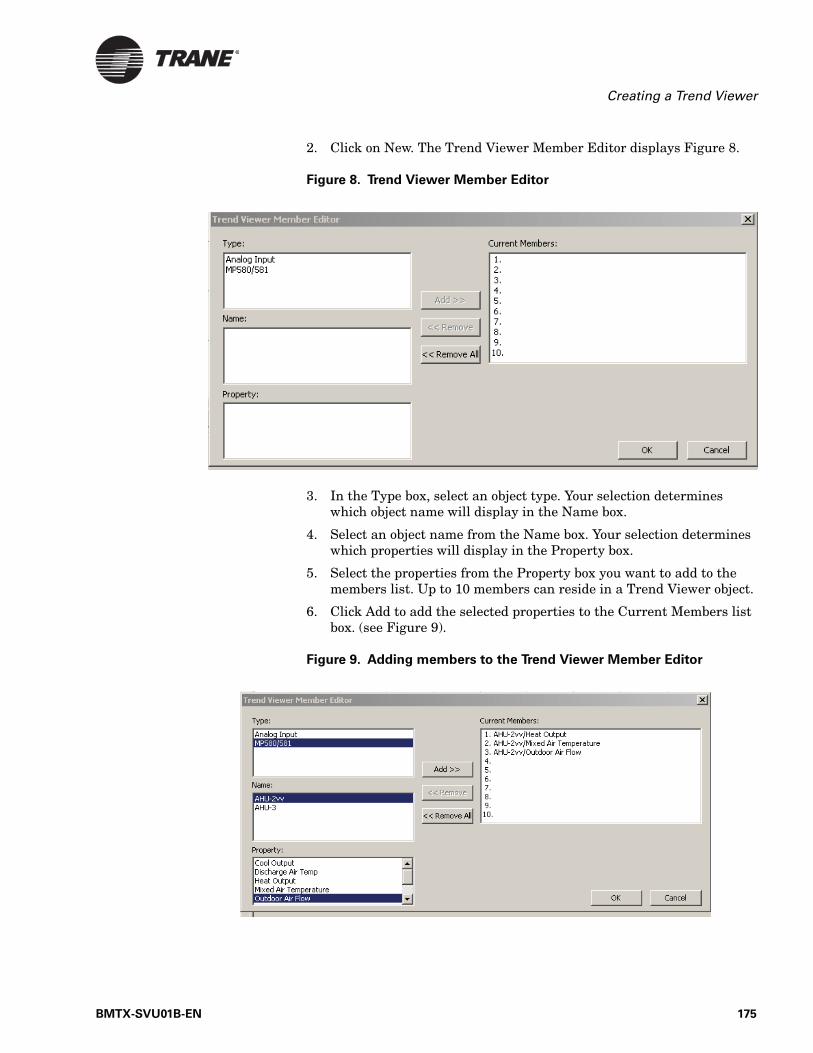
Creating a Trend Viewer
2. Click on New. The Trend Viewer Member Editor displays Figure 8.
Figure 8. Trend Viewer Member Editor
3. In the Type box, select an object type. Your selection determines which object name will display in the Name box.
4. Select an object name from the Name box. Your selection determines which properties will display in the Property box.
5. Select the properties from the Property box you want to add to the members list. Up to 10 members can reside in a Trend Viewer object.
6. Click Add to add the selected properties to the Current Members list box. (see Figure 9).
Figure 9. Adding members to the Trend Viewer Member Editor
BMTX-SVU01B-EN 175
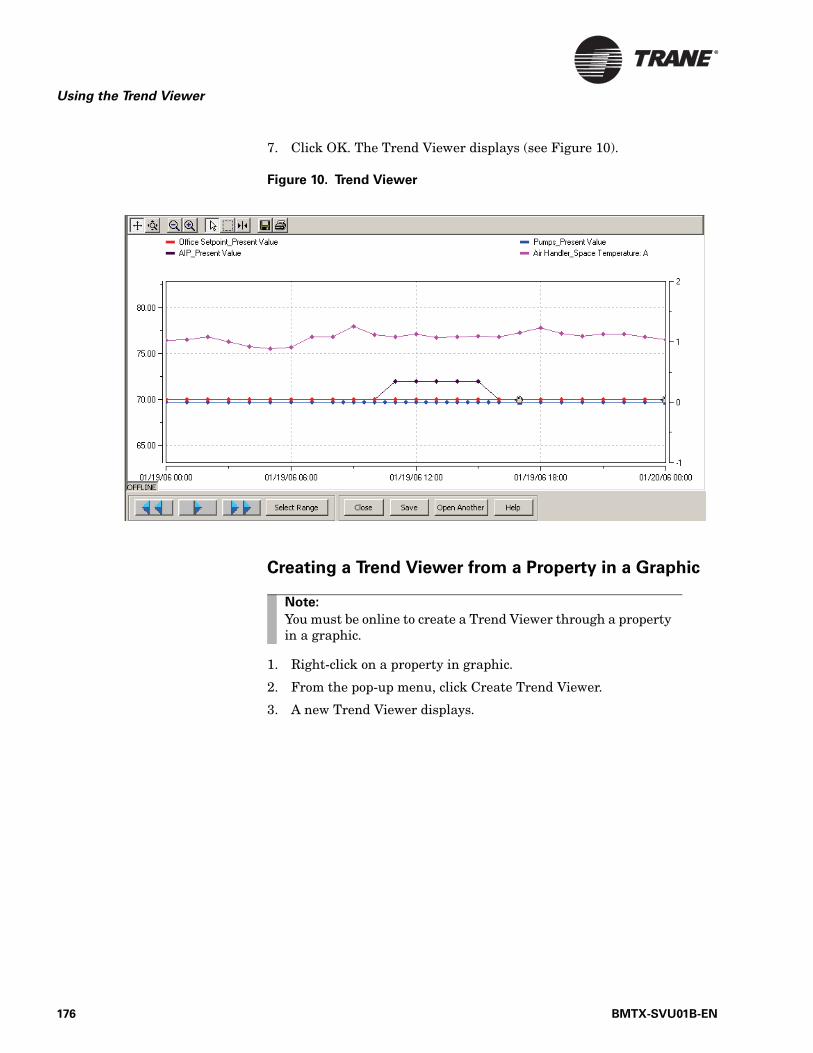
Using the Trend Viewer
7. Click OK. The Trend Viewer displays (see Figure 10).
Figure 10. Trend Viewer
Creating a Trend Viewer from a Property in a Graphic
1. Right-click on a property in graphic.
2. From the pop-up menu, click Create Trend Viewer.
3. A new Trend Viewer displays.
Note:
You must be online to create a Trend Viewer through a property in a graphic.
176 BMTX-SVU01B-EN
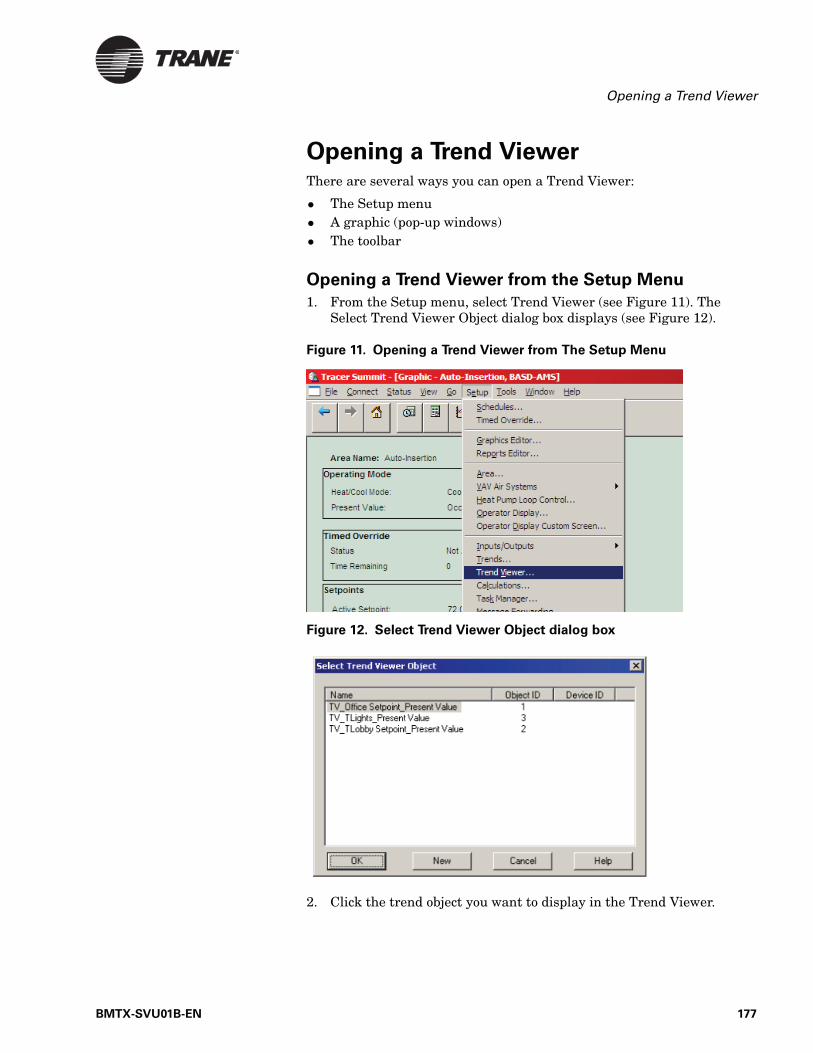
Opening a Trend Viewer
Opening a Trend ViewerThere are several ways you can open a Trend Viewer:
• The Setup menu• A graphic (pop-up windows)• The toolbar
Opening a Trend Viewer from the Setup Menu
1. From the Setup menu, select Trend Viewer (see Figure 11). The Select Trend Viewer Object dialog box displays (see Figure 12).
Figure 11. Opening a Trend Viewer from The Setup Menu
Figure 12. Select Trend Viewer Object dialog box
2. Click the trend object you want to display in the Trend Viewer.
BMTX-SVU01B-EN 177

Using the Trend Viewer
3. Click OK. The Trend Viewer displays (see Figure 13).
Figure 13. Trend Viewer
Opening a Trend Viewer from a Graphic
1. Right-click on a property in a graphic to display the pop-up menu (see Figure 14).
Figure 14. Pop-up Menu in a Graphic
178 BMTX-SVU01B-EN
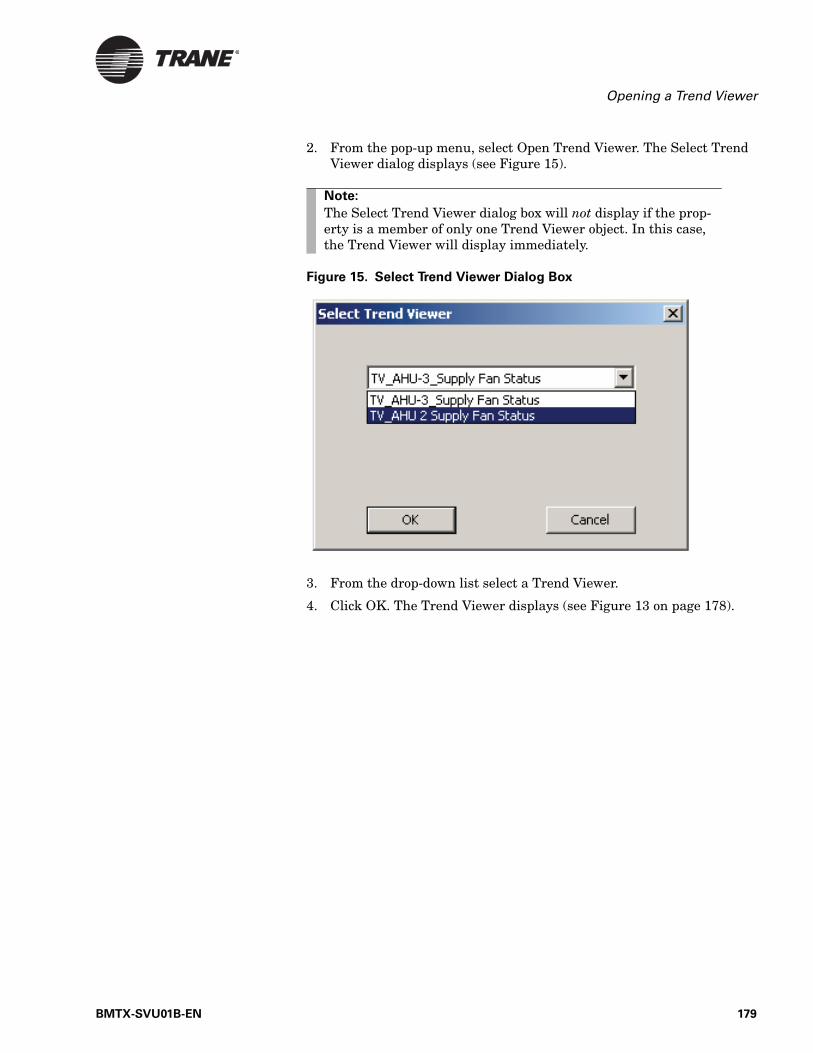
Opening a Trend Viewer
2. From the pop-up menu, select Open Trend Viewer. The Select Trend Viewer dialog displays (see Figure 15).
Figure 15. Select Trend Viewer Dialog Box
3. From the drop-down list select a Trend Viewer.
4. Click OK. The Trend Viewer displays (see Figure 13 on page 178).
Note:
The Select Trend Viewer dialog box will not display if the prop-erty is a member of only one Trend Viewer object. In this case, the Trend Viewer will display immediately.
BMTX-SVU01B-EN 179
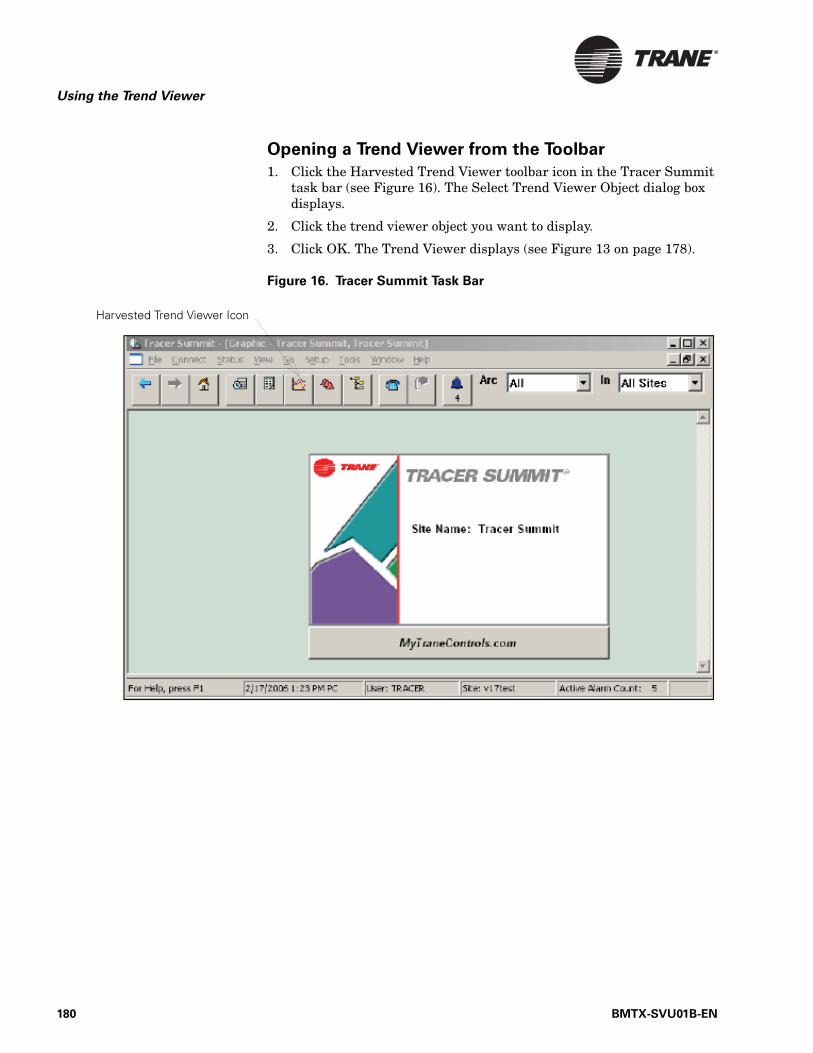
Using the Trend Viewer
Opening a Trend Viewer from the Toolbar
1. Click the Harvested Trend Viewer toolbar icon in the Tracer Summit task bar (see Figure 16). The Select Trend Viewer Object dialog box displays.
2. Click the trend viewer object you want to display.
3. Click OK. The Trend Viewer displays (see Figure 13 on page 178).
Figure 16. Tracer Summit Task Bar
Harvested Trend Viewer Icon
180 BMTX-SVU01B-EN

Opening a Trend Viewer
Saving a New Trend Viewer
1. After the new Trend Viewer displays, click Save. The New Trending Names dialog box displays (see Figure 17).
Figure 17. The New Trending Names Dialog Box
2. In the New Trend Viewer Name field you can type in a name for the Trend Viewer object, or keep the default name.
3. In the New Trend Name field, you can type in a name of the new trend object or you can keep the default name.
4. In the Sampling Interval drop-down list, select how fast you want the trend object to collect samples. The default time is one minute.
5. Click OK.
BMTX-SVU01B-EN 181
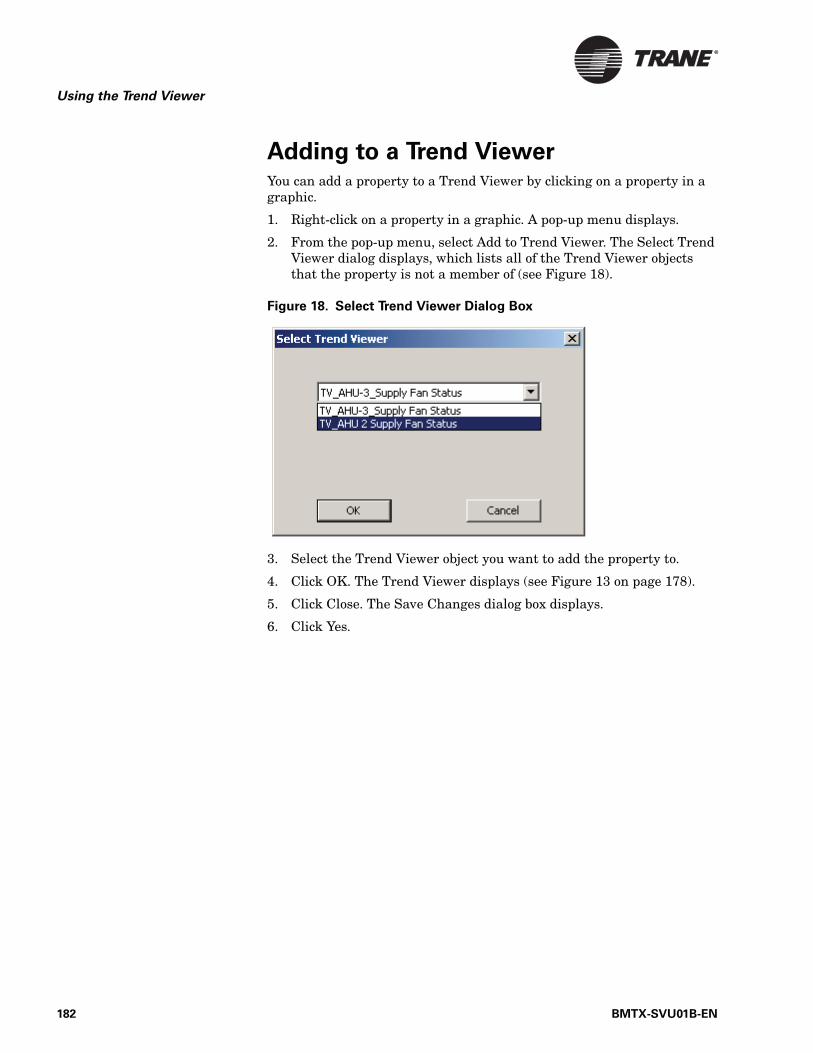
Using the Trend Viewer
Adding to a Trend ViewerYou can add a property to a Trend Viewer by clicking on a property in a graphic.
1. Right-click on a property in a graphic. A pop-up menu displays.
2. From the pop-up menu, select Add to Trend Viewer. The Select Trend Viewer dialog displays, which lists all of the Trend Viewer objects that the property is not a member of (see Figure 18).
Figure 18. Select Trend Viewer Dialog Box
3. Select the Trend Viewer object you want to add the property to.
4. Click OK. The Trend Viewer displays (see Figure 13 on page 178).
5. Click Close. The Save Changes dialog box displays.
6. Click Yes.
182 BMTX-SVU01B-EN
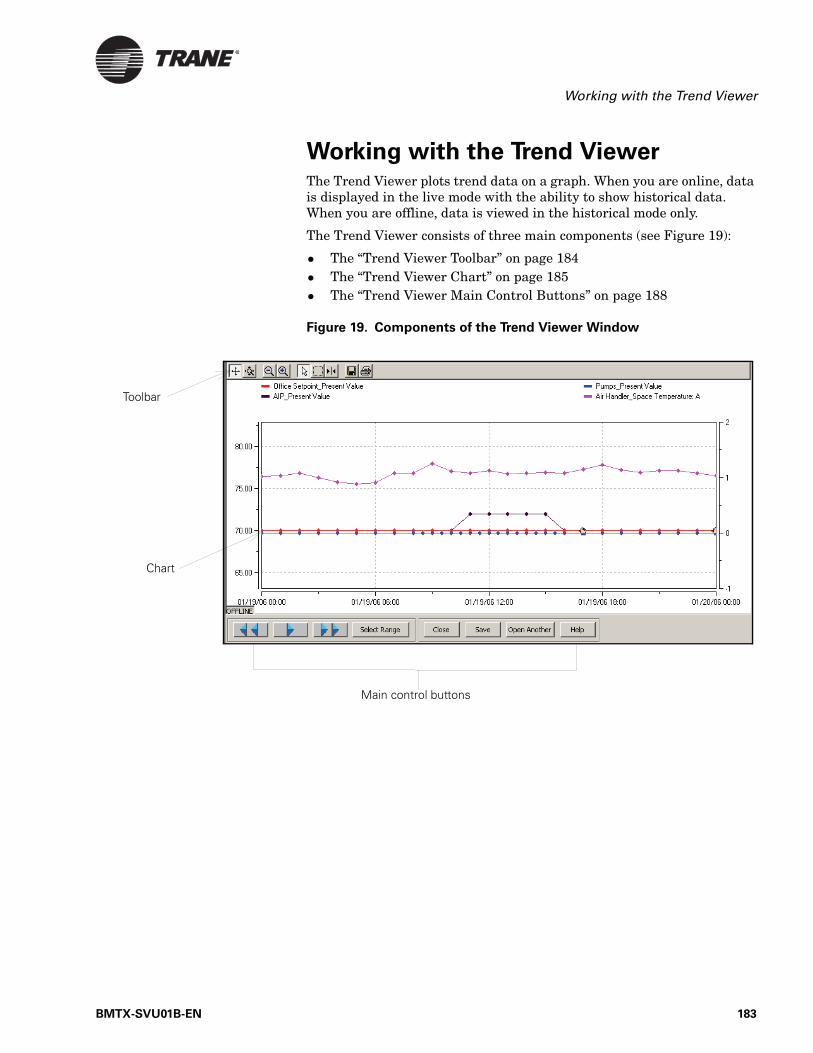
Working with the Trend Viewer
Working with the Trend ViewerThe Trend Viewer plots trend data on a graph. When you are online, data is displayed in the live mode with the ability to show historical data. When you are offline, data is viewed in the historical mode only.
The Trend Viewer consists of three main components (see Figure 19):
• The “Trend Viewer Toolbar” on page 184• The “Trend Viewer Chart” on page 185• The “Trend Viewer Main Control Buttons” on page 188
Figure 19. Components of the Trend Viewer Window
Main control buttons
Toolbar
Chart
BMTX-SVU01B-EN 183
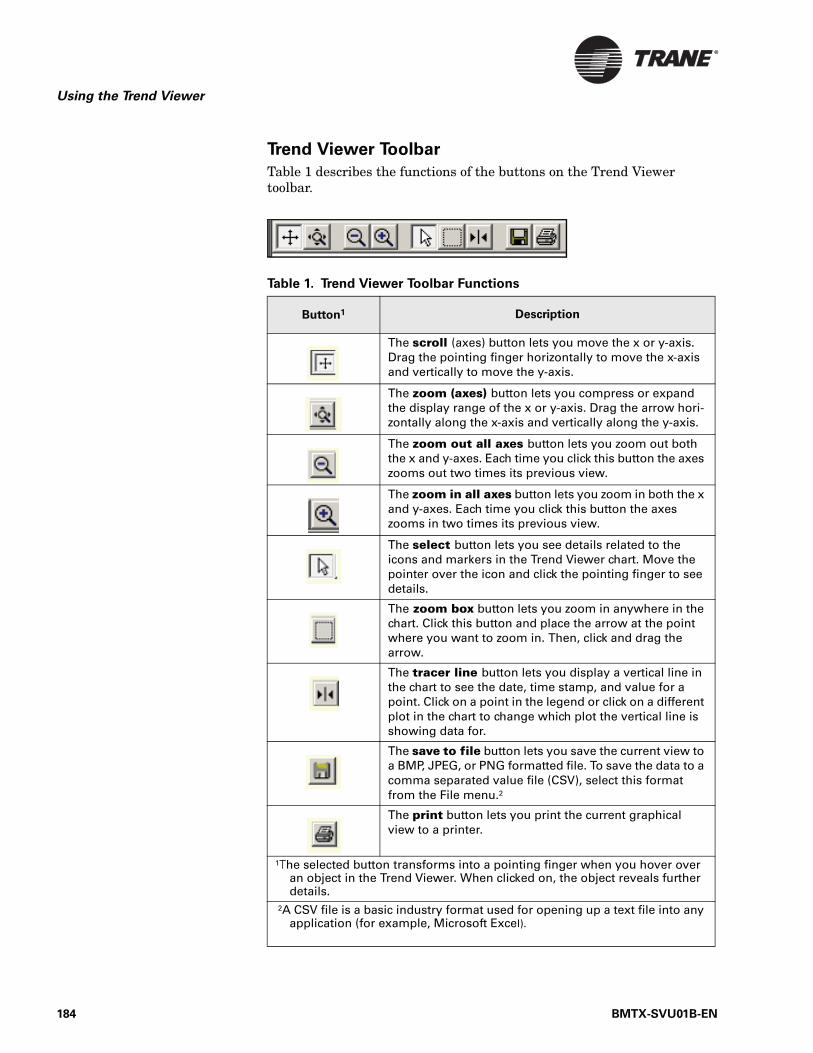
Using the Trend Viewer
Trend Viewer Toolbar
Table 1 describes the functions of the buttons on the Trend Viewer toolbar.
Table 1. Trend Viewer Toolbar Functions
Button1 Description
The scroll (axes) button lets you move the x or y-axis. Drag the pointing finger horizontally to move the x-axis and vertically to move the y-axis.
The zoom (axes) button lets you compress or expand the display range of the x or y-axis. Drag the arrow hori-zontally along the x-axis and vertically along the y-axis.
The zoom out all axes button lets you zoom out both the x and y-axes. Each time you click this button the axes zooms out two times its previous view.
The zoom in all axes button lets you zoom in both the x and y-axes. Each time you click this button the axes zooms in two times its previous view.
The select button lets you see details related to the icons and markers in the Trend Viewer chart. Move the pointer over the icon and click the pointing finger to see details.
The zoom box button lets you zoom in anywhere in the chart. Click this button and place the arrow at the point where you want to zoom in. Then, click and drag the arrow.
The tracer line button lets you display a vertical line in the chart to see the date, time stamp, and value for a point. Click on a point in the legend or click on a different plot in the chart to change which plot the vertical line is showing data for.
The save to file button lets you save the current view to a BMP, JPEG, or PNG formatted file. To save the data to a comma separated value file (CSV), select this format from the File menu.2
The print button lets you print the current graphical view to a printer.
1The selected button transforms into a pointing finger when you hover over an object in the Trend Viewer. When clicked on, the object reveals further details.
2A CSV file is a basic industry format used for opening up a text file into any application (for example, Microsoft Excel).
184 BMTX-SVU01B-EN
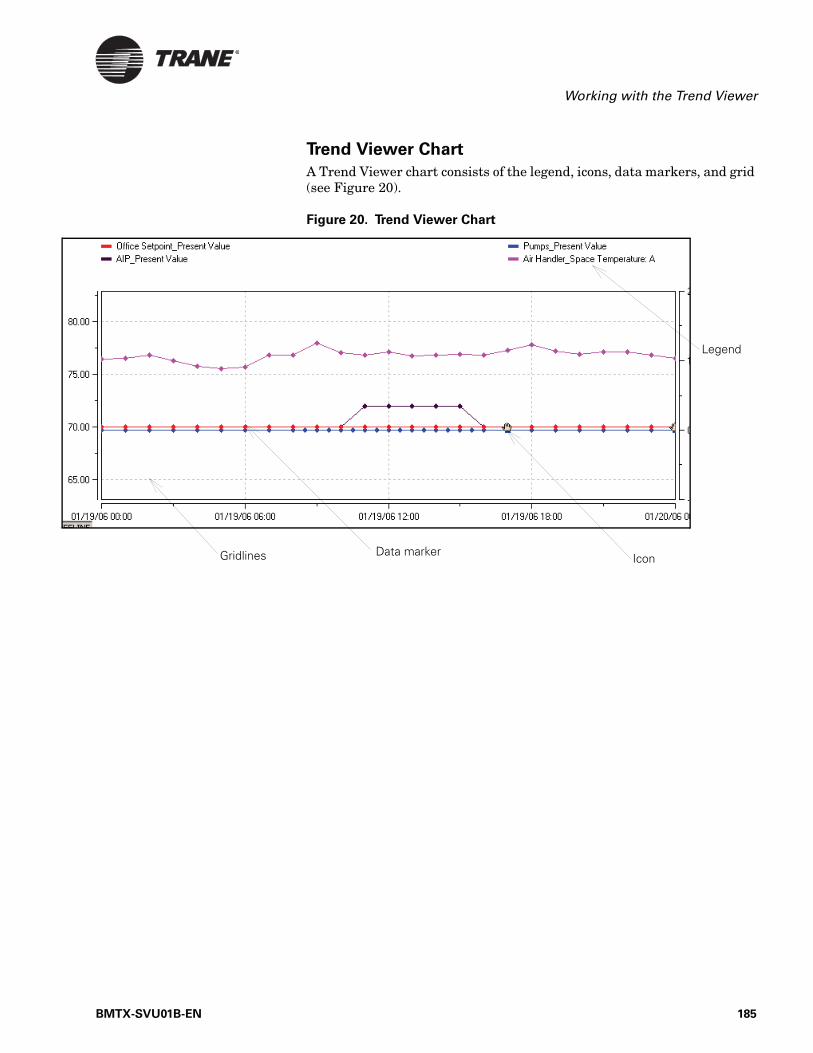
Working with the Trend Viewer
Trend Viewer Chart
A Trend Viewer chart consists of the legend, icons, data markers, and grid (see Figure 20).
Figure 20. Trend Viewer Chart
Legend
Gridlines Data marker Icon
BMTX-SVU01B-EN 185
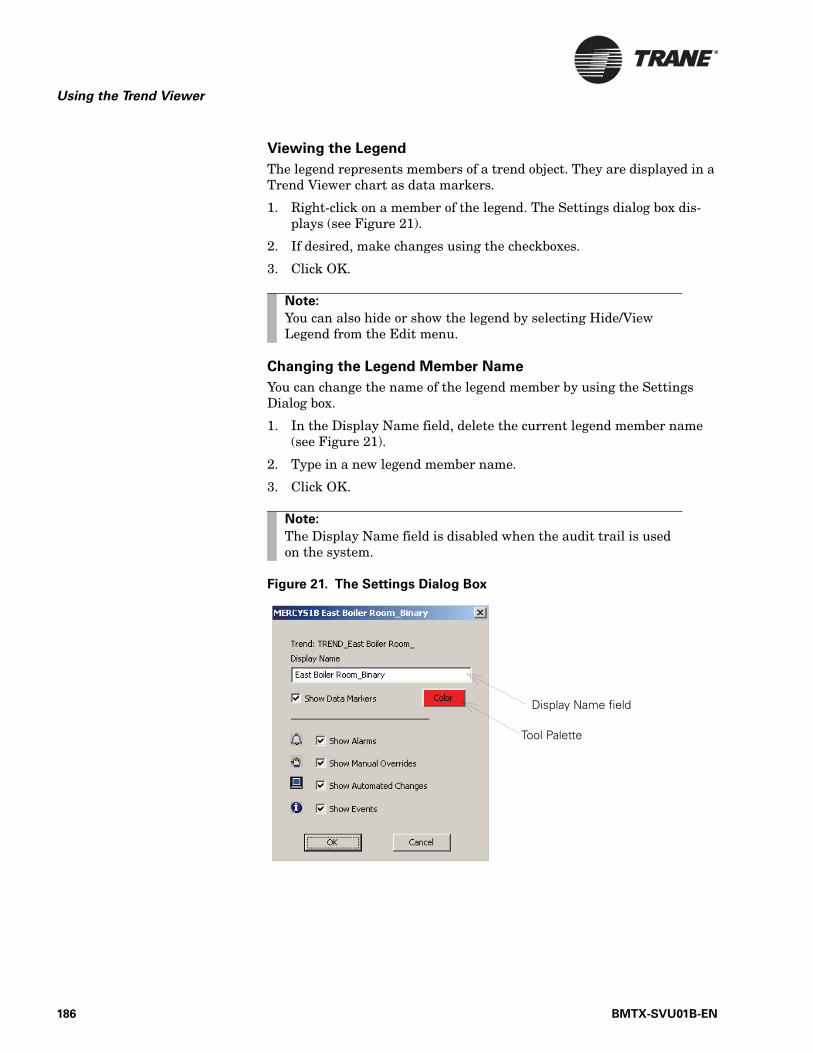
Using the Trend Viewer
Viewing the Legend
The legend represents members of a trend object. They are displayed in a Trend Viewer chart as data markers.
1. Right-click on a member of the legend. The Settings dialog box dis-plays (see Figure 21).
2. If desired, make changes using the checkboxes.
3. Click OK.
Changing the Legend Member Name
You can change the name of the legend member by using the Settings Dialog box.
1. In the Display Name field, delete the current legend member name (see Figure 21).
2. Type in a new legend member name.
3. Click OK.
Figure 21. The Settings Dialog Box
Note:
You can also hide or show the legend by selecting Hide/View Legend from the Edit menu.
Note:
The Display Name field is disabled when the audit trail is used on the system.
Tool Palette
Display Name field
186 BMTX-SVU01B-EN
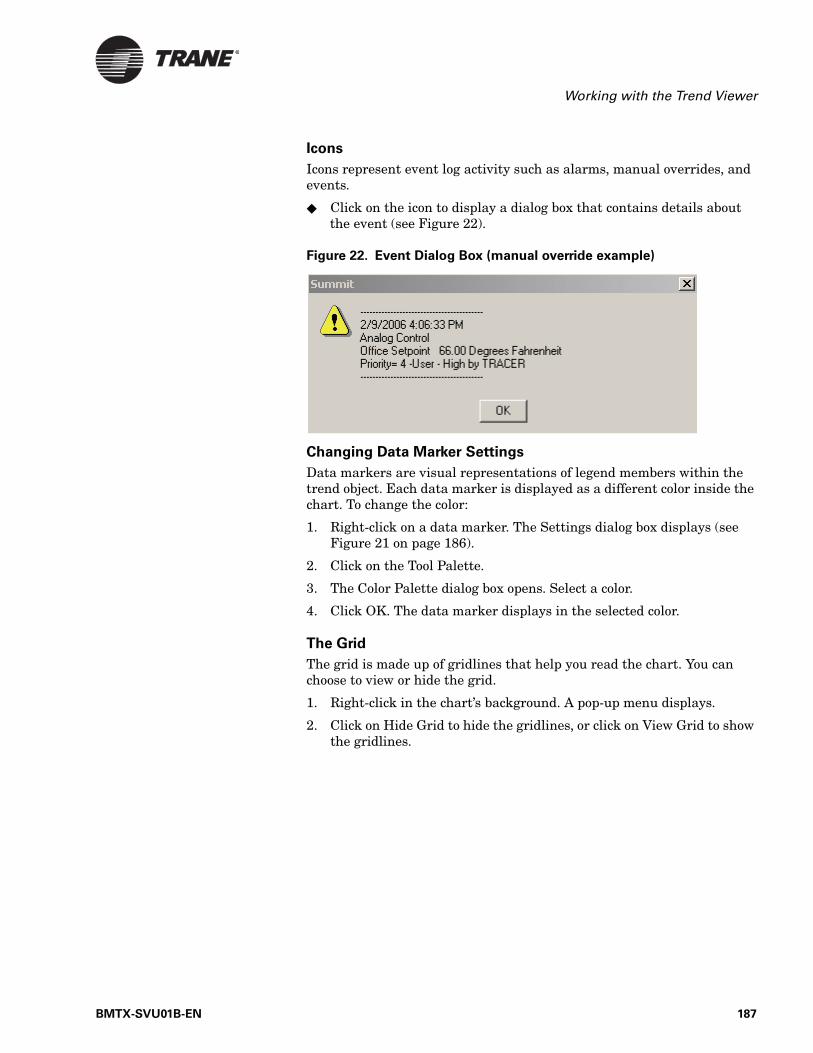
Working with the Trend Viewer
Icons
Icons represent event log activity such as alarms, manual overrides, and events.
Click on the icon to display a dialog box that contains details about the event (see Figure 22).
Figure 22. Event Dialog Box (manual override example)
Changing Data Marker Settings
Data markers are visual representations of legend members within the trend object. Each data marker is displayed as a different color inside the chart. To change the color:
1. Right-click on a data marker. The Settings dialog box displays (see Figure 21 on page 186).
2. Click on the Tool Palette.
3. The Color Palette dialog box opens. Select a color.
4. Click OK. The data marker displays in the selected color.
The Grid
The grid is made up of gridlines that help you read the chart. You can choose to view or hide the grid.
1. Right-click in the chart’s background. A pop-up menu displays.
2. Click on Hide Grid to hide the gridlines, or click on View Grid to show the gridlines.
BMTX-SVU01B-EN 187
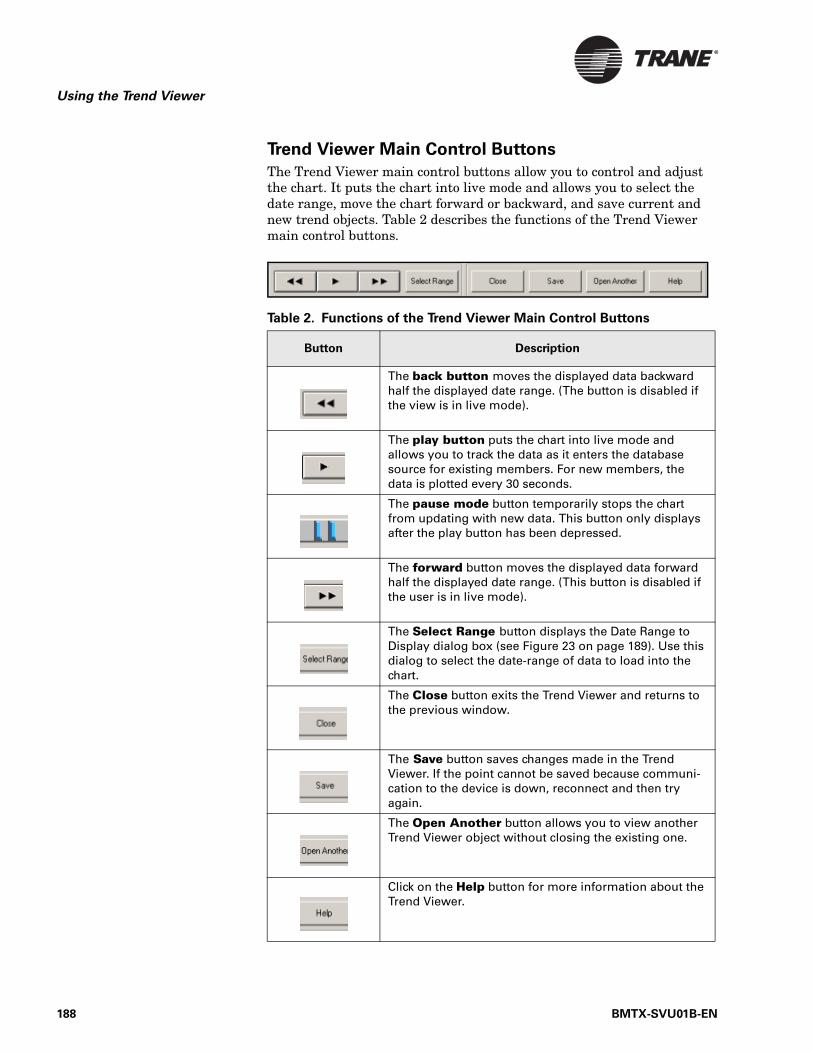
Using the Trend Viewer
Trend Viewer Main Control Buttons
The Trend Viewer main control buttons allow you to control and adjust the chart. It puts the chart into live mode and allows you to select the date range, move the chart forward or backward, and save current and new trend objects. Table 2 describes the functions of the Trend Viewer main control buttons.
Table 2. Functions of the Trend Viewer Main Control Buttons
Button Description
The back button moves the displayed data backward half the displayed date range. (The button is disabled if the view is in live mode).
The play button puts the chart into live mode and allows you to track the data as it enters the database source for existing members. For new members, the data is plotted every 30 seconds.
The pause mode button temporarily stops the chart from updating with new data. This button only displays after the play button has been depressed.
The forward button moves the displayed data forward half the displayed date range. (This button is disabled if the user is in live mode).
The Select Range button displays the Date Range to Display dialog box (see Figure 23 on page 189). Use this dialog to select the date-range of data to load into the chart.
The Close button exits the Trend Viewer and returns to the previous window.
The Save button saves changes made in the Trend Viewer. If the point cannot be saved because communi-cation to the device is down, reconnect and then try again.
The Open Another button allows you to view another Trend Viewer object without closing the existing one.
Click on the Help button for more information about the Trend Viewer.
188 BMTX-SVU01B-EN
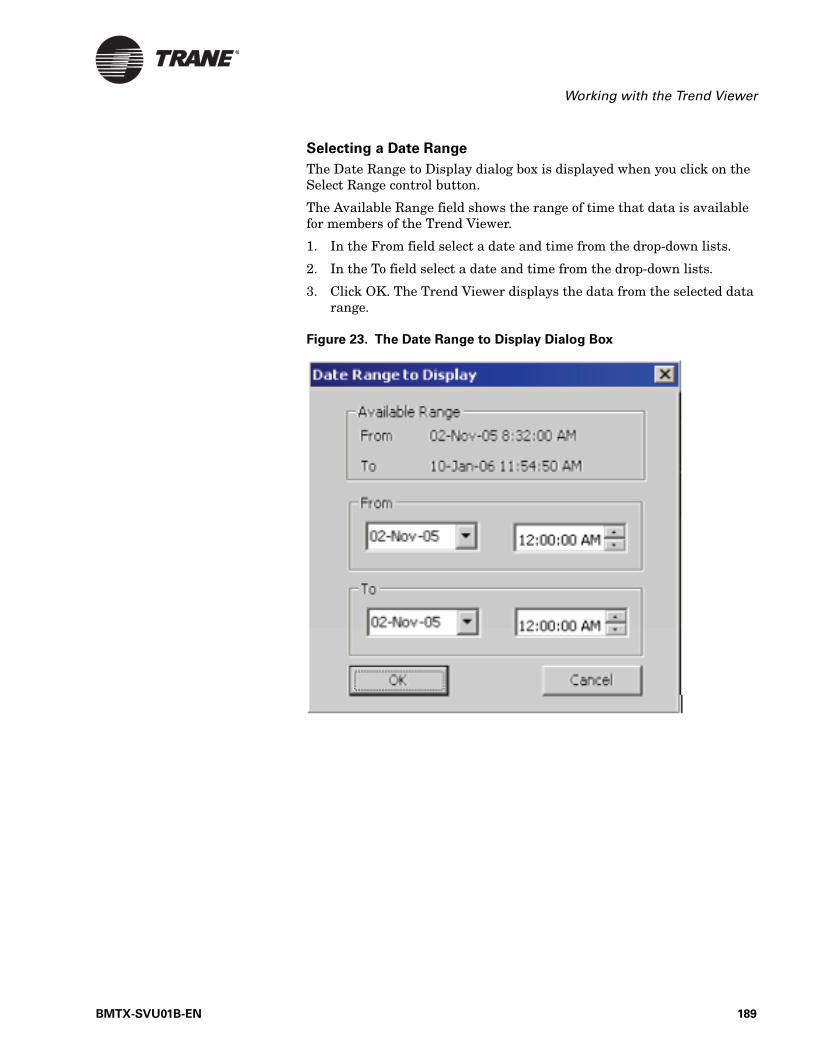
Working with the Trend Viewer
Selecting a Date Range
The Date Range to Display dialog box is displayed when you click on the Select Range control button.
The Available Range field shows the range of time that data is available for members of the Trend Viewer.
1. In the From field select a date and time from the drop-down lists.
2. In the To field select a date and time from the drop-down lists.
3. Click OK. The Trend Viewer displays the data from the selected data range.
Figure 23. The Date Range to Display Dialog Box
BMTX-SVU01B-EN 189

Using the Trend Viewer
Historical Trends in the Audit Trail
DatabaseHistorical trending is used to display data from the Audit Trail database in a Trend Viewer. It is enabled in the Trend editor by checking the Enable Historical Trending checkbox.
Viewing Historical Trends
1. From the Status menu, Select the Audit Trail Trend Viewer. The Select Historical Trends dialog box displays (see Figure 24).
Figure 24. Select Historical Trends Dialog Box
Note:
Historical trending is only available if you are registered to use either the Tracer Summit CCS or Enterprise packages. For more information about historical trends, refer to the Tracer Summit CCS System Programming guide.
Note:
You must be online to use the Audit Trail.
190 BMTX-SVU01B-EN

Historical Trends in the Audit Trail Database
2. In the Database Source list, select a database:
• Audit Trail SQL Database—displays current data• Archived Audit Trail SQL Database—displays historical data• Previously Archived Audit Trail SQL Database—displays histori-
cal data.3. In the Select Historical Trends list, select up to 10 historical trends.
4. In the Select Range drop-down list, specify a date and time range you want displayed in the Trend Viewer.
5. Click OK. The Trend Viewer displays.
BMTX-SVU01B-EN 191

Using the Trend Viewer
192 BMTX-SVU01B-EN
Chapter 12
Backing up Tracer Summit
You need to back up data to prevent any accidental loss of information in the event of an accidental corruption of data or a hard disk failure. The backup procedures allow you to save copies of the site database, graphic files, and report files to other locations.
There are four types of backup procedures available in Tracer Summit:
• Back up locations (sites and groups)• Back up graphics• Back up reports• Back up custom screens (BCUs with operator display panels only)
When backing up a site or group, you can choose to back up custom pro-gramming language (CPL) files.
You should back up information on a routine basis, such as once per week, and before modifying or deleting any objects in an existing site (BCUs, PC Workstations, or UCMs).
Note:
Backup of groups is only available with the Enterprise Manage-ment package.
Note:
You may not have access to all of the tasks presented in this guide. Your access privileges depend on your user profile. Con-tact your security supervisor for information.
BMTX-SVU01B-EN 193
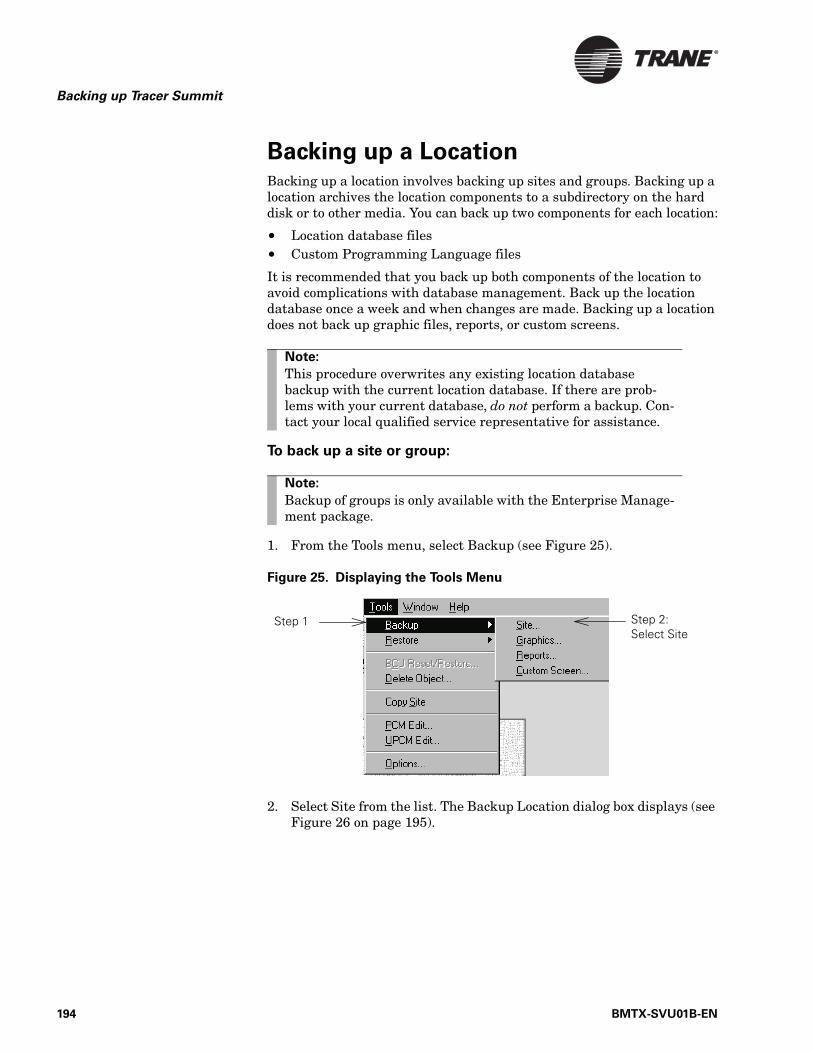
Backing up Tracer Summit
Backing up a LocationBacking up a location involves backing up sites and groups. Backing up a location archives the location components to a subdirectory on the hard disk or to other media. You can back up two components for each location:
• Location database files• Custom Programming Language files
It is recommended that you back up both components of the location to avoid complications with database management. Back up the location database once a week and when changes are made. Backing up a location does not back up graphic files, reports, or custom screens.
To back up a site or group:
1. From the Tools menu, select Backup (see Figure 25).
Figure 25. Displaying the Tools Menu
2. Select Site from the list. The Backup Location dialog box displays (see Figure 26 on page 195).
Note:
This procedure overwrites any existing location database backup with the current location database. If there are prob-lems with your current database, do not perform a backup. Con-tact your local qualified service representative for assistance.
Note:
Backup of groups is only available with the Enterprise Manage-ment package.
Step 1 Step 2: Select Site
194 BMTX-SVU01B-EN
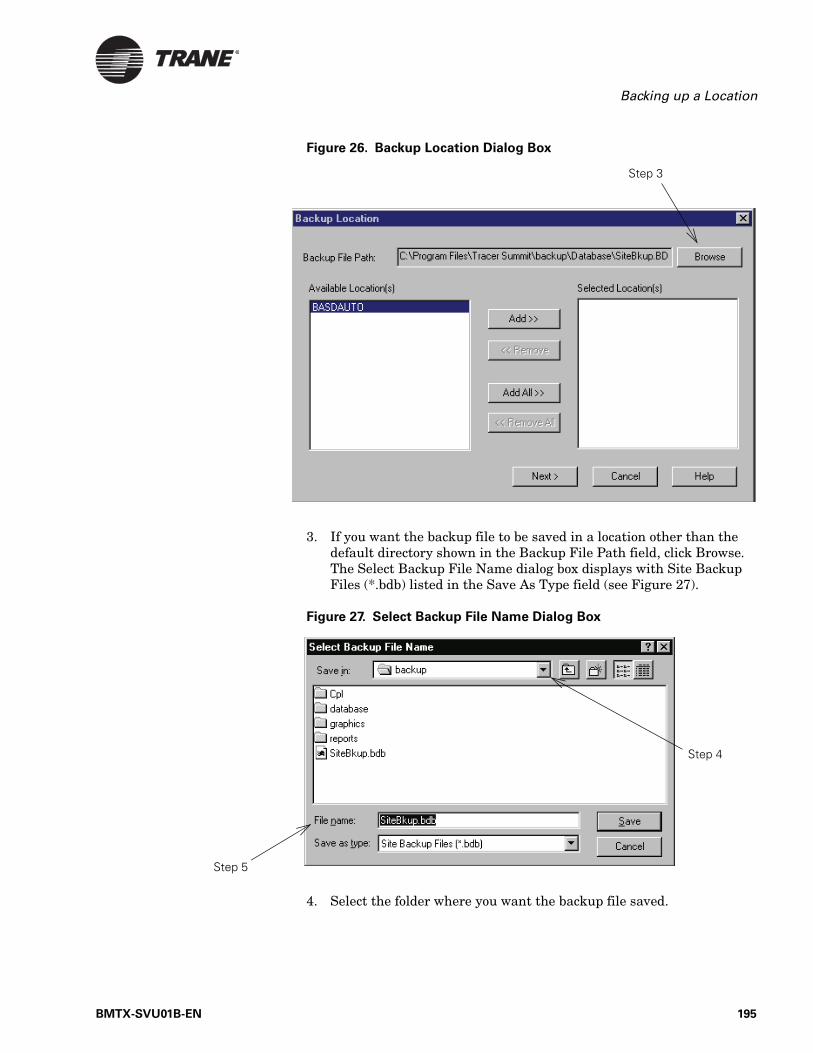
Backing up a Location
Figure 26. Backup Location Dialog Box
3. If you want the backup file to be saved in a location other than the default directory shown in the Backup File Path field, click Browse. The Select Backup File Name dialog box displays with Site Backup Files (*.bdb) listed in the Save As Type field (see Figure 27).
Figure 27. Select Backup File Name Dialog Box
4. Select the folder where you want the backup file saved.
Step 3
Step 4
Step 5
BMTX-SVU01B-EN 195
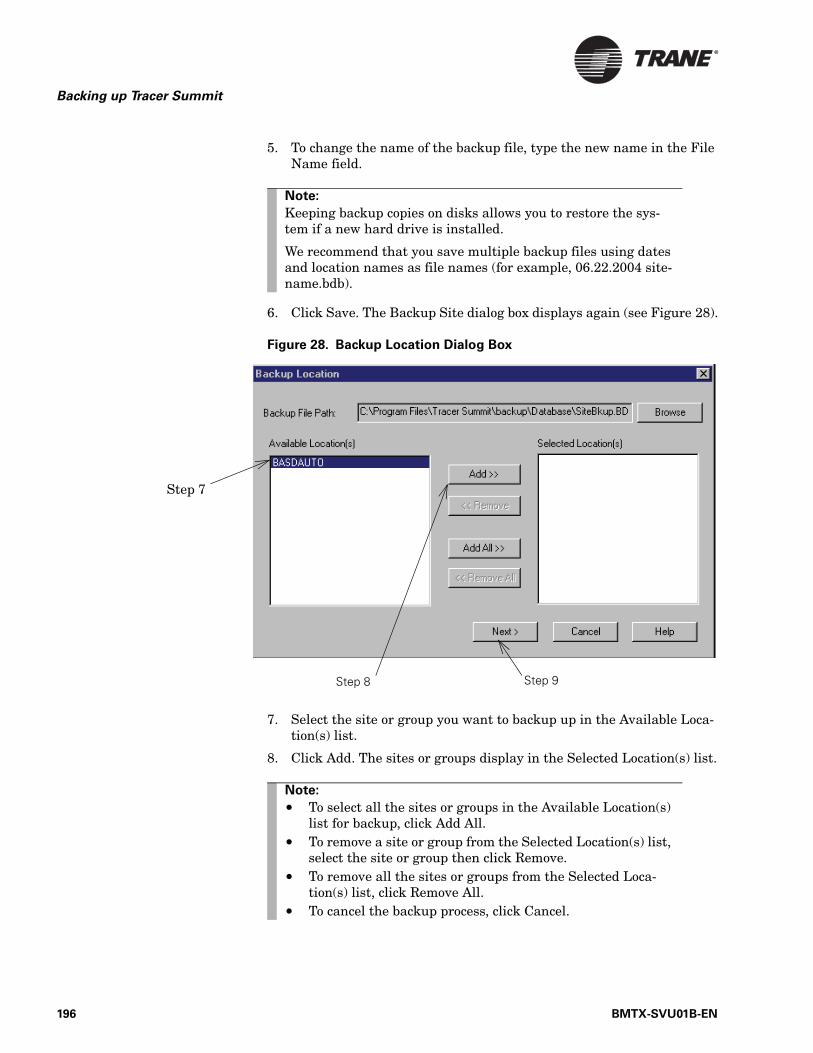
Backing up Tracer Summit
5. To change the name of the backup file, type the new name in the File Name field.
6. Click Save. The Backup Site dialog box displays again (see Figure 28).
Figure 28. Backup Location Dialog Box
7. Select the site or group you want to backup up in the Available Loca-tion(s) list.
8. Click Add. The sites or groups display in the Selected Location(s) list.
Note:
Keeping backup copies on disks allows you to restore the sys-tem if a new hard drive is installed.
We recommend that you save multiple backup files using dates and location names as file names (for example, 06.22.2004 site-name.bdb).
Step 7
Step 8 Step 9
Note:
• To select all the sites or groups in the Available Location(s) list for backup, click Add All.
• To remove a site or group from the Selected Location(s) list, select the site or group then click Remove.
• To remove all the sites or groups from the Selected Loca-tion(s) list, click Remove All.
• To cancel the backup process, click Cancel.
196 BMTX-SVU01B-EN
Backing up a Location
9. To continue the location backup process, click Next. The Backup CPL dialog box displays (see Figure 29).
In the Backup CPL dialog box, you can choose to back up custom pro-graming language files (CPL) in addition to the sites or groups you have chosen.
Figure 29. Backup CPL Dialog Box
10. Select the CPL file(s) you want to back up in the Available CPL File(s) list.
11. Click Add. The files display in the Selected CPL File(s) list.
Note:
If you do not need to backup CPL files, click Backup to begin the backup process (see Figure 30 on page 198).
Note:
The default location for CPL files you want to back up displays in the CPL Source Path field. The CPL Destination Path dis-plays the default location for the CPL backup files you create.
If you want to change either default location, click the Browse button next to the field. At the Browse for Folder dialog box, select the desired folder and click OK.
Step 10
Step 11Step 12
Note:
To select all the CPL files for backup, click Add All.
BMTX-SVU01B-EN 197
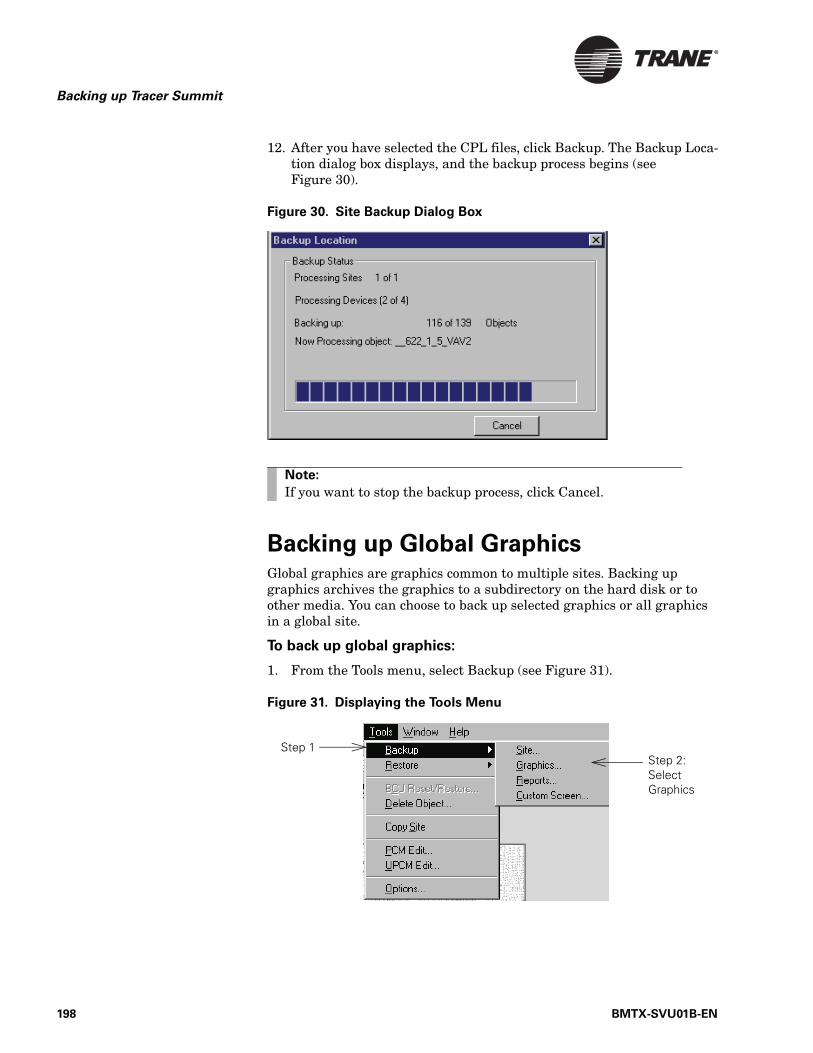
Backing up Tracer Summit
12. After you have selected the CPL files, click Backup. The Backup Loca-tion dialog box displays, and the backup process begins (see Figure 30).
Figure 30. Site Backup Dialog Box
Backing up Global GraphicsGlobal graphics are graphics common to multiple sites. Backing up graphics archives the graphics to a subdirectory on the hard disk or to other media. You can choose to back up selected graphics or all graphics in a global site.
To back up global graphics:
1. From the Tools menu, select Backup (see Figure 31).
Figure 31. Displaying the Tools Menu
Note:
If you want to stop the backup process, click Cancel.
Step 1Step 2: Select Graphics
198 BMTX-SVU01B-EN

Backing up Global Graphics
2. Select Graphics from the list. The Backup Graphic dialog box displays (see Figure 32).
Figure 32. Backup Graphic Dialog Box—Global Graphics
3. Click the Global Graphics button.
4. To select graphics for backup, select the desired name(s) listed under the Graphic Object Name heading.
5. Click OK.
Step 3
Step 4
Step 5
Note:
The Destination Path field shows where the global graphic backup files will be located. If you want to change the destina-tion path, click Browse. At the Browse for Folder dialog box, select a folder and click OK.
Note:
To select all the graphics, click Select All. All the graphics are highlighted.
To deselect the selected graphics, click Select None. The previ-ously selected graphics are no longer highlighted.
BMTX-SVU01B-EN 199

Backing up Tracer Summit
Backing up Site GraphicsSite graphics are graphics that are specific to one site. Backing up graph-ics archives the graphics to a subdirectory on a hard disk or to other media. You can choose to back up all graphics or selected graphics at a site.
To back up site graphics:
1. From the Tools Menu, select Backup (see Figure 33).
Figure 33. Displaying the Tools Menu
2. Select Graphics from the list. The Backup Graphic dialog box displays (see Figure 34 on page 201).
Step 1Step 2: Select Graphics
200 BMTX-SVU01B-EN
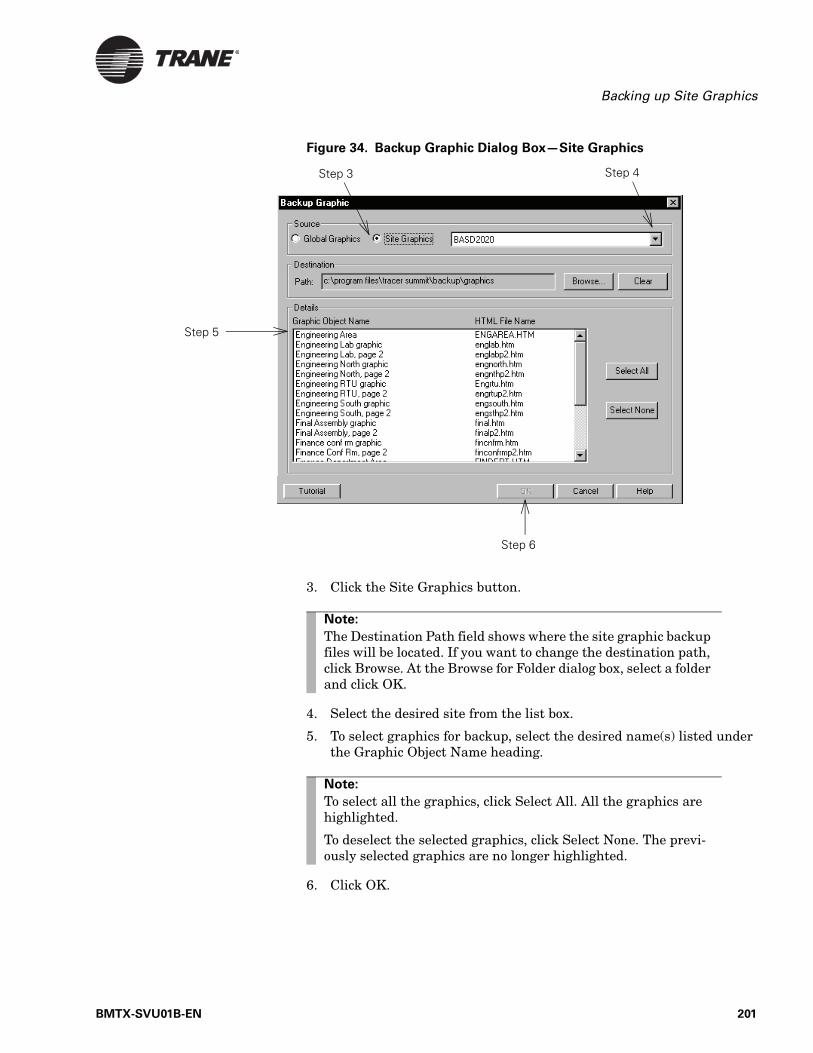
Backing up Site Graphics
Figure 34. Backup Graphic Dialog Box—Site Graphics
3. Click the Site Graphics button.
4. Select the desired site from the list box.
5. To select graphics for backup, select the desired name(s) listed under the Graphic Object Name heading.
6. Click OK.
Step 3 Step 4
Step 6
Step 5
Note:
The Destination Path field shows where the site graphic backup files will be located. If you want to change the destination path, click Browse. At the Browse for Folder dialog box, select a folder and click OK.
Note:
To select all the graphics, click Select All. All the graphics are highlighted.
To deselect the selected graphics, click Select None. The previ-ously selected graphics are no longer highlighted.
BMTX-SVU01B-EN 201
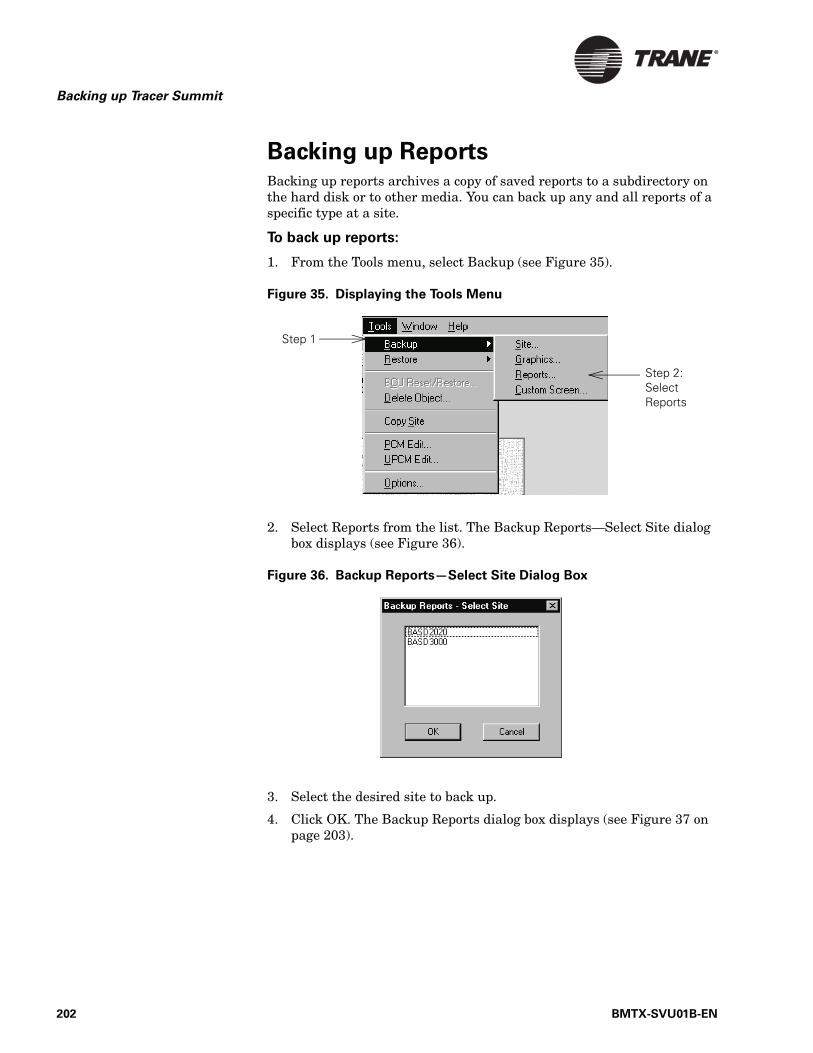
Backing up Tracer Summit
Backing up ReportsBacking up reports archives a copy of saved reports to a subdirectory on the hard disk or to other media. You can back up any and all reports of a specific type at a site.
To back up reports:
1. From the Tools menu, select Backup (see Figure 35).
Figure 35. Displaying the Tools Menu
2. Select Reports from the list. The Backup Reports—Select Site dialog box displays (see Figure 36).
Figure 36. Backup Reports—Select Site Dialog Box
3. Select the desired site to back up.
4. Click OK. The Backup Reports dialog box displays (see Figure 37 on page 203).
Step 1
Step 2: Select Reports
202 BMTX-SVU01B-EN
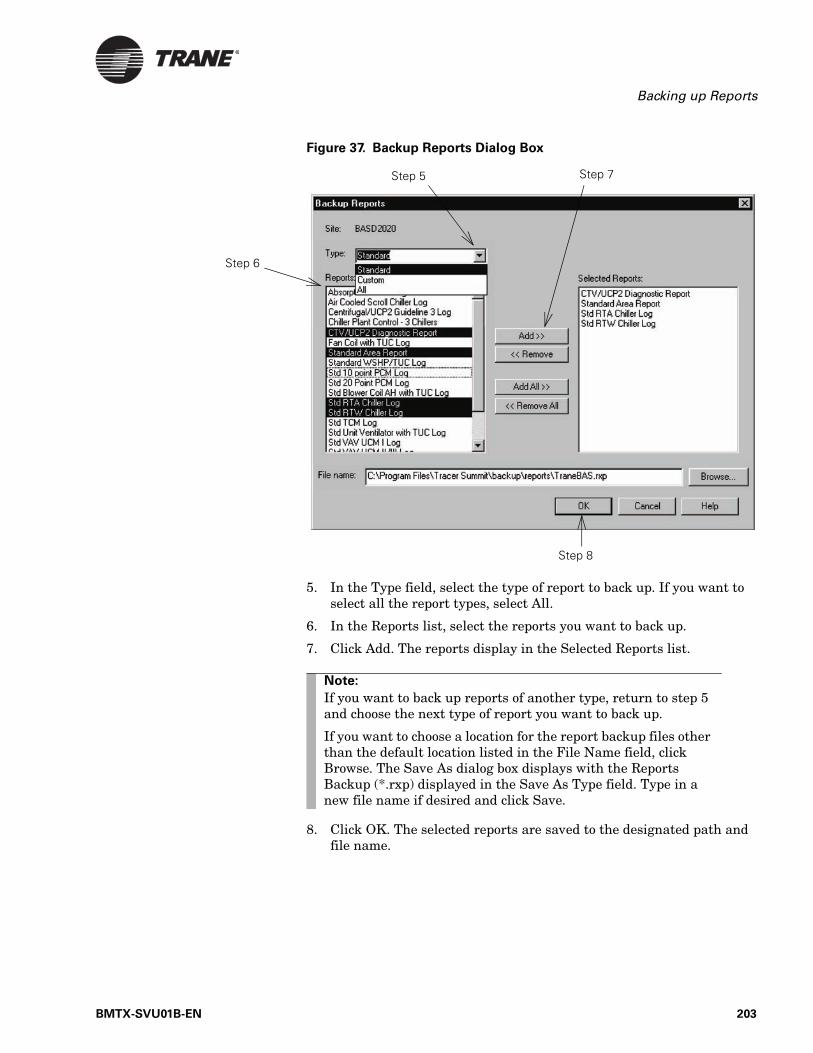
Backing up Reports
Figure 37. Backup Reports Dialog Box
5. In the Type field, select the type of report to back up. If you want to select all the report types, select All.
6. In the Reports list, select the reports you want to back up.
7. Click Add. The reports display in the Selected Reports list.
8. Click OK. The selected reports are saved to the designated path and file name.
Step 5
Step 6
Step 7
Step 8
Note:
If you want to back up reports of another type, return to step 5 and choose the next type of report you want to back up.
If you want to choose a location for the report backup files other than the default location listed in the File Name field, click Browse. The Save As dialog box displays with the Reports Backup (*.rxp) displayed in the Save As Type field. Type in a new file name if desired and click Save.
BMTX-SVU01B-EN 203
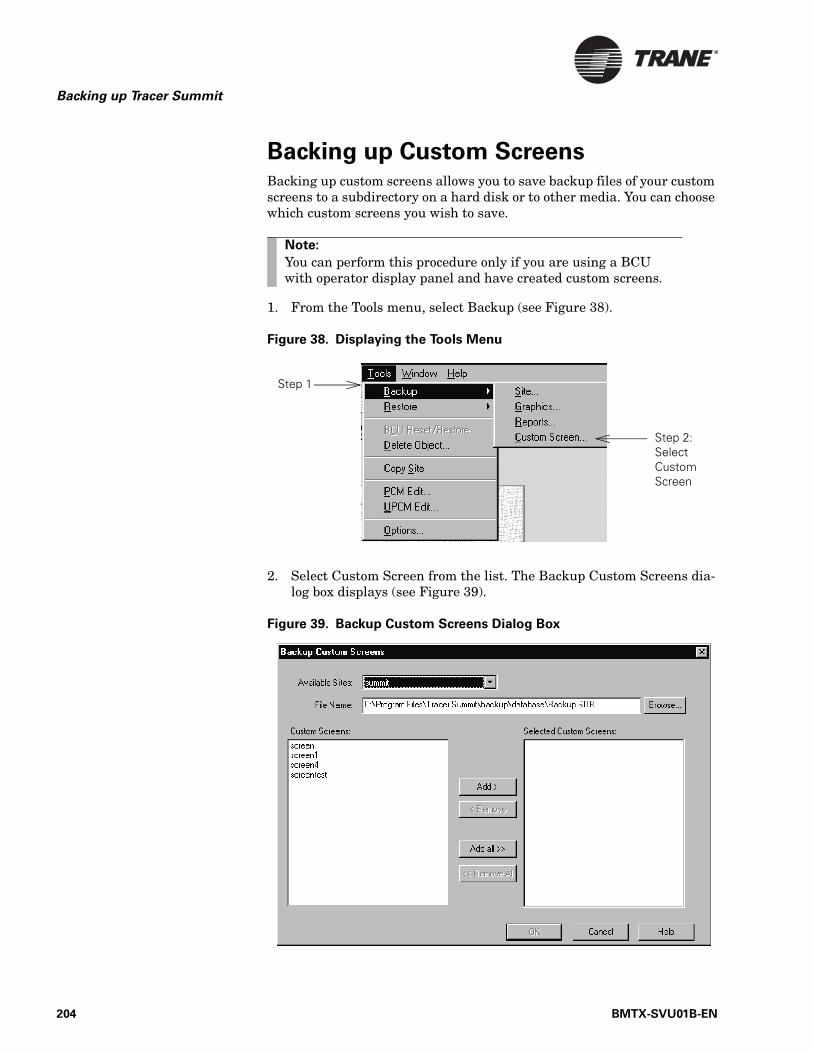
Backing up Tracer Summit
Backing up Custom ScreensBacking up custom screens allows you to save backup files of your custom screens to a subdirectory on a hard disk or to other media. You can choose which custom screens you wish to save.
1. From the Tools menu, select Backup (see Figure 38).
Figure 38. Displaying the Tools Menu
2. Select Custom Screen from the list. The Backup Custom Screens dia-log box displays (see Figure 39).
Figure 39. Backup Custom Screens Dialog Box
Note:
You can perform this procedure only if you are using a BCU with operator display panel and have created custom screens.
Step 1
Step 2: Select Custom Screen
204 BMTX-SVU01B-EN
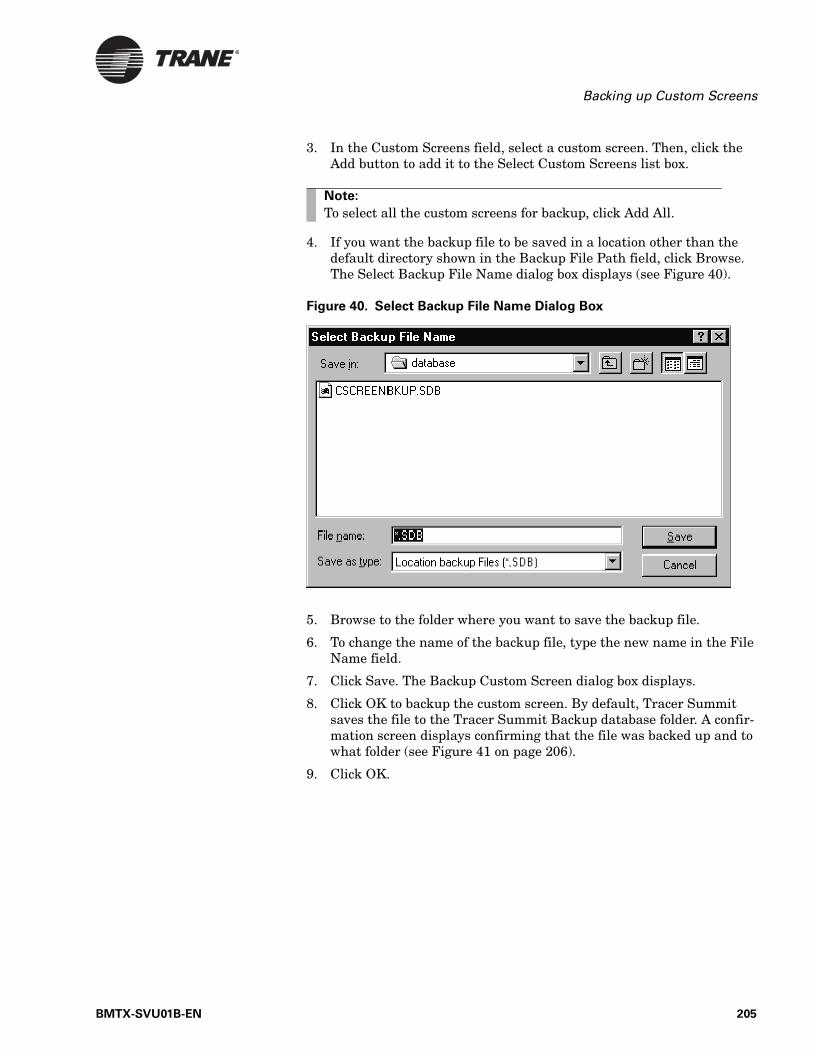
Backing up Custom Screens
3. In the Custom Screens field, select a custom screen. Then, click the Add button to add it to the Select Custom Screens list box.
4. If you want the backup file to be saved in a location other than the default directory shown in the Backup File Path field, click Browse. The Select Backup File Name dialog box displays (see Figure 40).
Figure 40. Select Backup File Name Dialog Box
5. Browse to the folder where you want to save the backup file.
6. To change the name of the backup file, type the new name in the File Name field.
7. Click Save. The Backup Custom Screen dialog box displays.
8. Click OK to backup the custom screen. By default, Tracer Summit saves the file to the Tracer Summit Backup database folder. A confir-mation screen displays confirming that the file was backed up and to what folder (see Figure 41 on page 206).
9. Click OK.
Note:
To select all the custom screens for backup, click Add All.
BMTX-SVU01B-EN 205
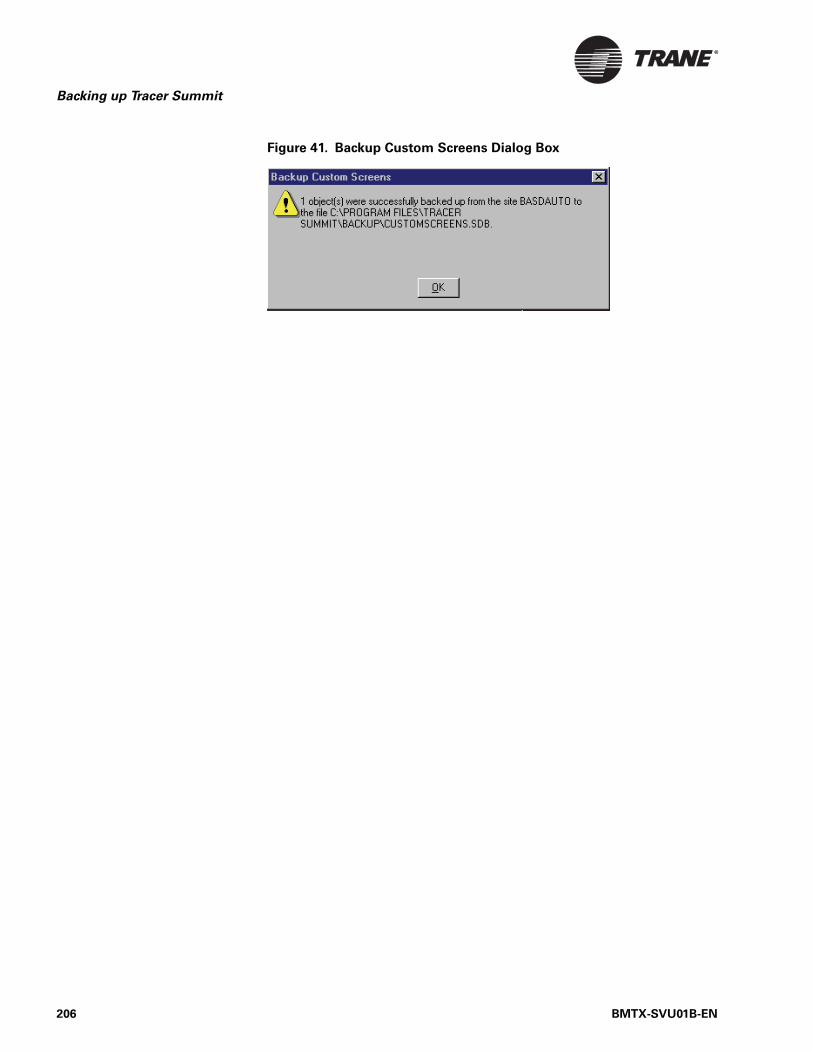
Backing up Tracer Summit
Figure 41. Backup Custom Screens Dialog Box
206 BMTX-SVU01B-EN

Chapter 13
Changing Chiller Plant Status
Information
The Chiller Plant Control program is used to coordinate chillers and pro-vide system chilled water control. The program performs four main func-tions:
• It controls leaving water temperature by adding chillers as the build-ing cooling load increases. It also calculates the chilled water setpoint sent for each chiller.
• It recovers from failures by starting the next chiller in the sequence immediately after a chiller is marked failed.
• It optimizes energy use by subtracting chillers when the cooling load does not require them to be enabled. It also matches chillers to the load.
• It equalizes runtime and wear on each chiller by using different rota-tion schemes. It also provides a more reliable chiller plant by periodi-cally exercising all of its components.
This chapter describes how to use the Chiller Plant Control Status screen to perform these functions. This screen allows quick access to valuable chiller plant information (such as when the next chiller add or subtract will occur) and allows you to perform the following tasks:
• Reset a chiller failure• Force a chiller to be added• Force a chiller to be subtracted• Make a chiller unavailable• Make a chiller available• Force the chiller sequence to be rotated
BMTX-SVU01B-EN 207

Changing Chiller Plant Status Information
Viewing Chiller Plant Control Status◆ From the Status menu, select Chiller Plant Control Status (see
Figure 42).
Figure 42. Status Menu
• If only one chiller plant object exists for the current site, the Chiller Plant Control Status System screen displays.
• If more than one chiller plant object exists for the site, the Select Chiller Plant Control window displays, allowing you to select the proper chiller plant object. Click the appropriate chiller plant, then click OK.
The Chiller Plant Control Status System screen is shown in Figure 43 on page 209.
Note:
This menu selection is not available if no chiller plant object exists in the site.
208 BMTX-SVU01B-EN
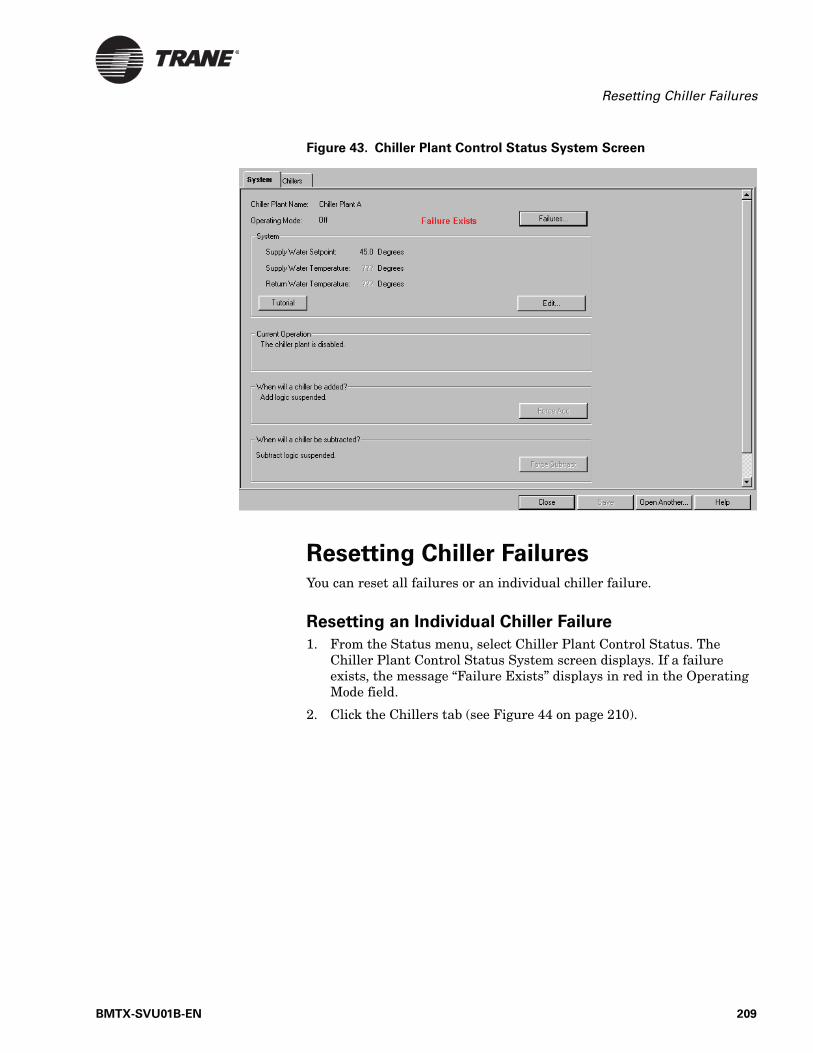
Resetting Chiller Failures
Figure 43. Chiller Plant Control Status System Screen
Resetting Chiller FailuresYou can reset all failures or an individual chiller failure.
Resetting an Individual Chiller Failure
1. From the Status menu, select Chiller Plant Control Status. The Chiller Plant Control Status System screen displays. If a failure exists, the message “Failure Exists” displays in red in the Operating Mode field.
2. Click the Chillers tab (see Figure 44 on page 210).
BMTX-SVU01B-EN 209

Changing Chiller Plant Status Information
Figure 44. Chiller Plant Control Status Chillers Screen
3. Click the name of the chiller to be reset.
4. Click Reset Chiller Failure (this button is available only if the high-lighted chiller is marked failed). A warning message displays (see Figure 45).
Figure 45. Chiller Failure Reset Warning
5. Click Yes to re-insert the failed chiller into the sequence. The Chiller Plant Control Status Chillers screen displays again.
IMPORTANTThis procedure will not reset any diagnostics at the chiller. It will return
only the chillers to the sequence.
210 BMTX-SVU01B-EN
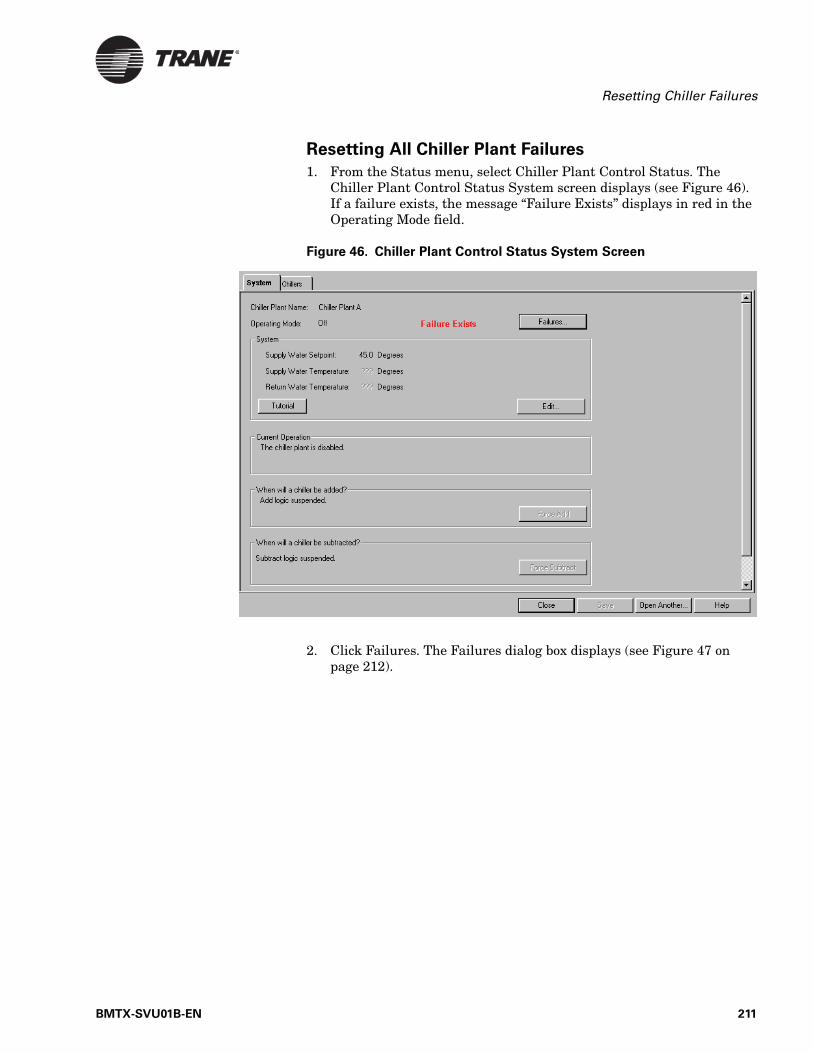
Resetting Chiller Failures
Resetting All Chiller Plant Failures
1. From the Status menu, select Chiller Plant Control Status. The Chiller Plant Control Status System screen displays (see Figure 46). If a failure exists, the message “Failure Exists” displays in red in the Operating Mode field.
Figure 46. Chiller Plant Control Status System Screen
2. Click Failures. The Failures dialog box displays (see Figure 47 on page 212).
BMTX-SVU01B-EN 211
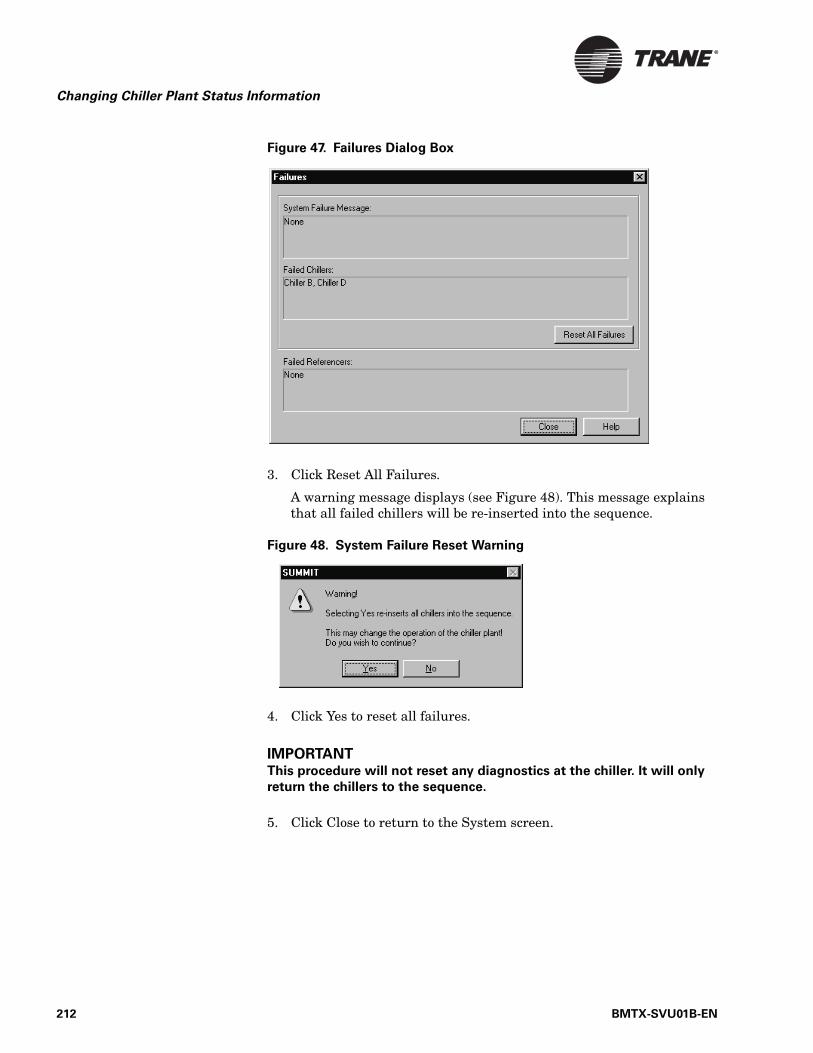
Changing Chiller Plant Status Information
Figure 47. Failures Dialog Box
3. Click Reset All Failures.
A warning message displays (see Figure 48). This message explains that all failed chillers will be re-inserted into the sequence.
Figure 48. System Failure Reset Warning
4. Click Yes to reset all failures.
IMPORTANTThis procedure will not reset any diagnostics at the chiller. It will only
return the chillers to the sequence.
5. Click Close to return to the System screen.
212 BMTX-SVU01B-EN
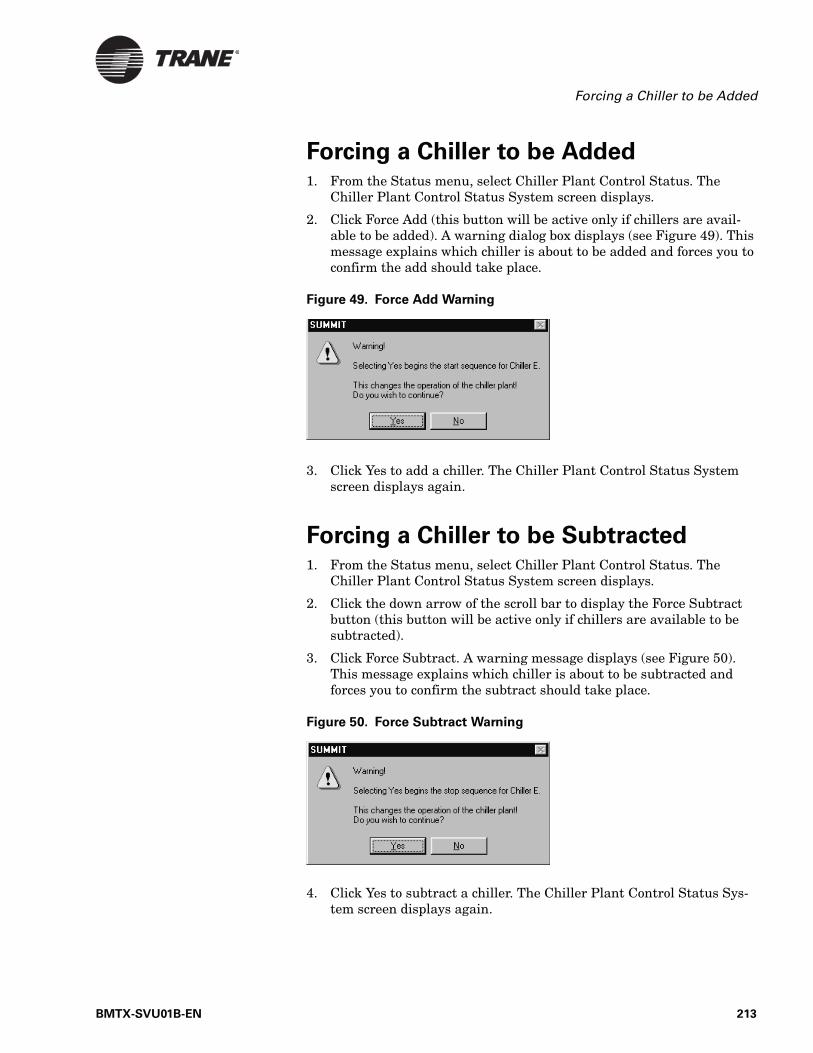
Forcing a Chiller to be Added
Forcing a Chiller to be Added1. From the Status menu, select Chiller Plant Control Status. The
Chiller Plant Control Status System screen displays.
2. Click Force Add (this button will be active only if chillers are avail-able to be added). A warning dialog box displays (see Figure 49). This message explains which chiller is about to be added and forces you to confirm the add should take place.
Figure 49. Force Add Warning
3. Click Yes to add a chiller. The Chiller Plant Control Status System screen displays again.
Forcing a Chiller to be Subtracted1. From the Status menu, select Chiller Plant Control Status. The
Chiller Plant Control Status System screen displays.
2. Click the down arrow of the scroll bar to display the Force Subtract button (this button will be active only if chillers are available to be subtracted).
3. Click Force Subtract. A warning message displays (see Figure 50). This message explains which chiller is about to be subtracted and forces you to confirm the subtract should take place.
Figure 50. Force Subtract Warning
4. Click Yes to subtract a chiller. The Chiller Plant Control Status Sys-tem screen displays again.
BMTX-SVU01B-EN 213

Changing Chiller Plant Status Information
Making a Chiller Unavailable1. From the Status menu, select Chiller Plant Control Status. The
Chiller Plant Control Status System screen displays.
2. Click the Chillers tab to display to the Chillers screen (see Figure 44 on page 210).
3. Click the name of the chiller you want to become unavailable. If the chiller is currently available, the button below the list of chillers is labelled Make Unavailable.
4. Click the Make Unavailable button. The button changes to Make Available. The next time the Chiller Plant Control runs, the text in the Chiller Available column of the table changes to No.
Making a Chiller Available1. From the Status menu, select Chiller Plant Control Status. The
Chiller Plant Control Status System screen displays.
2. Click the Chillers tab to display to the Chillers status screen (see Figure 44 on page 210).
3. Click the chiller name to highlight the chiller you want to become available. If the chiller is currently unavailable, the button below the list of chillers is labelled Make Available.
4. Click the Make Available button. The button changes to Make Unavailable. The next time the Chiller Plant Control runs, the text in the Chiller Available column of the table changes to Yes.
Note:
A chiller is available only if both the button and a programmed referencer make it available. If your chiller does not change sta-tus after you click Make Unavailable, contact your Trane Ser-vice representative for further information.
Note:
A chiller is available only if both the button and a programmed referencer make it available. If your chiller does not change sta-tus after you click Make Available, contact your Trane Service representative for further information.
214 BMTX-SVU01B-EN
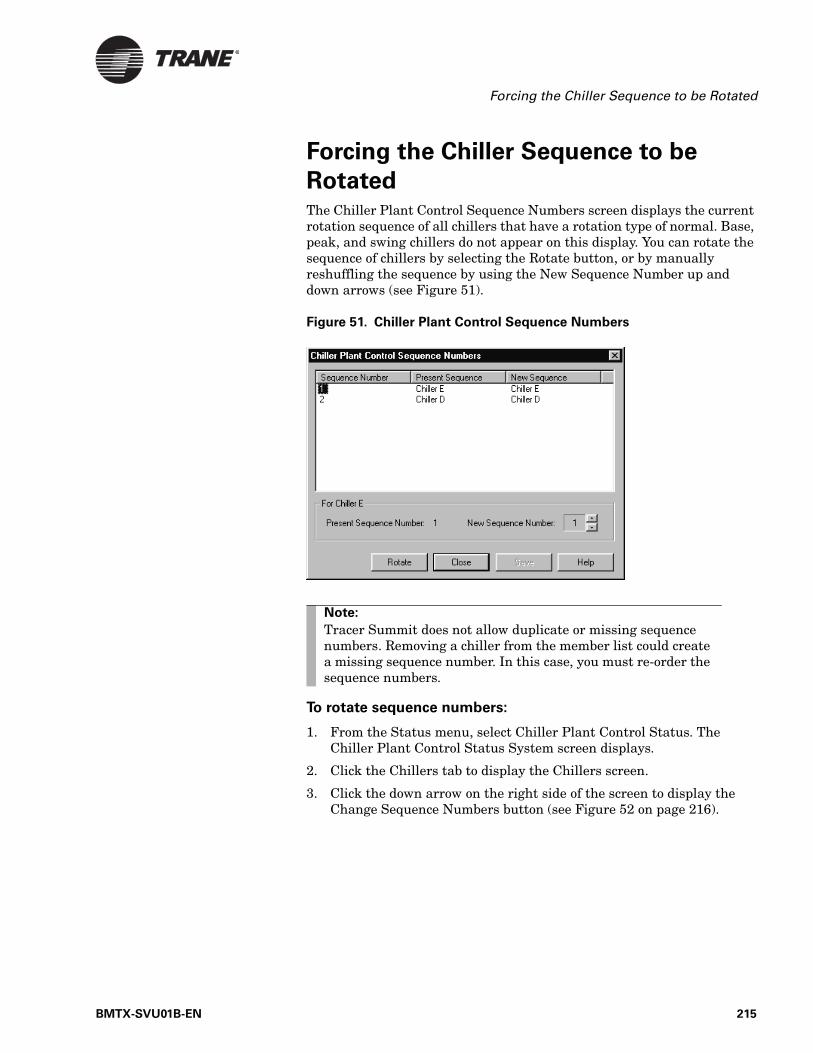
Forcing the Chiller Sequence to be Rotated
Forcing the Chiller Sequence to be
RotatedThe Chiller Plant Control Sequence Numbers screen displays the current rotation sequence of all chillers that have a rotation type of normal. Base, peak, and swing chillers do not appear on this display. You can rotate the sequence of chillers by selecting the Rotate button, or by manually reshuffling the sequence by using the New Sequence Number up and down arrows (see Figure 51).
Figure 51. Chiller Plant Control Sequence Numbers
To rotate sequence numbers:
1. From the Status menu, select Chiller Plant Control Status. The Chiller Plant Control Status System screen displays.
2. Click the Chillers tab to display the Chillers screen.
3. Click the down arrow on the right side of the screen to display the Change Sequence Numbers button (see Figure 52 on page 216).
Note:
Tracer Summit does not allow duplicate or missing sequence numbers. Removing a chiller from the member list could create a missing sequence number. In this case, you must re-order the sequence numbers.
BMTX-SVU01B-EN 215
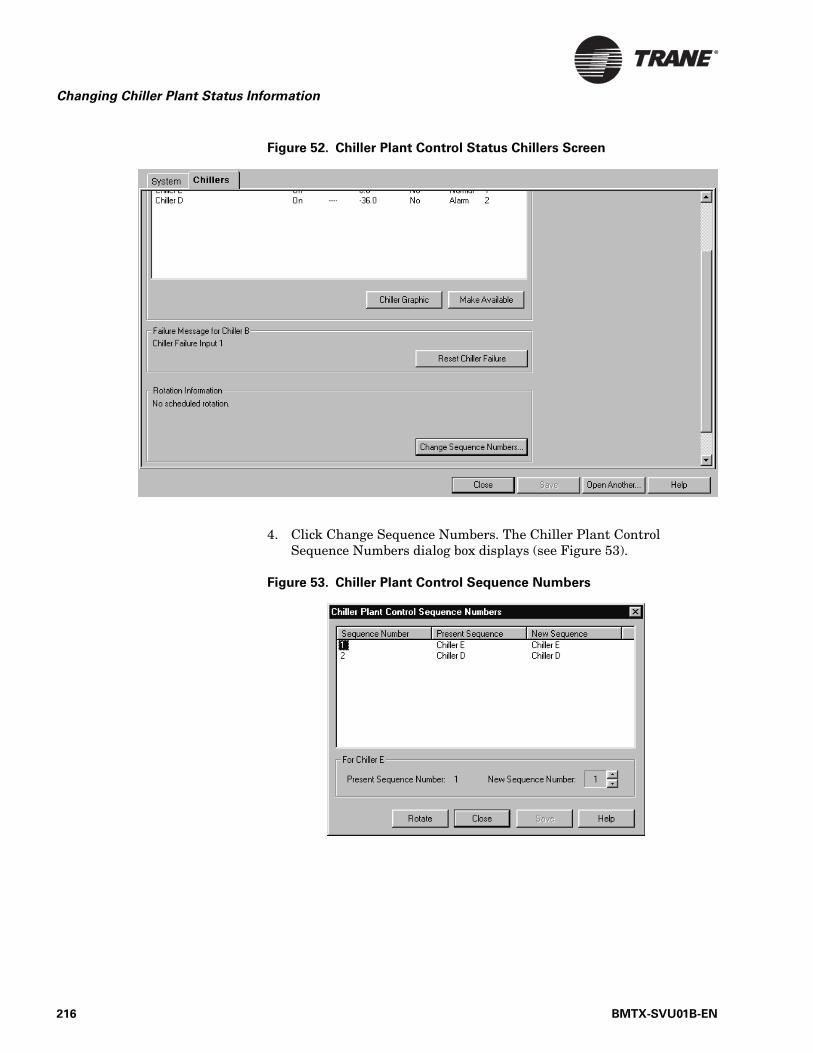
Changing Chiller Plant Status Information
Figure 52. Chiller Plant Control Status Chillers Screen
4. Click Change Sequence Numbers. The Chiller Plant Control Sequence Numbers dialog box displays (see Figure 53).
Figure 53. Chiller Plant Control Sequence Numbers
216 BMTX-SVU01B-EN
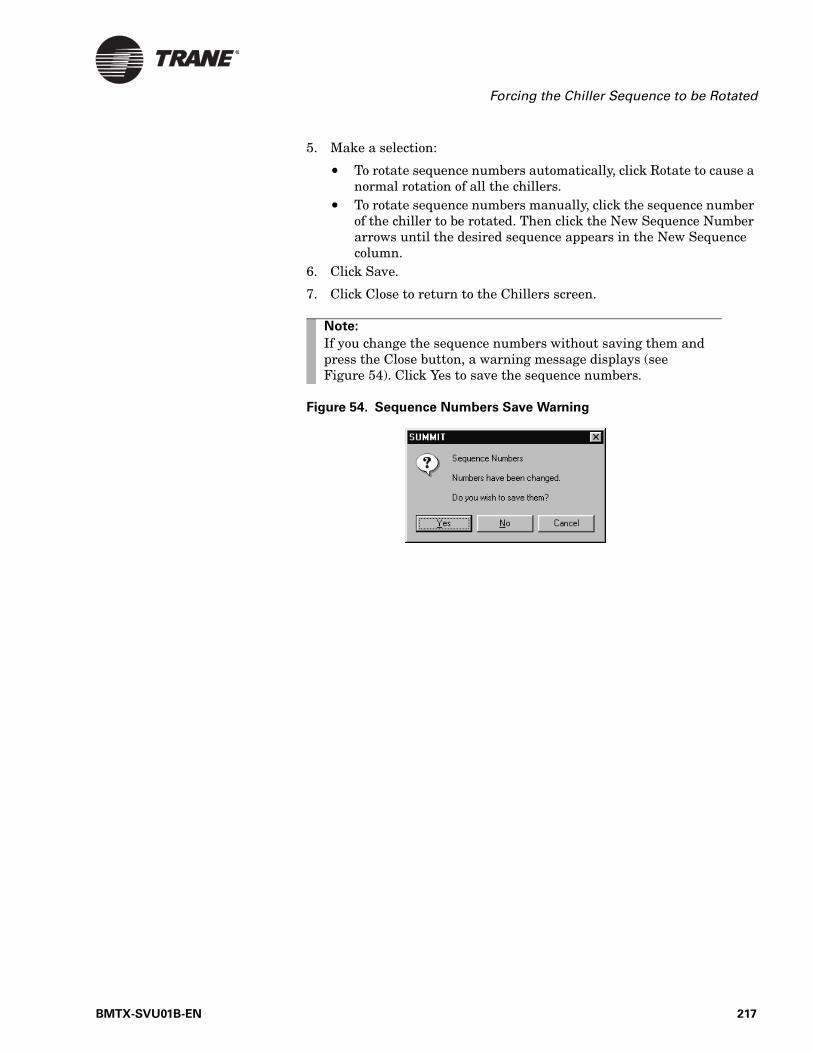
Forcing the Chiller Sequence to be Rotated
5. Make a selection:
• To rotate sequence numbers automatically, click Rotate to cause a normal rotation of all the chillers.
• To rotate sequence numbers manually, click the sequence number of the chiller to be rotated. Then click the New Sequence Number arrows until the desired sequence appears in the New Sequence column.
6. Click Save.
7. Click Close to return to the Chillers screen.
Figure 54. Sequence Numbers Save Warning
Note:
If you change the sequence numbers without saving them and press the Close button, a warning message displays (see Figure 54). Click Yes to save the sequence numbers.
BMTX-SVU01B-EN 217

Changing Chiller Plant Status Information
218 BMTX-SVU01B-EN
Glossary
A AHUAir-handling unit.
AlarmsA notification that HVAC equipment is not operating correctly. For exam-ple, an alarm is generated when communication is down between an HVAC unit and the BCU, or when a filter on an HVAC unit is dirty.
AreaA defined space in a facility that can be anything from a single office, a group of offices, a large open warehouse, or a manufacturing site. A defined area allows you to coordinate heating, cooling, lighting, and venti-lation and to maintain a comfort level in a defined area of the facility using Area Control.
ASHRAEAmerican Society of Heating, Refrigeration, and Air Conditioning Engi-neers.
B BASBuilding automation system. A combination of controllers and other soft-ware products that communicate and control various mechanical systems to enable building management. These products include the heating, ven-tilating, and air conditioning systems, as well as lighting systems, access control, and miscellaneous other devices within a building.
BCUBuilding control unit. The BCU is a panel that communicates with and controls the unit control modules (UCMs) in a building. It communicates UCM status, alarm, and event information to the Tracer Summit soft-ware at the PC Workstation. Tracer Summit may have more than one BCU connected to it.
C CFMCubic feet/minute (rate of airflow).
Cooling degree day (CDD)The difference between 65°F and daily average (mean) temperature. Daily average mean is the average of the maximum and minimum tem-peratures recorded during the day.
BMTX-SVU01B-EN 219
Glossary
Custom reportsReports that are specially designed for your environment.
E EAExhaust air.
EADExhaust air damper.
Economizer controlThe opening or closing of various HVAC dampers to cool a building with outside air, usually when the outside air is 60ºF to 75ºF.
Event logThe event log feature consists of three tabs: Event log, BCU event log, and error Log:
• Event log lists all alarms and events received at your workstation.• BCU event log can display the 100 most recent alarms and events.• Error log lists errors generated by the workstation.
Event typesTypes of events found in a schedule, including the following:
• Normal• Optimize• Night Economize• Lighting• Setpoints
EventsA notification of an action that you need to keep track of. For example, when a new operator logs on to Tracer Summit.
Exception daysDays during which exceptions to (differences from) normally scheduled events occur.
Expanded messageA message that provides detailed information about an alarm or event. Not all alarms and events have expanded messages. If an expanded mes-sage is available for an alarm or event, a message icon, which is a small picture of an envelope, displays in the Date/Time column.
220 BMTX-SVU01B-EN
Glossary
F FilteringA way to make the event log display only the alarms and events that meet criteria you specify. The alarms and events that do not match the criteria are not listed in a filtered event log.
H HardwareThe PC Workstation equipment that runs the software.
Heat pumpEquipment that uses the refrigerant system to provide heating or cooling by reversing the flow of the refrigerant through the condenser and evapo-rator coil in the heating cycle.
Heating degree day (HDD)The difference between 65ºF and the daily average (mean) temperature. Daily average mean is the average of the maximum and minimum tem-peratures recorded during the day.
HolidaysDays that are identified as different from normal days.
HVACHeating, ventilating, and air conditioning.
I IAQIndoor air quality.
K Keyboard macroA key that you set up to execute often-used keystroke sequences on the PC.
L LANLocal area network.
LCPLighting control panel. A microprocessor-based controller that manages building lighting circuits according to time of day schedules and monitors physical switch input and telephone input commands. The LCP can oper-ate as a stand-alone device or as an interface to the Tracer Summit build-ing automation system (BAS), which effectively integrates the HVAC and the lighting systems.
LightingAn option that turns lights on or off at a specified start time.
BMTX-SVU01B-EN 221
Glossary
MacroSee Keyboard Macro
MemberA piece of equipment that serves an area. Members might be heating, cooling, lighting, or ventilation devices.
ModeIndicates whether an area is attempting to heat the space or cool the space, depending on area’s inside temperature and setpoints.
ModemAn acronym for modulator and demodulator. Used to interface a building management system or terminal with a telephone line. A modem trans-lates information from the building management panel into signals that can be transmitted over the telephone or other data communications cir-cuits.
N Navigation treeThe panel on the left-hand side of the main Tracer Summit window that shows all of your sites, buildings, areas, and HVAC equipment connected to Tracer Summit. You can display information about a site’s buildings and HVAC equipment by clicking on the name of the building or HVAC unit in the navigation tree. The information displays in the Tracer Sum-mit main window.
Night economizeTurns on HVAC equipment at a specified start time at night and opens the outdoor air damper/economizer to let in cool outdoor air. Closes damper and turns off equipment at a specified end time.
Night heat/coolAn option that provides mechanical heating/cooling during unoccupied periods to bring space temperature back to within a predefined range.
NormalA setting that turns on HVAC equipment for operation in a normal, occu-pied mode at a specified start time and turns off equipment at a specified end time.
Normal daysDays on which normally scheduled events always occur. Normal days can be changed to holidays or exception days.
222 BMTX-SVU01B-EN
Glossary
O ObjectAn element in the Tracer Summit system. Everything in the system is an object, including input/output points, applications, and all UCMs. Once created, each object has characteristic information or properties that can be viewed, referenced, and applied throughout the Tracer Summit sys-tem.
OccupiedA term used to define the state of an application or UCM. Typically denotes that equipment and software will control to certain parameters based on the knowledge that the system is providing comfort control to a space in which people reside.
Operating modeA setting that indicates whether an area is attempting to heat the space or cool the space depending on the area’s inside temperature and set-points.
Operator DisplayThe operator display is a touch screen interface located on the BCU front panel. It enables you to perform daily operator tasks, as well as view information about your building automation system (BAS) without requiring a Tracer Summit PC Workstation.
OptimalA setting that turns on HVAC equipment before the normal start time or turns off equipment before the normal end time. This feature is used to begin heating or cooling an area before it is occupied, and to gradually reduce heating or cooling in an area before it is unoccupied.
Optimal startA setting that optimizes the startup and shutdown times of heating and cooling equipment, so they run only as long as is necessary to meet the require temperature setpoints at the time of occupancy.
OverrideA method of controlling system settings, either manually or through the system, that changes the current or normal system function at the time the control occurs.
BMTX-SVU01B-EN 223

Glossary
P PC WorkstationPersonal computer workstation. You perform all of the daily operations tasks at the PC (personal computer) workstation using Tracer Summit software. The PC Workstation and Tracer Summit software are connected to the building control units and the unit control modules.
The workstation consists of these main components:
• Computer monitor• CPU (central processing unit)• Mouse• Keyboard
You may have additional equipment, such as a printer.
PropertyOne element of an object’s characteristic information. This information element can be viewed, referenced, and applied throughout the Tracer Summit system.
R RTURooftop unit.
S ScheduleA set of events (instructions) that tell the HVAC equipment connected to Tracer Summit what to do and when to do it. For example, an event in a schedule will tell a rooftop unit when to turn on and off.
SetpointsAn option that changes the heating or cooling mode at a specified time or using a specified number or other setting. When the equipment goes beyond (above or below) that setting, it is automatically switched to another mode.
SiteA logical grouping of equipment serving a single facility. The customer defines the site as a logical grouping.
Standard live reportsReports that show information about what is happening in the Tracer Summit system at a particular time.
Standard trend reportsReports that show how information changes over a period of time.
T Target fieldsGraphic fields that use images, text or buttons as targets to link to other graphics.
224 BMTX-SVU01B-EN
Glossary
Time of day scheduling (TOD)The process of assigning the times during the day at which events will occur for various components of the building management system. These events include typical On or Off commands.
Timed override (TOV)Timed override enables building occupants and management staff to override HVAC and lighting equipment to an occupancy status. You can perform overrides from a Trane zone sensor, a BCU operator display, or a PC Workstation.
Tracer 100 panel seriesThe Tracer product line of building management systems. Tracers pro-vide building automation and energy management by monitoring and controlling HVAC equipment, providing the user with management infor-mation, and networking with other Tracer systems. Panels in this series include the Tracer 100, Tracer 100i, and Tracer chiller plant manager.
TrackerThe Tracker Stat advanced thermostat system is Trane’s solution for small, light commercial buildings and is designed to make effective build-ing control simple. The Tracker provides microelectronic control and mon-itoring of Voyager rooftops, TCMs, the VariTrac CCP, and dampers.
TrendA sampling of historical data from specific objects and their properties in the building control unit (BCU). It is collected at specified intervals to provide information about HVAC operations over a period of time.
Terminal EmulationAn interface to Tracer Summit that enables you to access a Tracer 100 or Tracker site to perform daily operator functions.
TRSTracer remote station.
TUCTerminal unit controller.
U Unit control module (UCM)Unit control modules can be:
• Microprocessor-based controllers that control various air conditioning system components.
• Trane microprocessor-based controllers that provide equipment and space condition control and monitoring.
BMTX-SVU01B-EN 225
Glossary
UCP1Unit control panel 1.
UCP2Unit control panel 2.
V Variable air volume (VAV)Air distribution system that varies the volume of air supplied to a system to maintain acceptable space comfort conditions.
Z ZoneThe smallest area of control in an HVAC system. A zone is characterized by a single thermostat or zone temperature sensor. A room served by a single VAV box is an example of a zone. Several rooms served by the same VAV box also constitute a zone.
226 BMTX-SVU01B-EN
Index
Index
A
Accessing the trend viewer through a graphic, 175
Acknowledgment of alarmsAcknowledge Alarm button, 120Acknowledge button, 111Acknowledging an alarm, 120Deleting alarm requiring, 135Record of, 120Sorting event log by
acknowledgment, 126
Adding to a trend viewer, 176
Advanced Systems Override, 72
AHU, 219
Air conditioning equipment, see HVAC equipment
Alarm and event log, see Event log
Alarms and eventsAcknowledging an alarm, 120Criteria for sorting, 125-126Definitions, 105Deleting a block of, 138Deleting multiple, 137Deleting when acknowledgment
required, 135Effect within Tracer Summit, 106Expanded message about, 124Printing selected, 131Refreshing the event log, 122Security access, 105Silencing an audible alarm, 119
Alarms button, 36
Alarms, events and errorsDeleting individually, 136
Alarms, see Alarms and events
AreaDefinition, 219Viewing information about, 38
ASHRAE, 219
Audible alarm, silencing, 119
B
Back button, 35, 54
Backup function, 193Backing up CPL files, 197Canceling, 198Custom screens, backing up,
204Frequency of backups, 193, 194Global graphics, backing up, 198Groups, backing up, 194Purpose for, 193Reports, backing up, 202Saving to a disk, 196Site graphics, backing up, 200Site, backing up database files,
194
BAS, 219
Basic information about Tracer Summit, 1
BCU, 1Definition, 219Operator display interface, 6
BDB file, 195
Beginner’s assistance, 1
Binary check box, 74
Binary value, changing via a graphic, 74
ButtonName of, viewing, 35
Button in an editor, 53
C
Calculated analogOverriding, 72-73
Calculated binaryOverriding, 72-73
Calendar, using with schedules, 85
CDD, 219
CD-ROMDaily Operations Tutorial, 9, 13,
21
CEUEarning continuing education
credits, 23
CFM, 219
Chiller plantAdding a chiller, 213Chiller status display, viewing,
208Control capabilities, 207Failure, 207Making chiller available, 214Making chiller available via
referencer, 214Making chiller unavailable, 214Manual controls, 207Resetting all failed chillers, 211Resetting does not reset
diagnostics, 210, 212Resetting individual chiller
failure, 209Rotating chiller sequence, 215Sequence numbers, missing or
duplicate, 215Status information, 207Subtracting a chiller, 213
Communications, down when all sites closed, 41
Connect button, 36
Connect menu, 39, 41
Context-sensitive help, 41
Continuing education creditSee CEU
Cooling degree day, 219
CPL files, backing up, 197
create a new trend viewer, 174
Creating a Trend Viewer, 174
Creating a trend viewer, 176
Custom reportDefinition, 143Running, 153Selecting, 153See also Report
Custom ScreensBacking up, 204
Customized graphic, 51
D
Daily event, see Event
BMTX-SVU01B-EN 229

Index
Daily Operations TutorialComputer-based training, 3Main menu, 22Obtaining continuing education
credit, 23Task-based menu, 11Tutorial screen, items found on,
12Using as Stand-alone training
course, 21Using in Tracer Summit, 9
DatabaseBacking up files for site, 194Overwriting site database
backup, 194
Date and time, sorting event log by, 126
DayLinking in a schedule, 100Selecting for a schedule, 85
Default Filtersetting up, 129
Disconnect button, 36
Disk, backing up onto, 196
Displaying Override Status, 57
Duty cycle eventsEvent in a schedule, 87
E
EA, 220
EAD, 220
Economizer control, 220
Enable filtering, 127
Energy conservation, accomplishing with chiller plant control, 207
EventChanging event time, 88Definition, 79Displaying in a schedule, 86Identifying event type, 86Returning to daily schedule, 99Types of, 87See also Alarms and events
Event log, 105BCU Event Log tab, 116Button, 36Closing, 118Criteria for sorting, 126Default file format of, 135
Default file name of, 135Definition, 220Deleting, 138Deleting items from, 135Error Log tab, 117Errors, 117Filtering, see Event log filtersItems contained in, 110Opening in special file formats,
135Opening spreadsheet of, 135Opening text file of, 135Printing, 131Refreshing, 123Saving, 134Sorting, 125Understanding, 109Updating, 123
Event log filters, 127By event type, 129By site, 128By status, 129By time period, 128Definition, 127number of matches, 129
Event log tab, 109
Event receiver workstation, 109, 121
Event typeDefinition, 220Identifying, 86
Excel file, see Spreadsheet
Exception in a scheduleAdding, 89Definition, 79Removing from a schedule, 99Template, applying, 92Template, creating, 90Template, modifying, 93
ExceptionsAdding to time of day reports,
104
Exit command, 28
Expanded messageClosing, 125Definition, 124Displaying, 124
F
Failure of chillersResetting, 209
Feedback, 3
Filtering event log, see Event log filters
Focus on Your System, 3, 9
Force add, 213
Force subtract, 213
Forward button, 54
G
GraphicButton for viewing next, 35Button for viewing previous, 35Closing, 54Files, backing up, 198, 200Files, not included in site
backup, 194Getting status from, 51Global graphics, backing up, 198Locations to launch from, 52Site graphics, backing up, 200Viewing, 52-54
Graphics command, 53
Graphics pop-up menu, 77
GroupsBacking up, 194CPL files, backing up, 197
H
HardwareDefinition, 2, 221List of Tracer Summit’s, 4
HDD, 221
Heat pump, 221
Heating degree day, 221
Heating equipment, see HVAC equipment
Help button, 41
Help information, displaying, 41
Hiding, see Minimizing
HolidayAdding existing for BCU panels,
94Adding to time of day schedule
reports, 104Defining new for BCU panels, 96Definition, 79Modifying for BCU panels, 97Removing from a schedule, 99
230 BMTX-SVU01B-EN
Index
Holiday eventsEvent in a schedule, 87
Home button, 35
HVAC equipment, 1Definition of HVAC, 221Scheduling for, 79
I
IAQ, 221
ICS Institute, 23
Integrated Comfort SystemsSee ICS Institute
K
Keyboard MacrosAccessing from terminal
emulation, 45Accessing from the navigation
tree, 45
L
LAN, see Local area network
LCP, see Lighting control panel
LightingDefinition, 221Event in a schedule, 87
Lighting control panel, 221
Linked days in a schedule, 100
Live data, viewing in a graphic, 51
Local area network, 1Definition, 221
LocationBacking up, 194
LogoffAs security measure, 29See also Tracer Summit,
Logging off of
LogonAs security measure, 29See also Tracer Summit,
Logging on to
M
MacrosSee Keyboard Macros
Main graphic, button for, 35
Member, 222
MenuClosing, 34Opening, 34
Menu bar, 34
Minimizing, definition, 27
Mode, 222
Modem, 222
Month, selecting for a schedule, 85
MyTraneControls.com, 3
N
Navigation treeButton, 36Definition, 222Displaying, 39Example of, 37Hiding, 39
Next button, 35
Night economizeDefinition, 222Event in a schedule, 87
Night heat/cool, 222
NormalDefinition, 222Event in a schedule, 87
O
ObjectDefinition, 223Editing from a graphic, 77
Occupied, 223
Opening, 177, 178, 180
Opening Tracer Summit, 25Logging on to Tracer Summit,
29
Operating mode, 223
Operator display interface, 6
OptimalDefinition, 223Event in a schedule, 87Start, definition, 86, 223Stop, definition, 86
OverrideButton names associated with,
57, 74
Changing, 55Definition, 223Opening the dialog box, 72
Overriding a Binary Output, 67Non-Trane, 68
Overriding a Multi-State Analog Output, 65
Overriding a Multi-State OutputNon-Trane, 66
Overriding a UCM or Application, 70
Overriding an Analog Output, 62Non-Trane, 64
P
Page view, 161
PasswordIncorrect, 30Need for, 29
PC Workstation, 1Basic information, 5Definition, 224
Present valueOverriding, 73Releasing control of, 73
PrintingAlarms and events, 131Event log, 131Reports, 165
Property, definition, 224
R
Refresh button, 111, 123
Releasing control back to the system, 71
Releasing control of present values, 73
ReportBacking up, 202Button, 35Displaying a saved report, 155Displaying recently viewed
reports, 158File format of, 164Not included in site backup, 194Overview of reporting, 141Printing, 165Selecting a custom report, 153Selecting a saved report, 155
BMTX-SVU01B-EN 231
Index
Selecting a standard live report, 146, 148
Selecting a standard trend report, 151
Viewing report from a graphic, 77
See also Standard live report, standard trend report, custom report
Report Viewer, 160Buttons for controlling, 160
ReportsFor time of day schedules, 102Time of day schedules, 104
Reports button, 35
RPT file, 164
RTU, 224
S
SaveBefore closing Tracer Summit,
28Before logging off of Tracer
Summit, 31
Schedule button, 35
SchedulesCreating time of day reports,
102
SchedulingButton, 35Closing screen for, 84Daily event, see EventDaily schedule, see EventDefinition, 79Displaying screen for, 82Exception, see ExceptionHoliday, see HolidayLinking days, 100Organization of screen, 81Removing exceptions and
holidays, 99Schedule button, 82Selecting a month and day, 85Viewing schedule from a
graphic, 77
Security access, 25, 29, 105
Selection list, using to change a value, 74
Sending feedback, 3
Setpoint
Changing from a graphic, 55, 74Definition, 224Event in a schedule, 87
Setting, 173
Silencing an audible alarm, 119Silence button, 111, 119
Simplified OverrideSetting up, 58
Simplified Override Dialog BoxUsing, 62
Simplified Override dialog boxSetting up, 58Using, 62
Simplified override dialog boxAccessing, 60
SiteArea, viewing information
about, 38Backing up, 194Closing, 41Closing all, 41CPL files, backing up, 197Database files, backing up, 194Definition, 224Graphics, backing up, 200Opening a site, 39Opening multiple, 40Sorting event log by, 126
Site connection wizardButton, 36
Software, definition, 2
Sorting the event log, 125
SpreadsheetOpening event log as, 135Saving event log as, 135
Standard graphic, 51
Standard live reportDefinition, 142Running, 144Running from a graphic, 77Selecting, 146, 148See also Report
Standard trend reportDefinition, 143Running, 151Sample, 143Selecting, 151See also Report
Starting to use Tracer Summit, 1
Starting Tracer Summit, see Opening Tracer Summit
Status informationChanging, 51, 55-75Chiller plant, 207Displaying, 51Viewing from a graphic, 51-55
System valuesBinary check boxes, 74Changing, 55Overriding, 56Selection list controls, 74Setpoints, 74
T
Table view, 161
Target fieldDefinition, 224Using to view a graphic, 52
Task bar, 35
Tend ViewerCreating, 182
Terminal emulationAccessing a terminal emulation
session, 44Changing the window color
scheme, 48Printing text, 47Saving terminal emulation
screen text, 47
Text fileOpening event log as, 135Saving a report as, 164Saving event log as, 135
Time of day schedule reports, 102Adding event information, 104
Time of day scheduling, 225Creating a time of day schedule
report, 102
Timed overrideCanceling a request, 75Definition, 225Starting a request, 75
Timed override button, 36
TOD, 225
Tracer 100monitoring sites, 1panel series definition, 225references, 5
Tracer SummitBacking up, see Backup functionClosing, 28
232 BMTX-SVU01B-EN
Index
Definition, 1Displaying when minimized, 27Example of setup, 2Hardware, list of, 4Icon, 25Importance of logging off of, 29Logging off of, 30Logging on to, 29Main screen, 33Menu bar, 34Minimizing, 26Moving around in, 33Opening, 25Organization of, 1Task bar, 35Users Network, 3
Trackerdefinition, 225monitoring sites, 1references, 5
Trane home page, 3
Tree button, 36
Trend, 185, 188Definition, 225Report, see Standard trend
report
Trend ViewerAdding to, 182Historical Trends, 190Opening, 174Saving, 177Setting up, 168Setting up the Trend Viewer, 168Toolbar, 184Working with, 183
TroubleshootingDatabase problems, 194Tracer Summit button at bottom
of screen is flashing, 107
TRS, 225
TUC, 225
Tutorial Buttonabout the, 9See also Daily Operations
Tutorial
U
UCM, 1Definition, 225
UCP1, 226See also Chiller plant
UCP2, 226See also Chiller plant
Unit control module, see UCM
User nameIncorrect, 30Need for, 29
Users Network, Tracer Summit, 3
V
Variable air volume (VAV), definition, 226
Ventilating equipment, see HVAC equipment
W
Web, Trane, 3
X
XLS file, see Spreadsheet
Z
Zone, 226
Zoom, in Report Viewer, 161
BMTX-SVU01B-EN 233

Index
234 BMTX-SVU01B-EN

BMTX-SVU01B-EN 227
Reader
Response
Form
1. In a word, how would you describe this guide?
________________________
2. Using the following scale, rate the overall quality of this guide: (Use the following scale.)
1 2 3 4 5
Dreadful Terrific
3. How do you use this guide? (Choose one.)
a. I read it from beginning to end.
b. I read only the sections that pertain to my immediate needs.
c. I read only the sections that pertain to my job.
4. How easily can you find information in this guide?
1 2 3 4 5
Not easy at all Moderately Very easy —very difficult easy
5. When you actually try the instructions described in this guide, how easily can you follow them?
1 2 3 4 5
I can’t Occasionally Withfollow the the content great
instructions is confusing easeat all.
6. How well did you understand the product before reading this guide?
1 2 3 4 5
Not at all Somewhat Thoroughly
7. How well did you understand the product after reading the guide?
1 2 3 4 5
Not at all Somewhat Thoroughly
8. The best aspect of this guide is __________________________________
_______________________________________________________________
9. If we were to change one aspect of this guide, it should be _________
_______________________________________________________________
10. Name, e-mail address: (optional)_________________________________
_______________________________________________________________
Our goal is to provide accurateand efficient information
to our customers. Please usethis form to help us improve
the quality and usabilityof this guide. Make copies of
this form if needed.
Please send this formby fax or mail to:
Trane GCSProduct Communications
4833 White Bear ParkwaySt. Paul, MN 55110
(fax) 651-407-4360

Trane has a policy of continuous product and product data improvement and reserves the right to change design and specifications without notice. Only qualified technicians should perform the installa-tion and servicing of equipment referred to in this publication.
Literature Order Number BMTX-SVU01B-EN
File Number SV-ES-BAS-BMTX-SVU-01B-EN-0606
Supersedes BMTX-SVU01A-EN July 2004
Stocking Location InlandTraneA business of American Standard Companieswww.trane.com
For more information, contact your local Trane office or e-mail us at [email protected]