dairy processing in tanzania
TRANSCRIPT

Dairy
Processing
in
Tanzania
Prospects for SME
Inclusion
Project Brief, April
2020
ES/S0001352/1
www.iiap.info
Dr. Hoseana Lunogelo, Professor Fortunata Makene (Economic and Social Research Foundation, Dar es Salaam) and Dr. Hazel Gray (University of Edinburgh)

2
IIAP Project Brief: Dairy Processing in Tanzania- Prospects for SME Inclusion Innovation and Inclusive Industrialisation in Agro-Processing is a two-year collaboration between researchers from the University of Edinburgh, the University of Johannesburg, and the Economic and Social Research Foundation, Tanzania. The projects is a comparative study conducted across Tanzania and South Africa focusing on three value chains: maize meal, citrus and dairy. The three aims of the study are:
First, to describe the factors that determine innovation and inclusion in agro-processing.
Second, explain the challenges to promoting SME participation in agro-processing value chains
Third, to use these findings to support industrial policy formulation at the national and regional level.
In this project brief, we set out the key issues arising from our scoping work on dairy processing in Tanzania.
Brief Summary
According to the Tanzania Dairy Board (TDB) and the Ministry of Livestock and Fisheries Development (MOLFD)1 until year 2015 only 3% of the national cattle herd comprised of improved dairy breeds, with disproportionate contribution of 30% of the 2.5 billion litres of annual milk production. They however, account for 70% of the marketed milk. Milk production is mostly for household consumption. Marketed milk was sold directly to neighbours (86%) or through small-scale milk traders and collective bulking centres (12%). The country has historically experienced low milk production, which has been attributed to shortage of improved high yielding dairy cows, poor pastures/feeds and failure to observe recommended husbandry practices (ESADA, 2015)2. The dominance of geographically scattered and poorly organised smallholder dairy farmers has contributed to high costs of milk collection/aggregation by milk processors. About 2.4% of marketed milk was in the form of processed products and about half of it is imported. In 2015 there were 83 milk processing plants in the country handling 167,000 litres of milk daily, ranging from many micro processing units that process very small volumes; to large scale plants such as Tanga Fresh and ASAS in Iringa. Almost all processors produce pasteurized and cultured milk. For processed milk the major type is cultured milk widely known in Kiswahili as “mtindi”, consumed to as part of a meal as well as refreshment. Pasteurised milk is the second product on the market by volume. UHT is another product that is increasing in popularity. There is a limited segment that prefers consumption of yoghurt, butter, ghee and cheese, whose local production is small compared to imports. This brief assesses the role of small and medium enterprises (SMEs) in value addition of milk in the country.
1MOLFD (2015). Tanzania Livestock Modernization Initiative 2015/16-2020/2021 2ESADA (2015). The State and Future of Dairy Sector in the East African Community. Statement by the Executive Secretary of
Eastern and Southern African Dairy Association (ESADA). September 2015. Sponsored by KILIMO Trust.
3
Overview of the Dairy Value Chain
Historical Overview
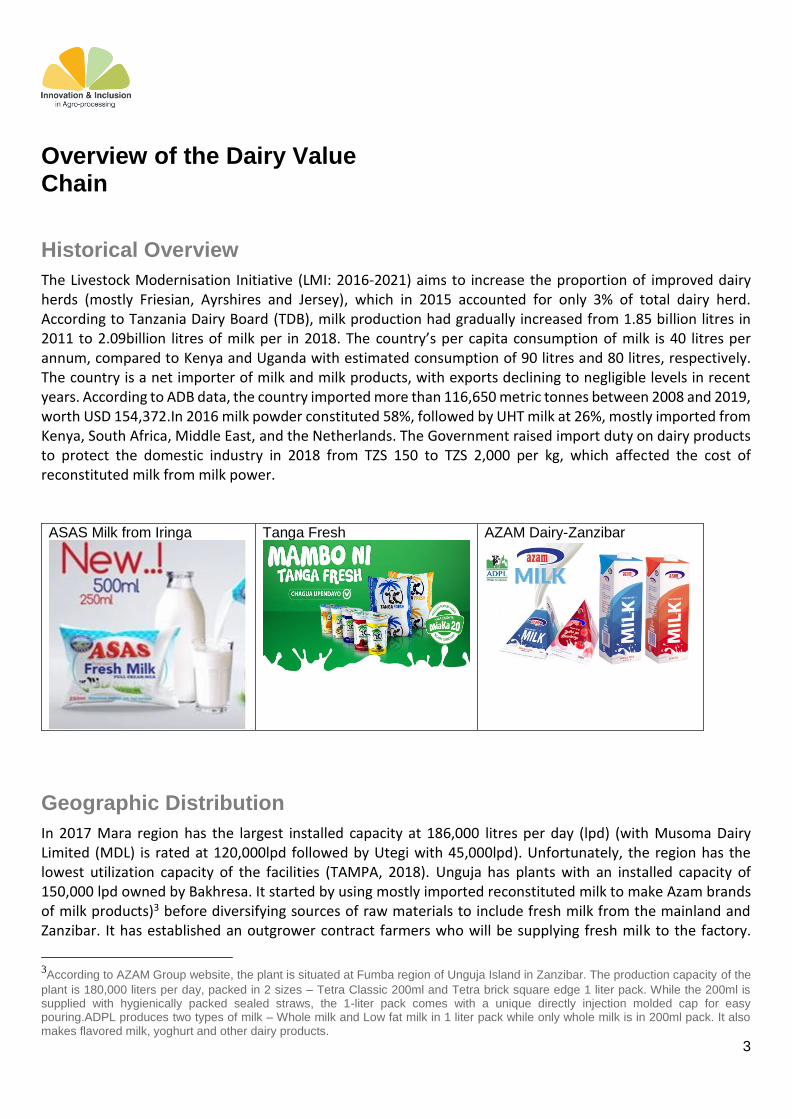
The Livestock Modernisation Initiative (LMI: 2016-2021) aims to increase the proportion of improved dairy herds (mostly Friesian, Ayrshires and Jersey), which in 2015 accounted for only 3% of total dairy herd. According to Tanzania Dairy Board (TDB), milk production had gradually increased from 1.85 billion litres in 2011 to 2.09billion litres of milk per in 2018. The country’s per capita consumption of milk is 40 litres per annum, compared to Kenya and Uganda with estimated consumption of 90 litres and 80 litres, respectively. The country is a net importer of milk and milk products, with exports declining to negligible levels in recent years. According to ADB data, the country imported more than 116,650 metric tonnes between 2008 and 2019, worth USD 154,372.In 2016 milk powder constituted 58%, followed by UHT milk at 26%, mostly imported from Kenya, South Africa, Middle East, and the Netherlands. The Government raised import duty on dairy products to protect the domestic industry in 2018 from TZS 150 to TZS 2,000 per kg, which affected the cost of reconstituted milk from milk power. ASAS Milk from Iringa
Tanga Fresh
AZAM Dairy-Zanzibar
Geographic Distribution
In 2017 Mara region has the largest installed capacity at 186,000 litres per day (lpd) (with Musoma Dairy Limited (MDL) is rated at 120,000lpd followed by Utegi with 45,000lpd). Unfortunately, the region has the lowest utilization capacity of the facilities (TAMPA, 2018). Unguja has plants with an installed capacity of 150,000 lpd owned by Bakhresa. It started by using mostly imported reconstituted milk to make Azam brands of milk products)3 before diversifying sources of raw materials to include fresh milk from the mainland and Zanzibar. It has established an outgrower contract farmers who will be supplying fresh milk to the factory.
3According to AZAM Group website, the plant is situated at Fumba region of Unguja Island in Zanzibar. The production capacity of the
plant is 180,000 liters per day, packed in 2 sizes – Tetra Classic 200ml and Tetra brick square edge 1 liter pack. While the 200ml is supplied with hygienically packed sealed straws, the 1-liter pack comes with a unique directly injection molded cap for easy pouring.ADPL produces two types of milk – Whole milk and Low fat milk in 1 liter pack while only whole milk is in 200ml pack. It also makes flavored milk, yoghurt and other dairy products.

4
Tanga region has the third largest installed capacity with 123,000 lpd, following the installation of the UHT unit by Tanga Dairies Ltd (TDL). Dar es Salaam ranks fourth with 105,000lpd, dominated by Milcom. Nationally, the processing facilities serve about 15,934 improved dairy farmers, with TDL serving the largest number of 6,500 farmers (with 42 collection centres in 9 regions), followed by Mara Dairies serving 3,600 farmers (with 6 collection centres in 5 regions), followed by TAN Dairies serving 1,355 farmers (with 15 collection centres) and MDL serving 1,000 farmers with 5 centres in 9 regions (TAMPA, 2018). When assessed by zones, the largest installed capacity for milk processing is Northern Zone (Arusha, Manyara, Kilimanjaro and Tanga) which accounts for 30% of the national installed capacity. Lake Zone (Mara, Mwanza, Kagera, Geita, Shinyanga and Simiyu) has the second largest share (27%). However, in terms of capacity utilization Lake Zone stands at 3% against 54% in the Southern Highland.
Importation of Dairy Products
The country has depended on imported dairy products in the form of skimmed milk, condensed milk, evaporated milk, dried milk and butter. There are also imports of fresh whole milk. The total amount of imports for these categories amounted to 116,650 metric tonnes (MT), valued at USD 154,372.
Competition in the sector
Two dominant brands in the market are Tanga Fresh (the leading) and ASAS who process milk products from raw milk. Products that compete are cultured milk, pasteurized milk and yoghurts. ASAS has a strong foothold on yoghurts while Azam dominates on the long shelf life milk (uses recombine imported milk powder). For UHT there is competition between Tanga Fresh and imported brands from Kenya and South Africa. However, the degree of competition is not very high because each processor has a territorial advantage, ASAS is stronger in the Southern Highlands while Tanga Fresh is stronger in the Northern and Coastal Zones. Dar es Salaam is the major market for all large processors.
Key Trends in the Dairy Sector
Milk production is estimated to grow at an annual rate of more than 3.5% per annum derived from increase in cattle population; and to a small extent from improvement in yield. According to TAMPA (2018), the number of processors has increased from 22 in 2001 to 39 in 2009, and then almost doubled to 83 by 2017 (Table 1). The installed capacity for the 83 plants in 2017 was 727,300 litres per day (lpd). However, operating capacity averaged at 181,410 lpd, which was about 25% of the installed capacity (TAMPA, 2018).
Source: FAOStat (2020): http://www.fao.org/faostat/en/#data Figure 1: Imported Amounts 2010-2017 in MT
0 20000 40000 60000
Milk Whole Fresh
Margarine
Skimmed Milk
Milk condensed+Dried+Evaporated
Butter
46857
36122
13091
11351
6820Figure 1: Imported Amounts 2010-2017 in MT

5
Producing to Meet Domestic Demand for Milk Consumption
According to TDB (2020), the changes in annual production has been in line with the demand (consumption per capita) for most of the years between 2010 and 2016, until 2017, 2018 and 2019 when the pace of annual production outpaced that of per capital consumption. The country recorded some small amounts of milk exports in 2018 (31,720 litres) and 2019 (30,720 litres).
Structure of the Sub-Sector
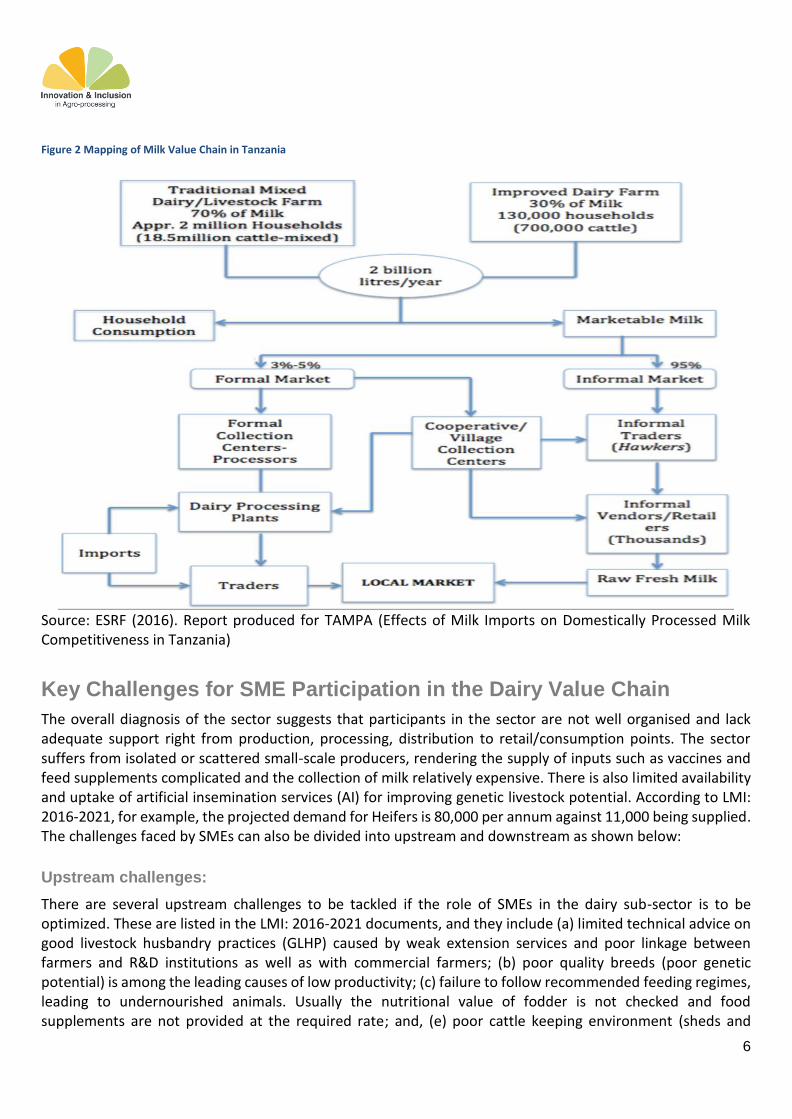
Milk production is dominated by traditional livestock According to World Bank study in 2011, about 95% of the marketed milk that is handled through the informal marketed comprising of thousands of hawkers and vendors/retailers (see Figure 2).
-100.0%
-50.0%
0.0%
50.0%
100.0%
150.0%
200.0%
250.0%
2010 2011 2012 2013 2014 2015 2016 2017 2018 2019
Imported Milk (LME, Litres)
Produced Milk (LME, Litres)
Milk Consuption per Capita (Litres)
Table 1: Growth in milk processing capacity between 2001 and 2017
2001 2009 2013 2017 Change
: 2014 -2017
Processors 22 39 74 83 12.2%
Installed capacity
514,400 743,500 44.5%
Operating capacity
108,800 181,410 66.7%
Capacity utilization
21.2% 24.4% 15.4%
Source: TAMPA, 2018- Tanzania Milk Processors Association
Figure 2: Comparison of annual increments in milk production, imports and consumption per capita
6
Figure 2 Mapping of Milk Value Chain in Tanzania
Source: ESRF (2016). Report produced for TAMPA (Effects of Milk Imports on Domestically Processed Milk Competitiveness in Tanzania)
Key Challenges for SME Participation in the Dairy Value Chain
The overall diagnosis of the sector suggests that participants in the sector are not well organised and lack adequate support right from production, processing, distribution to retail/consumption points. The sector suffers from isolated or scattered small-scale producers, rendering the supply of inputs such as vaccines and feed supplements complicated and the collection of milk relatively expensive. There is also limited availability and uptake of artificial insemination services (AI) for improving genetic livestock potential. According to LMI: 2016-2021, for example, the projected demand for Heifers is 80,000 per annum against 11,000 being supplied. The challenges faced by SMEs can also be divided into upstream and downstream as shown below:
Upstream challenges:
There are several upstream challenges to be tackled if the role of SMEs in the dairy sub-sector is to be optimized. These are listed in the LMI: 2016-2021 documents, and they include (a) limited technical advice on good livestock husbandry practices (GLHP) caused by weak extension services and poor linkage between farmers and R&D institutions as well as with commercial farmers; (b) poor quality breeds (poor genetic potential) is among the leading causes of low productivity; (c) failure to follow recommended feeding regimes, leading to undernourished animals. Usually the nutritional value of fodder is not checked and food supplements are not provided at the required rate; and, (e) poor cattle keeping environment (sheds and

7
surrounding areas) that encourage spread of diseases. A report prepared by ESRF for Baraki Sisters Farm in Musoma4 highlighted the prevalence of diseases due to lack of preventive measures such as isolation of cow sheds, controlled entry and exit, inspection of fodder, interaction with unvaccinated animals from neighbouring villages, etc.
Downstream challenges:
Equally important there are some downstream challenges to be tackled if the role of SMEs in the dairy sub-sector is to be optimized. It is generally felt that milk consumption by Tanzanians is low due to a combination of low purchasing power and lack of awareness on the nutritional value of milk relative to the intensively advertised cola drinks and juice concentrates. In addition to that, the sector is faced by other challenges including: (a) inefficient distribution system of milk contribute to limited market outreach; (b) seasonal fluctuations in the supply of milk whereby supplies can decline to as low as 50% during off season rendering processing machines idle during most of the year; (c) Lack of electricity for milk collection centres and milk kiosks; (d) relatively few milk collection centres in many rural areas with potential to produce milk, which has limited the demand at farm gate hence relatively low prices; (e) milk transportation and refrigerated containers are relatively expensive, small milk processors fail to take milk to markets; (f) lack of structured development financing to support the graduation of micro-processing facilities into small, medium; and (g) lack of reliable data for estimation of appropriate size (scale) of processing facility ideal to serve a given catchment of milk supplies. According to TAMPA (2018), this has led to establishment of facilities with underutilised excess capacity reaching 75 % for most of the year among the 83 plants with total installed capacity of 727,300lpd. Mara region has the lowest utilization capacity- below 10%.
4ESRF (2019). Needs Assessment for Demonstration Technology and Business Models at Baraki Farm, Rorya District, Mara
Region. Prepared by Dr.H.Bohela Lunogelo in July 2019 for UNDP Office, Dar-es-salaam
