dairy report 2016 - ifcnifcndairy.org/wp-content/uploads/2017/07/ifcn-dairy-report-2016... · in...
TRANSCRIPT
Dairy Report 2016For a betterunderstanding of the dairy world
IFCNThe Dairy Research Network
1© IFCN Dairy Report 2016
Dear friends, In this IFCN Dairy Report 2016 you will find a summary of the research
highlights and network activities in 2016.
The IFCN Mission and VisionIFCN Mission: We create a better understanding of the dairy world by providing comparable data, knowledge and inspiration.
IFCN Content work 2016Farm economics data: Different cost components of dairy enterprises provide us with valuable information on farm economics. Hence, detailed analyses of the production factor costs i.e. feed, labour, land, animal health, herd replacement and their drivers are presented. Methods of analysis and data quality are being improved through:• Classification of typical farms • Risk profiling of farm types• Quality assurance system
Trade data: To understand the dairy world better, it is important to observe the global dairy trade. By monitoring the monthly trade of 25 HS 6-digit dairy commodities IFCN is able to draw better conclusions on milk surplus and deficit worldwide.
Outlook: Due to the speed with which dairy business is changing, IFCN has developed scenarios for a long-term outlook of the dairy world for over 200 countries.
HIGHLIGHTS – IFCN EVENTS IN 2016
IFCN Dairy Conference 2016The focus of this conference was ‘Milk pricing systems, farmer – processor cooperation and the global dairy crisis’. Milcobel hosted this event in Ghent, Belgium, in June.
IFCN Supporter Conference 2016The conference was held in September in Wageningen, The Nether-lands. The topic covered the future of dairy farming systems and key pre-competitive areas where dairy industry can cooperate to better withstand future volatility. Trouw Nutrition and Friesland Campina were the main hosts for this conference.
IFCN Regional Workshop 2016Organized for the second time in India, this workshop offered insights on the global dairy crisis and its lessons for the dairy development in India. This workshop took place in the heart of the dairy development area in India in the city of Anand. The Workshop was sponsored by Amul, Danone and Elanco as co-sponsors.
Status of the IFCN Research Network in 2016 The dairy sector analysis covered 198 countries representing 98% of the world milk production.
In the farm comparison, 146 typical dairy farms from 60 dairy regions and 52 countries were analysed. For the first time Hungary, Kenya and Russia-NW have been included.
IFCN Dairy Report 2016
Chapter 1: Cost comparison summarises results on costs, returns, profitability and productivity of dairy farms worldwide. New in this sec-tion is the detailed presentation of cost components and their drivers.
Chapter 2: Global monitoring provides a broad overview on specific dairy issues such as milk prices, feed prices, milk: feed price ratio and the monthly milk price transmission.
Chapter 3: Dairy sector and chain profile, prepared for 105 countries, presents a comparable overview related to:
• A list of up to 10 major milk processors per country
• Milk supply and demand developments
• Milk processing profile per dairy product
• Monthly farm gate and world milk price
• Consumer prices and margins in the chain
Moreover, the key results are summarised at the beginning of the chapter via world maps.
Chapter 4: IFCN Methods & Definitions: This chapter explains the methods used for the IFCN Analyses and quality assurance.
Acknowledgement We would like to thank all IFCN Research Partners, Agribusiness Partners, Institutional Partners and the colleagues working in the IFCN Dairy Research Center during the last year. It was a pleasure to work with you and strengthen the network in 2016. We are looking forward to our activities in 2017.
Torsten Hemme Anders Fagerberg Managing Director Chairman of the IFCN Board
Introduction

2 © IFCN Dairy Report 2016
Djellali Abderrazak | Horizons Agro-alimentaires Boufarik, Gouraya, Algeria
Dairy Expert
Hugo Quattrochi | Unión Productores de Leche Cuenca Mar y Sierras, Tandil, Argentina
Anna Yeritsyan, Vardan Urutyan | International Center for Agribusiness Research and Education (ICARE), Yerevan, Armenia
Jon Hauser | Xcheque Pty Ltd, Glen Alvie, Victoria, Australia
Josef Hambrusch, Leopold Kirner | Federal Institute of Agricultural Economics, Vienna, Austria
Mohammad Uddin | Bangladesh Agricultural University, Mymensingh, Bangladesh
Национальной академии наук Беларус
и
Инст
итут системны х исследованийв АПК
Anatoli Takun, Sviatlana Takun | Institute of System Research in Agro-industrial Complex, Minsk, Belarus
Erwin Wauters | Institute for Agricul-tural and Fisheries Research, Social Sciences Unit, Marelbeke, Belgium
Steve Couture | Dairy Farmers of Canada, Ottawa, Canada
Mario E. Olivares |Cooprinsem, Osorno, Chile
Enrique Ortega, René Perez | C.N.L.M (Consejo Nacional de la Calidad de la Leche y Prevención de la Mastitis), Bogotá, Colombia
Iveta Bošková | ÚZEI – Research Institute of Agricultural Economics and Information, Prague, Czech Republic
Adel Khattab | Tanta University, Faculty of Agriculture, Animal production department, Tanta, Egypt
Rubin Benoît | Institut de l’Elevage, Service Economie de l’Exploitation, Derval, France
Dorothee Bölling | IFCN Dairy Research Center, Kiel, Germany
Kuldeep Sharma | Suruchi Consultants, Noida, Uttar Pradesh, India
Inderpreet K. Kullar | College of Dairy Science & Technology, Guru Angad Dev Veterinary and Animal Sciences University, Ludhiana, Punjab, India
Farhad Mirzaei | Animal Science Research Institute of Iran, Karaj, Iran
Fiona Thorne | Rural Economy Research Centre, Teagasc, Dublin, Ireland
Liron Tamir | Israel Dairy Board, Rishon-Le´Zion, Israel
Alberto Menghi | CRPA – Centro Ricerche Produzioni Animali, Reggio Emilia, Italy
Simone Adam | Ministère de l’Agriculture, Service d’Economie Rurale, Luxembourg, Luxembourg
José Luis Dávalos Flores | UNAM FMVZ CEIEPAA, Tequisquiapan, Mexico
Rigoberto Becerra | Establo Gibraltar, Gomez Palacio, Durango, Mexico
Rajae Filali Mahfoud | Centrale Laitière, Casablanca, Morocco
Nicola Shadbolt | College of Sciences, Massey University, Palmerston North, New Zealand
Lorildo A. Stock | Embrapa Gado de Leite (Embrapa Dairy Cattle), Juiz de Fora, Minas Gerais, Brazil
Othman Alqaisi | College of Agricultural & Marine Sciences, Sultan Qaboos University, Muscat, Oman, Jordan
Sam Shi | Dairy Consultant, Beijing, China
Dairy Consultant
Dou Ming, Hal Chin | Beijing Orient Dairy Consultants Ltd, Beijing, China
Mc Loyd Banda | DARS - Department of Agricultural Research Services, Bunda College, Lilongwe, Malawi
Susanne Clausen | SEGES, Aarhus, Denmark
Sami Ovaska, Olli Niskanen | Natural Resources Institute Finland (LUKE), Helsinki, Finland
Ola Flaten, Bjørn Gunnar Hansen | NIBIO – Norwegian Institute of Bioeconomy Research, Ås, Norway
Liu Changquan | Rural Development Institute of Chinese Academy of Social Sciences, Beijing, China
Dániel Mándi-Nagy | Research Institute of Agricultural Economics (AKI), Budapest, Hungary
Asaah Ndambi | International Live-stock Research Institute (ILRI), Nairobi, Kenya
Hironobu Takeshita | J-milk (Japan Dairy Association); Japan Milk Academic Alliance; Nagoya University, Aichi, Tokyo, Japan
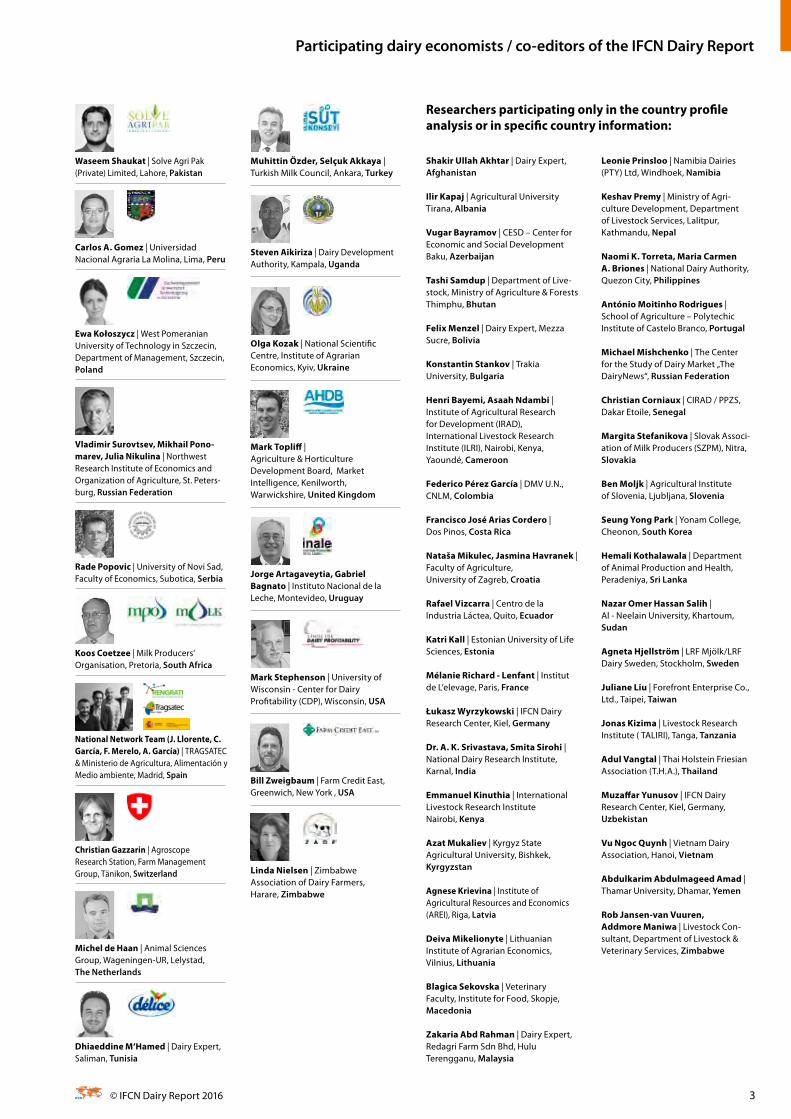
Participating dairy economists / co-editors of the IFCN Dairy Report
3© IFCN Dairy Report 2016
Shakir Ullah Akhtar | Dairy Expert, Afghanistan
Ilir Kapaj | Agricultural University Tirana, Albania
Vugar Bayramov | CESD – Center for Economic and Social Development Baku, Azerbaijan
Tashi Samdup | Department of Live-stock, Ministry of Agriculture & Forests Thimphu, Bhutan
Felix Menzel | Dairy Expert, Mezza Sucre, Bolivia
Konstantin Stankov | Trakia University, Bulgaria
Henri Bayemi, Asaah Ndambi | Institute of Agricultural Research for Development (IRAD), International Livestock Research Institute (ILRI), Nairobi, Kenya, Yaoundé, Cameroon
Federico Pérez García | DMV U.N., CNLM, Colombia
Francisco José Arias Cordero | Dos Pinos, Costa Rica
Nataša Mikulec, Jasmina Havranek | Faculty of Agriculture, University of Zagreb, Croatia
Rafael Vizcarra | Centro de la Industria Láctea, Quito, Ecuador
Katri Kall | Estonian University of Life Sciences, Estonia
Mélanie Richard - Lenfant | Institut de L‘elevage, Paris, France
Łukasz Wyrzykowski | IFCN Dairy Research Center, Kiel, Germany
Dr. A. K. Srivastava, Smita Sirohi | National Dairy Research lnstitute, Karnal, India
Emmanuel Kinuthia | International Livestock Research Institute Nairobi, Kenya
Azat Mukaliev | Kyrgyz State Agricultural University, Bishkek, Kyrgyzstan
Agnese Krievina | Institute of Agricultural Resources and Economics (AREI), Riga, Latvia
Deiva Mikelionyte | Lithuanian Institute of Agrarian Economics, Vilnius, Lithuania
Blagica Sekovska | Veterinary Faculty, Institute for Food, Skopje, Macedonia
Zakaria Abd Rahman | Dairy Expert, Redagri Farm Sdn Bhd, Hulu Terengganu, Malaysia
Leonie Prinsloo | Namibia Dairies (PTY) Ltd, Windhoek, Namibia
Keshav Premy | Ministry of Agri-culture Development, Department of Livestock Services, Lalitpur, Kathmandu, Nepal
Naomi K. Torreta, Maria Carmen A. Briones | National Dairy Authority, Quezon City, Philippines
António Moitinho Rodrigues | School of Agriculture – Polytechic Institute of Castelo Branco, Portugal
Michael Mishchenko | The Center for the Study of Dairy Market „The DairyNews“, Russian Federation
Christian Corniaux | CIRAD / PPZS, Dakar Etoile, Senegal
Margita Stefanikova | Slovak Associ-ation of Milk Producers (SZPM), Nitra, Slovakia
Ben Moljk | Agricultural Institute of Slovenia, Ljubljana, Slovenia
Seung Yong Park | Yonam College, Cheonon, South Korea
Hemali Kothalawala | Department of Animal Production and Health, Peradeniya, Sri Lanka
Nazar Omer Hassan Salih | Al - Neelain University, Khartoum, Sudan
Agneta Hjellström | LRF Mjölk/LRF Dairy Sweden, Stockholm, Sweden
Juliane Liu | Forefront Enterprise Co., Ltd., Taipei, Taiwan
Jonas Kizima | Livestock Research Institute ( TALIRI), Tanga, Tanzania
Adul Vangtal | Thai Holstein Friesian Association (T.H.A.), Thailand
Muzaffar Yunusov | IFCN Dairy Research Center, Kiel, Germany, Uzbekistan
Vu Ngoc Quynh | Vietnam Dairy Association, Hanoi, Vietnam
Abdulkarim Abdulmageed Amad | Thamar University, Dhamar, Yemen
Rob Jansen-van Vuuren, Addmore Maniwa | Livestock Con-sultant, Department of Livestock & Veterinary Services, Zimbabwe
Researchers participating only in the country profile analysis or in specific country information:
Waseem Shaukat | Solve Agri Pak (Private) Limited, Lahore, Pakistan
Carlos A. Gomez | Universidad Nacional Agraria La Molina, Lima, Peru
Ewa Kołoszycz | West Pomeranian University of Technology in Szczecin, Department of Management, Szczecin, Poland
Rade Popovic | University of Novi Sad, Faculty of Economics, Subotica, Serbia
Koos Coetzee | Milk Producers‘ Organisation, Pretoria, South Africa
Christian Gazzarin | Agroscope Research Station, Farm Management Group, Tänikon, Switzerland
Michel de Haan | Animal Sciences Group, Wageningen-UR, Lelystad, The Netherlands
Muhittin Özder, Selçuk Akkaya | Turkish Milk Council, Ankara, Turkey
Olga Kozak | National Scientific Centre, Institute of Agrarian Economics, Kyiv, Ukraine
Mark Topliff | Agriculture & Horticulture Development Board, Market Intelligence, Kenilworth, Warwickshire, United Kingdom
Mark Stephenson | University of Wisconsin - Center for Dairy Profitability (CDP), Wisconsin, USA
Bill Zweigbaum | Farm Credit East, Greenwich, New York , USA
Jorge Artagaveytia, Gabriel Bagnato | Instituto Nacional de la Leche, Montevideo, Uruguay
Steven Aikiriza | Dairy Development Authority, Kampala, Uganda
Linda Nielsen | Zimbabwe Association of Dairy Farmers, Harare, Zimbabwe
National Network Team (J. Llorente, C. García, F. Merelo, A. García) | TRAGSATEC & Ministerio de Agricultura, Alimentación y Medio ambiente, Madrid, Spain
Dhiaeddine M‘Hamed | Dairy Expert, Saliman, Tunisia
Vladimir Surovtsev, Mikhail Pono-marev, Julia Nikulina | Northwest Research Institute of Economics and Organization of Agriculture, St. Peters-burg, Russian Federation
Participating dairy economists / co-editors of the IFCN Dairy Report
4 © IFCN Dairy Report 2016
Preface IFCN Dairy Report – Developments 2000 – 2016 6 Regional maps and the typical farms 7 About IFCN 8 IFCN Dairy Research Center and IFCN Board 9 17th IFCN Dairy Conference 2016 10 13th IFCN Supporter Conference 2015 11 4th IFCN Regional Workshop 2015 12 2nd IFCN Dairy Economic Workshop 2016 13
1. Comparison of the typical farms 20151.1 Summary – Farm comparison 2015 171.2 Regional overview on costs and returns
of the dairy enterprise 181.3 Milk supply curves 2015 201.4 Cost of milk production on average sized farms 2015 221.5 Cost of milk production in larger farms 2015 231.6 Description of the dairy farms analysed 241.7 Cost of milk production only 261.8 Total costs and returns of the dairy 281.9 Returns: Milk price, non-milk returns
and decoupled subsidies 301.10 Description of direct subsidies and policies 321.11 Dairy enterprise: Profits and return to labour 341.12 Asset structure and return on investment 361.13 Summary on cost components of the dairy enterprise 38 1.14 Cost components of the dairy enterprise 401.15 Cost component: Feed 411.16 Cost component: Labour 421.17 Cost component: Land 431.18 Cost component: Animal Health 441.19 Cost component: Herd replacement 451.20 Overview of all typical farms analysed – costs and returns 461.21 Farm level time series analysis 2000 – 2015 – Cost
of milk production only 48
2. Global monitoring dairy economic indicators
2.1 Summary: Monitoring dairy economic indicators 532.2 Global trends in oil, milk and feed prices 1981–2016 542.3 Milk prices in 2015 in USD 562.4 Monitoring milk prices 1996–2015 582.5 Monthly milk price transmission and key facts 602.6 Monitoring feed prices 1996–2015 622.7 Monitoring milk : feed price ratio 1996-2015 64
Country Pages – Dairy sector and chain profiles
3. Dairy sector and chain profiles3.1 Summary – Status and trends in the dairy sector 703.2 Status and development of milk production 723.3 Importance of dairy processing 743.4 Milk consumption 76 3.5 The dairy chain 783.6 World dairy trade 803.7 Status of milk surplus, deficit and self-sufficiency 823.8 World population 833.9 Method explanation of the Country Page 2016 84
3.10 EU-28 853.11 Afghanistan 863.12 Albania 873.13 Algeria 883.14 Argentina 893.15 Armenia 903.16 Australia 913.17 Austria 923.18 Azerbaijan 933.19 Bangladesh 943.20 Belarus 953.21 Belgium 963.22 Bhutan 983.23 Bolivia 993.24 Bosnia-Herzegovina 1003.25 Brazil 1013.26 Bulgaria 1023.27 Cameroon 1033.28 Canada 1043.29 Chile 1053.30 China 1063.31 Colombia 1073.32 Costa Rica 1083.33 Croatia 1093.34 Cuba 1103.35 Cyprus 1113.36 Czech Republic 1123.37 Denmark 1133.38 Ecuador 1143.39 Egypt 1153.40 Estonia 1163.41 Ethiopia 117
3.42 Finland 1183.43 France 1193.44 Georgia 1203.45 Germany 1223.46 Greece 1233.47 Hungary 1243.48 Iceland 1253.49 India 1263.50 Indonesia 1283.51 Iran 1293.52 Ireland 1303.53 Israel 1313.54 Italy 1323.55 Jamaica 1333.56 Japan 1343.57 Jordan 1353.58 Kazakhstan 1363.59 Kenya 1373.60 Korea, Republic of 1383.61 Kyrgyzstan 1393.62 Latvia 1403.63 Lithuania 1413.64 Luxembourg 1423.65 Macedonia 1433.66 Malawi 1443.67 Malaysia 1453.68 Malta 1463.69 Mexico 1473.70 Mongolia 1483.71 Morocco 1493.72 Namibia 1503.73 Nepal 151
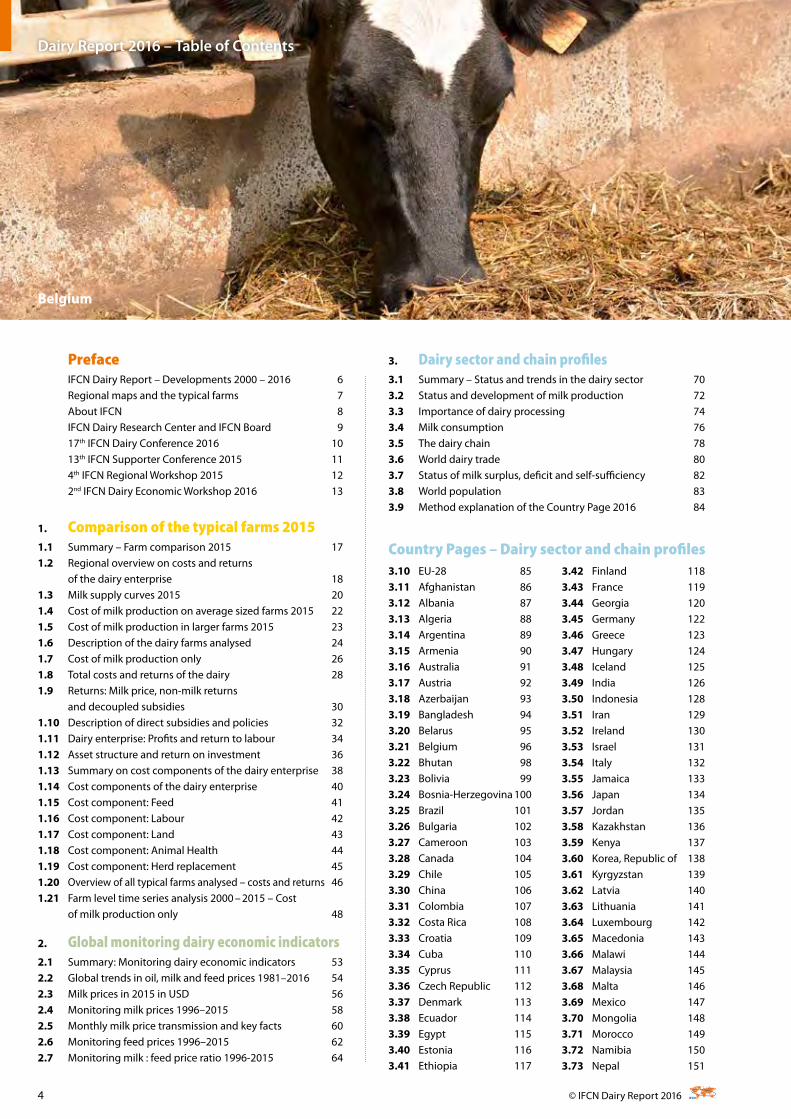
Belgium
Dairy Report 2016 – Table of Contents

5© IFCN Dairy Report 2016
4. Methods applied in IFCN Analyses4.1 Standardisation used by IFCN 198 4.2 Typical farm approach 1994.3 Definition of different enterprises 2004.4 Details on farm economic analysis 2014.5 IFCN Farm Classification of typical dairy farms 2044.6 IFCN Farm Risk Profiling 2054.7 IFCN Farm Data Quality Assurance 2054.8 IFCN Long-term Dairy Outlook 2016 206 4.9 Glossary 2084.10 Specifications of world regions 211
Annex A.1 IFCN Publications 214A.2 Typical farm approach and data quality assessment 215A.3 Description of the typical dairy farms analysed 216A.4 Abbreviations 221A.5 Exchange rates 1996 – 2015 222A.6 Who is who 224
Switzerland
3.74 Netherlands 1523.75 New Zealand 1533.76 Nigeria 1543.77 Norway 1553.78 Pakistan 1563.79 Panama 1573.80 Paraguay 1583.81 Peru 1593.82 Philippines 1603.83 Poland 1613.84 Portugal 1623.85 Romania 1633.86 Russia 1643.87 Saudi Arabia 1653.88 Senegal 1663.89 Serbia 1673.90 Slovakia 1683.91 Slovenia 1693.92 South Africa 1703.93 Spain 1713.94 Sri Lanka 172
3.95 Sudan 1733.96 Sweden 1743.97 Switzerland 1753.98 Taiwan 1763.99 Tajikistan 1773.100 Tanzania 1783.101 Thailand 1793.102 Tunisia 1803.103 Turkey 1813.104 Turkmenistan 1823.105 Uganda 1833.106 Ukraine 1843.107 United Kingdom 1863.108 Uruguay 1873.109 USA 1883.110 Uzbekistan 1893.111 Venezuela 1903.112 Vietnam 1913.113 Yemen 1923.114 Zimbabwe 193
Dairy Report 2016 – Table of Contents
Poland

6 © IFCN Dairy Report 2016
Year Countries included in No. of farm types analysed Topic of Country Report IFCN Dairy Conferences
farm comparison country profile analysis
2000 8 8 21 Ex-post analysis 1996–2000 Sep-00
2001 20 20 52 Country reports on milk production Jun-01
2002 24 24 72 Dairy production systems survey May-02
2003 27 24 76 Farm structure analysis 1990-2001 May-03
2004 31 31 92 Dairy sector profile 1981-2001 Jun-04
2005 33 41 102 Milk production fact sheet 1996-2003 May-05
2006 34 60 103 Dairy sector & chain profile 1990-2004 May-06
2007 38 73 120 Milk production fact sheet 1996-2005 Jun-07
2008 44 78 134 Dairy sector & chain profile 1996-2007 Jun-08
2009 46 80 147 Milk production fact sheet 1996-2008 Jun-09
2010 44 86 143 Dairy sector & chain profile 1996-2009 Jun-10
2011 49 90 157 Milk production fact sheet 1996-2010 Jun-11
2012 51 91 177 Dairy sector & chain profile 1996-2011 Jun-12
2013 51 95 178 Milk production fact sheet 1996-2012 Jun-13
2014 54 100 172 Dairy sector & chain profile 1996-2013 Jun-14
2015 55 100 170 Milk production fact sheet 1996-2014 Jun-15
2016 52 105 146 Dairy sector & chain profile 1996-2015 Jun-16
Which countries are participating in the IFCN Dairy Report activities in 2016?
52 countries analysed in the Farm Comparison
+53 countries participated in the Country Pages
IFCN Dairy Report – Developments 2000 – 2016
Russia

7© IFCN Dairy Report 2016
North America
Europe and Middle East
South America
South East Asia and Oceania
Legend: Numbers indicate the number of cows in the typical farms. ++ = future farm, B = Buffalo, BE = Beijing, bio = Organic, C = Central, CA = California, CF = Commercial Farm, CN = Central North, DP = Dual Purpose, E = East, JA = Jalisco, MC = Massif Central, N = North, NG = Ngantang, NW = North West, NY = New York, S = South, SE = South East, SW = South West, TO = Torréon, W = West, WI = Wisconsin
Regional maps and the typical farms
Canada65, 126
California (CA)1100, 3000
Wisconsin(WI)80, 500
Mexico26 JA47 JA
1000 TO2000 TO
New York (NY) 70, 500, 2000
Colombia6, 100 DP, 104
Peru7, 17
Argentina170400
Chile60
108435
455++ Uruguay71
142419
Brazil23 S60 S
180 SE320 SE
Africa
Morocco3 N, 14
Algeria6, 18
Tunisia2, 4, 5, 12, 290
Egypt5 B, 5, 10
Uganda1, 3, 13
Malawi1, 6Zimbabwe
45, 360
South Africa230, 520, 630
Punjab7 N, 20 N, 60 N
Haryana100 CF, 143 CF
India
China
Pakistan6, 25, 100 Bangladesh
2, 14
Indonesia3 NG, 10NG Australia
274350
New Zealand349, 1191
Japan39, 72
North1340 N, 2400 N,
3900 N
Beijing200 BE, 1400 BE
Germany30 S, 80 S, 108 S, 131 N
245 N, 700 E, 1200 E
Denmark170, 350
Norway21, 40 Finland
27, 71, 129
Russia850 NW, 850 NW++
Belarus660, 1432
Ukraine 200, 609
Poland 16, 25, 65
NL98, 215
UK 160 NW,
259 SW
Ireland 77, 133
Belgium40N, 95N
Luxembourg66, 149
Spain60 NW, 91 S,
150 NW,80 CN France
38 MC, 66 W, 84 C
Switzerland19, 23, 64
Italy154, 229
Austria17-bio, 29-bio,
65
Czech Republic
85, 400, 787
Serbia2, 10, 84
Turkey15, 100
Iran90, 120, 276, 458
Jordan76, 412
Israel100, 433
Armenia4,56
Kenya2, 10
Hungary131, 842

8 © IFCN Dairy Report 2016
The dairy world todayToday the dairy world is serving over 7 billion consumers and pro-vides livelihoods for approximately 1 billion people living on dairy farms. The key challenges for the dairy stakeholders lie in its com-plexity and the high rate of change in a globalised world.
About IFCNIFCN is the global dairy research network. By addressing challenges in the dairy world, IFCN can contribute to a more resilient and more sustainable future for all of us.
What does IFCN do?IFCN provides globally comparable dairy data, outstanding knowledge and inspiration to widen your imagination. Our core competence is in the field of milk production, milk prices and rela-ted economic topics.
How does IFCN operate?IFCN creates a better understanding of the global dairy world. The IFCN – International Farm Comparison Network – started in 2000 with basics analytics. Step by step the knowledge bases are deepe-ned and widen every year.
The knowledge is created via a network of dairy researchers from over 90 countries contributing to our annual processes, and mana-ged by the IFCN Dairy Research Center staff.
The IFCN Economic Models and standards ensure comparability between countries and provide a global picture.
More than 100 dairy related companies and organisations support the IFCN and use the knowledge to better solve challenges in the dairy world.
IFCN has innovative ways to share the knowledge with their mem-bers and with the dairy world as a whole. The IFCN Events are a key element in developing the network spirit.
IFCN Values: Trust – Independence - TruthTrust among the IFCN Partners is vital for open sharing, cooperation and a network that really works. The IFCN is independent from third parties and is committed to truth, science and reliability of results. Truth means that IFCN shows the dairy world as it is and as accu-rately as measurements allow. IFCN describes realities and reports without having any hidden agendas.
IFCN VisionWe are the leading, global knowledge organisation in milk production, milk prices and related dairy economic topics.
IFCN MissionWe create a better understanding of the dairy world by providing comparable data, knowledge and inspiration.
Dairy data: We provide globally comparable dairy economic data and forecasts.
Knowledge: We create knowledge out of our data, models and analysis. Our core competence is in the field of milk production, milk prices and related economic topics.
Inspiration: We inspire people in the dairy world to build a better future. We inspire passionate people to develop a successful career in the dairy world.
What does IFCN offer stakeholders in the dairy chain?
1. Farmers: IFCN gives you a voice to reach other players in the dairy world. Actual global milk and feed price trends and helpful IFCN Publications are presented on the IFCN Website. Farm compari-son work allows you to judge the competitive position of milk production in your region.
2. Researchers and advisors: IFCN makes you part of the lea-ding global dairy network. We support you to serve your dairy stakeholders better and to develop your professional career in the dairy world and strengthening your dairy economics profile in your country.
3. Companies: IFCN provides dairy related companies such as milk processors and farm input companies a comprehensive and continuously updated picture of the dairy world. We help you develop your business.
4. Global and national organisations involved in policy-making for agriculture, environment and food supply: IFCN provides comprehensive dairy knowledge to be used for your policy deci-sions and conferences.
5. Consumers: IFCN illustrates milk-production, its fascinating di-versity and value creation in rural areas.
6. Colleagues in the IFCN Center: You are invited to build a life time career in the IFCN center to operate globally and enjoy a stable local life. You are also welcome to use IFCN as the ideal stepping stone for further developments in the dairy world.
For further information please contact: [email protected]
About IFCN

9© IFCN Dairy Report 2016
Organisational setup
IFCN stands for International Farm Comparison Network and is a global dairy research network. The IFCN has a Dairy Research Center (DRC) with 18 employees, coordinating the network process and running dairy research activities.
Torsten Hemme
The IFCN Board has the mandate to support the IFCN management in the strategic development and guarantee transparency in the operation to the members of the network.
The IFCN Board is composed of the following members: Anders Fagerberg (chairman), Luc Morelon (nominated by the supporters), Ernesto Reyes (nominated by the researchers), Uwe Latacz-Lohmann (Kiel University), Olaf Rosenbaum (legal and fiscal expertise) and Torsten Hemme (Managing Director IFCN).
Anders FagerbergChairman
Ernesto Reyes
Luc Morelon
Uwe Latacz-Lohmann
Olaf Rosenbaum
IFCN Dairy Research Center IFCN Board
Managing Director
Amit Saha
Rebecca Kühl
Elgin Giffhorn
Maria Schmeer
Dorothee Bölling
Andreas Schier
Dairy Farm Analysis
Anke Heyer
Prashant Tripathi
Christina Schreitling
Uliana Rusetska
Network Management
Hassan Ajini
Łukasz Wyrzykowski
Barbara Siwirska
Karin Wesseling
Katrin Reincke
Muzaffar Yunusov
Dairy Sector Analysis
Sandra Bornhöft
Anna-Maria Wöhl
Office Management
Torsten Hemme
IFCN Dairy Research Center and the IFCN Board
16 | Comparison of the typical farms 2015 © IFCN Dairy Report 2016
1.1 Summary – Farm comparison 2015 17
1.2 Regional overview on costs and returns of the dairy enterprise 18
1.3 Milk supply curves 2015 20
1.4 Cost of milk production on average sized farms 2015 22
1.5 Cost of milk production on larger farms per country 2015 23
1.6 Description of the dairy farms analysed 24
1.7 Cost of milk production only 26
1.8 Total costs and returns of the dairy enterprise 28
1.9 Returns: Milk price, non-milk returns and decoupled payments 30
1.10 Description of direct subsidies and policies 32
1.11 Dairy enterprise: Profits and return to labour 34
1.12 Asset structure and return on investment 36
1.13 Summary on cost components of the dairy enterprise 38
1.14 Cost components of the dairy enterprise 40
1.15 Cost component: Feed 41
1.16 Cost component: Labour 42
1.17 Cost component: Land 43
1.18 Cost component: Animal Health 44
1.19 Cost component: Herd replacement 45
1.20 Overview of all typical farms analysed – costs and returns 46
1.21 Farm level time series analysis 2000-2015 – cost of milk production only 48
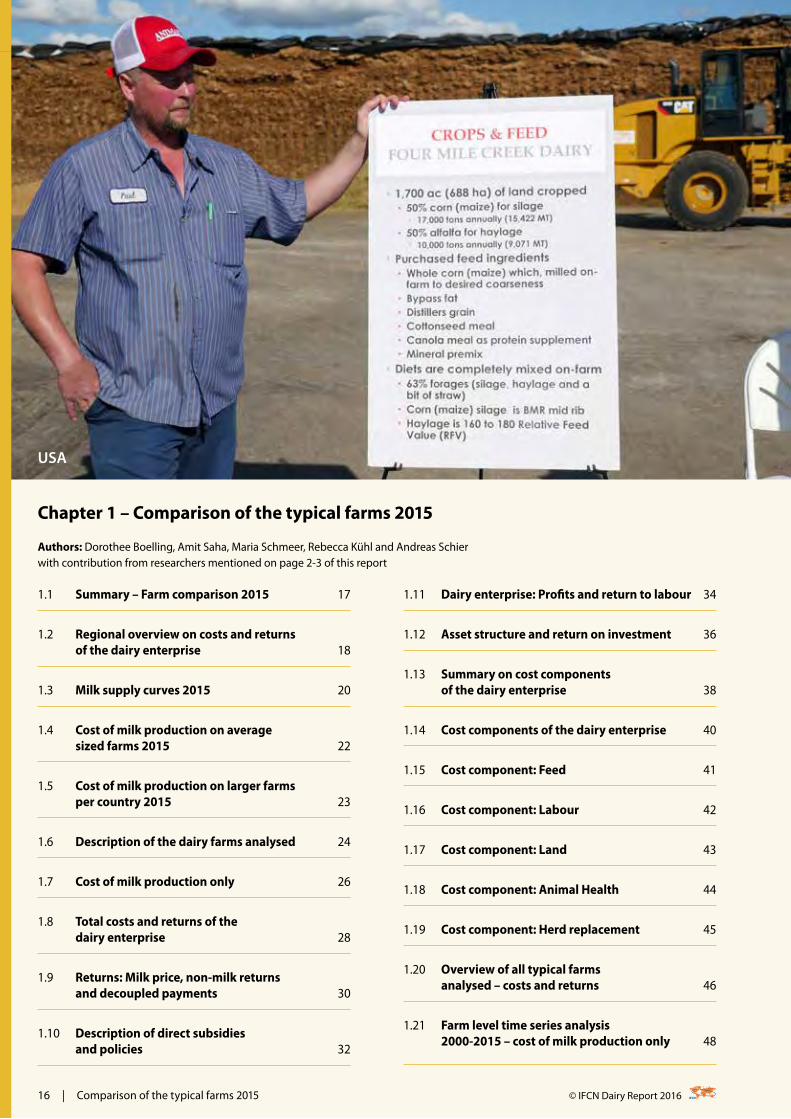
Chapter 1 – Comparison of the typical farms 2015
Authors: Dorothee Boelling, Amit Saha, Maria Schmeer, Rebecca Kühl and Andreas Schier with contribution from researchers mentioned on page 2-3 of this report
USA

52 | Global monitoring dairy economic indicators 1996 – 2015 © IFCN Dairy Report 2016
Chapter 2 – Global monitoring dairy economic indicators 1996 – 2015 Authors: Muzaffar Yunusov, Łukasz Wyrzykowski, Hassan Ajini, Barbara Siwirska and Katrin Reincke with the contribution from researchers mentioned on page 2 – 3 of this report
2.1 Summary: Monitoring dairy economic indicators 53
2.2 Global trends in oil, milk and feed prices 1981 – 2016 54
2.3 Milk prices in 2015 in USD 56
2.4 Monitoring milk prices 1996 – 2015 58
2.5 Monthly developments and key facts 60
2.6 Monthly milk price transmission and key facts 62
2.7 Monitoring milk : feed price ratio 1996 – 2015 64
0
10
20
30
40
50
60
70
1996
19
98
2000
20
02
2004
F 06
A
06
J 06
A 0
6 O
06
D 0
6 J 0
7 M
07
M 0
7 J 0
7 S
07
N 0
7
F 08
A
08
J 08
A 0
8 O
08
D 0
8 J 0
9 M
09
M 0
9 J 0
9 S
09
N 0
9
F 10
A
10
J 10
A 1
0 O
10
D 1
0 J 1
1 M
11
M 1
1 J 1
1 S
11
N 1
1
F 12
A
12
J 12
A 1
2 O
12
D 1
2 J 1
3 M
13
M 1
3 J 1
3 S
13
N 1
3
F 14
A
14
J 14
A 1
4 O
14
D 1
4 J 1
5 M
15
M 1
5 J 1
5 S
15
N 1
5
F 16
A
16
J 16
A 1
6 O
16
D 1
6
?
?
IFCN Combined World Milk Price Indicator
in U
SD /
10
0 k
g m
ilk (E
CM
)
IFCN Combined World Milk Price Indicator: weighted average of 3 IFCN World Milk Price Indicators: 1. SMP & butter (35%), 2. Cheese & whey (45%), 3. WMP (20%)
Range of IFCN World Milk Price Indicators (SMP&butter, cheese&whey, WMP)
IFCN Combined World Milk Price Indicator

Chapter 3 – Dairy sector and chain profileAuthors: Katrin Reincke, Łukasz Wyrzykowski, Hassan Ajini, Barbara Siwirska and Muzaffar Yunusov with the contribution from researchers mentioned on page 2-3 of this report
3.1 Summary – Status and trends in the dairy sector 70
3.2 Status and development of milk production 72
3.3 Importance of dairy processing 74
3.4 Milk consumption 76
3.5 The dairy chain 78
3.6 World dairy trade 80
3.7 Status of milk surplus, deficit and self-sufficiency 82
3.8 World population 83
3.9 Method explanation of the Country Page 2016 84
3.10 – 3.114 Country Pages 85-195
© IFCN Dairy Report 2016 Dairy sector and chain profile | 69
4th IFCN Regional Workshop, India, hosted by

122 | Dairy sector and chain profile © IFCN Dairy Report 2016
3.45 Germany
Dairy sector and chain profile
Status 2015
• No. 5 in the world milk production
• 96% of the 33.4 mill t milk (ECM) are delivered
• 117% self-sufficiency in milk
• 4.9 mill t ME net exports
Key developments 2010-2015
• Farmers‘ milk price on avg 6.7% above the world market price
• Farmers‘ share on consumer price decreased from
47.3% to 43.3%
• Supply increased on avg annually by 1.8%
• Demand increased on avg annually by 2.1%
ExplanationsMethod: See Chapter 3.9 for details. Sources: National statistics supplemented by data from FAO, IMF, OANDA, GTT, Eurostat, AMI.Data: 2015 data preliminary and partly estimated. Cooperatives share on milk intake shown in the list is an IFCN Estimate based on partner information.Consumer price (raw data) for: Fresh milk, 1 litre packing with 3.5% fat, 3.17% protein.Remarks: Milk processors: Milk intake data (processed milk) of Unternehmensgruppe Theo Müller and Rücker for 2013.
* other milk: Milk not delivered to dairies and milk from animals other than cow and buffalo. If applicable: Sheep, goat and camel.
Łukasz Wyrzykowski
Processing profile% of all milk produced
*other milkCondensed milkButter
Fresh productsDry productsCheese
Farm gate milk pricesEUR/100 kg milk (ECM)
IFCN World Milk Price IndicatorNational farm gate milk priceDistance nat. vs. world in EUR
Consumer & farmers' pricesEUR/100 kg milk (ECM)
Cooperatives: 45% of milk intake shown
Share on national milk delivery:
The dairy chainMilk delivered (cow's) in %Exports/national productionImports/national consumption
Key variables of the dairy sector
1996 1998 2000 2002 2004 2006 2008 2010 2012 2014 2015 '05-'10 '10-'15
Milk production (cow's)
Production (mill t ECM) 30.00 29.49 29.36 28.80 29.28 28.76 29.42 30.49 31.45 32.98 33.39 0.8% 1.8%Cows (in 1,000's) 5,195 4,833 4,564 4,373 4,287 4,054 4,229 4,182 4,190 4,296 4,285 0.1% 0.5%Milk yield (t/cow/year) 5.77 6.10 6.43 6.59 6.83 7.09 6.96 7.29 7.50 7.68 7.79 0.7% 1.3%
Dairy consumption (from all dairy species)Country consumption (mill t ME) 25.26 24.81 24.06 26.49 23.32 25.22 25.39 25.66 26.68 27.54 28.54 1.6% 2.1%Population (mill people) 82.0 82.0 82.3 82.5 82.5 82.3 82.0 81.8 80.5 81.2 81.9 -0.2% 0.0%Consumption (kg ME/capita/year) 308 302 292 321 283 306 310 314 331 339 349 1.8% 2.1%
94% 94% 95% 96% 96% 96% 96% 97% 97% 97% 96% 0.1% -0.1%39.1% 41.0% 45.7% 39.3% 53.0% 47.1% 49.3% 50.9% 54.0% 54.6% 53.4% -0.1% 0.5%27.7% 29.8% 33.6% 34.0% 40.9% 39.6% 41.2% 41.6% 45.7% 45.6% 45.4% 0.4% 0.8%
Annual change
Percent change p. a.
Trade deficitDairy imports
Trade surplusDairy exports
Dairy tradein mill t ME, from all dairy species
Milk balancein mill t, from all dairy species
Milk production (ECM)Dairy consumption (ME)Surplus / Deficit (ME)
0
5
10
15
20
25
30
35
40
1997
1999
2001
2003
2005
2007
2009
2011
2013
2015
0
2
4
6
8
10
12
14
16
18
20
1997
1999
2001
2003
2005
2007
2009
2011
2013
2015
Milk processors list 2015 Milk intake in 1,000 tons (natural content)
Processor 1 Processor 2-10 Rest 40%
-10
0
10
20
30
40
50
Jan-
06
Jan-
07
Jan-
08
Jan-
09
Jan-
10
Jan-
11
Jan-
12
Jan-
13
Jan-
14
Jan-
15
Jan-
16
0
10
20
30
40
50
60
70
80
1997
1999
2001
2003
2005
2007
2009
2011
2013
2015
0%
10%
20%
30%
40%
50%
60%
70%
80%
90%
100%
1997
1999
2001
2003
2005
2007
2009
2011
2013
2015
1. DMK Deutsches Milchkontor 6700
2. Hochwald Foods GmbH 2279
3. Unternehmensgruppe Theo Müller S.e.c.s* 2000
4. Arla Foods GmbH 1741
5. Molkerei Ammerland eG 1599
6. frischli Milchwerke GmbH 865
7. Goldsteig Käsereien Bayerwald GmbH 860
8. Meierei Barmstedt 850
9. Rücker* 850
10. Bayerische Milchindustrie eG 838
VAT Consumer priceShare (Processor, retailer)Farm gate milk price

© IFCN Dairy Report 2016 Methods applied in IFCN Analyses | 197
Chapter 4 – Methods applied in IFCN Analyses
Authors: IFCN
4.1 Standardisation used by IFCN 198
4.2 Typical farm approach 199
4.3 Definitions of different enterprises 200
4.4 Details on farm economic analysis 201
4.5 IFCN Farm Classification of typical dairy farms 204
4.6 IFCN Farm Risk Profiling 205
4.7 IFCN Farm Data Quality Assurance 205
4.8 IFCN Long-term Dairy Outlook 2016 206
4.9 Glossary 208
4.10 Specifications of world regions 211
Bangladesh

© IFCN Dairy Report 2016 Annex | 213
Annex
A.1 IFCN Dairy Publications 214
A.2 Typical farm approach and data quality assessment 215
A.3 Description of the typical dairy farms analysed 216
A.4 Abbreviations 221
A.5 Exchange rates 1996 – 2015 222
A.6 Who is who 224
IFCN team members in action

Partners of the IFCN
ISSN 1610-434X
Dairy researchers representing 105 countries
Institutional partners
Agribusiness partners
Milking and barn equipment
Health and hygiene
Farm machinery
Genetics for animal & plants
Other branches of the dairy chain
Milk processing
Feed
International Dairy Federation