dam failure - guadalupe-blanco river authority · dams are water storage, control or diversion...
TRANSCRIPT
DAM FAILURE
H A Z A R D M I T I G A T I O N P L A N U P D A T E : P R O T E C T I N G T H E R E G I O N A G A I N S T A L L H A Z A R D S
Hazard Description ........................................................................................................................................ 1
Location ......................................................................................................................................................... 2
Extent .......................................................................................................................................................... 12
Historical Occurrences ................................................................................................................................ 16
Probability of Future Events ....................................................................................................................... 16
Impact and Vulnerability ............................................................................................................................. 16
Hazard Description
Dams are water storage, control or diversion structures that impound water upstream in reservoirs.
Dam failure can take several forms, including a collapse of, or breach in, the structure. While most dams
have storage volumes small enough that failures have few or no repercussions, dams storing large
amounts can cause significant flooding downstream. Dam failures can result from any one, or a
combination, of the following causes:
Prolonged periods of rainfall and flooding, which cause most failures;
Inadequate spillway capacity, resulting in excess overtopping of the embankment;
Internal erosion caused by embankment or foundation leakage or piping;
Improper maintenance, including failure to remove trees, repair internal seepage problems, or
maintain gates, valves, and other operational components;
Improper design or use of improper construction materials;
Failure of upstream dams in the same drainage basin;
Landslides into reservoirs, which cause surges that result in overtopping;
High winds, which can cause significant wave action and result in substantial erosion;
Destructive acts of terrorists; and
Earthquakes, which typically cause longitudinal cracks at the tops of the embankments, leading
to structural failure.
Benefits provided by dams include water supplies for drinking, irrigation and industrial uses; flood
control; hydroelectric power; recreation; and navigation. At the same time, dams also represent a risk
to public safety. Dams require ongoing maintenance, monitoring, safety inspections, and sometimes
even rehabilitation to continue safe service.
In the event of a dam failure, the energy of the water stored behind the dam is capable of causing rapid
and unexpected flooding downstream, resulting in loss of life and great property damage. A devastating
S E C T I O N 1 4 : D A M F A I L U R E
Hazard Mitigation Plan Update | 2011-2016 2
effect on water supply and power generation could be expected as well. The terrorist attacks of
September 11, 2001, generated increased focus on protecting the country’s infrastructure, including
ensuring the safety of dams.
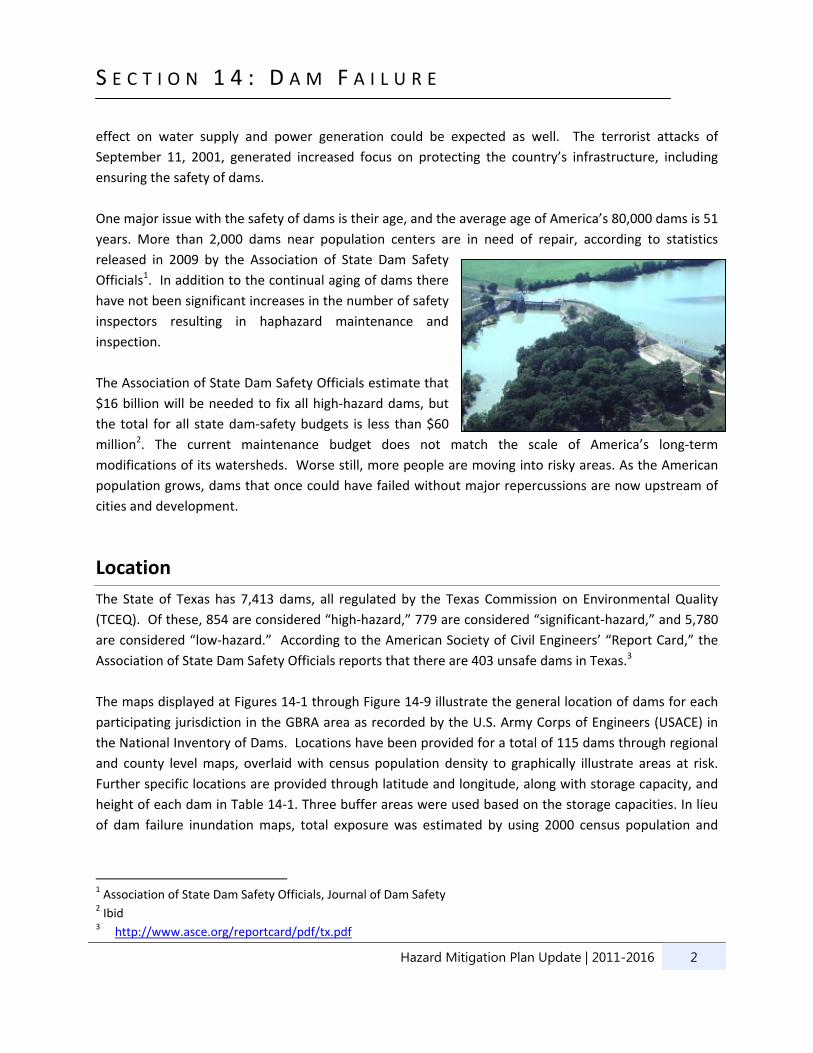
One major issue with the safety of dams is their age, and the average age of America’s 80,000 dams is 51
years. More than 2,000 dams near population centers are in need of repair, according to statistics
released in 2009 by the Association of State Dam Safety
Officials1. In addition to the continual aging of dams there
have not been significant increases in the number of safety
inspectors resulting in haphazard maintenance and
inspection.
The Association of State Dam Safety Officials estimate that
$16 billion will be needed to fix all high‐hazard dams, but
the total for all state dam‐safety budgets is less than $60
million2. The current maintenance budget does not match the scale of America’s long‐term
modifications of its watersheds. Worse still, more people are moving into risky areas. As the American
population grows, dams that once could have failed without major repercussions are now upstream of
cities and development.
Location
The State of Texas has 7,413 dams, all regulated by the Texas Commission on Environmental Quality
(TCEQ). Of these, 854 are considered “high‐hazard,” 779 are considered “significant‐hazard,” and 5,780
are considered “low‐hazard.” According to the American Society of Civil Engineers’ “Report Card,” the
Association of State Dam Safety Officials reports that there are 403 unsafe dams in Texas.3
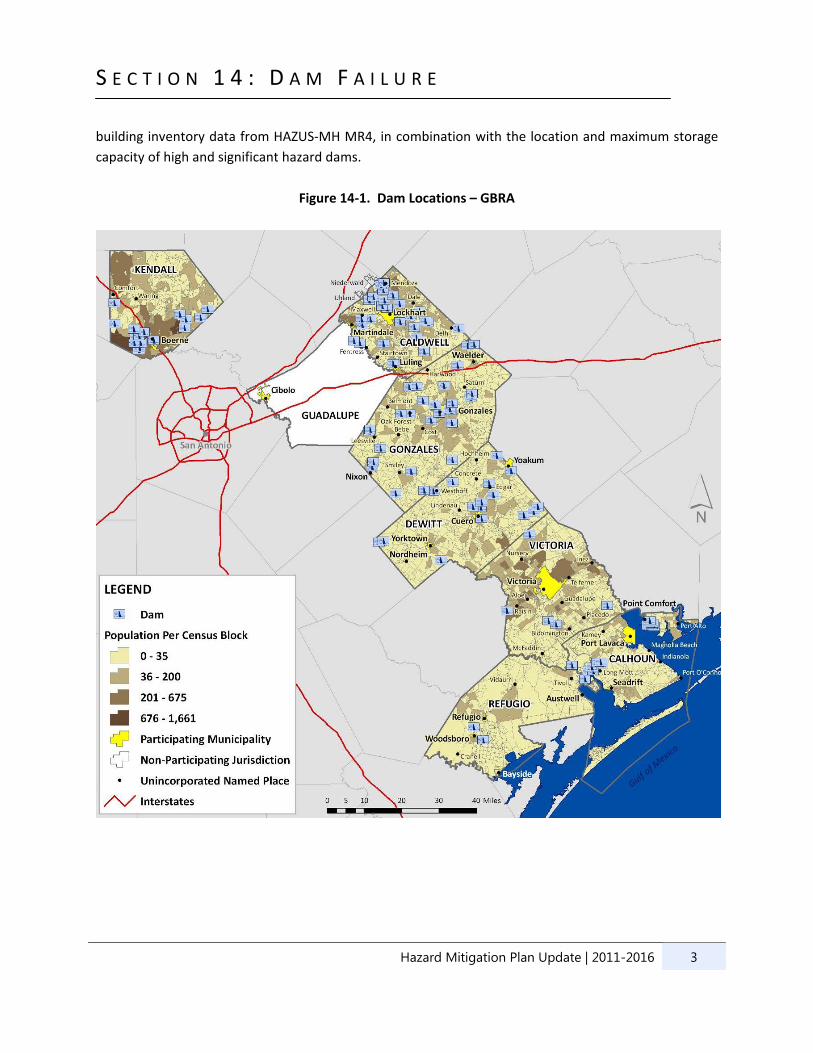
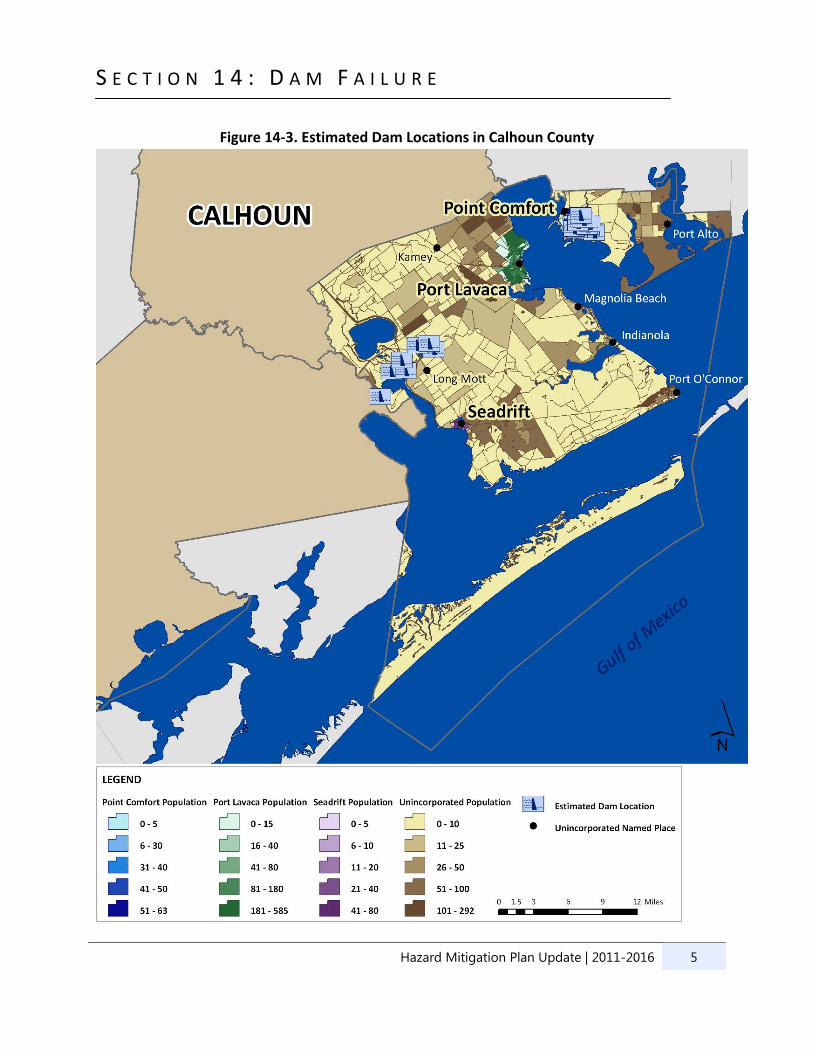
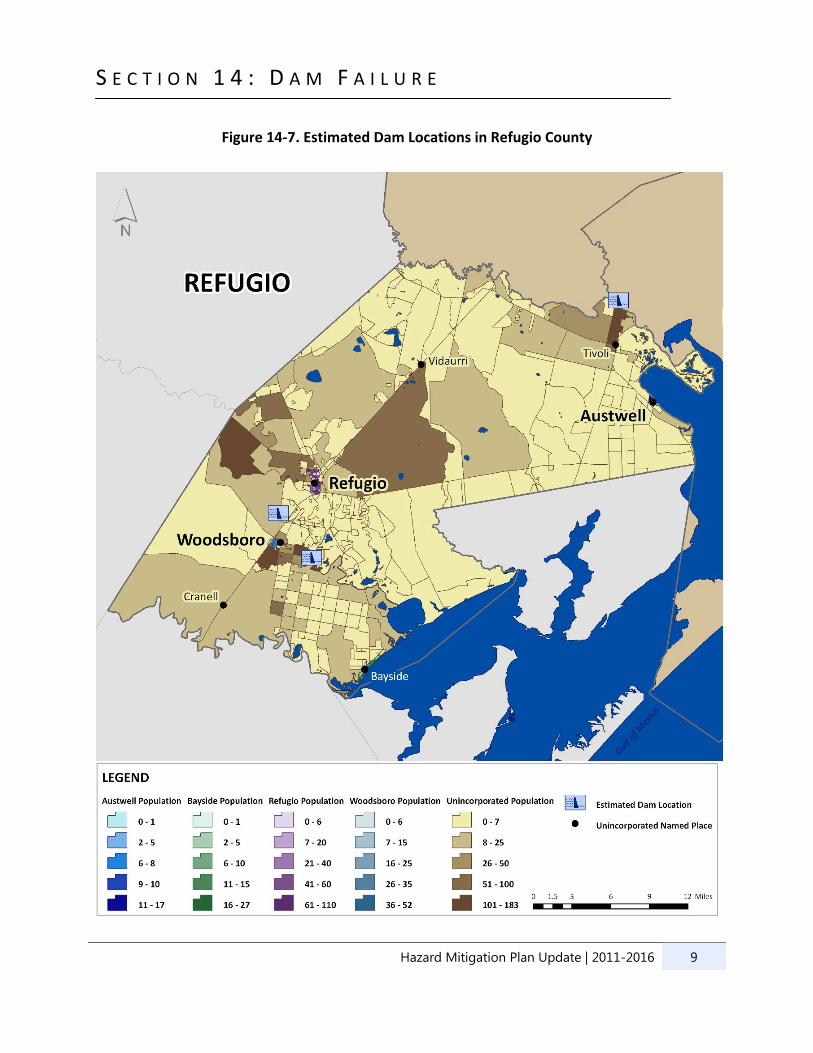
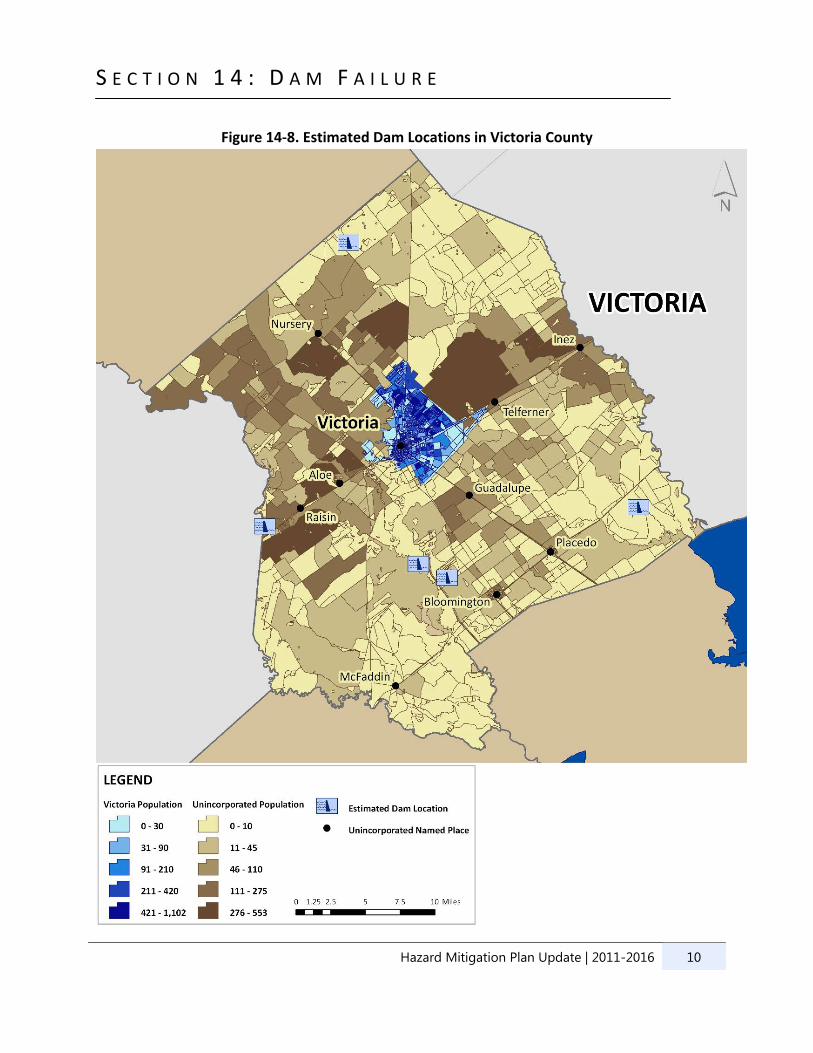
The maps displayed at Figures 14‐1 through Figure 14‐9 illustrate the general location of dams for each
participating jurisdiction in the GBRA area as recorded by the U.S. Army Corps of Engineers (USACE) in
the National Inventory of Dams. Locations have been provided for a total of 115 dams through regional
and county level maps, overlaid with census population density to graphically illustrate areas at risk.
Further specific locations are provided through latitude and longitude, along with storage capacity, and
height of each dam in Table 14‐1. Three buffer areas were used based on the storage capacities. In lieu
of dam failure inundation maps, total exposure was estimated by using 2000 census population and
1 Association of State Dam Safety Officials, Journal of Dam Safety 2 Ibid 3 http://www.asce.org/reportcard/pdf/tx.pdf
S E C T I O N 1 4 : D A M F A I L U R E
Hazard Mitigation Plan Update | 2011-2016 3
building inventory data from HAZUS‐MH MR4, in combination with the location and maximum storage
capacity of high and significant hazard dams.
Figure 14‐1. Dam Locations – GBRA
S E C T I O N 1 4 : D A M F A I L U R E
Hazard Mitigation Plan Update | 2011-2016 4
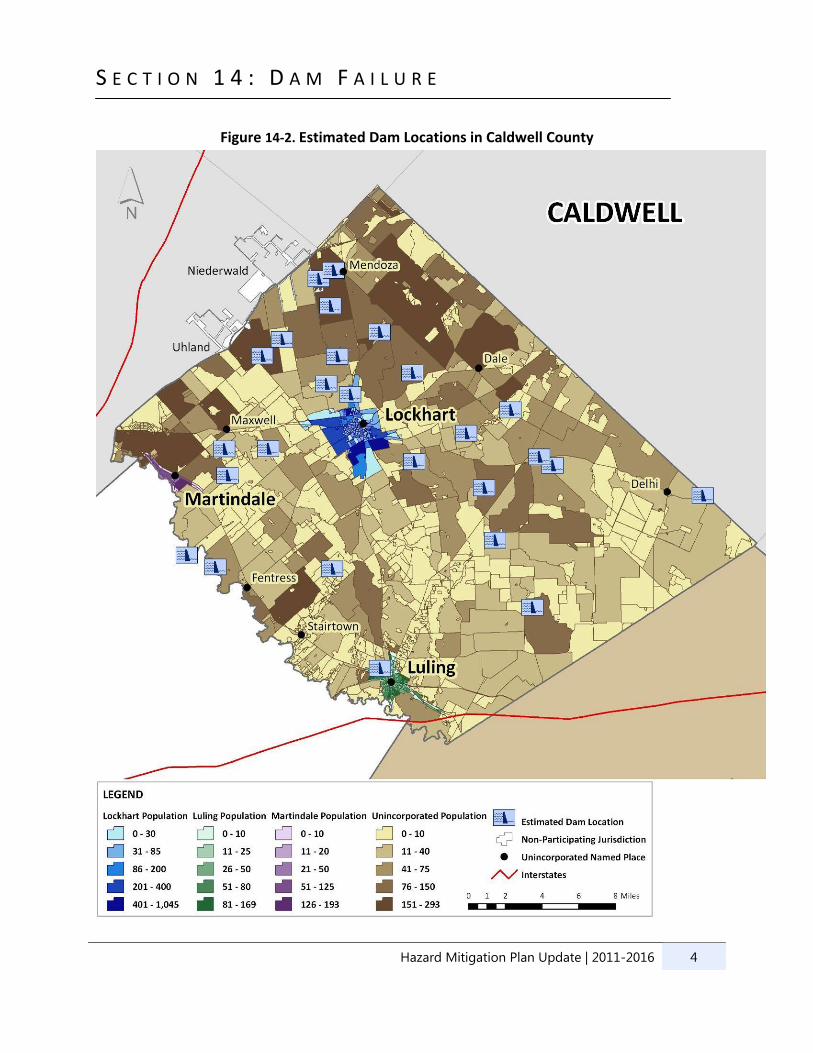
Figure 14‐2. Estimated Dam Locations in Caldwell County
S E C T I O N 1 4 : D A M F A I L U R E
Hazard Mitigation Plan Update | 2011-2016 5
Figure 14‐3. Estimated Dam Locations in Calhoun County
S E C T I O N 1 4 : D A M F A I L U R E
Hazard Mitigation Plan Update | 2011-2016 6
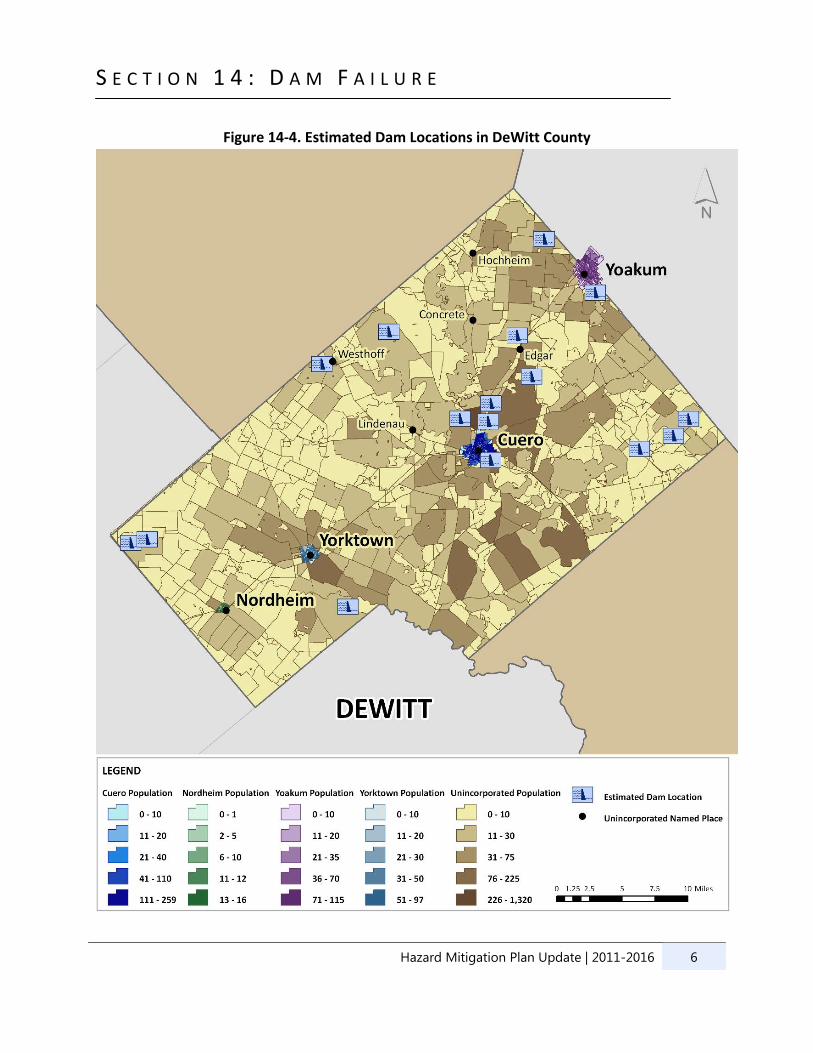
Figure 14‐4. Estimated Dam Locations in DeWitt County
S E C T I O N 1 4 : D A M F A I L U R E
Hazard Mitigation Plan Update | 2011-2016 7
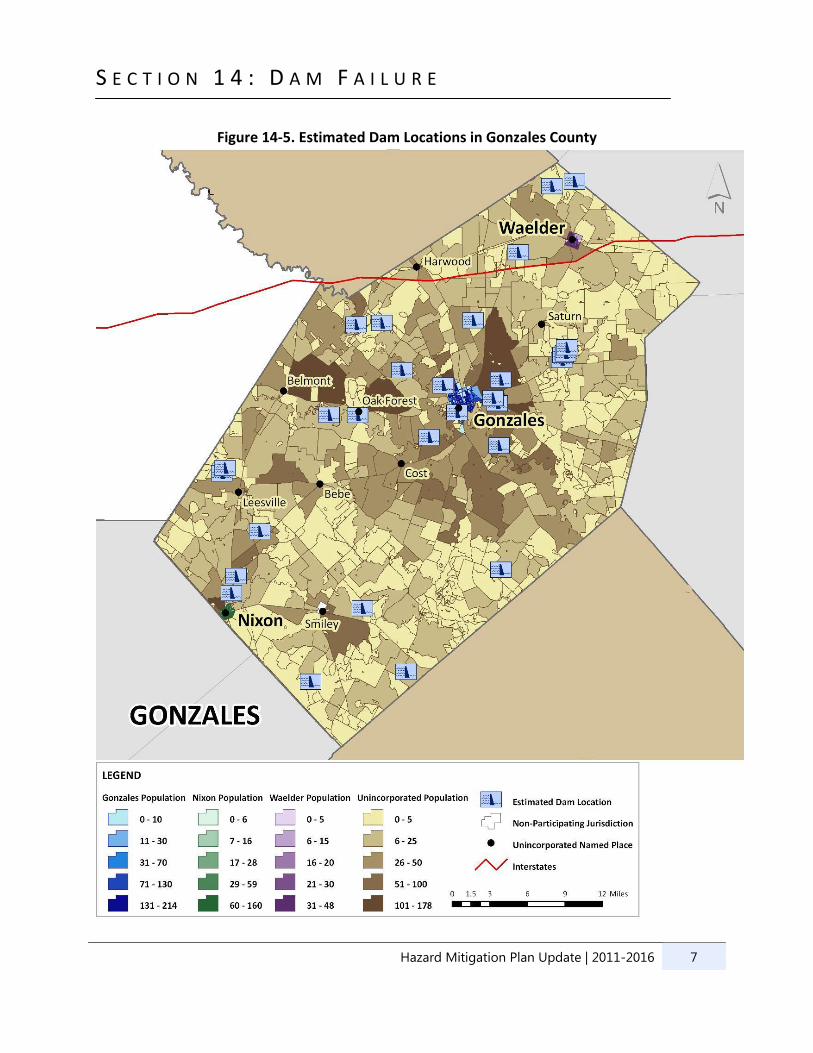
Figure 14‐5. Estimated Dam Locations in Gonzales County
S E C T I O N 1 4 : D A M F A I L U R E
Hazard Mitigation Plan Update | 2011-2016 8
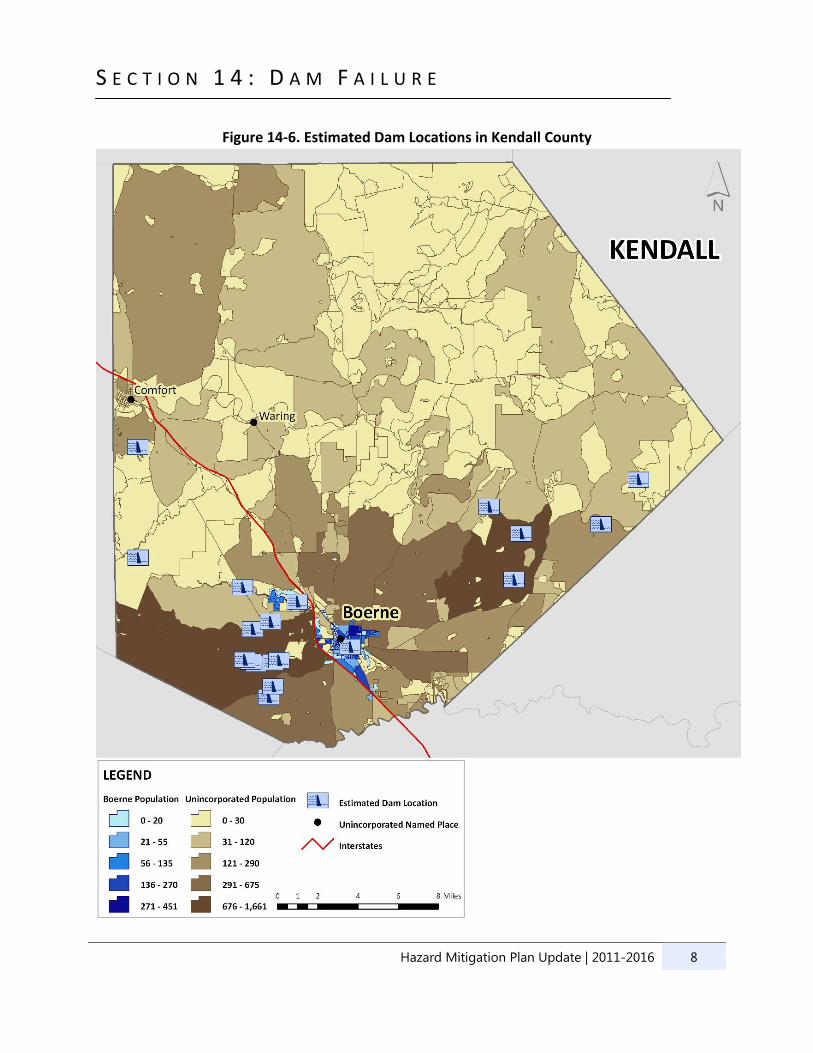
Figure 14‐6. Estimated Dam Locations in Kendall County
S E C T I O N 1 4 : D A M F A I L U R E
Hazard Mitigation Plan Update | 2011-2016 9
Figure 14‐7. Estimated Dam Locations in Refugio County
S E C T I O N 1 4 : D A M F A I L U R E
Hazard Mitigation Plan Update | 2011-2016 10
Figure 14‐8. Estimated Dam Locations in Victoria County
S E C T I O N 1 4 : D A M F A I L U R E
Hazard Mitigation Plan Update | 2011-2016 11
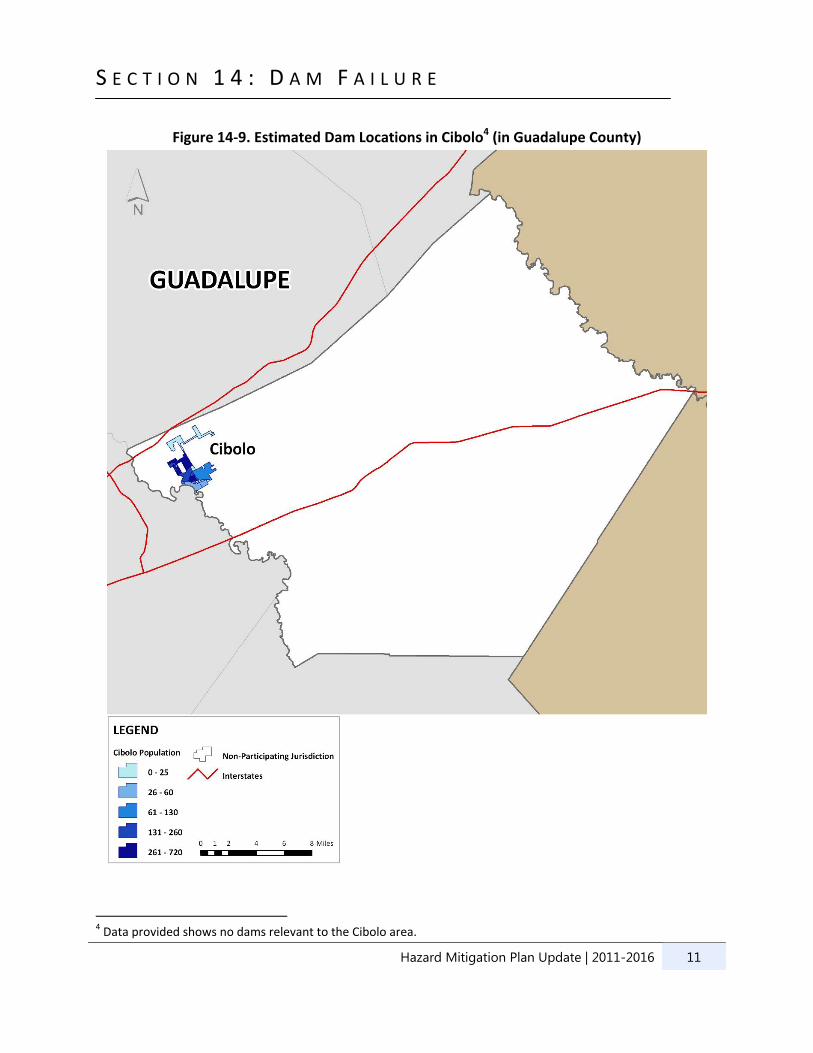
Figure 14‐9. Estimated Dam Locations in Cibolo4 (in Guadalupe County)
4 Data provided shows no dams relevant to the Cibolo area.
S E C T I O N 1 4 : D A M F A I L U R E
Hazard Mitigation Plan Update | 2011-2016 12
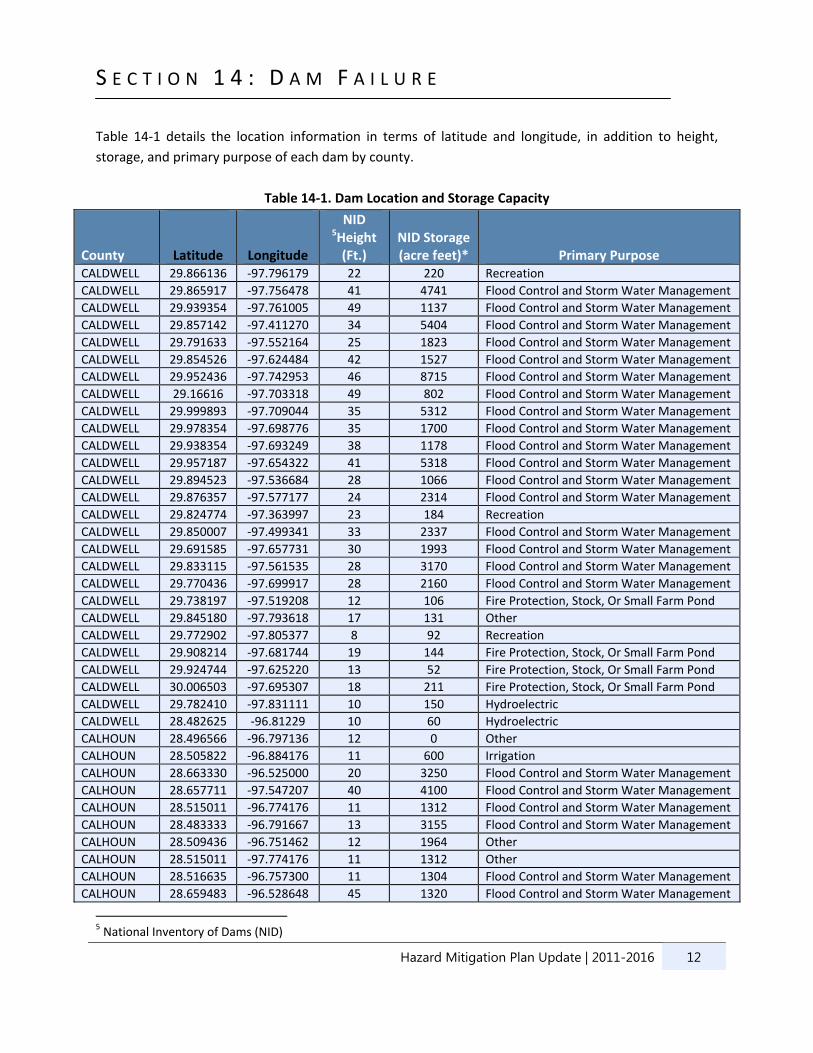
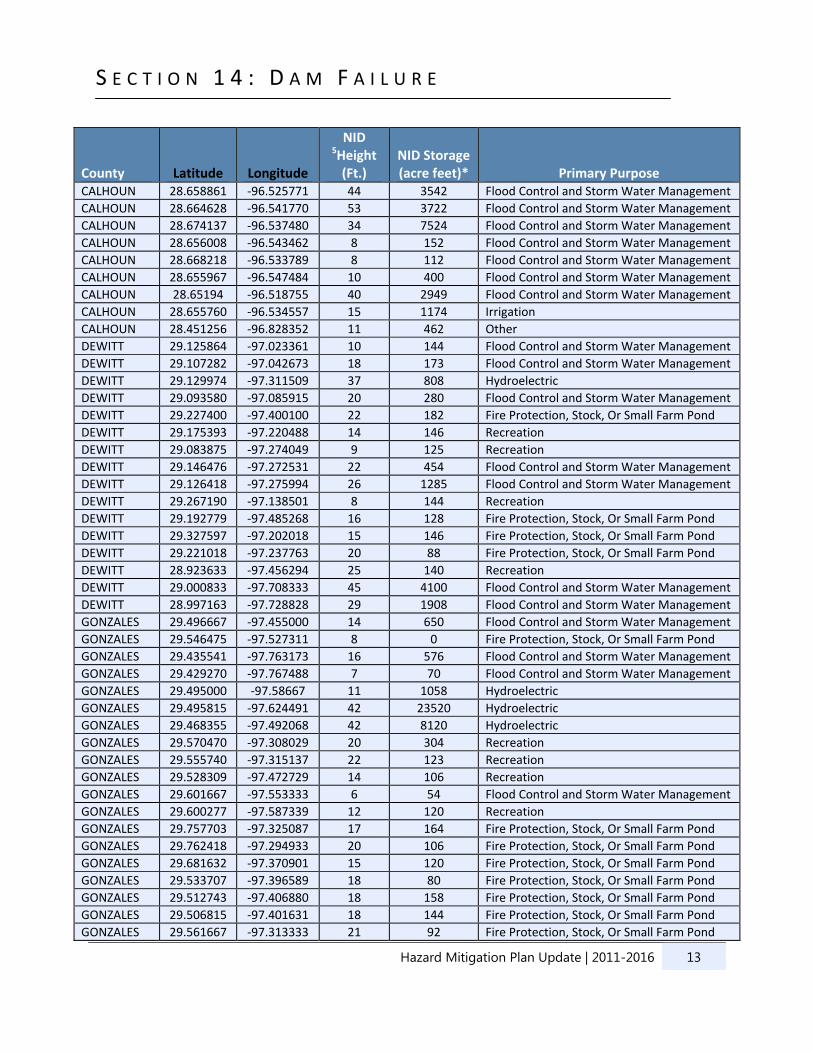
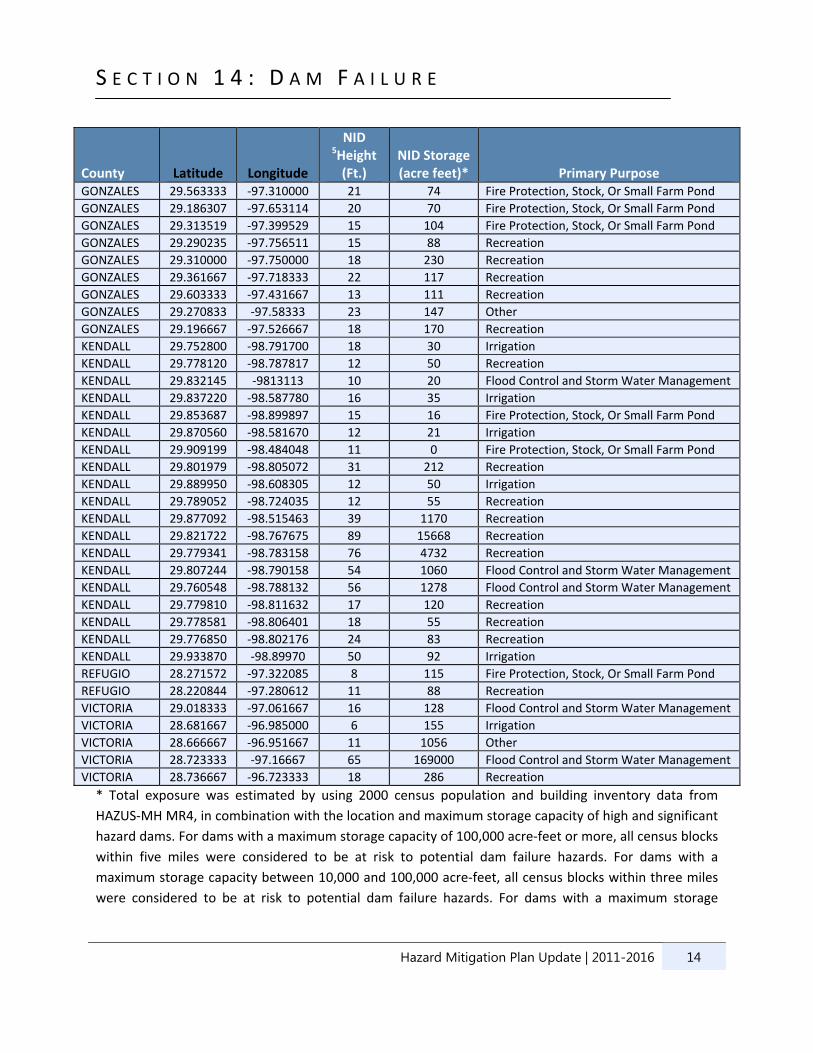
Table 14‐1 details the location information in terms of latitude and longitude, in addition to height,
storage, and primary purpose of each dam by county.
Table 14‐1. Dam Location and Storage Capacity
County
Latitude
Longitude
NID 5Height (Ft.)
NID Storage (acre feet)* Primary Purpose
CALDWELL 29.866136 ‐97.796179 22 220 Recreation
CALDWELL 29.865917 ‐97.756478 41 4741 Flood Control and Storm Water Management
CALDWELL 29.939354 ‐97.761005 49 1137 Flood Control and Storm Water Management
CALDWELL 29.857142 ‐97.411270 34 5404 Flood Control and Storm Water Management
CALDWELL 29.791633 ‐97.552164 25 1823 Flood Control and Storm Water Management
CALDWELL 29.854526 ‐97.624484 42 1527 Flood Control and Storm Water Management
CALDWELL 29.952436 ‐97.742953 46 8715 Flood Control and Storm Water Management
CALDWELL 29.16616 ‐97.703318 49 802 Flood Control and Storm Water Management
CALDWELL 29.999893 ‐97.709044 35 5312 Flood Control and Storm Water Management
CALDWELL 29.978354 ‐97.698776 35 1700 Flood Control and Storm Water Management
CALDWELL 29.938354 ‐97.693249 38 1178 Flood Control and Storm Water Management
CALDWELL 29.957187 ‐97.654322 41 5318 Flood Control and Storm Water Management
CALDWELL 29.894523 ‐97.536684 28 1066 Flood Control and Storm Water Management
CALDWELL 29.876357 ‐97.577177 24 2314 Flood Control and Storm Water Management
CALDWELL 29.824774 ‐97.363997 23 184 Recreation
CALDWELL 29.850007 ‐97.499341 33 2337 Flood Control and Storm Water Management
CALDWELL 29.691585 ‐97.657731 30 1993 Flood Control and Storm Water Management
CALDWELL 29.833115 ‐97.561535 28 3170 Flood Control and Storm Water Management
CALDWELL 29.770436 ‐97.699917 28 2160 Flood Control and Storm Water Management
CALDWELL 29.738197 ‐97.519208 12 106 Fire Protection, Stock, Or Small Farm Pond
CALDWELL 29.845180 ‐97.793618 17 131 Other
CALDWELL 29.772902 ‐97.805377 8 92 Recreation
CALDWELL 29.908214 ‐97.681744 19 144 Fire Protection, Stock, Or Small Farm Pond
CALDWELL 29.924744 ‐97.625220 13 52 Fire Protection, Stock, Or Small Farm Pond
CALDWELL 30.006503 ‐97.695307 18 211 Fire Protection, Stock, Or Small Farm Pond
CALDWELL 29.782410 ‐97.831111 10 150 Hydroelectric
CALDWELL 28.482625 ‐96.81229 10 60 Hydroelectric
CALHOUN 28.496566 ‐96.797136 12 0 Other
CALHOUN 28.505822 ‐96.884176 11 600 Irrigation
CALHOUN 28.663330 ‐96.525000 20 3250 Flood Control and Storm Water Management
CALHOUN 28.657711 ‐97.547207 40 4100 Flood Control and Storm Water Management
CALHOUN 28.515011 ‐96.774176 11 1312 Flood Control and Storm Water Management
CALHOUN 28.483333 ‐96.791667 13 3155 Flood Control and Storm Water Management
CALHOUN 28.509436 ‐96.751462 12 1964 Other
CALHOUN 28.515011 ‐97.774176 11 1312 Other
CALHOUN 28.516635 ‐96.757300 11 1304 Flood Control and Storm Water Management
CALHOUN 28.659483 ‐96.528648 45 1320 Flood Control and Storm Water Management
5 National Inventory of Dams (NID)
S E C T I O N 1 4 : D A M F A I L U R E
Hazard Mitigation Plan Update | 2011-2016 13
County
Latitude
Longitude
NID 5Height (Ft.)
NID Storage (acre feet)* Primary Purpose
CALHOUN 28.658861 ‐96.525771 44 3542 Flood Control and Storm Water Management
CALHOUN 28.664628 ‐96.541770 53 3722 Flood Control and Storm Water Management
CALHOUN 28.674137 ‐96.537480 34 7524 Flood Control and Storm Water Management
CALHOUN 28.656008 ‐96.543462 8 152 Flood Control and Storm Water Management
CALHOUN 28.668218 ‐96.533789 8 112 Flood Control and Storm Water Management
CALHOUN 28.655967 ‐96.547484 10 400 Flood Control and Storm Water Management
CALHOUN 28.65194 ‐96.518755 40 2949 Flood Control and Storm Water Management
CALHOUN 28.655760 ‐96.534557 15 1174 Irrigation
CALHOUN 28.451256 ‐96.828352 11 462 Other
DEWITT 29.125864 ‐97.023361 10 144 Flood Control and Storm Water Management
DEWITT 29.107282 ‐97.042673 18 173 Flood Control and Storm Water Management
DEWITT 29.129974 ‐97.311509 37 808 Hydroelectric
DEWITT 29.093580 ‐97.085915 20 280 Flood Control and Storm Water Management
DEWITT 29.227400 ‐97.400100 22 182 Fire Protection, Stock, Or Small Farm Pond
DEWITT 29.175393 ‐97.220488 14 146 Recreation
DEWITT 29.083875 ‐97.274049 9 125 Recreation
DEWITT 29.146476 ‐97.272531 22 454 Flood Control and Storm Water Management
DEWITT 29.126418 ‐97.275994 26 1285 Flood Control and Storm Water Management
DEWITT 29.267190 ‐97.138501 8 144 Recreation
DEWITT 29.192779 ‐97.485268 16 128 Fire Protection, Stock, Or Small Farm Pond
DEWITT 29.327597 ‐97.202018 15 146 Fire Protection, Stock, Or Small Farm Pond
DEWITT 29.221018 ‐97.237763 20 88 Fire Protection, Stock, Or Small Farm Pond
DEWITT 28.923633 ‐97.456294 25 140 Recreation
DEWITT 29.000833 ‐97.708333 45 4100 Flood Control and Storm Water Management
DEWITT 28.997163 ‐97.728828 29 1908 Flood Control and Storm Water Management
GONZALES 29.496667 ‐97.455000 14 650 Flood Control and Storm Water Management
GONZALES 29.546475 ‐97.527311 8 0 Fire Protection, Stock, Or Small Farm Pond
GONZALES 29.435541 ‐97.763173 16 576 Flood Control and Storm Water Management
GONZALES 29.429270 ‐97.767488 7 70 Flood Control and Storm Water Management
GONZALES 29.495000 ‐97.58667 11 1058 Hydroelectric
GONZALES 29.495815 ‐97.624491 42 23520 Hydroelectric
GONZALES 29.468355 ‐97.492068 42 8120 Hydroelectric
GONZALES 29.570470 ‐97.308029 20 304 Recreation
GONZALES 29.555740 ‐97.315137 22 123 Recreation
GONZALES 29.528309 ‐97.472729 14 106 Recreation
GONZALES 29.601667 ‐97.553333 6 54 Flood Control and Storm Water Management
GONZALES 29.600277 ‐97.587339 12 120 Recreation
GONZALES 29.757703 ‐97.325087 17 164 Fire Protection, Stock, Or Small Farm Pond
GONZALES 29.762418 ‐97.294933 20 106 Fire Protection, Stock, Or Small Farm Pond
GONZALES 29.681632 ‐97.370901 15 120 Fire Protection, Stock, Or Small Farm Pond
GONZALES 29.533707 ‐97.396589 18 80 Fire Protection, Stock, Or Small Farm Pond
GONZALES 29.512743 ‐97.406880 18 158 Fire Protection, Stock, Or Small Farm Pond
GONZALES 29.506815 ‐97.401631 18 144 Fire Protection, Stock, Or Small Farm Pond
GONZALES 29.561667 ‐97.313333 21 92 Fire Protection, Stock, Or Small Farm Pond
S E C T I O N 1 4 : D A M F A I L U R E
Hazard Mitigation Plan Update | 2011-2016 14
County
Latitude
Longitude
NID 5Height (Ft.)
NID Storage (acre feet)* Primary Purpose
GONZALES 29.563333 ‐97.310000 21 74 Fire Protection, Stock, Or Small Farm Pond
GONZALES 29.186307 ‐97.653114 20 70 Fire Protection, Stock, Or Small Farm Pond
GONZALES 29.313519 ‐97.399529 15 104 Fire Protection, Stock, Or Small Farm Pond
GONZALES 29.290235 ‐97.756511 15 88 Recreation
GONZALES 29.310000 ‐97.750000 18 230 Recreation
GONZALES 29.361667 ‐97.718333 22 117 Recreation
GONZALES 29.603333 ‐97.431667 13 111 Recreation
GONZALES 29.270833 ‐97.58333 23 147 Other
GONZALES 29.196667 ‐97.526667 18 170 Recreation
KENDALL 29.752800 ‐98.791700 18 30 Irrigation
KENDALL 29.778120 ‐98.787817 12 50 Recreation
KENDALL 29.832145 ‐9813113 10 20 Flood Control and Storm Water Management
KENDALL 29.837220 ‐98.587780 16 35 Irrigation
KENDALL 29.853687 ‐98.899897 15 16 Fire Protection, Stock, Or Small Farm Pond
KENDALL 29.870560 ‐98.581670 12 21 Irrigation
KENDALL 29.909199 ‐98.484048 11 0 Fire Protection, Stock, Or Small Farm Pond
KENDALL 29.801979 ‐98.805072 31 212 Recreation
KENDALL 29.889950 ‐98.608305 12 50 Irrigation
KENDALL 29.789052 ‐98.724035 12 55 Recreation
KENDALL 29.877092 ‐98.515463 39 1170 Recreation
KENDALL 29.821722 ‐98.767675 89 15668 Recreation
KENDALL 29.779341 ‐98.783158 76 4732 Recreation
KENDALL 29.807244 ‐98.790158 54 1060 Flood Control and Storm Water Management
KENDALL 29.760548 ‐98.788132 56 1278 Flood Control and Storm Water Management
KENDALL 29.779810 ‐98.811632 17 120 Recreation
KENDALL 29.778581 ‐98.806401 18 55 Recreation
KENDALL 29.776850 ‐98.802176 24 83 Recreation
KENDALL 29.933870 ‐98.89970 50 92 Irrigation
REFUGIO 28.271572 ‐97.322085 8 115 Fire Protection, Stock, Or Small Farm Pond
REFUGIO 28.220844 ‐97.280612 11 88 Recreation
VICTORIA 29.018333 ‐97.061667 16 128 Flood Control and Storm Water Management
VICTORIA 28.681667 ‐96.985000 6 155 Irrigation
VICTORIA 28.666667 ‐96.951667 11 1056 Other
VICTORIA 28.723333 ‐97.16667 65 169000 Flood Control and Storm Water Management
VICTORIA 28.736667 ‐96.723333 18 286 Recreation
* Total exposure was estimated by using 2000 census population and building inventory data from
HAZUS‐MH MR4, in combination with the location and maximum storage capacity of high and significant
hazard dams. For dams with a maximum storage capacity of 100,000 acre‐feet or more, all census blocks
within five miles were considered to be at risk to potential dam failure hazards. For dams with a
maximum storage capacity between 10,000 and 100,000 acre‐feet, all census blocks within three miles
were considered to be at risk to potential dam failure hazards. For dams with a maximum storage
S E C T I O N 1 4 : D A M F A I L U R E
Hazard Mitigation Plan Update | 2011-2016 15
capacity of less than 10,000 acre‐feet, all census blocks within one mile were considered to be at risk to
potential dam failure hazards.
Extent
The extent or magnitude of a dam failure event can be measured in terms of the classification of the
dam. The National Interagency Committee on Dam Safety defines high hazard dams as those where
failure or mis‐operation will cause loss of human life. Prior to 2009, high hazard dams were defined as
those at which failure or mis‐operation would probably cause loss of human life. Dams classified as
“significant” are those at which failure or mis‐operation probably would not result in loss of human life
but could cause economic loss, environmental damage, disruption of lifeline facilities, or other
significant damage. Low hazard potential dams are those at which failure or mis‐operation probably
would not result in loss of human life but would cause limited economic and/or environmental losses.
Losses would be limited mainly to the owner’s property.
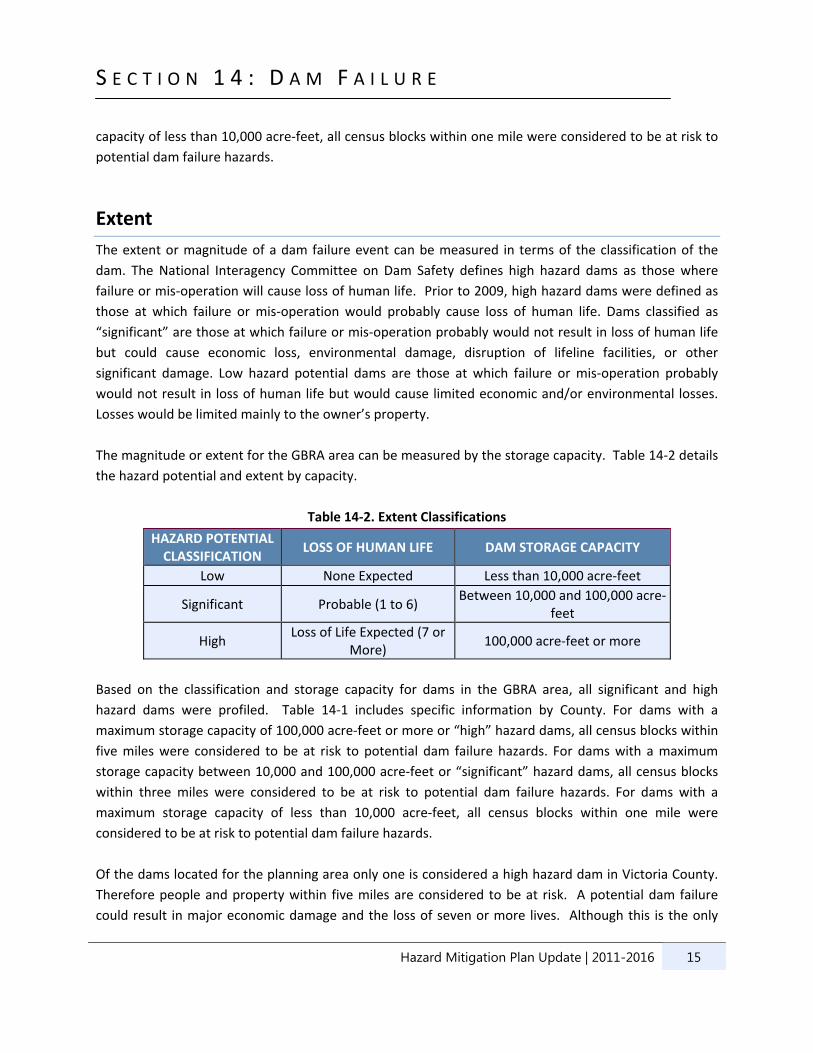
The magnitude or extent for the GBRA area can be measured by the storage capacity. Table 14‐2 details
the hazard potential and extent by capacity.
Table 14‐2. Extent Classifications
HAZARD POTENTIAL CLASSIFICATION
LOSS OF HUMAN LIFE DAM STORAGE CAPACITY
Low None Expected Less than 10,000 acre‐feet
Significant Probable (1 to 6) Between 10,000 and 100,000 acre‐
feet
High Loss of Life Expected (7 or
More) 100,000 acre‐feet or more
Based on the classification and storage capacity for dams in the GBRA area, all significant and high
hazard dams were profiled. Table 14‐1 includes specific information by County. For dams with a
maximum storage capacity of 100,000 acre‐feet or more or “high” hazard dams, all census blocks within
five miles were considered to be at risk to potential dam failure hazards. For dams with a maximum
storage capacity between 10,000 and 100,000 acre‐feet or “significant” hazard dams, all census blocks
within three miles were considered to be at risk to potential dam failure hazards. For dams with a
maximum storage capacity of less than 10,000 acre‐feet, all census blocks within one mile were
considered to be at risk to potential dam failure hazards.
Of the dams located for the planning area only one is considered a high hazard dam in Victoria County.
Therefore people and property within five miles are considered to be at risk. A potential dam failure
could result in major economic damage and the loss of seven or more lives. Although this is the only
S E C T I O N 1 4 : D A M F A I L U R E
Hazard Mitigation Plan Update | 2011-2016 16
high hazard dams, two other dams are considered to be significant hazard dams. These dams are
located in Kendall and Gonzales counties. People and property within three miles of these dams are
considered at risk, with a potential for loss of life of one to six people.
Historical Occurrences
There are about 80,000 dams in the United States today.6 Catastrophic dam failures have occurred
frequently throughout the past century. Between 1918 and 1958, 33 major U.S. dam failures caused
1,680 deaths. From 1959 to 1965, nine major dams failed worldwide. Some of the largest disasters in
the U.S. have resulted from dam failures. More than 520 dam incidents, including 21 dam failures, were
reported in the past two years to the National Performance of Dams Program, which collects and
archives information on dam performance from state and federal regulatory agencies and dam owners.
The State of Texas has not experienced loss of life or extensive economic damage due to a dam failure
since the first half of the twentieth century. However, due to limited state staff, many incidents are not
reported and, therefore, the actual number of incidents is likely to be greater. There has not been a
recorded dam failure event for any of the participating jurisdictions in the basin.
Probability of Future Events
No historical events of dam failure have been recorded in the GBRA area, though the risk of dam failure
is monitored closely. Due the lack of historical occurrences, the probability of a future event is unlikely,
meaning an event is possible in the next ten years.
Impact and Vulnerability
Table 14‐3 lists the number of high and significant hazard dams for each participating jurisdiction in the
region, and the total estimated exposure of people and buildings to potential dam failure hazards. Due
to homeland security concerns, the analysis was performed for all high and significant hazard dams as a
single group per NID classification based on storage capacity, as opposed to separate analyses being
conducted for high‐hazard dams and significant‐hazard dams separately. In lieu of dam failure
inundation maps, total exposure was estimated by using 2000 census population and building inventory
data from HAZUS‐MH MR4, in combination with the location and maximum storage capacity of high and
significant hazard dams. For dams with a maximum storage capacity of 100,000 acre‐feet or more, all
census blocks within five miles were considered to be at risk to potential dam failure hazards. For dams
with a maximum storage capacity between 10,000 and 100,000 acre‐feet, all census blocks within three
6 Federal Emergency Management Agency, Dam Safety Program, http://www.fema.gov/hazards/damsafety/.
S E C T I O N 1 4 : D A M F A I L U R E
Hazard Mitigation Plan Update | 2011-2016 17
miles were considered to be at risk to potential dam failure hazards. For dams with a maximum storage
capacity of less than 10,000 acre‐feet, all census blocks within one mile were considered to be at risk to
potential dam failure hazards.
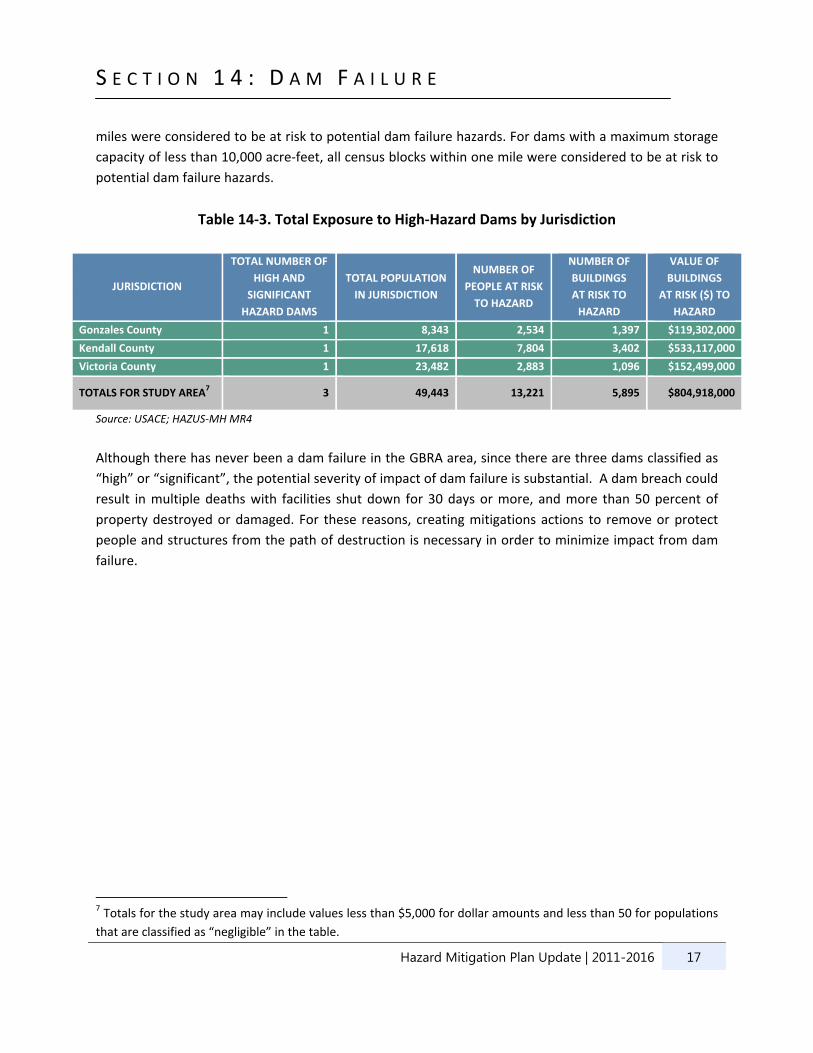
Table 14‐3. Total Exposure to High‐Hazard Dams by Jurisdiction
JURISDICTION
TOTAL NUMBER OF
HIGH AND
SIGNIFICANT
HAZARD DAMS
TOTAL POPULATION
IN JURISDICTION
NUMBER OF
PEOPLE AT RISK
TO HAZARD
NUMBER OF
BUILDINGS
AT RISK TO
HAZARD
VALUE OF
BUILDINGS
AT RISK ($) TO
HAZARD
Gonzales County 1 8,343 2,534 1,397 $119,302,000
Kendall County 1 17,618 7,804 3,402 $533,117,000
Victoria County 1 23,482 2,883 1,096 $152,499,000
TOTALS FOR STUDY AREA7 3 49,443 13,221 5,895 $804,918,000
Source: USACE; HAZUS‐MH MR4
Although there has never been a dam failure in the GBRA area, since there are three dams classified as
“high” or “significant”, the potential severity of impact of dam failure is substantial. A dam breach could
result in multiple deaths with facilities shut down for 30 days or more, and more than 50 percent of
property destroyed or damaged. For these reasons, creating mitigations actions to remove or protect
people and structures from the path of destruction is necessary in order to minimize impact from dam
failure.
7 Totals for the study area may include values less than $5,000 for dollar amounts and less than 50 for populations
that are classified as “negligible” in the table.