damage assessment using high resolution satellite imagery
TRANSCRIPT
1
DAMAGE ASSESSMENT USING HIGH RESOLUTION SATELLITE IMAGERY:
APPLICATION TO 2001 BHUJ, INDIA, EARTHQUAKE
L. Chiroiu1,2 , G. André1,2
ABSTRACT
Various studies were carried out in the last years with the purpose of assessing natural hazard damages using remote sensing and photo interpretation techniques. Most of them analyze the case of floods or landslides, where damages could be estimated. For the seismic events, the first studies were carried out basically after the Kocaeli Earthquake of 1999, were spatial images from various satellites could be exploited. The recent progresses of remote sensing in terms of spatial resolution and data processing open new possibilities concerning the natural hazard assessment. Using a high resolution optical imagery available today, a damage detection could be performed inclusively in urban areas. A multidisciplinary approach based on high resolution satellite data and earthquake engineering was applied in order to estimate the damage after the Bhuj, (India), Earthquake of January 26th, 2001. The study provide a fast loss estimation, in terms of physical damage and human casualties. A Geographic Information System has been used in order to display the spatial distribution of damages. The results could be very useful for the rescue teams deployed immediately after the catastrophe.
INTRODUCTION The potential of optical or radar satellite imagery is well known into the field of the natural hazard applications. Various studies were carried out in the past years after the major catastrophes, in order to estimate losses, especially for the case of floods, hurricanes or landslides (7). For the case of earthquakes, the medium or small spatial resolution data available in the recent past did not allow a reliable loss estimation, due to the size of the damaged elements (e.g. buildings or other structures), too small compared with the pixel size. The highest resolution available a few years ago was 5 meters in panchromatic mode (i.e. black & white) of Indian IRS satellite, followed by 10 meters panchromatic of the French Spot 1 - 4 satellites. Only large urban zones completely destroyed could be detected and mapped by remote sensing, which was the case of the 1999 Kocaeli earthquake, Turkey (2, 3). 1 PhD Candidate, Université Paris-7 Denis Diderot, GHSS, CNRS UMR 8586 PRODIG, Case 7001, 2 place Jussieu, 752251 Paris Cedex 05; France e-mail : [email protected], [email protected] 2 Géosciences Consultants, 157 rue des Blains, 92220 Bagneux; e-mail: [email protected]

2
FIGURE 1. Bhuj, January 28, 2001, 1 meter IKONOS image (credit: www.spaceimaging.com)
FIGURE 2. Bhuj, 1998, 2 meters KVR 1000 image (credit: www.cartographic.com)
A new generation of high resolution optical imagery is provided today by commercial satellites such IKONOS, launched in 1999, with 1 meter resolution in panchromatic mode and 4 meters in multispectral, or EROS A1, launched in 2000, with 1.8 meters resolution in panchromatic mode. Features like buildings, streets or cars become visible with a high ground resolution. In the recent future, an incredible under 1m resolution of Quickbird* satellite will be available for the civil applications (0.61 meters in panchromatic mode, 2.8 meters in multispectral). The high level of details makes possible a reliable damage detection to the buildings or to other structures. This study is proposing to asses damages in the urban area of the city of Bhuj after the January 26th earthquake by high resolution optical imagery. Using a 1 meter image taken after the event and a 2 meters image acquired before the earthquake, losses were recognized by mono and multi temporal approaches. The damaged area was analyzed in terms of surface, and the results were integrated into a GIS base. Fast human casualties estimations were obtained using two simplified approaches. The results were compared with the official statistics and field reports. The possibility of a near real time damage assessment could help the rescue operations, the spatial distribution of damages being very important for the emergency teams deployed immediately after the catastrophe.
SATELLITE DATA The data used in this work is a 1 meter IKONOS multispectral simulation (a combination of 1 meter panchromatic and 4 meters multispectral) taken two days after the earthquake (Fig. 1), and a 2 meters panchromatic image acquired in 1998 by KVR-1000 satellite (Fig. 2). The IKONOS image covers 90 percent of the urban area of Bhuj city, while the KVR image covers the entire city, including the rural zones. Sharpen and texture filters were applied to both images in order to improve the quality of the data.
* launched on October 18th, 2001
3
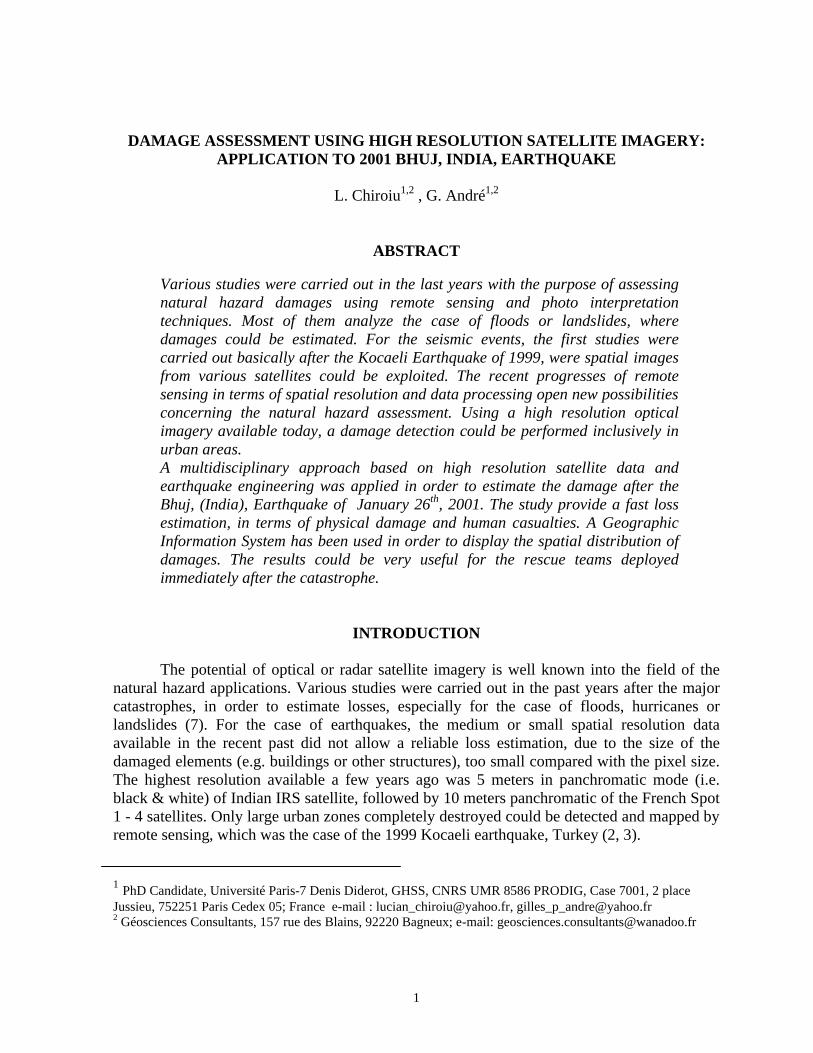
FIGURE 3. The red circles correspond to the typical ancient building types, with the old town at the north side.
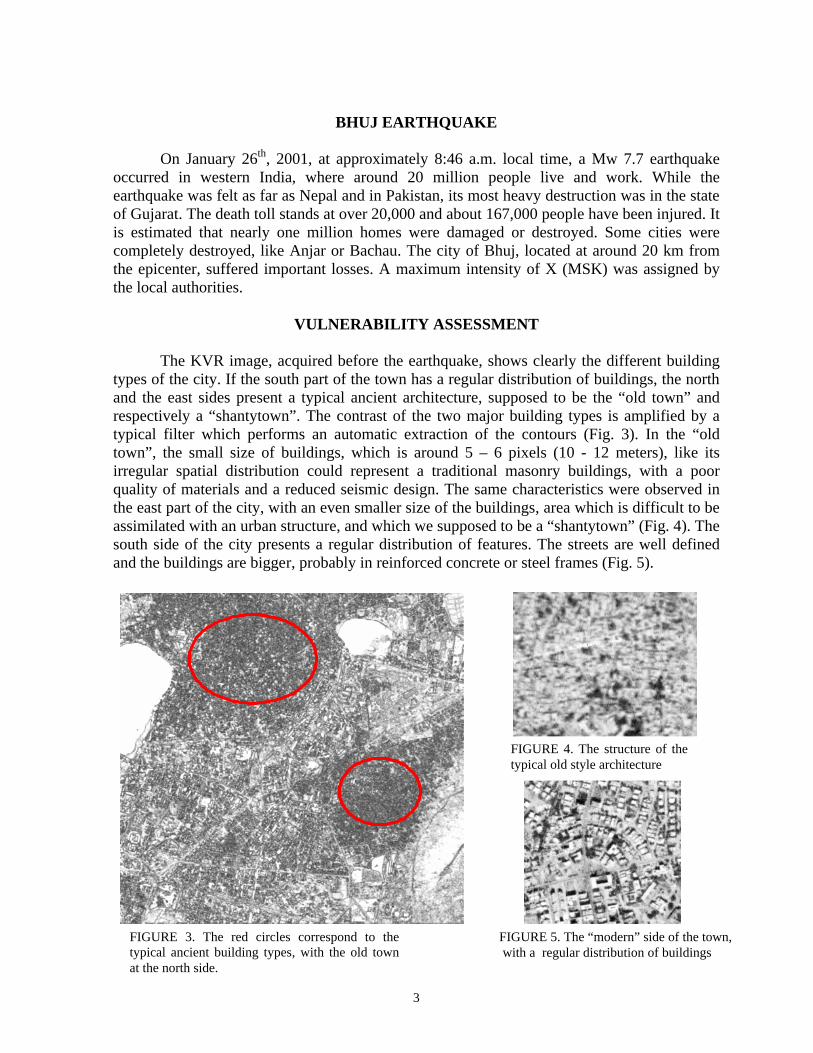
FIGURE 5. The “modern” side of the town, with a regular distribution of buildings
FIGURE 4. The structure of the typical old style architecture
BHUJ EARTHQUAKE On January 26th, 2001, at approximately 8:46 a.m. local time, a Mw 7.7 earthquake occurred in western India, where around 20 million people live and work. While the earthquake was felt as far as Nepal and in Pakistan, its most heavy destruction was in the state of Gujarat. The death toll stands at over 20,000 and about 167,000 people have been injured. It is estimated that nearly one million homes were damaged or destroyed. Some cities were completely destroyed, like Anjar or Bachau. The city of Bhuj, located at around 20 km from the epicenter, suffered important losses. A maximum intensity of X (MSK) was assigned by the local authorities.
VULNERABILITY ASSESSMENT The KVR image, acquired before the earthquake, shows clearly the different building types of the city. If the south part of the town has a regular distribution of buildings, the north and the east sides present a typical ancient architecture, supposed to be the “old town” and respectively a “shantytown”. The contrast of the two major building types is amplified by a typical filter which performs an automatic extraction of the contours (Fig. 3). In the “old town”, the small size of buildings, which is around 5 – 6 pixels (10 - 12 meters), like its irregular spatial distribution could represent a traditional masonry buildings, with a poor quality of materials and a reduced seismic design. The same characteristics were observed in the east part of the city, with an even smaller size of the buildings, area which is difficult to be assimilated with an urban structure, and which we supposed to be a “shantytown” (Fig. 4). The south side of the city presents a regular distribution of features. The streets are well defined and the buildings are bigger, probably in reinforced concrete or steel frames (Fig. 5).
4
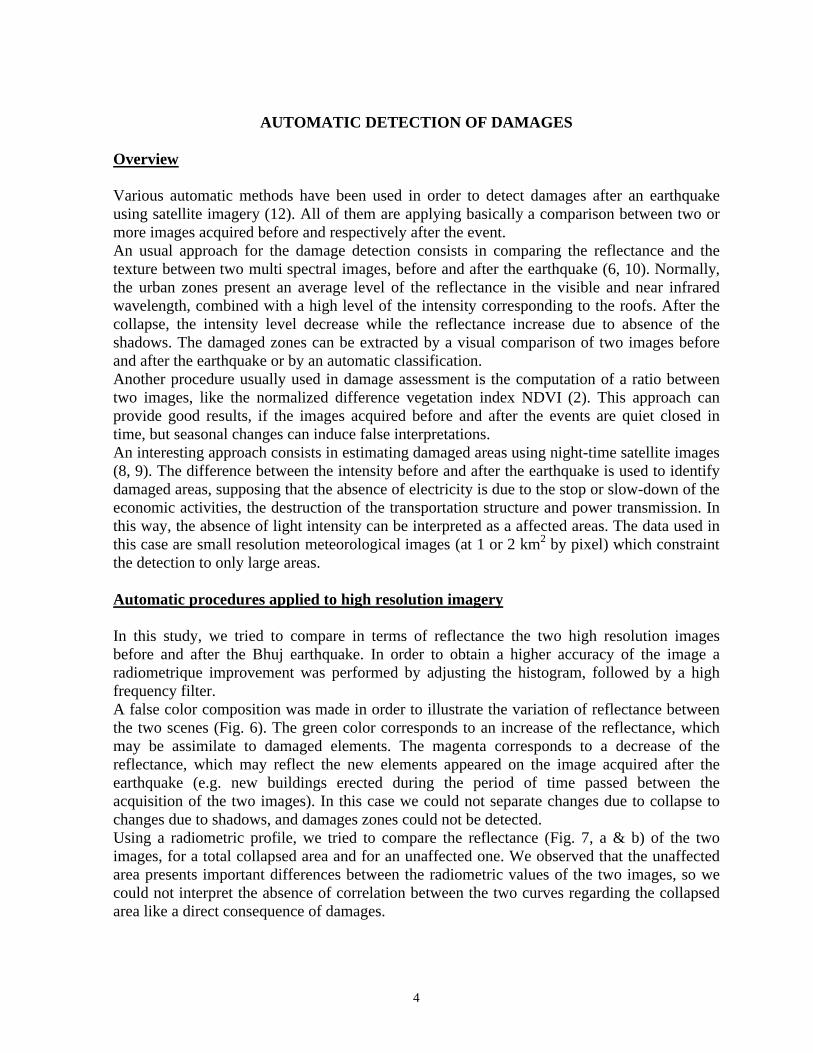
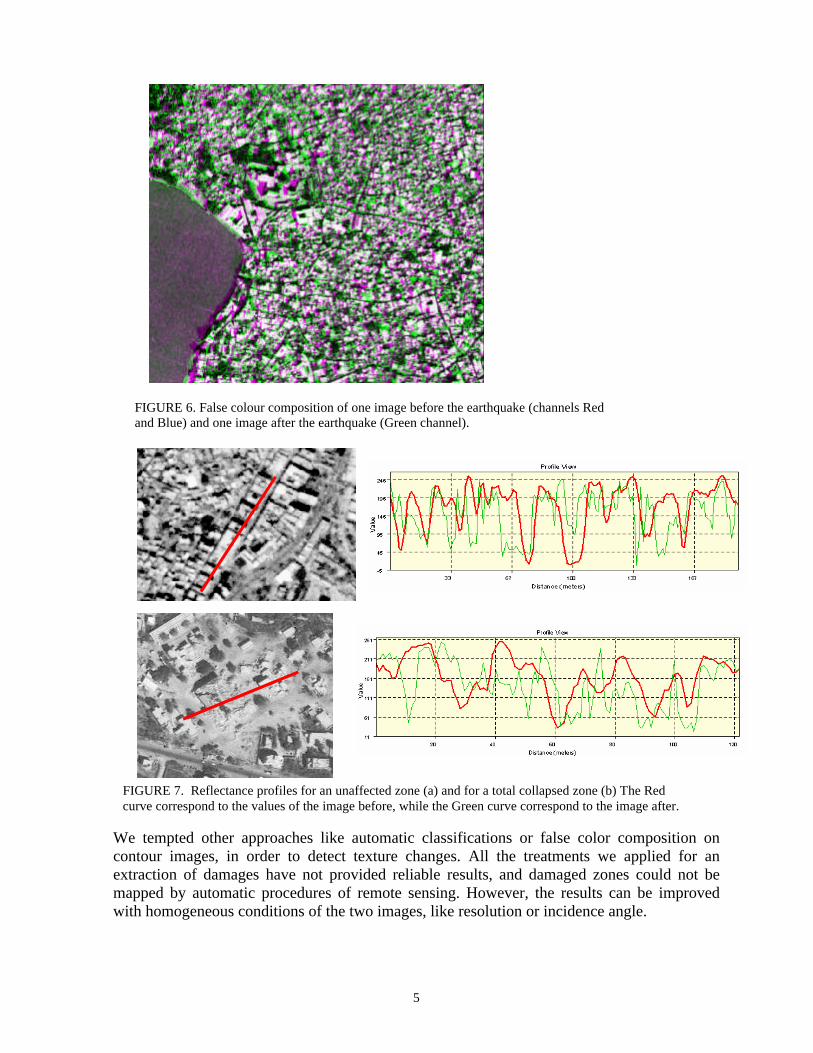
AUTOMATIC DETECTION OF DAMAGES Overview Various automatic methods have been used in order to detect damages after an earthquake using satellite imagery (12). All of them are applying basically a comparison between two or more images acquired before and respectively after the event. An usual approach for the damage detection consists in comparing the reflectance and the texture between two multi spectral images, before and after the earthquake (6, 10). Normally, the urban zones present an average level of the reflectance in the visible and near infrared wavelength, combined with a high level of the intensity corresponding to the roofs. After the collapse, the intensity level decrease while the reflectance increase due to absence of the shadows. The damaged zones can be extracted by a visual comparison of two images before and after the earthquake or by an automatic classification. Another procedure usually used in damage assessment is the computation of a ratio between two images, like the normalized difference vegetation index NDVI (2). This approach can provide good results, if the images acquired before and after the events are quiet closed in time, but seasonal changes can induce false interpretations. An interesting approach consists in estimating damaged areas using night-time satellite images (8, 9). The difference between the intensity before and after the earthquake is used to identify damaged areas, supposing that the absence of electricity is due to the stop or slow-down of the economic activities, the destruction of the transportation structure and power transmission. In this way, the absence of light intensity can be interpreted as a affected areas. The data used in this case are small resolution meteorological images (at 1 or 2 km2 by pixel) which constraint the detection to only large areas. Automatic procedures applied to high resolution imagery In this study, we tried to compare in terms of reflectance the two high resolution images before and after the Bhuj earthquake. In order to obtain a higher accuracy of the image a radiometrique improvement was performed by adjusting the histogram, followed by a high frequency filter. A false color composition was made in order to illustrate the variation of reflectance between the two scenes (Fig. 6). The green color corresponds to an increase of the reflectance, which may be assimilate to damaged elements. The magenta corresponds to a decrease of the reflectance, which may reflect the new elements appeared on the image acquired after the earthquake (e.g. new buildings erected during the period of time passed between the acquisition of the two images). In this case we could not separate changes due to collapse to changes due to shadows, and damages zones could not be detected. Using a radiometric profile, we tried to compare the reflectance (Fig. 7, a & b) of the two images, for a total collapsed area and for an unaffected one. We observed that the unaffected area presents important differences between the radiometric values of the two images, so we could not interpret the absence of correlation between the two curves regarding the collapsed area like a direct consequence of damages.
5
FIGURE 6. False colour composition of one image before the earthquake (channels Red and Blue) and one image after the earthquake (Green channel).
FIGURE 7. Reflectance profiles for an unaffected zone (a) and for a total collapsed zone (b) The Red curve correspond to the values of the image before, while the Green curve correspond to the image after.
We tempted other approaches like automatic classifications or false color composition on contour images, in order to detect texture changes. All the treatments we applied for an extraction of damages have not provided reliable results, and damaged zones could not be mapped by automatic procedures of remote sensing. However, the results can be improved with homogeneous conditions of the two images, like resolution or incidence angle.
6
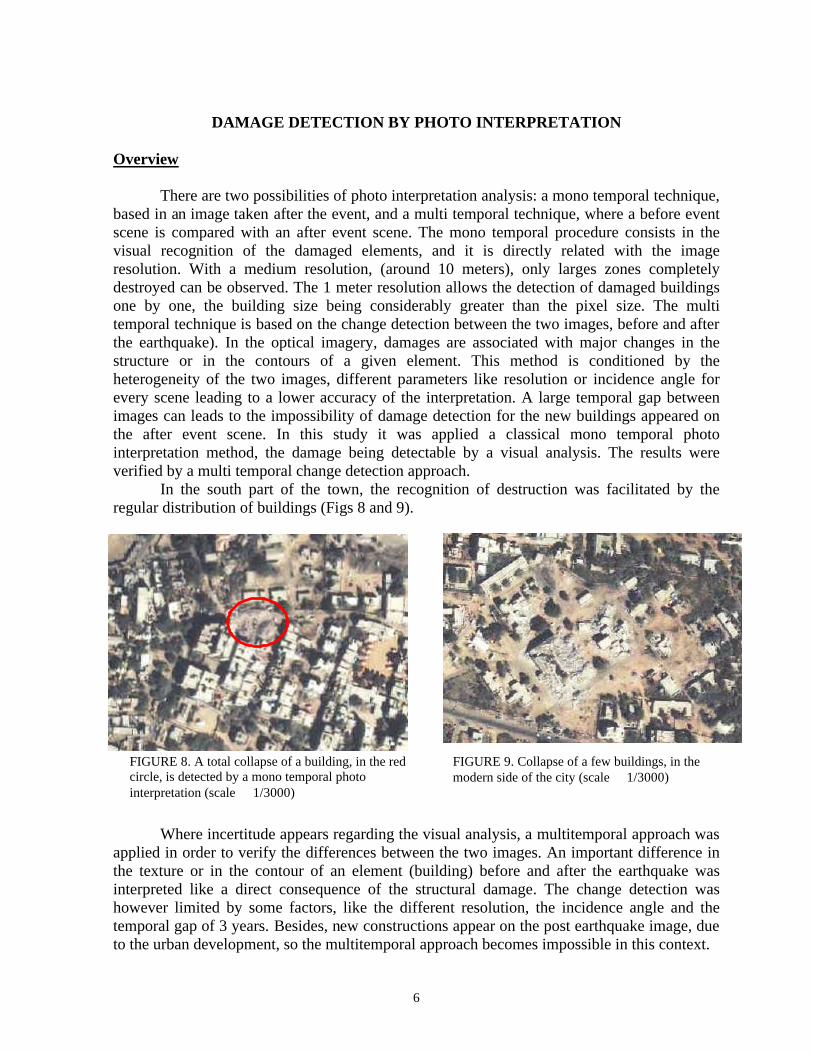
FIGURE 8. A total collapse of a building, in the red circle, is detected by a mono temporal photo interpretation (scale � 1/3000)
FIGURE 9. Collapse of a few buildings, in the modern side of the city (scale � 1/3000)
DAMAGE DETECTION BY PHOTO INTERPRETATION Overview There are two possibilities of photo interpretation analysis: a mono temporal technique, based in an image taken after the event, and a multi temporal technique, where a before event scene is compared with an after event scene. The mono temporal procedure consists in the visual recognition of the damaged elements, and it is directly related with the image resolution. With a medium resolution, (around 10 meters), only larges zones completely destroyed can be observed. The 1 meter resolution allows the detection of damaged buildings one by one, the building size being considerably greater than the pixel size. The multi temporal technique is based on the change detection between the two images, before and after the earthquake). In the optical imagery, damages are associated with major changes in the structure or in the contours of a given element. This method is conditioned by the heterogeneity of the two images, different parameters like resolution or incidence angle for every scene leading to a lower accuracy of the interpretation. A large temporal gap between images can leads to the impossibility of damage detection for the new buildings appeared on the after event scene. In this study it was applied a classical mono temporal photo interpretation method, the damage being detectable by a visual analysis. The results were verified by a multi temporal change detection approach. In the south part of the town, the recognition of destruction was facilitated by the regular distribution of buildings (Figs 8 and 9).
Where incertitude appears regarding the visual analysis, a multitemporal approach was applied in order to verify the differences between the two images. An important difference in the texture or in the contour of an element (building) before and after the earthquake was interpreted like a direct consequence of the structural damage. The change detection was however limited by some factors, like the different resolution, the incidence angle and the temporal gap of 3 years. Besides, new constructions appear on the post earthquake image, due to the urban development, so the multitemporal approach becomes impossible in this context.
7
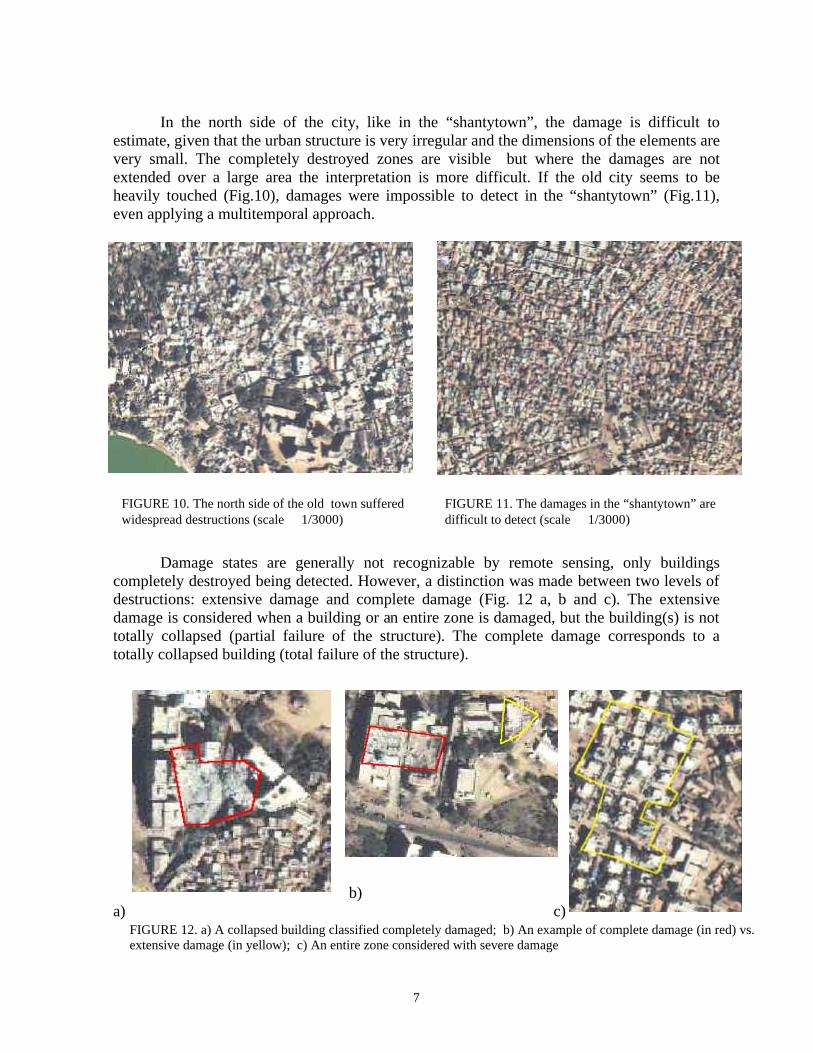
FIGURE 12. a) A collapsed building classified completely damaged; b) An example of complete damage (in red) vs. extensive damage (in yellow); c) An entire zone considered with severe damage
FIGURE 10. The north side of the old town suffered widespread destructions (scale � 1/3000)
FIGURE 11. The damages in the “shantytown” are difficult to detect (scale � 1/3000)
In the north side of the city, like in the “shantytown”, the damage is difficult to estimate, given that the urban structure is very irregular and the dimensions of the elements are very small. The completely destroyed zones are visible but where the damages are not extended over a large area the interpretation is more difficult. If the old city seems to be heavily touched (Fig.10), damages were impossible to detect in the “shantytown” (Fig.11), even applying a multitemporal approach. Damage states are generally not recognizable by remote sensing, only buildings completely destroyed being detected. However, a distinction was made between two levels of destructions: extensive damage and complete damage (Fig. 12 a, b and c). The extensive damage is considered when a building or an entire zone is damaged, but the building(s) is not totally collapsed (partial failure of the structure). The complete damage corresponds to a totally collapsed building (total failure of the structure). b) a) c)
8
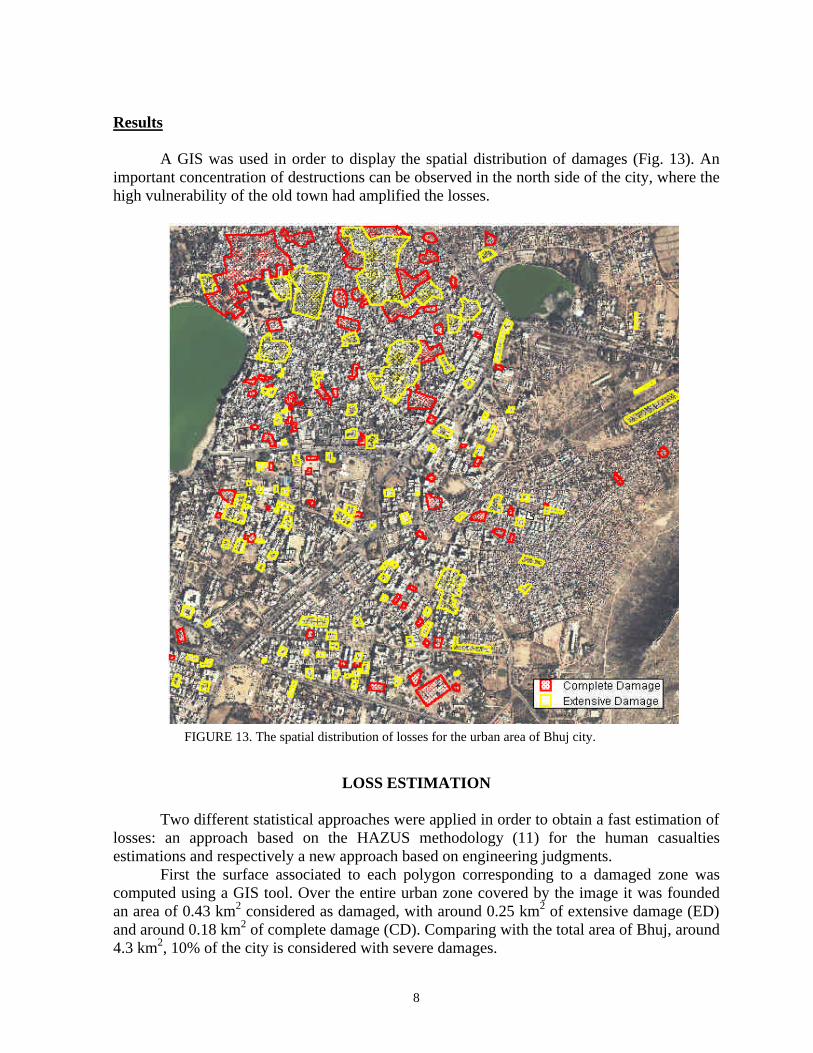
FIGURE 13. The spatial distribution of losses for the urban area of Bhuj city.
Results A GIS was used in order to display the spatial distribution of damages (Fig. 13). An important concentration of destructions can be observed in the north side of the city, where the high vulnerability of the old town had amplified the losses.
LOSS ESTIMATION
Two different statistical approaches were applied in order to obtain a fast estimation of losses: an approach based on the HAZUS methodology (11) for the human casualties estimations and respectively a new approach based on engineering judgments. First the surface associated to each polygon corresponding to a damaged zone was computed using a GIS tool. Over the entire urban zone covered by the image it was founded an area of 0.43 km2 considered as damaged, with around 0.25 km2 of extensive damage (ED) and around 0.18 km2 of complete damage (CD). Comparing with the total area of Bhuj, around 4.3 km2, 10% of the city is considered with severe damages.
9
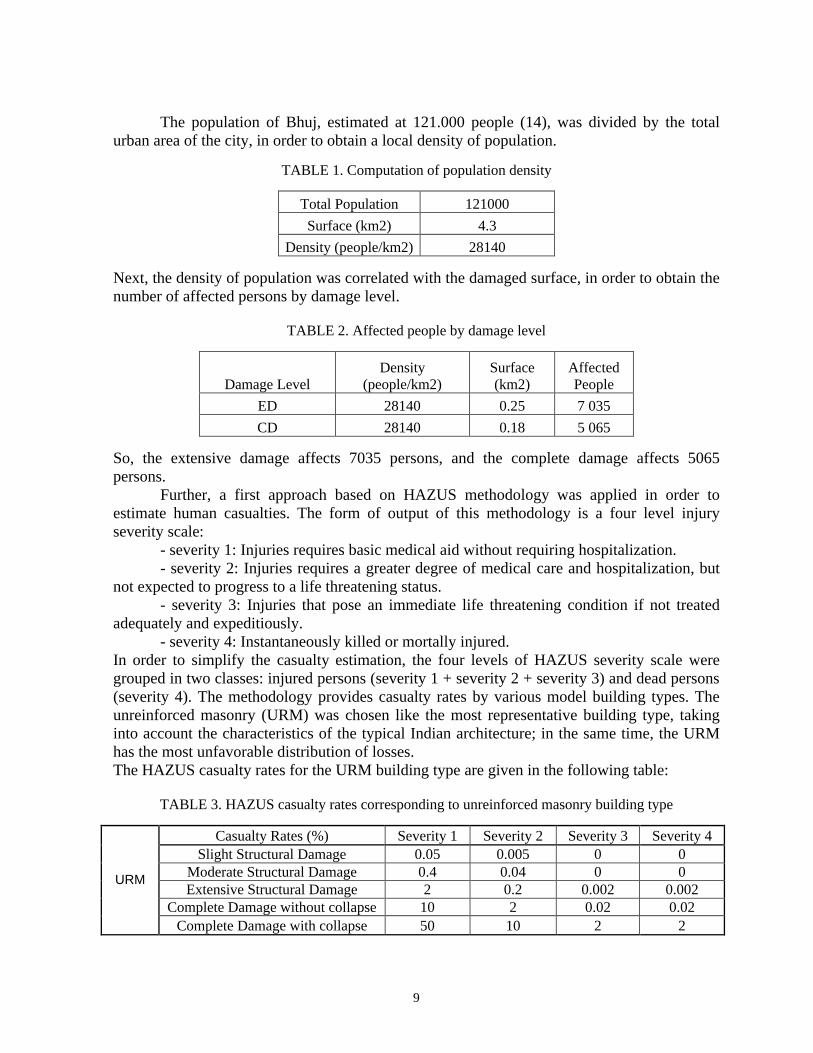
The population of Bhuj, estimated at 121.000 people (14), was divided by the total urban area of the city, in order to obtain a local density of population.
TABLE 1. Computation of population density
Total Population 121000
Surface (km2) 4.3
Density (people/km2) 28140
Next, the density of population was correlated with the damaged surface, in order to obtain the number of affected persons by damage level.
TABLE 2. Affected people by damage level
Damage Level Density
(people/km2) Surface (km2)
Affected People
ED 28140 0.25 7 035
CD 28140 0.18 5 065
So, the extensive damage affects 7035 persons, and the complete damage affects 5065 persons. Further, a first approach based on HAZUS methodology was applied in order to estimate human casualties. The form of output of this methodology is a four level injury severity scale: - severity 1: Injuries requires basic medical aid without requiring hospitalization. - severity 2: Injuries requires a greater degree of medical care and hospitalization, but not expected to progress to a life threatening status. - severity 3: Injuries that pose an immediate life threatening condition if not treated adequately and expeditiously. - severity 4: Instantaneously killed or mortally injured. In order to simplify the casualty estimation, the four levels of HAZUS severity scale were grouped in two classes: injured persons (severity 1 + severity 2 + severity 3) and dead persons (severity 4). The methodology provides casualty rates by various model building types. The unreinforced masonry (URM) was chosen like the most representative building type, taking into account the characteristics of the typical Indian architecture; in the same time, the URM has the most unfavorable distribution of losses. The HAZUS casualty rates for the URM building type are given in the following table:
TABLE 3. HAZUS casualty rates corresponding to unreinforced masonry building type
Casualty Rates (%) Severity 1 Severity 2 Severity 3 Severity 4 Slight Structural Damage 0.05 0.005 0 0
Moderate Structural Damage 0.4 0.04 0 0 Extensive Structural Damage 2 0.2 0.002 0.002
Complete Damage without collapse 10 2 0.02 0.02
URM
Complete Damage with collapse 50 10 2 2
10
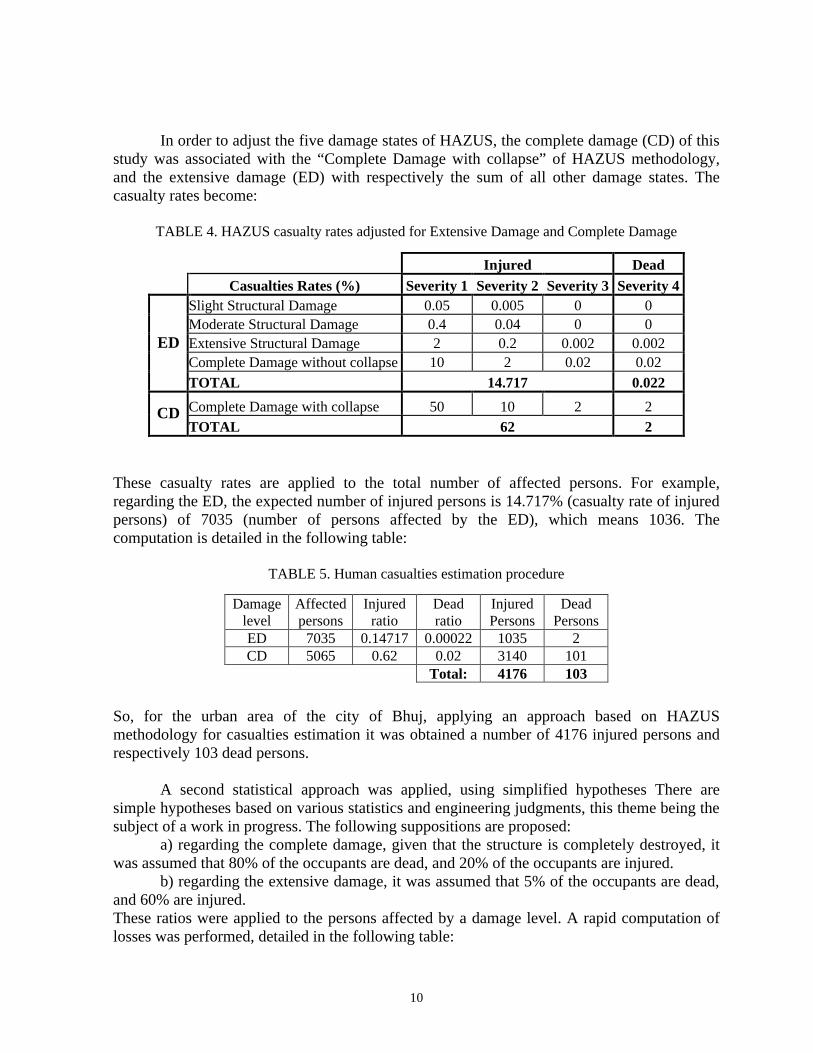
In order to adjust the five damage states of HAZUS, the complete damage (CD) of this study was associated with the “Complete Damage with collapse” of HAZUS methodology, and the extensive damage (ED) with respectively the sum of all other damage states. The casualty rates become:
TABLE 4. HAZUS casualty rates adjusted for Extensive Damage and Complete Damage
Injured Dead
Casualties Rates (%) Severity 1 Severity 2 Severity 3 Severity 4 Slight Structural Damage 0.05 0.005 0 0 Moderate Structural Damage 0.4 0.04 0 0 Extensive Structural Damage 2 0.2 0.002 0.002 Complete Damage without collapse 10 2 0.02 0.02
ED
TOTAL 14.717 0.022
Complete Damage with collapse 50 10 2 2 CD TOTAL 62 2
These casualty rates are applied to the total number of affected persons. For example, regarding the ED, the expected number of injured persons is 14.717% (casualty rate of injured persons) of 7035 (number of persons affected by the ED), which means 1036. The computation is detailed in the following table:
TABLE 5. Human casualties estimation procedure
Damage level
Affected persons
Injured ratio
Dead ratio
Injured Persons
Dead Persons
ED 7035 0.14717 0.00022 1035 2 CD 5065 0.62 0.02 3140 101
Total: 4176 103
So, for the urban area of the city of Bhuj, applying an approach based on HAZUS methodology for casualties estimation it was obtained a number of 4176 injured persons and respectively 103 dead persons. A second statistical approach was applied, using simplified hypotheses There are simple hypotheses based on various statistics and engineering judgments, this theme being the subject of a work in progress. The following suppositions are proposed: a) regarding the complete damage, given that the structure is completely destroyed, it was assumed that 80% of the occupants are dead, and 20% of the occupants are injured. b) regarding the extensive damage, it was assumed that 5% of the occupants are dead, and 60% are injured. These ratios were applied to the persons affected by a damage level. A rapid computation of losses was performed, detailed in the following table:
11
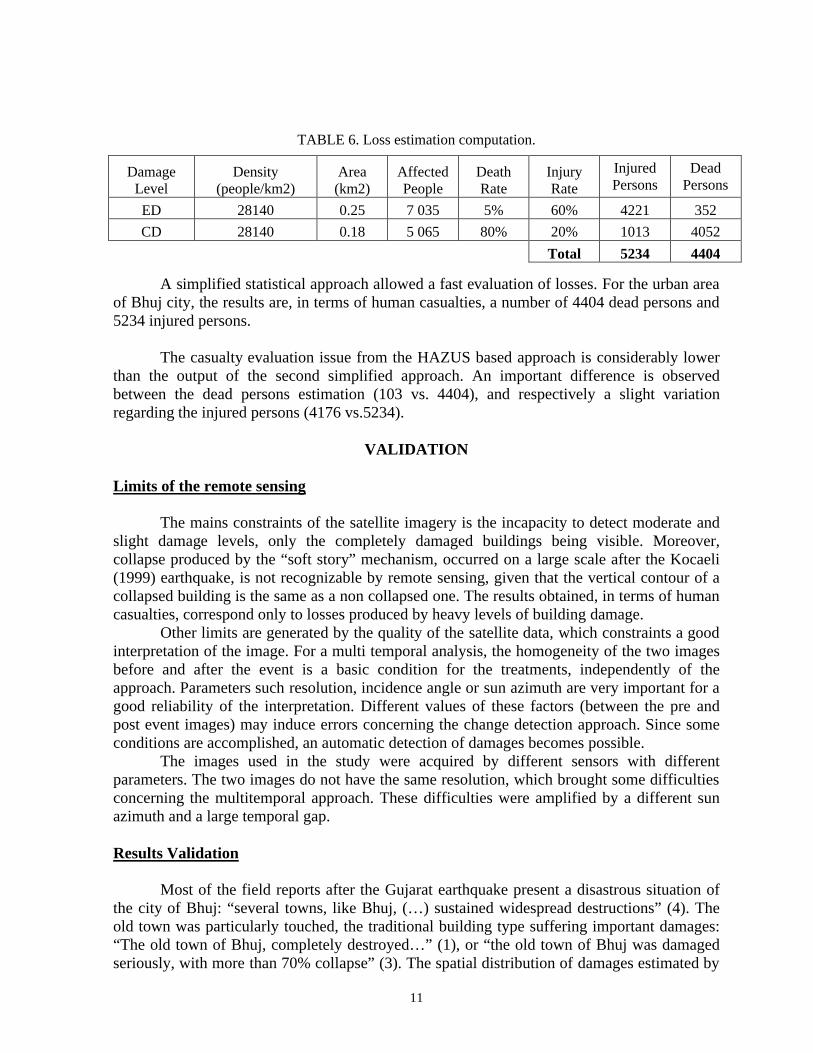
TABLE 6. Loss estimation computation.
A simplified statistical approach allowed a fast evaluation of losses. For the urban area of Bhuj city, the results are, in terms of human casualties, a number of 4404 dead persons and 5234 injured persons. The casualty evaluation issue from the HAZUS based approach is considerably lower than the output of the second simplified approach. An important difference is observed between the dead persons estimation (103 vs. 4404), and respectively a slight variation regarding the injured persons (4176 vs.5234).
VALIDATION
Limits of the remote sensing The mains constraints of the satellite imagery is the incapacity to detect moderate and slight damage levels, only the completely damaged buildings being visible. Moreover, collapse produced by the “soft story” mechanism, occurred on a large scale after the Kocaeli (1999) earthquake, is not recognizable by remote sensing, given that the vertical contour of a collapsed building is the same as a non collapsed one. The results obtained, in terms of human casualties, correspond only to losses produced by heavy levels of building damage. Other limits are generated by the quality of the satellite data, which constraints a good interpretation of the image. For a multi temporal analysis, the homogeneity of the two images before and after the event is a basic condition for the treatments, independently of the approach. Parameters such resolution, incidence angle or sun azimuth are very important for a good reliability of the interpretation. Different values of these factors (between the pre and post event images) may induce errors concerning the change detection approach. Since some conditions are accomplished, an automatic detection of damages becomes possible. The images used in the study were acquired by different sensors with different parameters. The two images do not have the same resolution, which brought some difficulties concerning the multitemporal approach. These difficulties were amplified by a different sun azimuth and a large temporal gap. Results Validation Most of the field reports after the Gujarat earthquake present a disastrous situation of the city of Bhuj: “several towns, like Bhuj, (…) sustained widespread destructions” (4). The old town was particularly touched, the traditional building type suffering important damages: “The old town of Bhuj, completely destroyed…” (1), or “the old town of Bhuj was damaged seriously, with more than 70% collapse” (3). The spatial distribution of damages estimated by
Damage Level
Density (people/km2)
Area (km2)
Affected People
Death Rate
Injury Rate
Injured Persons
Dead Persons
ED 28140 0.25 7 035 5% 60% 4221 352
CD 28140 0.18 5 065 80% 20% 1013 4052
Total 5234 4404
12
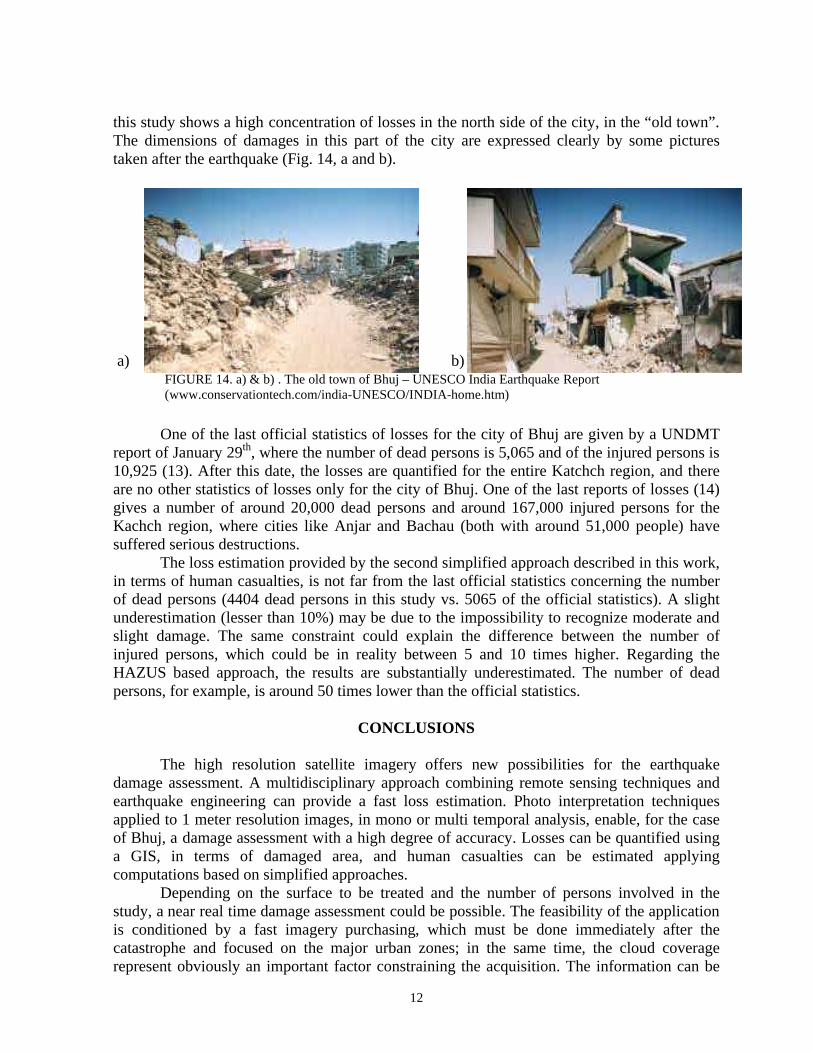
FIGURE 14. a) & b) . The old town of Bhuj – UNESCO India Earthquake Report (www.conservationtech.com/india-UNESCO/INDIA-home.htm)
this study shows a high concentration of losses in the north side of the city, in the “old town”. The dimensions of damages in this part of the city are expressed clearly by some pictures taken after the earthquake (Fig. 14, a and b). a) b) One of the last official statistics of losses for the city of Bhuj are given by a UNDMT report of January 29th, where the number of dead persons is 5,065 and of the injured persons is 10,925 (13). After this date, the losses are quantified for the entire Katchch region, and there are no other statistics of losses only for the city of Bhuj. One of the last reports of losses (14) gives a number of around 20,000 dead persons and around 167,000 injured persons for the Kachch region, where cities like Anjar and Bachau (both with around 51,000 people) have suffered serious destructions. The loss estimation provided by the second simplified approach described in this work, in terms of human casualties, is not far from the last official statistics concerning the number of dead persons (4404 dead persons in this study vs. 5065 of the official statistics). A slight underestimation (lesser than 10%) may be due to the impossibility to recognize moderate and slight damage. The same constraint could explain the difference between the number of injured persons, which could be in reality between 5 and 10 times higher. Regarding the HAZUS based approach, the results are substantially underestimated. The number of dead persons, for example, is around 50 times lower than the official statistics.
CONCLUSIONS The high resolution satellite imagery offers new possibilities for the earthquake damage assessment. A multidisciplinary approach combining remote sensing techniques and earthquake engineering can provide a fast loss estimation. Photo interpretation techniques applied to 1 meter resolution images, in mono or multi temporal analysis, enable, for the case of Bhuj, a damage assessment with a high degree of accuracy. Losses can be quantified using a GIS, in terms of damaged area, and human casualties can be estimated applying computations based on simplified approaches. Depending on the surface to be treated and the number of persons involved in the study, a near real time damage assessment could be possible. The feasibility of the application is conditioned by a fast imagery purchasing, which must be done immediately after the catastrophe and focused on the major urban zones; in the same time, the cloud coverage represent obviously an important factor constraining the acquisition. The information can be
13
integrated into a GIS base and transferred via satellite networks or internet to the rescue teams deployed on the affected zone. The results of a fast damage assessment received by the field operators could help the civil protection, in order to better coordinate the emergency operations.
REFERENCES 1 Association Française de Génie Parasismique AFPS (2001). Le séisme de Bhuj (Gujarat, Inde) du 26
janvier 2001. Rapport de Mission, Paris, France. 2 EDM (2000, a). Report on the Kocaeli, Turkey earthquake of August 17, 1999. EDM Technical
Report N°. 6; Earthquake Disaster Mitigation Center; The Institute of Physical and Chimical Research (RIKEN). Miki, Hyako Prefecture, Japan; www.edm.bosai.go.jp
3 EDM (2000, b). The Bhuj Earthquake of January 26, 2001. Consequences and Futurs Challenges. Earthquake Disaster Mitigation Center; The Institute of Physical and Chimical Research (RIKEN). Miki, Hyako Prefecture, Japan; www.edm.bosai.go.jp
4 EERI (2001). Preliminary Observations on the Origin and Effects of the January 26, 2001 Bhuj (Gujarat, India) Earthquake. EERI Newslettres, Vol. 35, N°. 4; Oakland
5 R. Eguchi et al (2000). Using Advanced Technologies to Conduct Earthquake Reconnaissance after the 1999 Marmara Earthquake; 2nd Workshop on Advanced Technologies in Urban Earthquake Disaster Mitigation, DPRI, Kyoto University, Uji, Kyoto, Japan.
6 M. Estrada et al (2001). Digital Damage Detection due to the 1999 Kocaeli, Turkey Earthquake; Bulletin of Earthquake Resistant Structure Research Center, Japan.
7 GSC (2000). Fast Damage Assessment after Major Disasters by Multitemporal Radar and Optical Analysis. Paris, France.
8 H. Hayashi et al (2001, a) Estimated Damage Area Due to the Earthquake in El Salvador on January 13, 2001, Based on the Nighttime Satellite Images; www.edm.bosai.go.jp
9 H. Hayashi et al ( 2001, b). Estimated Damage Area Due to the Earthquake in Gujarat, India on January 26, 2001, Based on the Nighttime Satellite Images; www.edm.bosai.go.jp
10 M. Matsuoka, F. Yamazaki (2000). Remote Sensing Technologies for Earthquake Damage Detection: examples for Kobe, Japan and Luzon, the Philippines. Workshop on Mitigation of Earthquake Disaster by Advanced Technologies, Los Angeles, CA.
11 NIBS (1999). HAZUS - Earthquake Loss Estimation Methodology. Technical Manual, Vol. III, Washington, D.C.
12 M. Tralli (2001). Assessment of Advanced Technologies for Loss Estimation. Multidisciplinary Center for Earthquake Engineering Research; State University of New York at Buffalo Research Foundation, NY.
13 United Nations Disaster Management Team (2001). India Earthquake Reports N° 1 - 21. www.reliefweb.org
14 World Bank and Asian Development Bank (2001). Gujarat Earthquake Recovery Program; Assessment Report; www.worldbank.org