damage detection on composite beam: fea&experiment · 2019-07-01 · damage detection on...
TRANSCRIPT

Damage Detection On Composite Beam:
FEA&Experiment
Abstract -It is required that structures must safely work
during its service life. But, damages initiate a breakdown
period on the structures. Cracks are among the most
encountered damage types in the structures. Structures are
weakened by cracks. When the crack size increases in course
of time, the structure becomes weaker than its previous
condition. Finally, the structure may breakdown due to a
minute crack. Therefore, crack detection plays an important
role for structural health monitoring applications.
Delamination is the separation of layers which are bonded
together in composite laminate. In the case of bending loads
delamination usually leads to significant loss of bending
stiffness and strength. Therefore it is important to detect the
presents of delamination at an early stage. The delamination
causes reduction of stiffness and thereby the modal
frequencies also change.
In order to find the damage location and size present in the
composite materials, we have to determine changes in modal
frequencies of the damaged structure as a function of the
damage parameters such as delamination and crack location,
size, interface at which it is present. In this work modal
analysis is used to determine the crack and delamination in
the composite structure. This is done by creating a four layer
multi directional laminate of E-Glass /Epoxy in the lamination
code of 90/0/0/90 in ANSYS. A parametric study is conducted
by varying location, width and length of the crack and
delamination.The change in
frequency of undamaged and damaged shows that the natural
frequency is affected by delamination and crack.
The results are validated with experimental modal
analysis.From the results, a reverse design process is
implemented for finding the damage location at a particular
natural frequency.
I. INTRODUCTION
A composite is a structural material that consists of two or
more combined constituents that are combined at a
macroscopic level and are not soluble in each other One
constituent is called the reinforcing phase and the one in
which it is embedded is called the matrix. The reinforcing
phase material may be in the form of fibers, particles, or
flakes. The matrix phase materials are generally
continuous. Examples of composite systems include
concrete reinforced with steel and epoxy reinforced with
graphite fibers, carbon fiber, glass fibers etc. Composites as
structural material are being used in aerospace, military and
civilian applications because of their tailor made
properties. Preventing failure of composite material
systems has been an important issue in engineering design
generally, aircraft structures made of fiber reinforces
composite materials are designed such that the fibers carry
the bulk of the applied load. Interlaminar failure such as
delamination refers to debonding of adjacent lamina. The
possibility that interlaminarfailure occur in structural
components is considered as design limit, and establishes
restrictions on the usage of full potential of composites.
Similar to isotropic materials, composite materials are
subjected to various types of damage, mostly cracks and
delamination. The delamination in a composite structure
Alan Andrew BTech Student
Mechanical Engineering Department
Bishop Jerome Institute, Kollam, India
Antony Brilliant BTech Student
Mechanical Engineering Department
Bishop Jerome Institute, Kollam, India
Harikrishnan P S BTech Student
Mechanical Engineering Department
Bishop Jerome Institute, Kollam, India
Jobin Johny
BTech Student
Mechanical Engineering Department
Bishop Jerome Institute, Kollam, India
Tony Fred BTech Student
Mechanical Engineering Department Bishop Jerome Institute, Kollam, India
Sabarinath S Research Scholar
NIT, Calicut
Akash Rajan Reserch Scholar
Advanced Dynamics & Control Lab
Mechanical Engineering Department College of Engineering Trivandrum
M. Unnikrishnan Assistant Professor
Advanced Dynamics &Control Lab
Mechanical Engineering Department
College of Engineering Trivandrum
International Journal of Engineering Research & Technology (IJERT)
ISSN: 2278-0181
www.ijert.orgIJERTV4IS060078
(This work is licensed under a Creative Commons Attribution 4.0 International License.)
Vol. 4 Issue 06, June-2015
28

may reduce the structural stiffness and strength,
redistribute the load in a way that the structural failure is
delayed, or may lead to structural collapse. The presence of
a crack could not only cause a local variation in the
stiffness but it could affect the mechanical behaviour of the
entire structure to a considerable extent. Cracks may be
caused by fatigue under service conditions as a result of the
limited fatigue strength. Small cracks are known to
propagate due to fluctuating stress conditions. If these
propagating cracks remain undetected and reach their
critical size, then a sudden structural failure may occur.
Hence it is possible to use natural frequency measurements
to detect cracks. Specifically, crack damage can cause a
stiffness reduction, with an inherent reduction in natural
frequencies, an increase in modal damping, and a change in
the mode shapes. From these changes the crack position
and magnitude can be identified.
II. THEORY OF FREE VIBRATION OF
CANTILEVER BEAMS
For a cantilever beam subjected to free vibration, and the
system is considered as continuous system in which the
beam mass is considered as distributed along with the
stiffness of the shaft, the equation of motion can be written
as:-
2 22
2 2
( ){ ( ) } ( ) ( )n
d d Y xEI x m x Y x
dx dx
(1
)
Where, E is themodulus of rigidity of beam material,
I is the moment of inertia of the beam cross-section,
Y(x) is displacement in y direction at distance x from
Fixed end,n is the circular natural frequency, m is the
mass per unit length,
m = A(x) is the material density xis the distance
measured from the fixed end.
Figure 1 : Cantilever beam
Figure 2 : Free vibration of a cantilever beam
Fig.2 shows of a cantilever beam with rectangular cross
section, which can be subjected to bending vibration by
giving a small initial displacement at the free end; and
Optimum material utilization for stiffness is achieved by
forcing the bending load carrying components to the
surface of the structure with an extremely light weight core
material.
1) ClassicalLamination Theory(CLT)
Classical lamination theory (CLT) as presented herein is
applicable to orthotropic continuous fiber laminated
composites only. The approach used in formulating CLT is
similar to that used in developing load-stress relationships
in elementary strength of materials courses. An initial
displacement field consistent with applied loads is
assumed. Through the strain-displacement fields and an
appropriate constitutive relationship, a state of stress is
defined. By satisfying the conditions of static equilibrium,
a load-strain relation is defined, and subsequently a state of
stress is defined for each lamina.
Basic Assumptions for Classical Lamination Theory (CLT)
1. Each layer of the laminate is quasi-homogeneous and
orthotropic.
2. The laminate is thin compared to the lateral dimensions
and is loaded in its plane.
3. State of stress is plane stress.
4. All displacements are small compared to the laminate
thickness.
5. Displacements are continuous throughout the laminate.
6. Straight lines normal to the middle surface remain
straight and normal to that surface after deformation. In-
plane displacements vary linearly through the thickness.
7. Transverse shear strains are negligible.
8. Transverse normal strain is negligible compared to the
in-plane strains x and y.
9. Strain-displacement and stress-strain relations are linear.
2) Classical Lamination Theory from ClassicalPlate
Theory:
The classical lamination theory is almost identical to the
classical plate theory; the only difference is in the material
properties (stress-strain relations). The classical plate
theory usually assumes that the material is isotropic, while
International Journal of Engineering Research & Technology (IJERT)
ISSN: 2278-0181
www.ijert.orgIJERTV4IS060078
(This work is licensed under a Creative Commons Attribution 4.0 International License.)
Vol. 4 Issue 06, June-2015
29

a fiber reinforced composite laminate with multiple layers
(plies) may have more complicated stress-strain relations.
The four cornerstones of the lamination theory are the
kinematic, constitutive, force resultant, and equilibrium
equations. The outcome of each of these segments is
summarized as follows: Theoretical evaluations of the
effective properties of the facings was done using
composite laminate theory (CLT). CLT consists of a
collection of mechanics of materials type of stress and
deformations hypotheses. By use of this theory, one can
consistently proceed directly from the basic building block,
the lamina, to the end result, a structural laminate. The
assumptions in composite laminate theory are as follows:
Each lamina is orthotropic
Each lamina is homogeneous
The laminate is thin and is loaded only in its plane
Each lamina is elastic
No slip occurs between the lamina interfaces
Displacements are continuous and small
throughout the laminate
3) CRACK THEORY:
Physical Parameters Affecting DynamicCharacteristics of
Cracked Structures:
Usually the physical dimensions, boundary conditions, the
material properties of the structure play important role for
the determination of its dynamic response. Their
vibration cause changes in dynamic characteristics of
structures. The following aspects of the crack greatly
influence the dynamic response of the structure.
(i)The position of crack
(ii)The depth of crack
(iii)The orientation of crack
(iv)The number of cracks
4) Classification of Cracks:
Based on their geometries, cracks can be broadly classified
as follows:
1) Cracks perpendicular to the beam axis are known as
“transverse cracks”. These are the most common and most
serious as they reduce the cross-section and thereby
weaken the beam. They introduce a local flexibility in the
stiffness of the beam due to strain energy concentration in
the vicinity of the crack tip.
2) Cracks parallel to the beam axis are known as
“longitudinal cracks”. They are not that common but they
posed anger when the tensile load is applied is at right
angles to the crack direction i.e. perpendicular to beam
axis or the perpendicular to crack.
3) “Slant cracks” (cracks at an angle to the beam axis) are
also encountered, but are not very common. These
influence the torsion behavior of the beam. Their effect on
lateralvibrations is less than that of transverse cracks of
comparableseverity.
4) Cracks that open when the affected part of the material
is subjected to tensile stresses and close when the stress is
reversed are known as “breathing cracks”. The stiffness of
the component is most influenced when under tension. The
breathing of the crack results in non-linearity’s in the
vibration behavior of the beam. Cracks breathe when
cracks is small, running speeds are low and radial forces
are large.
5) Cracks that always remain open are known as “gaping
cracks”. They are more correctly called “notches”.
6) Cracks that open on the surface are called “surface
cracks”. They can normally be detected by techniques
such as dye-penetrates or visual inspection.
7) Cracks that do not show on the surface are called
“subsurface cracks”. Special techniques such as ultrasonic,
magnetic particle, radiography or shaft voltage drop are
needed to detect them. Surface cracks have a greater effect
than subsurface cracks on the vibration behavior of shafts.
5) Stress Intensity Factor (K)
It is defined as a measure of the stress field intensity near
the tip of an ideal crack in a linear elastic solid when the
crack surfaces are displaced in the opening mode (Mode I).
(SIFs) are used to define the magnitude of the singular
stress and displacement fields (local stresses and
displacements near the crack tip).The SIF depends on the
loading, the crack size, the crack shape, and the geometric
boundaries of the specimen. The recommended units for K
are MPa√m. it is customary to write the general formula in
the form K=Yσ πa where σ is the applied stress, a is crack
depth, Y is dimensionless shape factor.
III. OBJECTIVE
To conduct a modal analysis of a composite laminate
o Intact model
o Control model
To predict the position and area of delamination and
crack present in the composite laminate.
To validate the numerical analysis, conduct an
experimental modal analysis of composite laminate for
a selected model.
Methodology and scope of the present work:
To study the variation in natural frequency by varying
delamination length, width and location of the crack for
different ply orientation in a four layered composite beam
using Ansys 15.
The modes of frequencies are extracted by experimental
modal analysis.
The aim is to work out a composite beam finite element
with a single delamination of different area and crack at
different positions from the fixed end. It has been assumed
that the delamination and crack changes only the stiffness
of the element whereas the mass of the element is
unchanged. For theoretical modeling of delaminated and
cracked composite beam dimensions, delamination and
International Journal of Engineering Research & Technology (IJERT)
ISSN: 2278-0181
www.ijert.orgIJERTV4IS060078
(This work is licensed under a Creative Commons Attribution 4.0 International License.)
Vol. 4 Issue 06, June-2015
30
crack locations, delamination length and width, material
properties is specified. By using the present model the
following effects due to the delamination and crack of the
cantilever composite beam have been analyzed.
(1) The influence of delamination and crack position and
area of delamination on the natural frequencies.
(2) The one of the presented results were compared with
experimental modal analysis
IV. FINITE ELEMENT ANALYSIS
Numerical modal analysis based on the finite element (FE)
modeling is performed for studying the dynamic response
of a structure. The natural frequencies and mode shapes are
important modal parameters in designing a structure under
dynamic loading conditions. The numerical analysis is
carried out by using the commercial finite element program
ANSYS. It is mainly used to verify the effectiveness of
delamination detection method used in this study. In the
present study, since the specimen is made of
fiberglass/epoxy composite material, the FE modelling of
the composite beam is simulated with the layered element.
The composite plate consists of four orthotropic layers, and
it is considered as orthotropic material. The FE analysis
software ANSYS was used in the modal analysis to obtain
mode shapes.
A Cantilever beam of the dimensions Length 250mm
Width of 50 mm of composite material was considered for
the numerical analysis. The beam was modelled with
twenty nodded shell elements so as to introduce the
delamination and crack.
Modal analysis on ANSYS:
Modal Analysis is a tool used to determine vibration
characteristics or natural frequencies of a mechanical
structure. It can also be used for dynamic analysis,
harmonic response, and transient dynamic analysis. Modal
analysis in ANSYS® is linear analysis. In this research
natural frequencies and mode shapes are concentrated
upon.
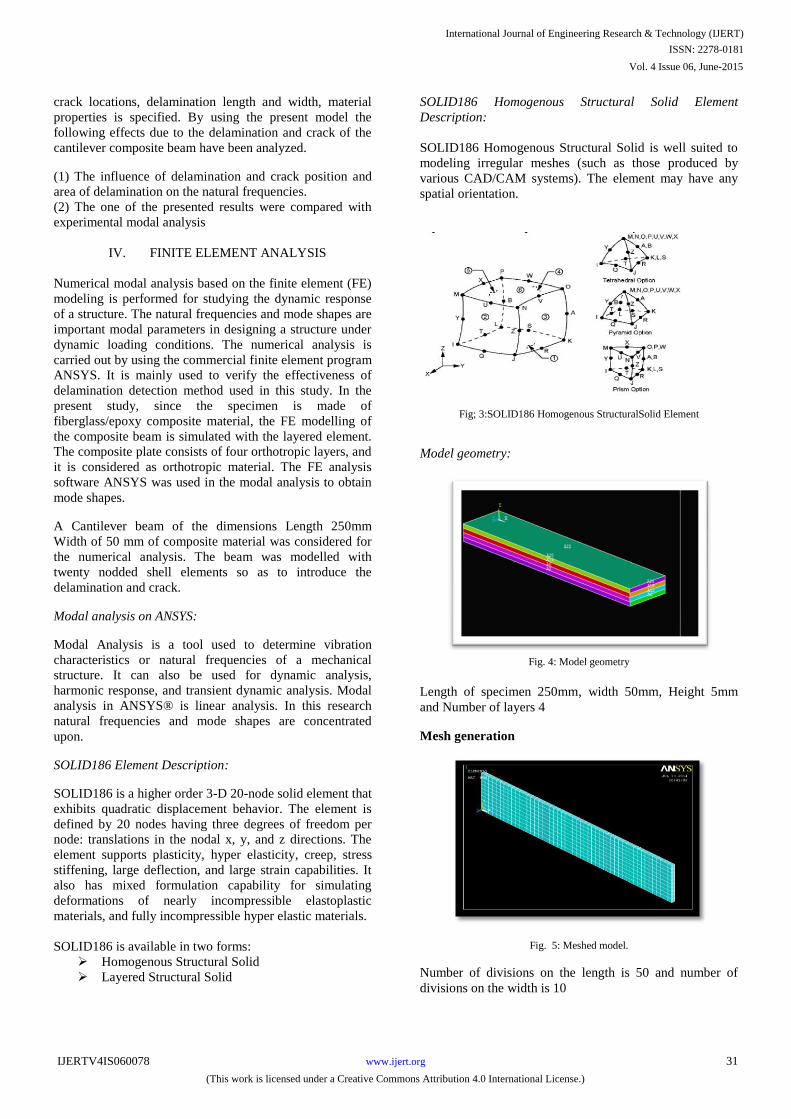
SOLID186 Element Description:
SOLID186 is a higher order 3-D 20-node solid element that
exhibits quadratic displacement behavior. The element is
defined by 20 nodes having three degrees of freedom per
node: translations in the nodal x, y, and z directions. The
element supports plasticity, hyper elasticity, creep, stress
stiffening, large deflection, and large strain capabilities. It
also has mixed formulation capability for simulating
deformations of nearly incompressible elastoplastic
materials, and fully incompressible hyper elastic materials.
SOLID186 is available in two forms:
Homogenous Structural Solid
Layered Structural Solid
SOLID186 Homogenous Structural Solid Element
Description:
SOLID186 Homogenous Structural Solid is well suited to
modeling irregular meshes (such as those produced by
various CAD/CAM systems). The element may have any
spatial orientation.
Fig; 3:SOLID186 Homogenous StructuralSolid Element
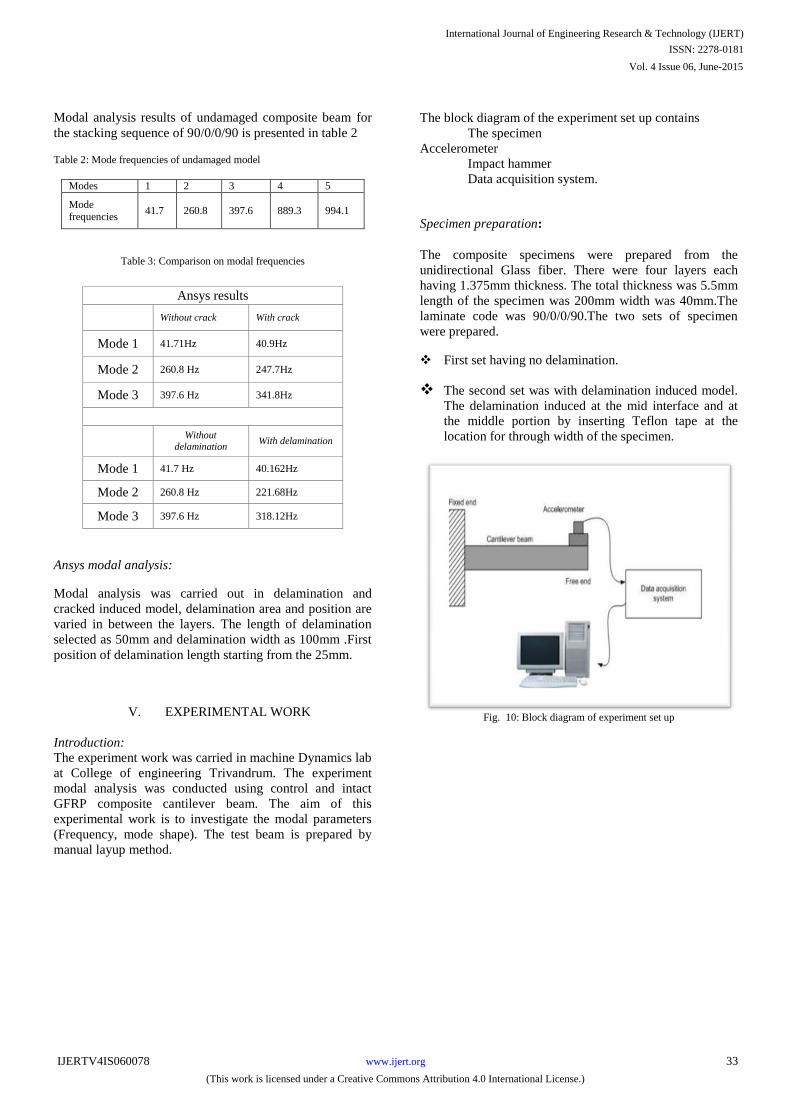
Model geometry:
Fig. 4: Model geometry
Length of specimen 250mm, width 50mm, Height 5mm
and Number of layers 4
Mesh generation
Fig. 5: Meshed model.
Number of divisions on the length is 50 and number of
divisions on the width is 10
International Journal of Engineering Research & Technology (IJERT)
ISSN: 2278-0181
www.ijert.orgIJERTV4IS060078
(This work is licensed under a Creative Commons Attribution 4.0 International License.)
Vol. 4 Issue 06, June-2015
31

Apply loads and obtain the result:
There are several mode-extraction methods that can be
selected in ANSYS®. These include: Block Lanczos,
Supernode, PCG Lanczos, reduced, unsymmetrical,
damped, and QR damped. Damping in the structure can be
accomplished by the damped and QR damped methods.
Block Lanczos is used to obtain the solution and boundary
condition used is as cantilever beam.
Visualize/review the results:
Results from a modal analysis are written to a structural
result file called, Job name. RST.Results could include:
Natural frequencies, expanded mode shapes. The results
can be reviewed in the general postprocessor.
Fig 6: mode shape of mode 1
Fig 7: mode shape of mode 2
Fig 8:mode shape of mode 3
Requirement specifications:
This step is done in preprocessing in ANSYS. In this work
the composite beam element model used was solid 186 and
it has specification at the preprocessing stage. The
parameters indicated below in the table are entered in to the
analysis. The Layer orientation selected for this study are
90/0/0/90.Each layer ismodeled as unidirectional.
Fig. 9: Quasi –isotropic composite laminate
Table 1:Material properties
Length of beam
250mm
Width
50mm
Number of layers
4
International Journal of Engineering Research & Technology (IJERT)
ISSN: 2278-0181
www.ijert.orgIJERTV4IS060078
(This work is licensed under a Creative Commons Attribution 4.0 International License.)
Vol. 4 Issue 06, June-2015
32
Density 1901kg/m3
E11 135.5GPa
E22 9GPa
E33 9GPa
Poisson’s ratio 0.24
Shear modulus 5.2GPa
Shear modulus ,G13 3.08GPa
Modal analysis results of undamaged composite beam for
the stacking sequence of 90/0/0/90 is presented in table 2
Table 2: Mode frequencies of undamaged model
Modes
1
2
3
4
5
Mode frequencies
41.7
260.8
397.6
889.3
994.1
Table 3: Comparison
on modal frequencies
Ansys results
Without crack
With crack
Mode 1
41.71Hz
40.9Hz
Mode 2
260.8 Hz
247.7Hz
Mode 3
397.6 Hz
341.8Hz
Without
delamination
With delamination
Mode 1
41.7 Hz
40.162Hz
Mode 2
260.8 Hz
221.68Hz
Mode 3
397.6 Hz
318.12Hz
Ansys modal analysis:
Modal analysis was carried out in delamination and
cracked induced model, delamination area and position are
varied in between the layers. The length of delamination
selected as 50mm and delamination width as 100mm .First
position of delamination length starting from the 25mm.
V.
EXPERIMENTAL WORK
Introduction:
The experiment work was carried in machine Dynamics lab
at College of engineering Trivandrum. The
experiment
modal analysis was conducted using control and intact
GFRP composite cantilever beam. The aim of this
experimental work is to investigate the modal parameters
(Frequency, mode shape). The test beam is prepared by
manual layup method.
The block diagram of the experiment set up contains
The specimen
Accelerometer
Impact hammer
Data acquisition system.
Specimen preparation:
The composite specimens were prepared from the
unidirectional Glass fiber. There were four layers each
having 1.375mm thickness. The total thickness was 5.5mm
length of the specimen was 200mm width was 40mm.The
laminate code was 90/0/0/90.The two sets of specimen
were prepared.
First set having no delamination.
The second set was with delamination induced model.
The delamination induced at the mid interface and at
the middle portion by inserting Teflon tape at the
location for through width of the specimen.
Fig. 10: Block diagram of experiment set up
International Journal of Engineering Research & Technology (IJERT)
ISSN: 2278-0181
www.ijert.orgIJERTV4IS060078
(This work is licensed under a Creative Commons Attribution 4.0 International License.)
Vol. 4 Issue 06, June-2015
33

Fig
11: glass fibre sheets marked with areas for delamination
Fig 12: Plying up with suitable adhesives
Fig 13: Finalcomposite laminate
Fig. 14: Specimen without delamination
Fig. 15: Specimen with delamination
Using an impact hammer is the simplest and fastest way of
exciting a structure into vibration. It is very suitable to use
in operational conditions. Moreover, it does not influence
the structure by attaching the exciter, which is an
advantage itself. The hammer consists of a head, force
transducer, tip and handle. The equipment of a hammer is
usually completed with a set of tips of different stiffness
and with a set of heads of different masses. A force
transducer detects the magnitude of the force felt by the
impactor which is assumed to be equal and opposite to that
experienced by the structure.Each PCB® Modally Tuned®,
ICP® instrumented impact hammer features a rugged,
force sensor that is integrated into the hammer’s striking
surface.
“Modal Tuning” is a feature that ensures the structural
characteristics of the hammer do not affect measurement
results. This is accomplished by eliminating hammer
resonances in the frequency range of interest from
corrupting the test data, resulting in more accurate and
consistent measurements.
The force sensor serves to provide a measurement of the
amplitude and frequency content of the energy stimulus
that is imparted to a test object. Accelerometers are used in
conjunction with the hammer to provide a measurement of
the object’s structural response due to the hammer blow. A
variety of tips supplied with each hammer permit the
energy content of the force impulse to be tailored to suit the
requirements of the item under test.
International Journal of Engineering Research & Technology (IJERT)
ISSN: 2278-0181
www.ijert.orgIJERTV4IS060078
(This work is licensed under a Creative Commons Attribution 4.0 International License.)
Vol. 4 Issue 06, June-2015
34

Fig. 16: Impact hammer
Data acquisition card:
The data acquisition card used in the experiment is
National Instuments, the photograph of The NI USB-4431
which is displayed in figure 6.16. It is a five-channel
dynamic signal acquisition module for making high-
accuracy measurements from IEPE sensors. The USB-4431
delivers 100 dB of dynamic range and incorporates
software-selectable IEPE (2.1 mA constant current) signal
conditioning for accelerometers and microphones. The
module consists of four analog input channels for reading
from IEPE sensors with a single analog output. The four
analog input channels simultaneously acquire at rates from
2 to 102.4 kS/s. In addition, each channel includes built-in
antialiasing filters that automatically adjust to your
sampling rate. The USB-4431 is ideal for a wide variety of
portable test applications such as frequency response audio
tests or suspension shaker tests.
. The data acquisition system includes a data acquisition
box (DAQ) and a host computer which displays the data in
real-time and provides a graphical-user interface
(MEScope). Combined with MEScope and the PC, we can
analyze and process acquired signals and control simple
processes anytime, anywhere.DAQ provides analog input
(AI), analog output (AO), digital input and output (DIO),
audio, power supplies, and digital multimeter (DMM)
functions in a compact USB device.
Fig. 17: Data acquisition card
Fast Fourier transform (FFT):
Frequency Analysis Based on the Fast Fourier Transform
(FFT) Algorithm is the tool of choice for measurement and
diagnostic of vibration. The FFT Analyzer is recently
developed pc based virtual instrument. It uses impulse
execution & either frequency domain analysis or time –
domain Analysis to entrant the model Parameter from the
response measurement in real time. Following impulse are
execution of the specimen , the measured analog response
signal maybe digitalized & analyzed using the domain
techniques or transformed for analysis in the frequency
domain using FFT Analyzer. The peaks in the frequency
response spectrum are the location of natural frequency.
The model parameter can be entranced from a set of
frequency response function (FRF) measurements between
one or more reference positions & measurement position
required in model. The response frequency and damping
value can be found from any of the FRF measurements. On
the structure the execution of the model parameter from
FRF can be done using a variety of mathematical curve
fitting algorithm. The FRF can be obtained using
multichannel FFT measurements. The determination of
frequency with the help of PULSE software requires the
determination of mode frequencies.
The Piezo-Electric accelerometer:
This accelerometer is based on the Piezo-electric
effect. When a Piezo-electric crystal is subjected to a
mechanical force or stresses along specific planes, a
voltage is generated across the
International Journal of Engineering Research & Technology (IJERT)
ISSN: 2278-0181
www.ijert.orgIJERTV4IS060078
(This work is licensed under a Creative Commons Attribution 4.0 International License.)
Vol. 4 Issue 06, June-2015
35

Fig: 18: Piezo-electric accelerometer.
crystal. If the force on the crystal is due to an
accelerometer, a measure of the voltage across the crystal
becomes a measure of the acceleration.PCB's single axis
and three axis (triaxial) accelerometer configuration
parameters include sensitivity, temperature, frequency
response, amplitude response, form factor and lead wire
grounding. Accelerometers are critical for evaluating
proper performance of equipment or structures. Such
applications usually require proof of calibration of the
entire measurement system from the sensor through to the
final output. PCB calibrates all products traceable to NIST
and includes a calibration certificate with each sensor
shipped.
VI. EXPERIMENTAL PROCEDURE
Free vibration is conducted on the test specimens to obtain
its including natural frequencies the beam is clamped on
the table with the help of clamping device arrangement.
The impact is applied by striking at the marked portion
near the fixed end of the test specimen.
During free vibrations, the dynamic responses of the beam
are measured through the accelerometer as shown in figure.
For this test, the location of accelerometer different marked
position in order to extract the signals of vibration. The
layout of the sensors on the test specimen is depicted in
Figure A data acquisition system i.e. Data card is used to
store the record data and transfer measured data to the pc
for post processing. Frequency response functions (FRFs)
were obtained and analyzed using ME Scope software.
Fig. 19: Schematic diagram of experiment arrangement
Measurement procedure:
1. A composite beam of E Glass/Epoxy with, dimensions
(L, w, d) was used as a cantilever beam.
2. The fixed end was made by fixing the beam with the
help of Pipe wise fixed on thetable.
3. The connections of the accelerometer were properly
made.
4. Accelerometer was placed at the different positions of
the cantilever beam, to measure the vibration response.
5. The cantilever beam was struck with an impact hammer
and beam starts vibrating.
6. All the data was recorded obtained from the vibrating
beam with the help of accelerometer attached to it.
7. The experiments were repeated to check the repeatability
of the experimentation.
8. The whole set of data was recorded and then the data
was imported into the PC further processing and analysis
was done using ME Scope software.
The signal obtained from the data acquisition system is
used to extract the mode frequencies.
The Validation of Finite Element Model:
The first three mode frequencies obtained from the modal
analysis in Ansys results were compared with the
experimental modal analysis results and is presented in
table
It is observed that the results showinggood agreement
with each other. Thus the composite modelling technique
in this work is acceptable.
International Journal of Engineering Research & Technology (IJERT)
ISSN: 2278-0181
www.ijert.orgIJERTV4IS060078
(This work is licensed under a Creative Commons Attribution 4.0 International License.)
Vol. 4 Issue 06, June-2015
36
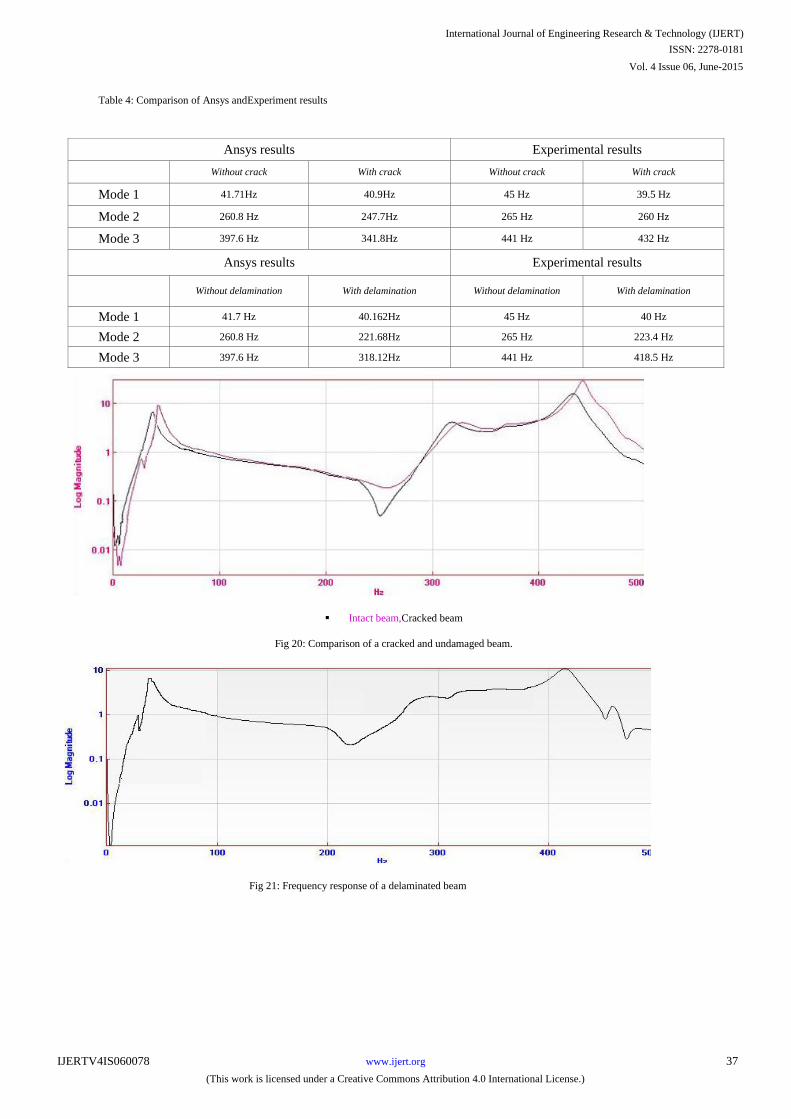
Table 4: Comparison of Ansys andExperiment results
Ansys results Experimental results
Without crack With crack Without crack With crack
Mode 1 41.71Hz 40.9Hz 45 Hz 39.5 Hz
Mode 2 260.8 Hz 247.7Hz 265 Hz 260 Hz
Mode 3 397.6 Hz 341.8Hz 441 Hz 432 Hz
Ansys results Experimental results
Without delamination With delamination Without delamination With delamination
Mode 1 41.7 Hz 40.162Hz 45 Hz 40 Hz
Mode 2 260.8 Hz 221.68Hz 265 Hz 223.4 Hz
Mode 3 397.6 Hz 318.12Hz 441 Hz 418.5 Hz
Intact beam,Cracked beam
Fig 20: Comparison of a cracked and undamaged beam.
Fig 21: Frequency response of a delaminated beam
International Journal of Engineering Research & Technology (IJERT)
ISSN: 2278-0181
www.ijert.orgIJERTV4IS060078
(This work is licensed under a Creative Commons Attribution 4.0 International License.)
Vol. 4 Issue 06, June-2015
37
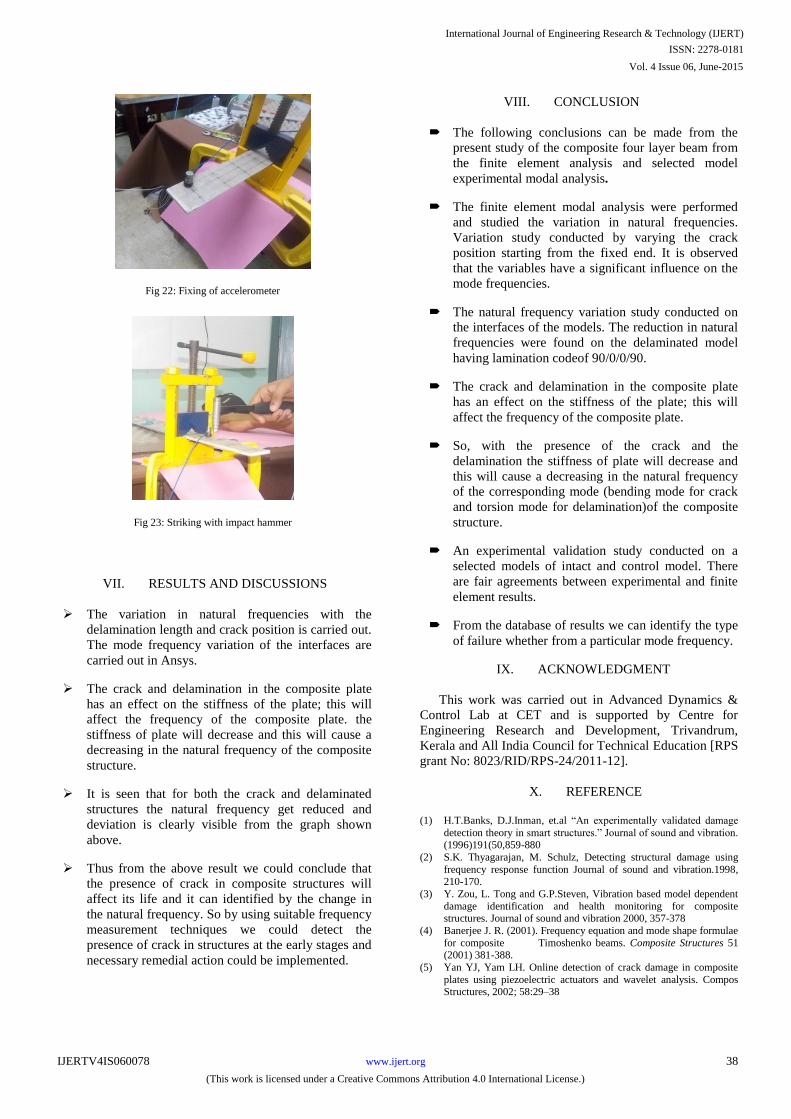
Fig 22: Fixing of accelerometer
Fig 23: Striking with impact hammer
VII. RESULTS AND DISCUSSIONS
The variation in natural frequencies with the
delamination length and crack position is carried out.
The mode frequency variation of the interfaces are
carried out in Ansys.
The crack and delamination in the composite plate
has an effect on the stiffness of the plate; this will
affect the frequency of the composite plate. the
stiffness of plate will decrease and this will cause a
decreasing in the natural frequency of the composite
structure.
It is seen that for both the crack and delaminated
structures the natural frequency get reduced and
deviation is clearly visible from the graph shown
above.
Thus from the above result we could conclude that
the presence of crack in composite structures will
affect its life and it can identified by the change in
the natural frequency. So by using suitable frequency
measurement techniques we could detect the
presence of crack in structures at the early stages and
necessary remedial action could be implemented.
VIII. CONCLUSION
The following conclusions can be made from the
present study of the composite four layer beam from
the finite element analysis and selected model
experimental modal analysis.
The finite element modal analysis were performed
and studied the variation in natural frequencies.
Variation study conducted by varying the crack
position starting from the fixed end. It is observed
that the variables have a significant influence on the
mode frequencies.
The natural frequency variation study conducted on
the interfaces of the models. The reduction in natural
frequencies were found on the delaminated model
having lamination codeof 90/0/0/90.
The crack and delamination in the composite plate
has an effect on the stiffness of the plate; this will
affect the frequency of the composite plate.
So, with the presence of the crack and the
delamination the stiffness of plate will decrease and
this will cause a decreasing in the natural frequency
of the corresponding mode (bending mode for crack
and torsion mode for delamination)of the composite
structure.
An experimental validation study conducted on a
selected models of intact and control model. There
are fair agreements between experimental and finite
element results.
From the database of results we can identify the type
of failure whether from a particular mode frequency.
IX. ACKNOWLEDGMENT
This work was carried out in Advanced Dynamics &
Control Lab at CET and is supported by Centre for
Engineering Research and Development, Trivandrum,
Kerala and All India Council for Technical Education [RPS
grant No: 8023/RID/RPS-24/2011-12].
X. REFERENCE
(1) H.T.Banks, D.J.Inman, et.al “An experimentally validated damage
detection theory in smart structures.” Journal of sound and vibration. (1996)191(50,859-880
(2) S.K. Thyagarajan, M. Schulz, Detecting structural damage using
frequency response function Journal of sound and vibration.1998, 210-170.
(3) Y. Zou, L. Tong and G.P.Steven, Vibration based model dependent
damage identification and health monitoring for composite structures. Journal of sound and vibration 2000, 357-378
(4) Banerjee J. R. (2001). Frequency equation and mode shape formulae
for composite Timoshenko beams. Composite Structures 51 (2001) 381-388.
(5) Yan YJ, Yam LH. Online detection of crack damage in composite
plates using piezoelectric actuators and wavelet analysis. Compos Structures, 2002; 58:29–38
International Journal of Engineering Research & Technology (IJERT)
ISSN: 2278-0181
www.ijert.orgIJERTV4IS060078
(This work is licensed under a Creative Commons Attribution 4.0 International License.)
Vol. 4 Issue 06, June-2015
38
(6) Y.Zou, L.Tong and G.P.Steven, Vibration based model dependent
damage identification and health monitoring for composite
structures. Journal of sound and vibration 2000, 357-378
(7) J.T.S. Wang, Y.Y. Liu and J.A. Gibby, Vibration of split beams.
Journal of Sound and Vibration 844 (1982), pp. 491–502. (8) P.M.Mujumdar and Suryanarayan, Flexural vibrations of beams with
delamination-, 1988, Journal of Sound and Vibration, 125 (3), 441-
461 (9) Caleb White, Henry C H,BrendanWhittghaman, Damage detection
in repairs using frequency response techniques , composite
structures 87(2009)175-181. (10) Peter Avitabile, Experimental Modal Analysis University of
Massachusetts Lowell, Lowell, Massachusetts A Simple Non-
Mathematical Presentation. (11) Structural Vibration: Analysis and Damping-C.E Beards, 1996,
Halsted Press an imprint of John Wiley &Sons Inc, ISBN 0 340
64580 (12) In-Flight Separation of Vertical Stabilizer-NTSB/AAR-04/04, 2004,
National Transportation Safety Board
(13) Free Vibration Frequencies of a Delaminated Beam- Ramkumar RL, Kulkarni SV, Pipes RB., 1979, Society of Plastics Industry, 22-
E1–5
(14) Effect of Vibration on Delaminated Beams-Amit Kumar Singh, 2010, Thesis submitted to National Institute of Technology
Rourkela,769008 Service and Technology, (54) 101-109
(15) Free Vibration Analysis of Delaminated Composite Beams- Jaehong Lee, 2000, Computers and Structures, 2 (74) 121-129
(16) Free Vibration Analysis of Multiple Delaminated Beams under Axial Compressive Load- Christian N. Della and DongweiShu,
2009, Journal of Reinforced Plastics and Composites, 11( 28) 1356-
1381 (17) Delamination, A Damage Mode in Composite Structures,-A.C Garg,
1998, EngineeringFracture Mechanics, 29(5) 557-584
(18) Detection of Structural Damage through Changes in Frequency-Salawu, O. S., 1997, Engineering Structures, 19(9) 718-723
International Journal of Engineering Research & Technology (IJERT)
ISSN: 2278-0181
www.ijert.orgIJERTV4IS060078
(This work is licensed under a Creative Commons Attribution 4.0 International License.)
Vol. 4 Issue 06, June-2015
39