dan shoemaker aviation curmudgeon, nws fwd from a 2005 study done with: rick curtis, chief...
TRANSCRIPT

TAF Verification from a Customer Perspective
Dan Shoemaker Aviation Curmudgeon, NWS FWD
From a 2005 study done with: Rick Curtis, Chief Meteorologist, SWA Paul Witsaman, Southern Region RAM

Stats on Demand (SOD) verifies to five minute intervals.
I can’t forecast to five minute intervals!
Airlines can’t land in a five minute window.
SOD verification numbers seem low (CSI’s <50%)
Is this the best way to measure performance?
How might an airline customer measure performance?
Motivation (now)

Pick a day when widespread weather was a factor.
Examine all SWA flights that landed in Southern Region (869 flights, 24 airports).
Use an airline perspective –Look at “alternate fuel required”
(2000/3) performance.Did each flight’s planning TAF
accurately reflect the landing conditions…was the extra fuel needed?
TAF Study Overview
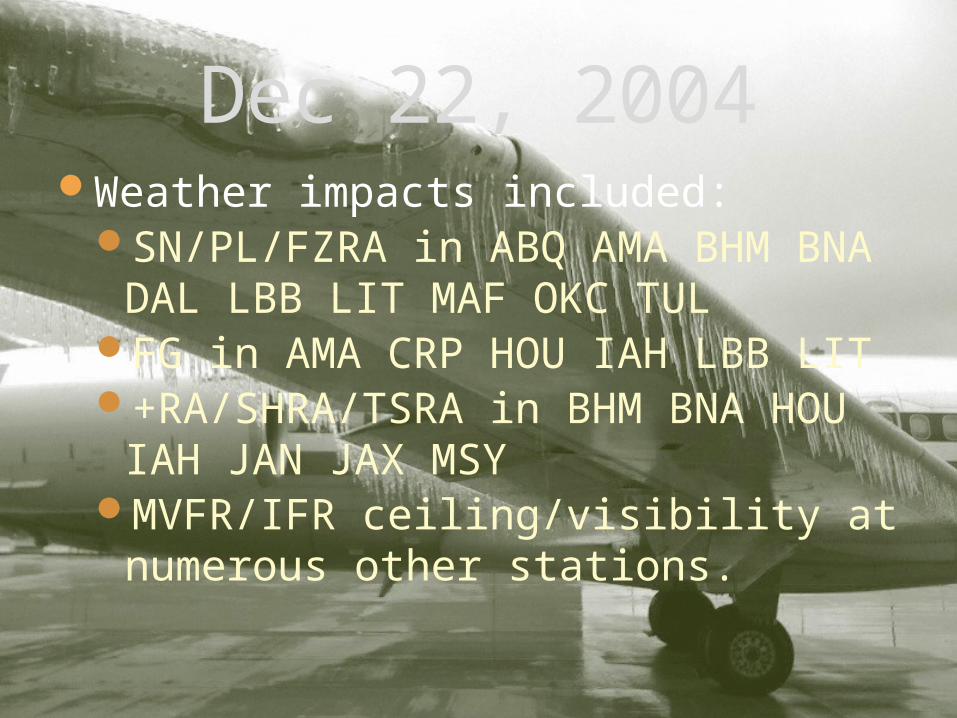
Weather impacts included:SN/PL/FZRA in ABQ AMA BHM
BNA DAL LBB LIT MAF OKC TULFG in AMA CRP HOU IAH LBB LIT+RA/SHRA/TSRA in BHM BNA
HOU IAH JAN JAX MSYMVFR/IFR ceiling/visibility at
numerous other stations.
Dec 22, 2004

For each flight:Examine the TAF valid 2 hours prior to
each flight’s take-off. This is assumed to be the TAF the dispatcher used to compute the fuel load.
Were conditions below 2000/3 forecast at each flight’s landing time (includes prevailing and TEMPO)?
Detailed Methodology

For each flight:Examine all observations, include
specials, within the hour bracketing each flight’s landing time.
If conditions below 2000/3 occurred at any time within the landing hour…assume alternate fuel was required (the TAF was “reasonable” since the weather occurred near landing time).
Detailed Methodology (cont)

Verify the TAF against the observations for each flight creating the 2 x 2 contingency table.
TAF forecasted conditions below 2000/3? (Y/N)
Conditions below 2000/3 occurred at some time during landing hour? (Y/N)
More Methodology

Obs Alt Req’dYES NO
TAF Alt Req’d YES
320 (Hits) 90 (False Alarms)
NO 39 (Misses)
420 (Correct Negatives)
Results
PODFARCSI
Accuracy
.891 Hits/(Hits + Misses)
.220 FA/(FA + Hits)
.713 Hits/(Hits + Misses + FA)
.852 (Hits + Correct Neg)/Total

Obs Alt Req’dYES NO
TAF Alt Req’d YES
320 (Hits) 90 (False Alarms)
NO 39 (Misses)
420 Correct Negatives)
POD .891 FAR .220 CSI .713 Accuracy .852
Hits: Extra fuel costs were required.Correct Neg: Extra fuel costs were saved. False Alarms: NWS cost airlines money.Misses: Diversions possible*.

SOD CSI for 2000/3 – unavailable (early 2005). SOD CSI for 1000/3 -- available.
I examined 3 comparable winter events from 2009 that produced similar 1000/3 CSI’s (and had 2000/3 CSI available).
Averaged 2000/3 CSI’s used as an approximate value for the TAFs used in this study.Yes, this is an “apples to oranges”
comparison. But…ball park numbers still provide
insight.
Stats on Demand vs This Study

2005 study CSI: .713 SOD ballpark CSI: .425
Stats on Demand CSI vs Study CSI

Verifying five minute intervals makes verification scores look low. Real-world skill and value to customers are likely higher.
Concentrate on SOD scores vs guidance -- change focus to examine local improvement over models. (do we add value compared to an automated product?)
Use SOD results to look for weak areas. Negative forecasting will show up in the bias scores.
Conclusion/Recommendations

Any questions so far?
And now for something completely different…..
Monty Python

Intended for Aviation Program Leaders/ Forecasters
Real change has to be made locally-where the TAFs are written.
Improving TAFs

Biggest obstacle to change—office inertia.You have to change your office
culture.…but APL’s have responsibility with
no authority.We can’t “make” anybody do
anything.
What can you do?
Improving TAFs

Decide to write them. You/MIC are the advocates.Your customers want them.
Decide on which airports.Widespread GA in North Texas -
we write all our sites.Obtain union cooperation.
I took a poll of all 12 forecasters, and got 12 “yes” votes. I did have to do some “lobbying”.
Three Hour TAFs—a “How To” for APL’s

Let your customers/back-up sites know.We issued a PNS; added a notice to
Aviation AFDs; added a headline on web page; notified sister offices.
Decide on local procedures.Make some AWIPS changes (alarms,
etc).
Three Hour TAFs—a “How To” for AFP’s

Implement 3 hour TAF amendments.Emphasize PPTAF best practices.
PPTAF minimizes bad TAF practices that hurt performance/verification.
If all forecasters use PPTAF practices, TAFs will be more consistent between forecasters/offices.
Improving TAFs
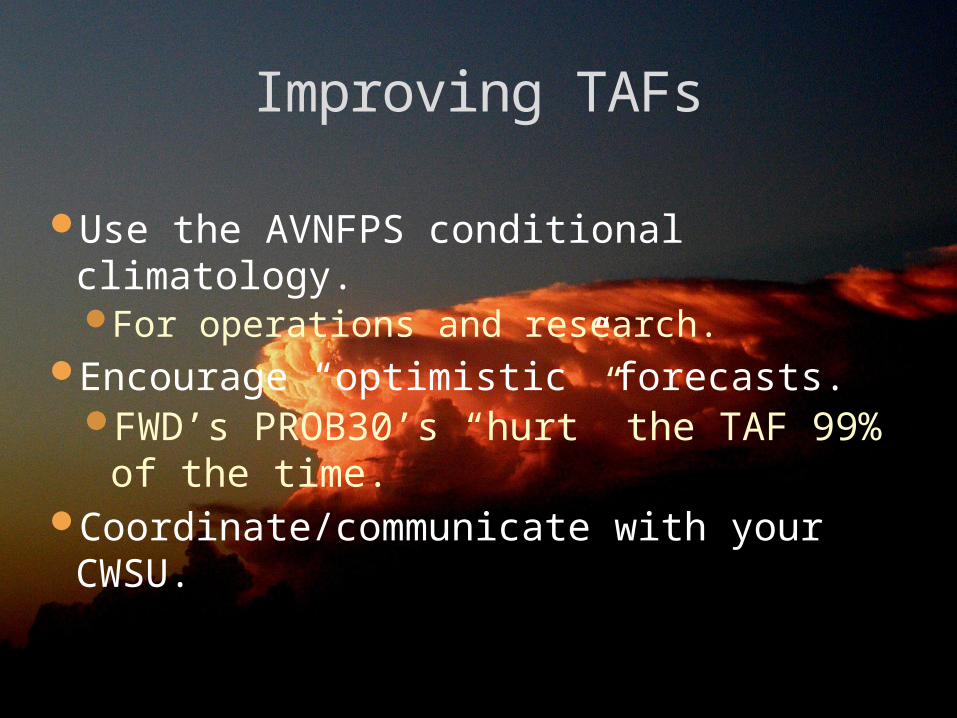
Use the AVNFPS conditional climatology.For operations and research.
Encourage “optimistic” forecasts. FWD’s PROB30’s “hurt” the TAF
99% of the time.Coordinate/communicate with your
CWSU.
Improving TAFs

Improving TAFs
Make sure your TAF writers know how they affect their customers.
“TEMPO 2124 1SM TSRA BKN035CB”

How do you make these “cultural”changes?
Use “force of personality” to get individual forecasters to improve. Group statements (emails to all, memos) don’t work.Provide individual feedback. A number of FWD forecasters will tell you “I didn’t want to get a ‘Shoe’ talk, so I didn’t…”
Newton’s first law: Aviation programs at rest remain so. Change the comfort zone.

Provide formal feedback; office and individual. You can’t change what you don’t measure.
FWD - annual IFR/MVFR/alt reqd stats.Performance vs SR and LAMP
guidance.2000/3 is more important than
total IFR.Individual annual IFR/alt reqd
performance vs office average and LAMP.Results are kept anonymous.
Improving TAFs

FWD Annual Stats(percent improvement over LAMP)
0-12 hours Scheduled TAFS all sites FWD
Category
FWD CSI SR CSI%
Occurrence*VLIFR 20.0 19.0 0.7
LIFR Slice 34.1 19.1 1.9IFR Slice 18.7 12.4 4.2
MVFR Slice 26.4 8.4 12.0LIFR & Below 8.6 10.7 2.7
IFR & Below 12.4 2.7 6.9MVFR &
Below 6.6 -2.0 19.0VFR 0.1 -1.9 81.0

Annual Individual TAF stats(percent improvement over LAMP):
A
B
C
D
E
F
G
H
I
J
K
L
M FWD
-20 -10 0 10 20 30 40 50 60 70 80
4.0
-4.7
-1.3
-0.8
19.9
18.6
9.8
-3.0
4.2
0.8
2.2
7.9
4.0
22.1
-8.8
70.5
20.7
10.1
-5.3
19.0
-3.5
28.3
4.2
0.0
38.0
12.5
1000&3
2000&3

Individual TEMPO Use 12-30 Hours(PPTAF No-No)
A
B
C
D
E
F
G
H
I
J
L
M
AVG
0 50 100 150 200 250 300 350 400 450
Hours of TEMPO Forecast
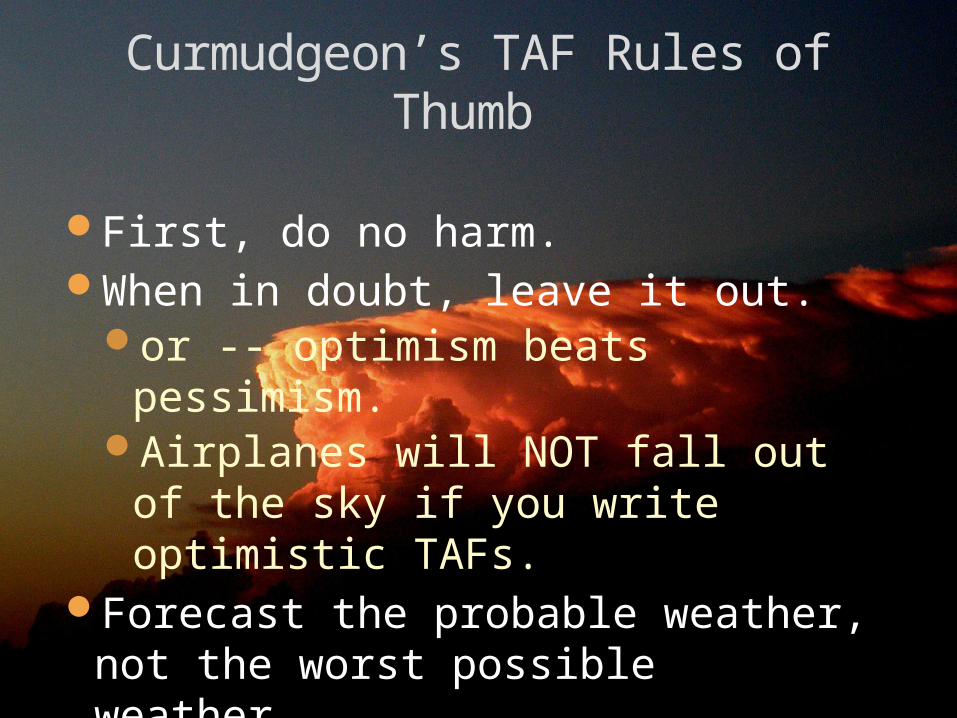
First, do no harm.When in doubt, leave it out.
or -- optimism beats pessimism.Airplanes will NOT fall out of the
sky if you write optimistic TAFs.Forecast the probable weather, not
the worst possible weather.
Curmudgeon’s TAF Rules of Thumb

The TAF is not a portrait of the atmosphere, it is a stick figure. As long as it is anatomically correct, it’s a good representation.
Curmudgeon’s TAF Rules of Thumb

“Constant abrasion produces the pearl…it’s a disease of the oyster.”
Lenny Bruce
Curmudgeon’s Forecaster Rule of Thumb

You cannot wait for improvements to come from above — so make them locally.
If you make TAF improvement a priority —TAFs will improve. They need to improve.
Most local improvements you can make involve effort, but zero cost.
You don’t have to do what I do, but DO SOMETHING!

Questions/Discussion?
Thanks for your time.