daq 101 Πbuilding blocks and core - national instrumentsdaq 101 Πbuilding blocks and core ... we...
TRANSCRIPT


63
DAQ 101 � Building Blocks and Core Technologies for Measurement and Control
Process Automation Corporation used an NI programmable automation controller with FPGA technology to build a custom control system for a fastener installation tool.
The performance and reliability of the FPGA within the PAC allows for precise termination at the correct point during the fastener installation process eliminating the possibility for incomplete seating or damage due to excessive force and reduced holding power. The implementation required high-speed analog data acquisition on multiple channels, running of custom processing algorithms, and deterministic control to operate machine.
They had to calculate the proper stopping point in real time, during the acquisition, as torque and displacement values varied when fastening to materials of different density and thickness. They installed one of these VFI tools on the end of a robotic arm in a vehicle manufacturing plant. The PAC provided a robust, industrial-grade platform with low weight, high reliability, and small footprint, with a level of customization which would not have been achieved with traditional PLCs.
© National Instruments Corporation Automation Developers Forum

64
What is a DAQ system for PACs?� DAQ, or data acquisition, is
the automated process for taking measurements from:� 4-20 mA sensors� RTDs / Thermocouples
� In a PAC system, DAQ includes high-speed, high-resolution measurements such as:� Machine vibration� Power quality
You are probably familiar with data acquisition or DAQ as an automated measurement process. This includes measurements from 4-20 mA sensors, temperature sensors, and other transducers. Basic DAQ can be done with PLC, PACs, or stand-alone instrumentation.
A key capability of PAC DAQ systems is taking high-resolution (24-bit), high-speed (200 kHz) measurements. This different from a typical PLC which may be limited to slower process measurements. In this presentation, we are going to cover the factors involved with taking high-speed, high-resolution measurements with PACs.
Automation Developers Forum ni.com/forum

65
PAC Data Acquisition System Components
V
0101Inpu
t Sig
nals
Out
put S
igna
ls
0101
V
i Sign
alC
ondi
tioni
ng
Con
verte
rs
Data Acquisition (DAQ) System
A/DD/ADIOTIO
Driver and Application Software
Data acquisition hardware moves the signals into and out of the PAC and is made up of multiple components, including converters, which provide a translator between the PAC and the outside world; and signal conditioning, which provides additional modification of the incoming and outgoing signals to provide another level of compatibility between the PAC and the outside world.
Data acquisition systems consist of input and/or output signals. The key to PAC-based data acquisition is providing a seamless data transfer from the surrounding environment or a unit under test (UUT) into a PAC for manipulation with software.
The link between the PAC and data acquisition hardware is managed by driver and application software. It is the software that powers the measurements. PAC software makes the integration of the hardware in any test and measurement system completely seamless. This effectively reduces development time and leads to an increase in productivity.
© National Instruments Corporation Automation Developers Forum
66
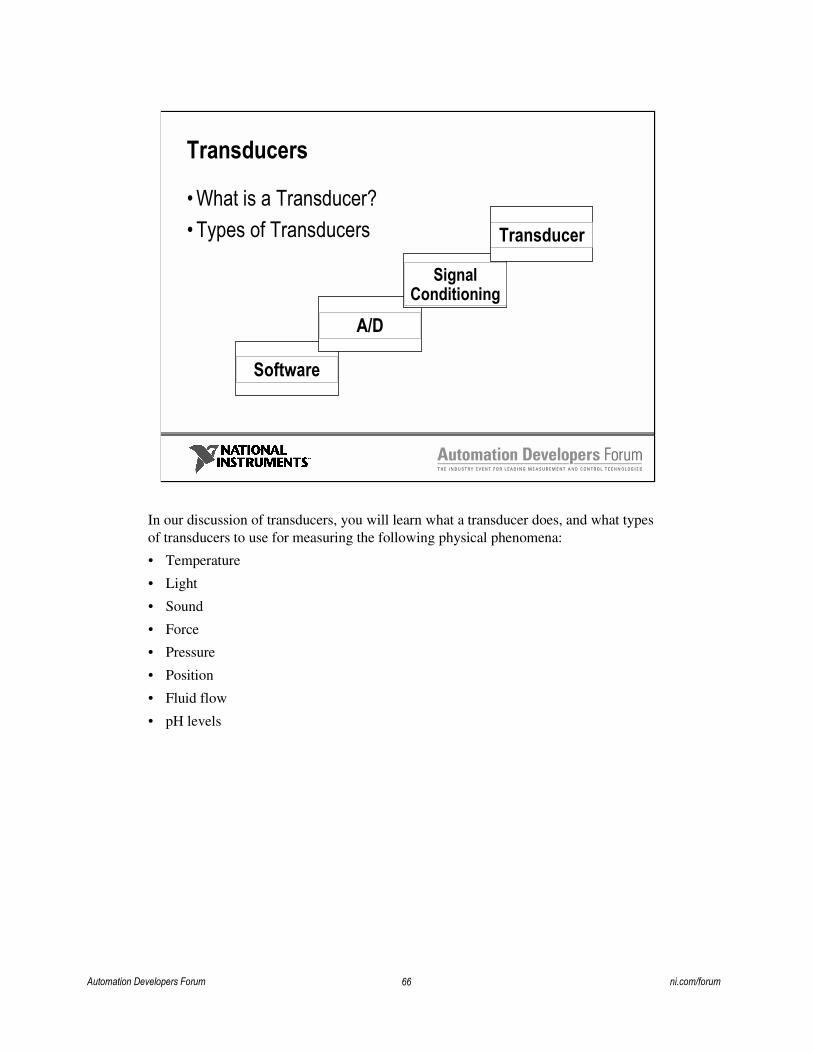
Transducers
� What is a Transducer?� Types of Transducers
Software
A/D
Signal Conditioning
Transducer
In our discussion of transducers, you will learn what a transducer does, and what types of transducers to use for measuring the following physical phenomena:
• Temperature
• Light
• Sound
• Force
• Pressure
• Position
• Fluid flow
• pH levels
Automation Developers Forum ni.com/forum

67
Types of Transducers
Rotational FlowmetersHead MetersFluidQuadrature EncoderLVDTsPotentiometersPosition & DisplacementPiezo-electric Pressure SensorStrain GaugeForce & PressureMicrophoneSoundPhoto SensorVacuum TubeLightAccelerometerVibrationThermistorResistive Temperature Device (RTD)ThermocoupleTemperature
TransducerPhenomenon
Transducers exist for a variety of applications from measuring temperature to pressure to fluid flow. The above list is only a sample of the types of transducers that exist and the types of applications they can be used for. If you have a physical phenomena to measure, a transducer probably exists to measure it. For more information on transducers and where to get them visit http://www.ni.com/sensors.
Different transducers have different requirements for converting a physical phenomenon into a measurable signal. For instance, a Resistance Temperature Detector (RTD) needs an excitation current in order to measure the temperature. A thermocouple doesn’t need any sort of excitation current, but it does need cold junction compensation. Strain gages use a configuration of resistors called a Wheatstone Bridge to measure strain.
© National Instruments Corporation Automation Developers Forum

68
Signal Conditioning
� Purpose of Signal Conditioning� Types of Signal Conditioning
Software
A/D
Signal Conditioning
Transducer
It is not always the best practice or even possible to connect the signal directly to the PAC Data Acquisition device. We might need to alter the signal to make it more suitable for a Data Acquisition device to measure. We can alter our signal with signal conditioning hardware. In the following section we will discuss the purpose of signal conditioning, and the following common types of signal conditioning:
• Amplification
• Excitation
• Linearization
• Isolation
• Filtering
Automation Developers Forum ni.com/forum

69
Types of Signal Conditioning� Isolation
� Protects DAQ hardware from high voltages� Amplification
� Boost low-level signals for measurements� Filtering
� Remove noise or unwanted signals such as 60 Hz AC noise � Loop Power
� 4-20 mA systems� Transducer Excitation
� External voltage or current applied to transducer such as accelerometers� Linearization
� Most transducers are not linear; can be done in hardware or software
Isolation: Often your signal will exceed the limits that your DAQ device can handle. Trying to measure a signal that is to small for your DAQ device can only result in an inaccurate reading, but trying to measure a signal that is too large for your DAQ device can damage the device. With large voltages we apply a signal conditioning technique called isolation. The signal conditioning hardware is designed to handle high voltages and attenuate them to a voltage your DAQ device can handle.
Amplification: If a signal is too small to be accurately measured by a DAQ device, it can be amplified to maximize the functionality of the DAQ system. This is often used with thermocouple signals which are usually in the millivolt range.
Filtering: Filtering is used to remove unwanted portions of your signal. The most common application of this is to remove unwanted noise from your signal. Most noise is created from lights or the power supply of your computer and will show up around 60 Hz. Using a lowpass filter with a cutoff frequency below 60 Hz will help to remove that noise from your signal. Filtering can be done in hardware or software.
Transducer Excitation: As we learned in our discussion of transducers, most transducers need some external voltage or current in order to perform their job. The excitation voltage or current can be provided by your signal conditioning hardware.
Linearization: A good deal of transducers do not produce voltages in a linear manner. For instance, a change in voltage of 10 millivolts for a thermocouple is usually not a change of 10 degrees. Most transducers have linearization tables that map out how to scale your transducer. The linearization of your transducer can either be done in hardware or software.
© National Instruments Corporation Automation Developers Forum
70
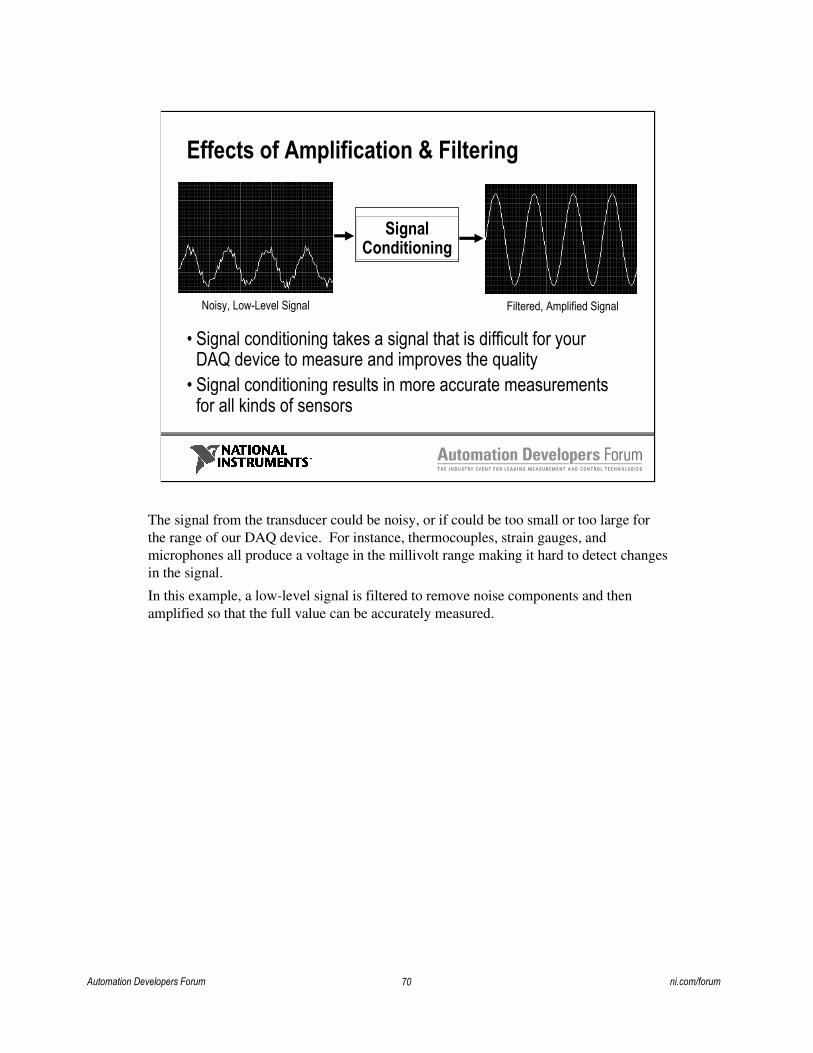
Effects of Amplification & Filtering
� Signal conditioning takes a signal that is difficult for your DAQ device to measure and improves the quality
� Signal conditioning results in more accurate measurements for all kinds of sensors
Noisy, Low-Level Signal Filtered, Amplified Signal
Signal Conditioning
The signal from the transducer could be noisy, or if could be too small or too large for the range of our DAQ device. For instance, thermocouples, strain gauges, and microphones all produce a voltage in the millivolt range making it hard to detect changes in the signal.
In this example, a low-level signal is filtered to remove noise components and then amplified so that the full value can be accurately measured.
Automation Developers Forum ni.com/forum

71
Analog-to-Digital Converters
� A/D Functionality� Sampling Rate� Resolution
Software
A/D
Signal Conditioning
Transducer
We will now begin discussing the analog to digital converters that you can use for your PAC systems. We will look at how a basic A/D works and the other factors involved in selecting an A/D for your system.
© National Instruments Corporation Automation Developers Forum

72
What is an Analog-to-Digital Converter?
A device that converts the analog voltage or current from transducers into a digital representation so that it can be analyzed and processed
A/D Processor
Analog to digital converters are found in all controllers, PLCs, and PACs. The A/D converts the analog voltage or current signals from transducers to a digital signal so that controllers can analyze and process the data
Automation Developers Forum ni.com/forum

73
A/D Sampling Rate
� Undersampling may result in the misrepresentation of the measured signal (aliasing)
� Sampling at a higher speed is advantageous� Sample at least twice as fast as the signal being measured
1 2 3 4 5 6 7 8 9 msec
500 Hz200 Hz
Aliasing is another factor to consider when measuring for the generation of analog signals with a DAQ board. It can be a common source of measurement error. Assume you measure a sine wave but you choose too slow of a sampling rate. The signal appears as a lower frequency signal.
In this example, the original sample is 500 Hz. Because the sampling rate is slower than this signal, aliasing occurs and the signal the is digitized has a frequency of only 200 Hz.
© National Instruments Corporation Automation Developers Forum
74
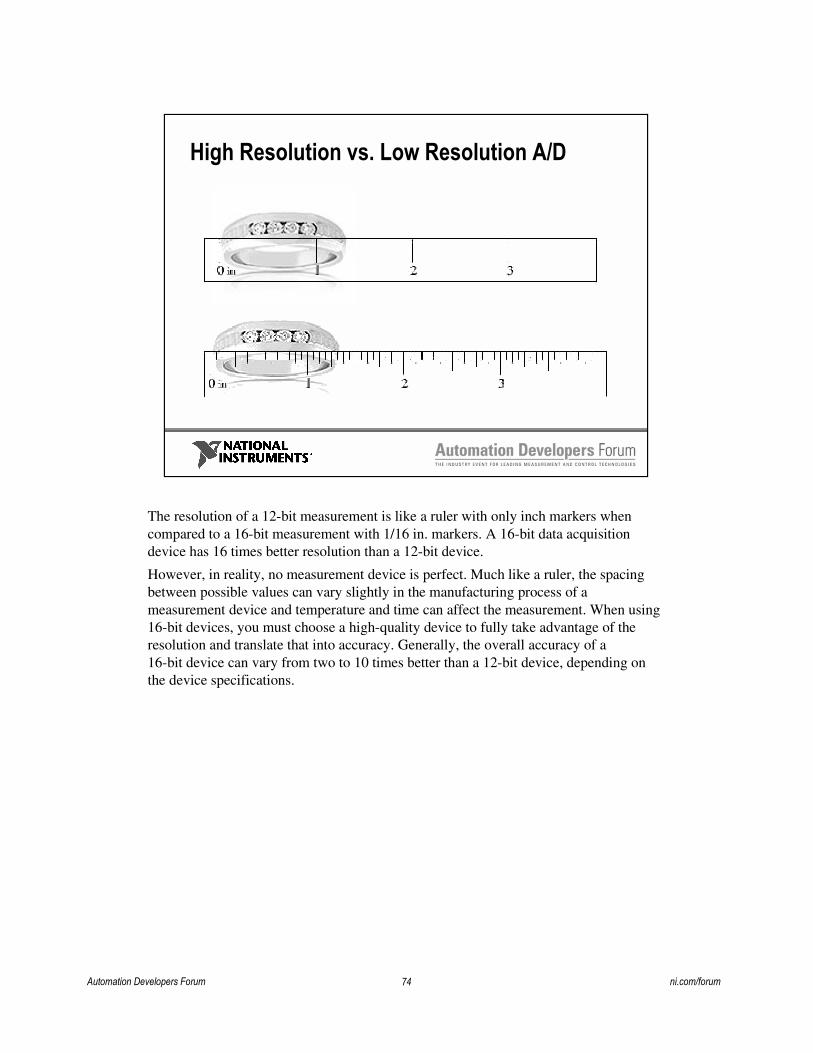
High Resolution vs. Low Resolution A/D
The resolution of a 12-bit measurement is like a ruler with only inch markers when compared to a 16-bit measurement with 1/16 in. markers. A 16-bit data acquisition device has 16 times better resolution than a 12-bit device.
However, in reality, no measurement device is perfect. Much like a ruler, the spacing between possible values can vary slightly in the manufacturing process of a measurement device and temperature and time can affect the measurement. When using 16-bit devices, you must choose a high-quality device to fully take advantage of the resolution and translate that into accuracy. Generally, the overall accuracy of a 16-bit device can vary from two to 10 times better than a 12-bit device, depending on the device specifications.
Automation Developers Forum ni.com/forum
75
Time (ms)100 200150500
0
1.25
5.00
2.50
3.75
6.25
7.50
8.75
10.00
Amplitude(Volts)
16-Bit versus 3-Bit Resolution(5 kHz Sine Wave)
16-bit
3-bit
000
001
010
011
100
101
110
111
| ||||
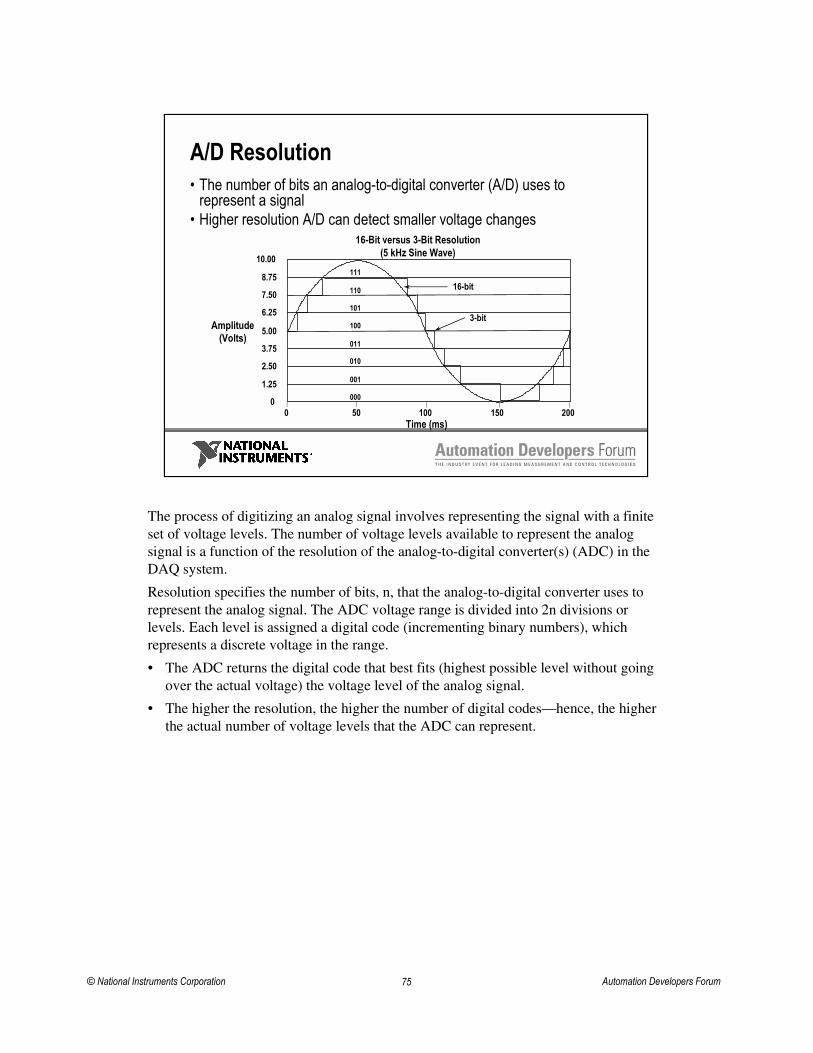
A/D Resolution� The number of bits an analog-to-digital converter (A/D) uses to
represent a signal� Higher resolution A/D can detect smaller voltage changes
The process of digitizing an analog signal involves representing the signal with a finite set of voltage levels. The number of voltage levels available to represent the analog signal is a function of the resolution of the analog-to-digital converter(s) (ADC) in the DAQ system.
Resolution specifies the number of bits, n, that the analog-to-digital converter uses to represent the analog signal. The ADC voltage range is divided into 2n divisions or levels. Each level is assigned a digital code (incrementing binary numbers), which represents a discrete voltage in the range.
• The ADC returns the digital code that best fits (highest possible level without going over the actual voltage) the voltage level of the analog signal.
• The higher the resolution, the higher the number of digital codes—hence, the higher the actual number of voltage levels that the ADC can represent.
© National Instruments Corporation Automation Developers Forum

76
PAC DAQ Software
� Components� Functionality
Software
A/D
Signal Conditioning
Transducer
The final component of a complete data acquisition system is the software. In this section we will discuss the different components in a PAC DAQ system.
Automation Developers Forum ni.com/forum

77
PAC Data Acquisition Software
Application Development Software
System ConfigurationData Scaling
Test and Troubleshooting
PAC data acquisition software provides:
• High-level hardware driver interface
• Simplified system configuration and management tools
• Data scaling into engineering units
• Minimized programming and code generation
• Test and troubleshooting tools
© National Instruments Corporation Automation Developers Forum
78
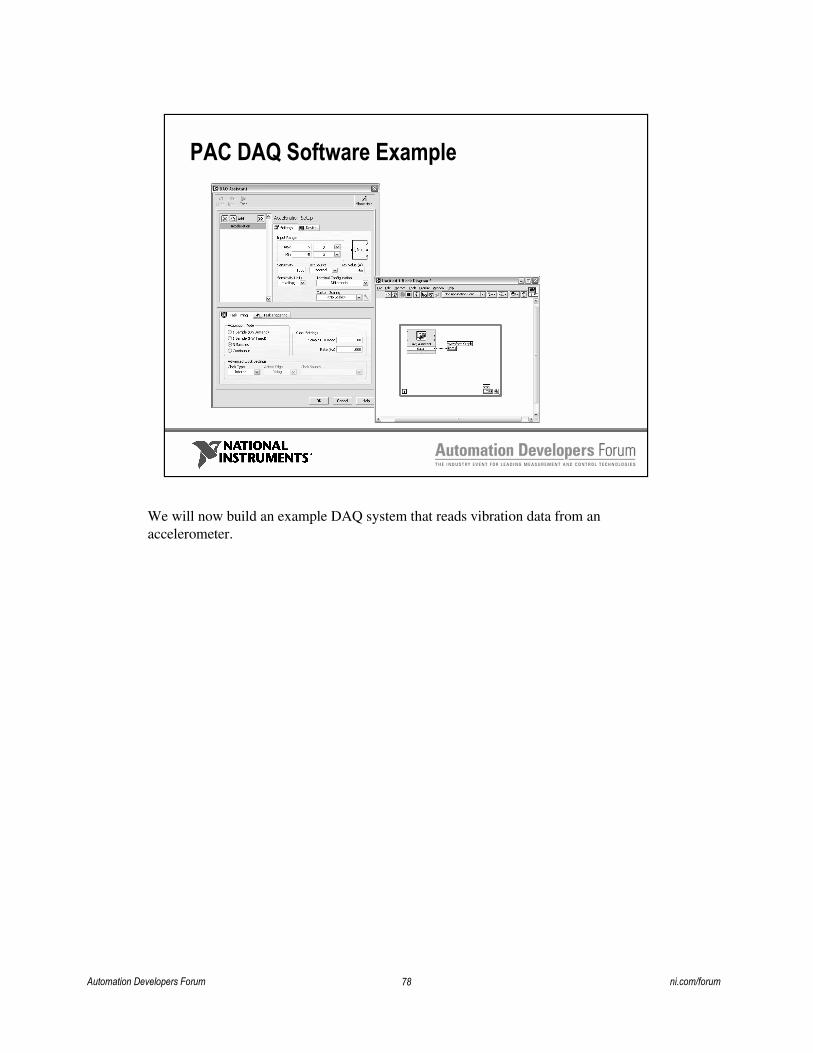
PAC DAQ Software Example
We will now build an example DAQ system that reads vibration data from an accelerometer.
Automation Developers Forum ni.com/forum

79
Flexible Open Software
Rugged Modular HardwareControllerI/O Communication
PAC � Combination of Software and Hardware
Data InterfaceControl and Analysis Functions Real-Time OS
Analog &Digital I/O
FloatingPoint
ProcessorEthernet
CustomHardware
(FPGA)
FieldbusInterfaceMotion Vision Memory Non-Vol
Storage
ControlAlgorithms
DataLogging
3rd PartyCode
SignalAnalysis HMI
I/O andSystem Timing
ExecutionPriorities
MultipleLoop
OperationEnterprise
This presentation gave you some insight into measurement and data acquisition basics. Watlow will now present the basics of sensors and explain how, through the addition of a memory device, it is possible to eliminate some of the typical problems associated with measurements.
© National Instruments Corporation Automation Developers Forum

80
Temperature Sensors: New Smart TEDS Technology
Watlow is a manufacturer of thermal products: electric heaters, temperature sensors, controllers, and thermal solutions. This is a short presentation on sensor basics and how, through the addition of a memory device, it is possible to solve the typical problems that plague measurements.
Automation Developers Forum ni.com/forum

81
Review � What are sensors?
A sensor converts a physical phenomenon into a measurable signal
SignalPhysicalPhenomenon
Sensor
In the most basic sense, the purpose of a transducer is to convert a physical phenomena (light, temperature, pressure, sound, and so on) into a measurable electrical signal, such as voltage or current.
© National Instruments Corporation Automation Developers Forum

82
Focus on Temperature Sensors
� Voltage generating� Thermocouples
� Resistive� RTD - Resistance Temperature Device� Thermistors
� Mixed mode smart sensors� Analog and digital sensor output
The most common measurement made is temperature.
Watlow manufactures temperature sensors, which are transducers that convert temperature information to voltage (in the case of thermocouples), or resistance (in the case of RTDs or thermistors). When we add a memory device to the sensor, creating a IEEE 1451.4 smart sensor, we have not changed the analog information. The thermocouples still produce voltage and the RTDs still have resistance changes. But an additional digital signal is added from the memory device, which gives what we call a mixed mode sensor since it uses both analog and digital.
Automation Developers Forum ni.com/forum

83
Thermocouples� Most common temperature sensor
� Inexpensive� Does not require excitation
� The length of the thermocouple has no effect on the output
The most common temperature sensor is a thermocouple. We will show what adding the smart Transducer Electronic Data Sheets (TEDS) can do to an RTD in a minute, but since Watlow is a leading manufacturer of thermocouples, we will mention in a little more detail some of the unique innovations adding TEDS to thermocouples can provide.
While thermocouples can be extremely sophisticated - such as in a jet engine exhaust sensor—they are typically the least expensive temperature sensor, as they make use of a very basic phenomenon. Wherever a thermal gradient appears along a circuit of two different metals (here, A and B) a (Seebeck) voltage is created. The voltage is not created at the heat sensing junction, but along the gradients in the circuits.
Because the thermocouple circuit is not “excited” like an RTD (to measure its resistance), the length of the thermocouple has no effect on the output (within practical limitations—maybe >1 mile).
© National Instruments Corporation Automation Developers Forum
84
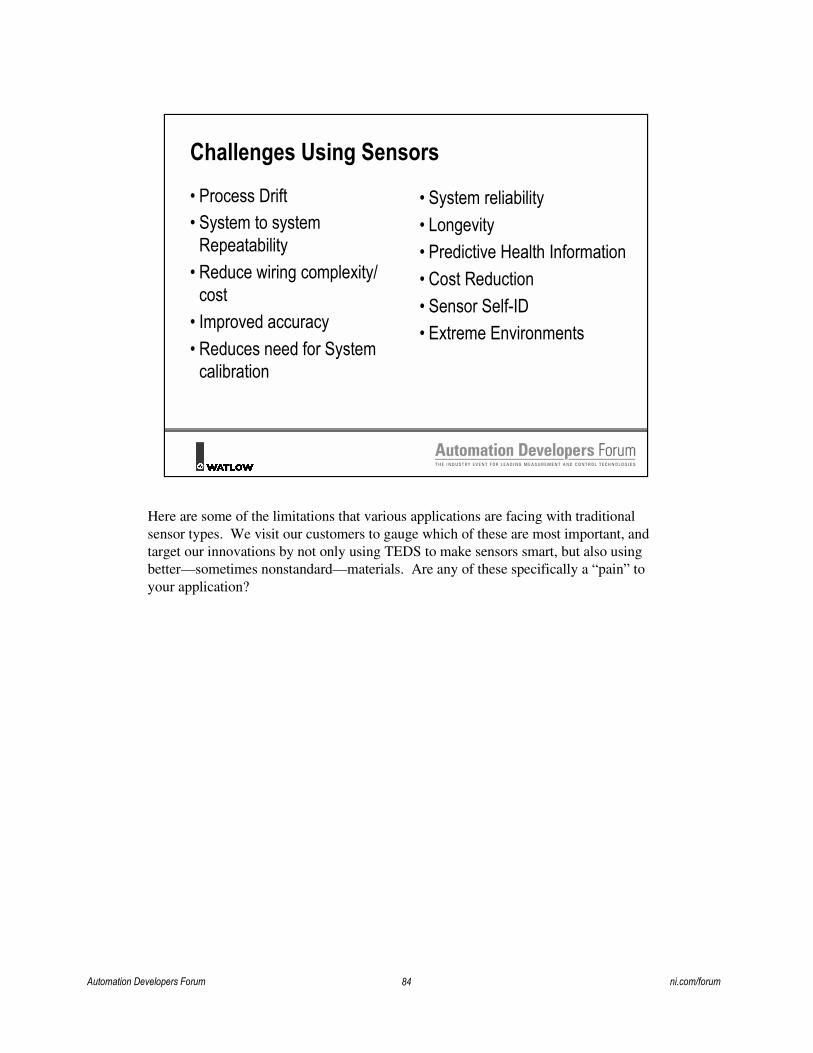
Challenges Using Sensors� Process Drift� System to system
Repeatability� Reduce wiring complexity/
cost� Improved accuracy� Reduces need for System
calibration
� System reliability� Longevity� Predictive Health Information� Cost Reduction� Sensor Self-ID� Extreme Environments
Here are some of the limitations that various applications are facing with traditional sensor types. We visit our customers to gauge which of these are most important, and target our innovations by not only using TEDS to make sensors smart, but also using better—sometimes nonstandard—materials. Are any of these specifically a “pain” to your application?
Automation Developers Forum ni.com/forum

85
New Sensor Technology
� Information is stored on sensors� Referred to as smart sensors
� Transducer Electronic Data Sheets (TEDS)� Sensitivity� Model Name� Last Calibration Date
� Defined by IEEE 1451.4 Standard
New sensor technology stores important information on the sensor. This is known as Transducer Electronic Data Sheets or TEDS. The information that is stored includes sensitivity, calibration, and model name. TEDS is defined by the IEEE 1451.4 standard.
© National Instruments Corporation Automation Developers Forum

86
IEEE 1451.4 Standard for Plug and Play Sensors
Analog Signal
VoltageResistanceTransducer
Plug and Play Sensor
Digital (TEDS)000101011111010101010010100�
� Sensor manufacturer� Model number� Serial number� Measurement range� Transfer function� Calibration info� User Info� And more
Transducer Electronic Data Sheet (TEDS)
Memory(EEPROM)
Mixed-ModeInterface
(Analog + Digital TEDS)Standardized
TEDS
This slide shows in a little more detail that when the sensor is connected to the instrumentation, it transmits its traditional analog signal (for example, voltage), as well as the TEDS information. Watlow focuses our efforts on the calibration information, as that can be very powerful for temperature sensors.
Automation Developers Forum ni.com/forum

87
Transducer Electronic Data Sheets (TEDS)
� Increased Reliability� Improved Accuracy� Reduced Set-Up Time
Here is a snapshot of what TEDS is. Within the sensor’s memory chip resides information such as who made it, when was it made, what its limitations are, calibration information, etc.
It is defined by the international 1451.4 standard, supported by National Instruments, Watlow, and the sensor partner companies.
© National Instruments Corporation Automation Developers Forum

88
Transducer Electronic Data Sheets
Current Process for Measurement System Configuration
1. Configure data acquisition hardware2. Locate sensor calibration data sheet and determine
necessary scaling input parameters3. Configure measurement system for sensor�s scaling and
calibration data
When the data is automatically transferred, not only do you avoid several manual steps, but you also sidestep opportunities for error. Today it is common to use calibration data sheets for temperature sensors, and either it is filed away somewhere and the data is not used (really only used to verify that it met “special” or “standard” limits). Or some of the data is used—perhaps what the calibration performance was at a single temperature point. But not only is that labor intensive and ripe for error, but next we will see how, due to the nature of sensor error and it’s nonlinearities, using a single point’s calibration data can do more harm than good at other temperatures.
Automation Developers Forum ni.com/forum

89
Non-noble Thermocouples (J, K)
-10
-8
-6
-4
-2
0
2
4
6
8
10
-100 0 100 200 300 400 500 600 700 800 900 1000 1100
Temp (C)
Unc
erta
inty (-) Standard Limits
(+) Standard Limits(-) Special Limits(+) Special Limits
Example: Thermocouple Uncertainty
Here is what some call the butterfly curve. It represents the tolerance “windows”of a type J or K thermocouple, either standard limits here in the blue (±2.2C or .75%, which is greater starting around 300 °C), or special limits here in yellow (±1.1 °C or .4%)
© National Instruments Corporation Automation Developers Forum

90
TEDS with Plug-and-play Smart Sensors
-10
-8
-6
-4
-2
0
2
4
6
8
10
-100 0 100 200 300 400 500 600 700 800 900 1000 1100
Temp (C)
Erro
r Ex Special Limits t/cCalc. "Error Curve"
INFOSENSE-P
Plug-and-Play
IEEE 1451.4
Perfect, error-proof transfer of calibration equation from our NIST-traceable calibration lab.
With TEDS we can describe the calibration performance with a polynomial, so we can get dead-on accuracy across the full temperature range.
Automation Developers Forum ni.com/forum

91
Calibration Information Increases Accuracy
� Smart thermocouples can now be more accurate than standard RTDs at most temperature
� Smart RTDs can achieve reference-caliber accuracy
Sensor Error
0
0.5
1
1.5
2
2.5
3
-100 0 100 200 300 400 500 600
Temperature (Deg. C)
Erro
r (D
eg. C
)
Type K Thermocouple LimitsTEDS Type K Limits
Here are the results when you compare a standard “dumb” type K thermocouple in blue, with a smart non-standard thermocouple in green. This smart thermocouple is now more accurate than standard RTDs at most temperatures.
The RTD here in pink is naturally very accurate near room temperature, but the errors that they get at other temperatures can also be calibrated out, so that a smart RTD can achieve reference-caliber accuracy.
© National Instruments Corporation Automation Developers Forum

92
0
2
4
6
8
10
12
-100 0
100
200
300
400
500
600
700
800
900
1000
1100
200 Hour DriftHomogeneity
Type K T/C - Spl LimUncertainty (SPRT)
0
2
4
6
8
10
12
-100 0
100
200
300
400
500
600
700
800
900
1000
1100
200 Hour Drift
Homogeneity
Initial Error
Uncertainty (SPRT)
Uncertainty: Type K Special Limits Uncertainty: IEEE 1451.4 WATCOUPLE
Calibration Information Increases Accuracy
Extremely accurate readings is the result of TEDS with four times the accuracy of type K special limits and three times less drift.
When we use smart TEDS, we have 4 times better initial accuracy than the type K special limits with three times less drift.
The dark blue line on the bottom is our calibration lab in both cases.
The purple represents the uncertainty of “special limits”, the tolerance that the type K was specified to. With a TEDS sensor, that tolerance window is canceled out, as the exact calibration polynomial is transferred into the instrumentation.
The yellow is uncertainty from homogeneity, which is essentially the “sloppiness” of the material. Standard thermocouple types have always had problems here—in this case around a degree with type K—while we can pick new materials that are more homogeneous here in the nonstandard smart thermocouple.
Finally, the light blue is a snapshot of 200 hours of drift, which in the type K starts as low as 300 °C. The nonstandard materials are more stable and reduce the drift by about a factor of three.
Automation Developers Forum ni.com/forum

93
Smart Temperature Sensor System� Increased accuracy & stability� Fewer probe checks, calibrations, and replacements� Tells you if the sensors are good before you start the
next process
Here is a short list of some of the benefits that Watlow is working on using TEDS technology.
© National Instruments Corporation Automation Developers Forum

94
Other TEDS Sensors
� Microphones� Accelerometers� Piezo-Electric Pressure Sensors� Thermistors� RTDs� Strain Gauges� LVDTs
TEDS is not limited to temperature, and here are some of the additional sensors.
Automation Developers Forum ni.com/forum

95
Flexible Open Software
Rugged Modular HardwareControllerI/O Communication
PAC � Combination of Software and Hardware
Data InterfaceControl and Analysis Functions Real-Time OS
Analog &Digital I/O
FloatingPoint
ProcessorEthernet
CustomHardware
(FPGA)
FieldbusInterfaceMotion Vision Memory Non-Vol
Storage
ControlAlgorithms
DataLogging
3rd PartyCode
SignalAnalysis HMI
I/O andSystem Timing
ExecutionPriorities
MultipleLoop
OperationEnterprise
Sensors are the right way of measuring physical phenomena and getting the data for the control system to know the status of the process or machine. In order to control a system though, you have to also make decisions and manipulate or physically move mechanical elements on the system. A very popular way to do this is to use air, and to explain the latest in electro-pneumatics we have Festo Corporation.
© National Instruments Corporation Automation Developers Forum

96
Pneumatics for Control and AutomationFesto Corporation
Festo is a PAC partner of NI. PAC stands for Programmable Automation Controller. It is positioned above the capabilities of standard PLC's (ie processing power), but more robust for automation than a PC. Festo pneumatics compliment the PAC line, providing pneumatic actuation in any system where there is an NI PAC.
Automation Developers Forum ni.com/forum
97
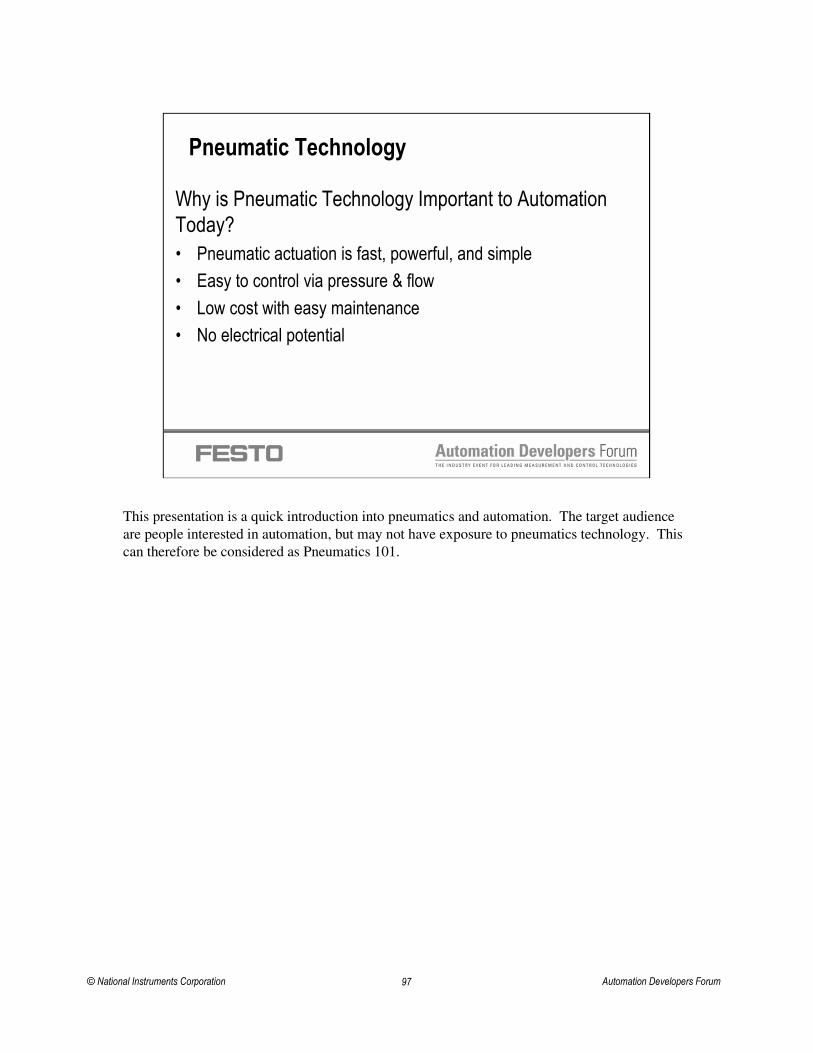
Pneumatic Technology
Why is Pneumatic Technology Important to Automation Today?� Pneumatic actuation is fast, powerful, and simple� Easy to control via pressure & flow� Low cost with easy maintenance� No electrical potential
This presentation is a quick introduction into pneumatics and automation. The target audience are people interested in automation, but may not have exposure to pneumatics technology. This can therefore be considered as Pneumatics 101.
© National Instruments Corporation Automation Developers Forum

98
Common Uses for Pneumatic Actuation
� Mainly for point to point actuation� Linear or rotary� Single or multi-axis systems� Pilot actuation of process valves� �An Actual Example�
There are many different ways of actuation for industrial automation. These can include hydraulic, pneumatic, and electric. These each have their benefits, but for most applications, pneumatics can be the easiest and least expensive to apply. Point to point, linear, rotary (under 360 deg), and pilot actuation are among the many application possible. The video shows a basic machine that is completely a sequential pneumatic application. "This is what Festo does every day".
Automation Developers Forum ni.com/forum

99
Examples for Using Pneumatic Actuation� Force vs. Velocity Example
� A 30kg mass can easily be traversed at 2m/s. The price in components for a 2 meter long system can be under $2000.
� Price vs. Performance Example� The price in components to move a 2kg mass a half meter in
one second is about $200. � Maintenance costs in all cases are very minimal, since
there are less moving parts as compared to other solutions.
There is a place for both in the world for both electric drives and pneumatics. Festo supplies both, to suit all customer needs. However, for simple actuation, pneumatics can be the most cost effective, considering components, installation, and maintenance.
These examples were considered with a Festo DGE rodless cylinder, of bore sizes up to 63mm.
© National Instruments Corporation Automation Developers Forum

100
Examples for Using Pneumatic Actuation
Hazardous Locations � Pneumatic devices (valves, actuators, logic gates, etc.) can
perform simple logic and motion in areas where a spark can causean explosion.� Chemical production� Semiconductor manufacturing� Refineries� Pulp & Paper
Since pneumatic operations are spark free, pneumatics can be applied in areas where electromechanical devices could be dangerous. This is why in many process or hybrid type applications, pneumatics are used. Pneumatics are also overload safe. There would be no extra heat generated if an actuator was blocked, as what might happen with an electric motor.
Automation Developers Forum ni.com/forum
101
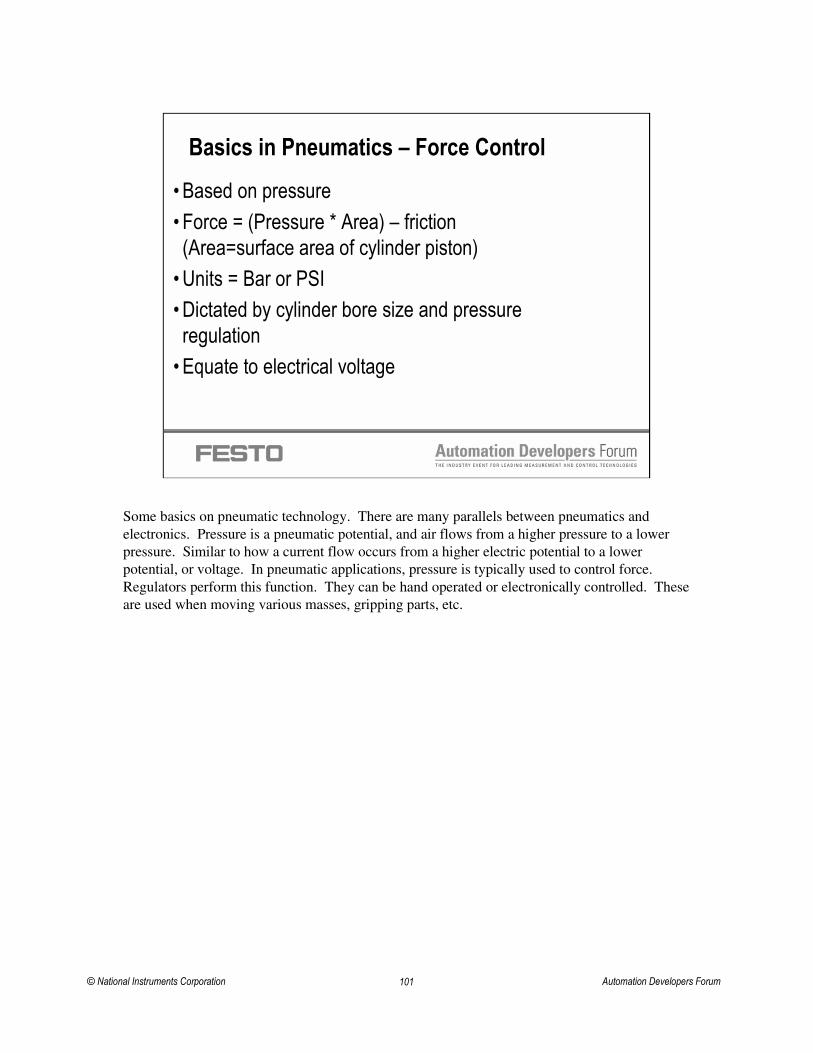
Basics in Pneumatics � Force Control� Based on pressure� Force = (Pressure * Area) � friction (Area=surface area of cylinder piston)
� Units = Bar or PSI� Dictated by cylinder bore size and pressure regulation
� Equate to electrical voltage
Some basics on pneumatic technology. There are many parallels between pneumatics and electronics. Pressure is a pneumatic potential, and air flows from a higher pressure to a lower pressure. Similar to how a current flow occurs from a higher electric potential to a lower potential, or voltage. In pneumatic applications, pressure is typically used to control force. Regulators perform this function. They can be hand operated or electronically controlled. These are used when moving various masses, gripping parts, etc.
© National Instruments Corporation Automation Developers Forum

102
Basics in Pneumatics � Speed Control� Based on flow rate� Occurs when there is a pressure differential (from higher pressure to lower pressure)
� Units = l/min or Cv (coefficient of velocity)� Dictated by orifice size (valve dimensions, tubing & fittings diameters)
� Equate to electrical current� (Cv is actually pneumatic conductance)
More basics on pneumatic technology. As mentioned previously, flow occurs from a pressure differential. In pneumatic applications, flow is typically used to control speed. Flow controls are typically hand operated, or there are electronically controlled proportional flow valves. These are useful to vary the speed of a cylinder, controlling acceleration or deceleration, etc.
Automation Developers Forum ni.com/forum

103
Basic Pneumatic Circuit
� Double acting cylinder (actuator)
� One Air piloted directional valve (driver)
� Two hand control valves (push button or switches)
50%
50%
F=0
4 2
51
3
14 12
2
1 3
2
1 3
1V1
1A1
1V2
1V3
1S1 1S2
1Z1
See FluidSim DemoPressure Regulator(Force Control ~ voltage)
Flow Control(Speed Control
~ current)
This is a completely manual pneumatic circuit. It uses 2 hand valves, which are 3 way and 2 position, or 3/2 valves. They pilot a 5/2 valve, which is driving the double acting cylinder (Double acting, since it requires air on both sides. Single acting would have one port, and a spring return.) Compared to electrical technology, the pressure regulator is the "power supply", & the flow control as similar to a "potentiometer". The air piloted valve acts as a driver, like transistor or relay.
Festo has simulation software, sold through the training division of Festo, called Festo Didactic. This software, Fluidsim, can allow the user to build and simulate a pneumatic or electro-pneumatic circuit on a PC.
© National Instruments Corporation Automation Developers Forum

104
Common Pneumatic Circuit
Pneumatic. Tubing & cylinders
Cylinder switches wired to inputs
Pneumatic Supply
National Instruments Compact Fieldpoint
Valve Terminal with Multipin connection
n
A common pneumatic circuit today includes an automation controller, like Compact Fieldpoint, with I/O connected to a pneumatic manifold. In this example, a cable with discrete wires are connected from output modules to a valve terminal with a multipin connector, which is connected to each solenoid on a valve. The manifold is supplied with compressed air, from a regulator, and internally, air is channeled to various cylinders, through valves. Sensors are on each cylinder, and cylinder position (extend or retract)is feed back to the input cards of the controller.
Automation Developers Forum ni.com/forum

105
Products Integration - Standard ValvesTypically, solenoid valves are driven by 24 Vdcoutputs � Digital output modules drive valves� Good solution for small number of individual valves, or
valve terminals (<= 24 solenoids)IC = individual connectionSeparate commons
MP = Multipin connectionShared common
Standard valves are terminated to output modules, either via individual connections or multi conductor cables. Festo solenoids typically consume 20 to 40mA, at 24vdc. Many Festo manifolds include a further current reduction circuit, which reduces heat dissipation and increases solenoid life. For standard valves, switching times can vary from 10ms on/20ms off to 12ms on/44ms off.
© National Instruments Corporation Automation Developers Forum

106
Products IntegrationFieldbus Valve Terminals
Useful for a higher number of valves (> 24 solenoids)� Ethernet or fieldbus-enabled embedded controller� Save time & costs on installation� Diagnostic data available via fieldbus � Most open protocols supported, including DeviceNet,
Profibus-DP, Ethernet (ModbusTCP, Ethernet/IP, others)
Fieldbus valve terminals can take advantage of a serial bus. National Instruments supports various industrial bus networks, that Festo manifolds can connect to. These include DeviceNet, Profibus-DP, and Modbus TCP.
Automation Developers Forum ni.com/forum

107
Fieldbus TechnologyBasic structure
[1] Tubing - supply air / exhaust air / auxiliary pilot air[2] Tubing - valve � drive[3] Wiring - voltage supply[4] Wiring - input/output modules[5] Wiring - fieldbus connection
� No individual wires to terminate or troubleshoot� IP65, no cabinet necessary
Fieldbus
5
2
4
1
3
The benefit of the fieldbus option is to reduce the wiring from I/O cards, and all associated connection points. Also, since Festo valve terminals are IP65 rated, often a cabinet is not needed. Depending on the serial bus, number of devices, etc., a latency time will be introduced, which can vary from several ms to 100+ ms. This latency time must be considered for critical applications.
© National Instruments Corporation Automation Developers Forum

108
Products IntegrationIntelligent Valve Terminals
Intelligent valve terminals offer unique opportunities for control and information� Pass control and information data to LabVIEW via OPC� Perform advanced algorithms and analysis in NI PACs� Integrated Web server, e-mail, other IT capabilities
Festo intelligent valve terminals can be configured for special applications. The sample animation showed software that used a LabVIEW function library module to create a GUI and pass data with Festo valve terminal. This can be done via a custom DLL or OPC.
The hyperlink "OPC" ran a dynamic screen view of Festo's Diagnostic SW. The screen is showing a user configuring the FDS to look at & analyze pressure fluctuation in a pneumatic sub-system. The graph first shows the sw capturing data for an optimal running system. This data is then used as a base-line for continuous operation, that is continually monitored. The user can set thresholds and alarms, based on this data.
The Festo Diagnostic Software uses NI LabVIEW modules as a front end user interface.
Automation Developers Forum ni.com/forum

109
Miniature Valves
Small Size, Low Flow (10l/min.), Low CostApplications:� Semiconductor Industry
� Gas panel pilot valves� Medical Industry
� Medical devices� Blood pressure monitor� Dialysis device� Breathing devices
� Laboratory automation equipment
MH1 is a PAC referenced product. It is highly suitable for laboratory and lab automation. These applications typically don't require high flow. Pneumatics are usually controlling tiny actuators or piloting process valves.
© National Instruments Corporation Automation Developers Forum

110
Fast Switching Valves
2ms Switching, High Repeatability, Long Life
Applications:� Electronics Industry
� Dispensing� Food Industry
� Sorting� Packaging Industry
� Gluing� Labeling
MH2 is a PAC referenced product. This valves have internal electronics that can quickly charge and drive drive the solenoid at very fast rates A unique mechanical design assures a balanced performance, so the valve is repeatable to (2ms on/ 2ms off, +/- 10%). This takes advantage of NI's PAC's high speed performance.
Automation Developers Forum ni.com/forum
111
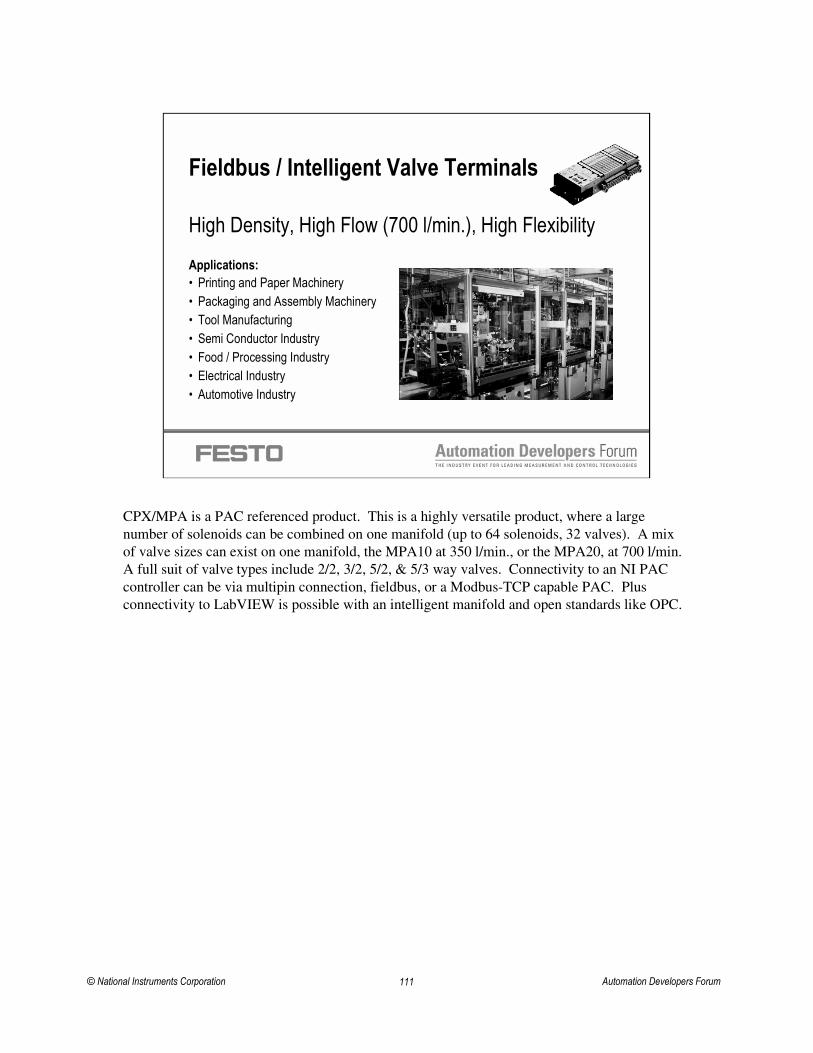
Fieldbus / Intelligent Valve Terminals
High Density, High Flow (700 l/min.), High FlexibilityApplications:� Printing and Paper Machinery� Packaging and Assembly Machinery� Tool Manufacturing� Semi Conductor Industry� Food / Processing Industry� Electrical Industry� Automotive Industry
CPX/MPA is a PAC referenced product. This is a highly versatile product, where a large number of solenoids can be combined on one manifold (up to 64 solenoids, 32 valves). A mix of valve sizes can exist on one manifold, the MPA10 at 350 l/min., or the MPA20, at 700 l/min. A full suit of valve types include 2/2, 3/2, 5/2, & 5/3 way valves. Connectivity to an NI PAC controller can be via multipin connection, fieldbus, or a Modbus-TCP capable PAC. Plus connectivity to LabVIEW is possible with an intelligent manifold and open standards like OPC.
© National Instruments Corporation Automation Developers Forum

112
See in Action
� Actual Festo + NI PAC demo� Festo valve terminals controlled by
� Compact FieldPoint I/O cFP-2020 with Modbus TCP for CPX Valve Terminal
� I/O module cFP-DO-410 for MH2 valves� Valves driving various pneumatic actuators and indicators
� Contact Festo at 1-800-99-FESTO anywhere in the US, or go to www.festo.com
Automation Developers Forum ni.com/forum

113
Flexible Open Software
Rugged Modular HardwareControllerI/O Communication
PAC � Combination of Software and Hardware
Data InterfaceControl and Analysis Functions Real-Time OS
Analog &Digital I/O
FloatingPoint
ProcessorEthernet
CustomHardware
(FPGA)
FieldbusInterfaceMotion Vision Memory Non-Vol
Storage
ControlAlgorithms
DataLogging
3rd PartyCode
SignalAnalysis HMI
I/O andSystem Timing
ExecutionPriorities
MultipleLoop
OperationEnterprise
You just learned how to get data into your system. The data however, is not as important as what you do with it. For example, you could use valuable information from your system or machine to predict any malfunctions and problems, and take proactive actions to extend the life of that system. Here is National Instruments to talk to us more about machine condition monitoring.
© National Instruments Corporation Automation Developers Forum

114
Incorporating Predictive Maintenance into Machine Control Systems
A PAC application for high performance data acquisition
Automation Developers Forum ni.com/forum

115
PAC Data Acquisition System Implementation
Software
A/D
Signal Conditioning
Transducer
FFT
24-bit
IEPE
Accelerometer
MachineConditionMonitoring
The components of a machine condition monitoring system parallel the components of a PAC data acquisition system.
© National Instruments Corporation Automation Developers Forum
116
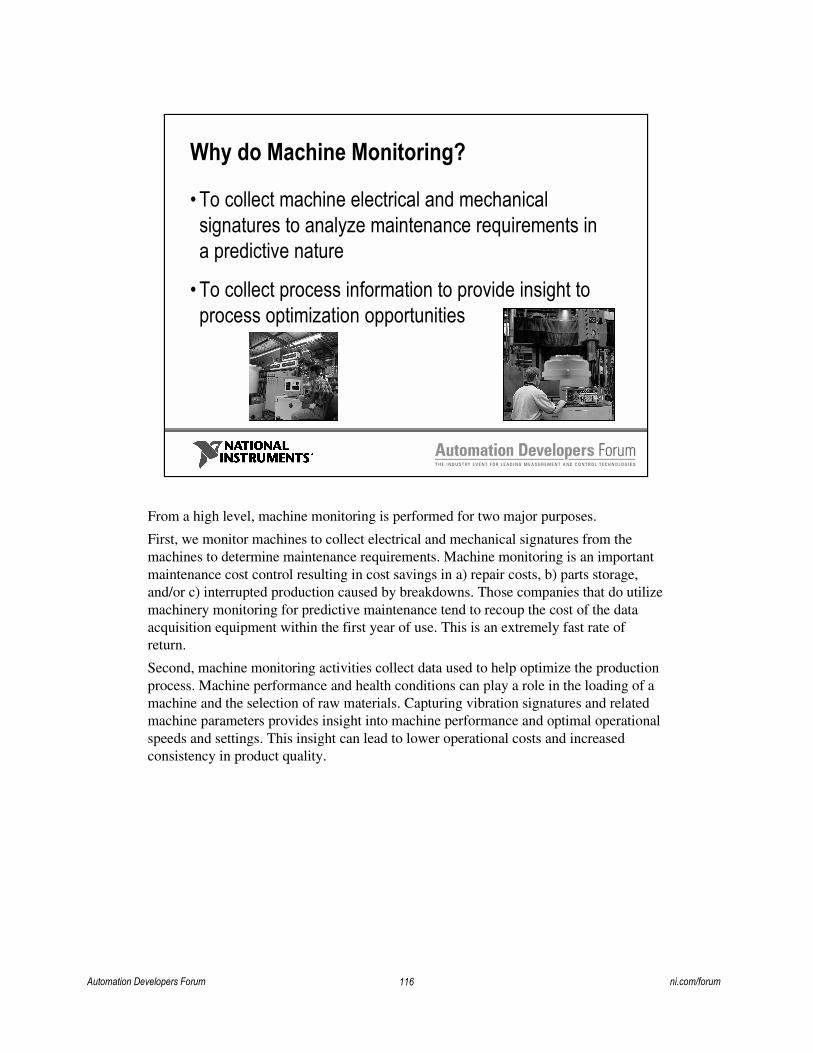
Why do Machine Monitoring?
� To collect machine electrical and mechanical signatures to analyze maintenance requirements in a predictive nature
� To collect process information to provide insight to process optimization opportunities
From a high level, machine monitoring is performed for two major purposes.
First, we monitor machines to collect electrical and mechanical signatures from the machines to determine maintenance requirements. Machine monitoring is an important maintenance cost control resulting in cost savings in a) repair costs, b) parts storage, and/or c) interrupted production caused by breakdowns. Those companies that do utilize machinery monitoring for predictive maintenance tend to recoup the cost of the data acquisition equipment within the first year of use. This is an extremely fast rate of return.
Second, machine monitoring activities collect data used to help optimize the production process. Machine performance and health conditions can play a role in the loading of a machine and the selection of raw materials. Capturing vibration signatures and related machine parameters provides insight into machine performance and optimal operational speeds and settings. This insight can lead to lower operational costs and increased consistency in product quality.
Automation Developers Forum ni.com/forum

117
Machine Components � Vibration Sources
Slot Frequency/ EM related
Motor
Couplings
Gears
Journal (Fluid Film) Bearings
Blade Pass/ Fluid Related
Rolling ElementBearings
Alignment
Unbalance
MechanicalResonances
Bent ShaftLoose Mechanical
Components
Let’s consider some vibration sources of a generic operating machine. Some vibration sources are caused by machine design: slot frequency/EM related, gears, coupling, mechanical resonance, and bearings are some examples. Other sources result from potential problems: mechanical looseness, unbalance, and alignment. All these vibration sources combine to create a measurable vibration signal.
© National Instruments Corporation Automation Developers Forum

118
PAC Data Acquisition Implementation
Software
A/D
Signal Conditioning
Transducer
FFT
24-bit
IEPE
Accelerometer
MachineConditionMonitoring
Automation Developers Forum ni.com/forum

119
Transducers for Machine Monitoring
� Accelerometers� Wide signal range and bandwidth� Very rugged � Built-in microelectronics� Direct connection to PACs
� Velocity Probes� Displacement/Proximity Probes� Tachometers
Accelerometers join velocity probes, displacement probes, and tachometers as common transducers useful for dynamic signal acquisition for machine-condition monitoring.
Accelerometers prove useful for many reasons. They are rugged, have a wide frequency range, and often include built-in signal conditioning. Further, you can process an acceleration signal and convert it to displacement or velocity. On the down side, accelerometers can have poor low-frequency response, limited operating temperature range, and are sensitive to mounting techniques.
Proximity probes or displacement probes often employ an eddy current non-contact sensing technique and are used to measure shaft vibration. The proximity probe measures the distance from the tip of the probe to the surface of a metallic shaft.
© National Instruments Corporation Automation Developers Forum

120
PAC Data Acquisition Implementation
Software
A/D
Signal Conditioning
Transducer
FFT
24-bit
IEPE
Accelerometer
MachineConditionMonitoring
Automation Developers Forum ni.com/forum

121
Signal Conditioning for Machine Monitoring
� IEPE: Integrated Electronic Piezo-Electric� For accelerometers� Simple constant current signal conditioner
(18�30 VDC, 2�4 mA)� Built into PACs for direct connection
� Anti-aliasing Filters� Removes frequencies beyond the A/D range� Must be performed before signal is digitized
IEPE signal conditioning provides a constant-current source to power internally amplified sensors. All major accelerometer suppliers have their own equivalent solution, such as Isotron from Endevco, DeltaTron from Brüel & Kjaer, and Piezotron from Kistler.
The major advantage of the IEPE accelerometer is that it is simple and easy to use because of the built-in microelectronics and the simple conditioner required.
Limitations include a limited temperature range—especially for high temperatures --and a fixed sensitivity.
© National Instruments Corporation Automation Developers Forum

122
PAC Data Acquisition Implementation
Software
A/D
Signal Conditioning
Transducer
FFT
24-bit
IEPE
Accelerometer
MachineConditionMonitoring
Automation Developers Forum ni.com/forum

123
24-Bit A/D for Machine Monitoring
12 bits
16 bits24 bits
High-resolution is key to detecting very small changes in vibration
With a high resolution, you can measure small signal changes in your vibration system. This capability ensures that you do not miss low amplitude components that are sometimes the key to a successful analysis.
© National Instruments Corporation Automation Developers Forum

124
High Speed A/D for Machine Monitoring
� Signal bandwidth: 0 to 45 kHz� System sampling rate: 100 kS/s
Analyze and process signal components at 5,000 Hz and
above
The high speed A/D can also digitize signal components for analysis up to 45 kHz.
Automation Developers Forum ni.com/forum

125
PAC Data Acquisition Implementation
Software
A/D
Signal Conditioning
Transducer
FFT
24-bit
IEPE
Accelerometer
MachineConditionMonitoring
© National Instruments Corporation Automation Developers Forum

126
Time Data Processing � RMS and Limit Test
� RMS average of instantaneous vibration signal
� �Pass� and �Fail� regions for the waveform at a set limit or mask
Upper Limit
Lower Limit
RMS Average
In the simplest machine condition monitoring, an average vibration level is often computed over time. This value is then monitored to see if it goes through set limits.
Automation Developers Forum ni.com/forum

127
Frequency Data Analysis: Imbalance
� Strong component at 1X order� Amplitude increases with speed
� With phase information and trial masses: balancing 1x
2x3x
Orders
Force
Shaft CenterlineCenter of Gravity
Imbalance—center of gravity when looking down a shaft is offset from the center of the shaft.
© National Instruments Corporation Automation Developers Forum

128
Diagnose Failures with Order Analysis
Frequency Possible Cause>0.5 X rpm Oil Whirl1 X rpm Imbalance2 X rpm Loose bolts, parts1,2,3,4 X rpm Misalignment1,2,3 X power frequency Ground Loop1 X # of gear teeth Gear Tooth problems
Order analysis consists of examining components of the order domain.
The idea is that some change occurs in the order domain when a problem is imminent. Troubleshooting consists of examining the various orders for indicators. It is as much art as science, as each problem can impart different signatures. For instance, an imbalance often results in a change in magnitude of the first order. Uneven gear tooth spacing can show up as a modulation of the order associated with the number of teeth on the gear.
Automation Developers Forum ni.com/forum

129
24-Bit Vibration Signal Acquisition
Machine Condition Monitoring Demo
Application DevelopmentAnalysis Tools
Motor
Accelerometer
© National Instruments Corporation Automation Developers Forum

130
Flexible Open Software
Rugged Modular HardwareControllerI/O Communication
PAC � Combination of Software and Hardware
Data InterfaceControl and Analysis Functions Real-Time OS
Analog &Digital I/O
FloatingPoint
ProcessorEthernet
CustomHardware
(FPGA)
FieldbusInterfaceMotion Vision Memory Non-Vol
Storage
ControlAlgorithms
DataLogging
3rd PartyCode
SignalAnalysis HMI
I/O andSystem Timing
ExecutionPriorities
MultipleLoop
OperationEnterprise
During the next half hour we are going to explore the area of machine vision. Over the last five years, or so, machine vision has come a long way. What was once an expensive, buggy luxury on the factory floor has now become a necessity for quality control and product verification. Machine vision systems are now powerful, consistent, easy to use, and much less expensive.
National Instruments will share with us some typical machine vision applications and to show us how machine vision is added to a programmable automation controller. FLIR Systems, the global leader in infrared camera technology, will talk about how infrared technology can improve product quality in an industrial automation environment.
Automation Developers Forum ni.com/forum