daq technology outlook 2013
TRANSCRIPT

Data Acquisition Technology Outlook 2013Key software and hardware technology trends impacting the data acquisition market.
A Glimpse Into the Future of Data Acquisition
With more than 35,000 companies around the world using NI tools, National Instruments has been leading the data acquisition market for over 30 years with innovative software and hardware technologies for building data acquisition systems. Additionally, NI works closely with leading technology providers such as Amazon Web Services, Analog Devices, Intel, Microsoft, and Texas Instruments to ensure that NI data acquisition products leverage the latest and greatest technologies. Using this ecosystem of customers and partners, NI created this outlook to highlight some of the most pressing trends and challenges engineers building data acquisition systems face.

NI.COM/DAQ-TRENDS 3
Contents
Big Analog Data™ and Data AcquisitionDifferentiation is no longer about who can collect the most data; it’s about who can quickly make sense of the data they collect.
Moore’s Law at Work in Data LoggingWith our digital world growing more complex, the systems recording the physical and electrical phenomena of today and tomorrow need to meet new data acquisition and logging challenges.
Emerging Bus TechnologiesNew bus technologies are poised to evolve data acquisition systems and address the challenges of future measurement applications.
Mobile Technology’s Influence on Data AcquisitionMobile access to measurement applications is no longer a nice addition; it is an expectation.

Big Analog Data™ and Data AcquisitionDifferentiation is no longer about who can collect the most data; it’s about who can quickly make sense of the data they collect.
There was once a time when hardware sampling rates, limited by the speed at which analog-to-digital (A/D) conversion took place, physically restricted how much data was acquired. But today, hardware vendors have accelerated data collection rates so quickly and enabled engineers and scientists to break through rate and resolution barriers so rapidly that they have ultimately triggered a new wave of data consequences. Simply put, hardware is no longer the limiting factor in acquisition applications; the management of acquired data is the challenge of the future.
Advancements in computing technology—including increasing microprocessor speed and hard drive storage capacity—combined with decreasing costs for hardware and software have provoked an explosion of data coming in at a blistering pace. In test and measurement applications in particular, engineers and scientists can collect vast amounts of data every second of every day. For every second that the Large Hadron Collider at CERN runs an experiment, the instrument generates 40 terabytes of data. For every 30 minutes that a Boeing jet engine runs, the system creates 10 terabytes of operations information. For a single journey across the Atlantic Ocean, a four-engine jumbo jet can create 640 terabytes of data. Multiply that by the more than 25,000 flights flown each day, and you get an
understanding of the enormous amount of data being generated (Gantz, 2011). That’s “big data.”
The technology research firm IDC recently performed a study on digital data, which includes the world’s measurement files, video, music files, and so on. This study estimates that the amount of data available is doubling every two years. The fact that data production is doubling every two years mimics one of electronics’ most famous laws: Moore’s law. In 1965, Gordon Moore stated that the number of transistors on an IC doubled approximately every two years and he expected the trend to continue “for at least 10 years.” Forty-eight years later, Moore’s law still influences many aspects of IT and electronics. If the production of digital data continues to mimic Moore’s law, success as an organization will hinge on the speed at which acquired data can be turned into useful knowledge.
The big data phenomenon adds new challenges to data analysis, search, integration, reporting, and system maintenance that must be met to keep pace with the exponential growth of data.
The sources of data are many. However, among the most interesting to the engineer and scientist is data derived

NI.COM/DAQ-TRENDS 5
from the physical world. This is analog data that is captured and digitized; thus, it can be called “Big Analog Data™.” It is collected from measurements of vibration, RF signals, temperature, pressure, sound, image, light, magnetism, voltage, and so on. Challenges unique to Big Analog Data™ have provoked three technology trends in the widespread field of data acquisition.
CONTEXTUAL DATA MININGThe physical characteristics of some real-world phenomena prevent information from being gleaned unless acquisition rates are high enough, which makes small data sets an impossibility. Even when the
characteristics of the measured phenomena allow more information gathering, small data sets often limit the accuracy of conclusions and predictions in the first place. Consider a gold mine where only 20 percent of the gold is visible; the remaining 80 percent is in the dirt where you can’t see it. Mining is required to realize the full value of the contents of the mine. This leads to the term “digital dirt,” meaning digitized data can have concealed value. Hence, data analytics and data mining are required to achieve new insights that have never before been seen.
Data mining is the practice of using the contextual information saved along with data to search through
Acquisition and AnalysisSensors Local, Remote, or Cloud
Visualization
Analog Data SourcesIT Infrastructures/
Big Data Analytics/MiningDistributed Acquisition
and Analysis Nodes (DAANs)
� A generalized three-tiered solution to Big Analog Data™ challenges includes sensors or actuators, distributed acquisition and analysis nodes, and IT infrastructure or big data analytics/mining.

and pare down large data sets into more manageable, applicable volumes. By storing raw data alongside its original context, or “metadata,” it becomes easier to accumulate, locate, and later manipulate and understand. For example, examine a series of seemingly random integers: 5126838937. At first glance, it is impossible to make sense of this raw information. However, when given context—(512) 683-8937—the data is much easier to recognize and interpret as a phone number. Descriptive information about measurement data context provides the same benefits, and can detail anything from sensor type, manufacturer, or calibration date for a given measurement channel to revision, designer, or model number for an overall component under test. In fact, the more context that is stored with raw data, the more effectively that data can be traced throughout the design life cycle, searched for or located, and correlated with other measurements in the future by dedicated data post-processing software.
INTELLIGENT DAQ NODESData acquisition applications are incredibly diverse, but across a wide variety of industries and applications, data is rarely acquired simply for the sake of acquiring it. Engineers and scientists invest critical resources into building advanced acquisition systems, but the raw data produced by those systems is not the end game; instead, raw data is collected so that it can be used as an input to analysis or processing algorithms that lead to the actual results system designers seek. For example, automotive crash tests can collect gigabytes of data in a few tenths of a second that represent speeds, temperatures, forces of impact, and acceleration. But one of the key pieces of pertinent knowledge that can be computed from this raw data is the Head Injury Criterion (HIC)—a single scalar, calculated value representing the likelihood of a crash dummy to experience a head injury in the crash.
Additionally, some applications—particularly in the environmental, structural, or machine condition monitoring spaces—avail themselves to periodic, slow acquisition rates that can be drastically increased in bursts when a noteworthy condition is detected. This technique keeps acquisition speeds low and keeps logged data to a minimum while allowing sampling rates that are adequate enough for high-speed waveforms when necessary in these applications.
To incorporate tactics such as processing raw data into results or adjusting measurement details when certain criteria are met, you must integrate intelligence into the DAQ system.
Though it’s common to stream test data to a host PC (the “intelligence”) over standard buses like USB and Ethernet, high-channel-count measurements with fast sampling rates can easily overload the communication bus. An alternative approach is to store data locally and transfer files for post-processing after a test is run, which increases the time it takes to realize valuable results. To overcome these challenges, the latest measurement systems integrate leading technology from ARM, Intel, and Xilinx to offer increased performance and processing capabilities as well as off-the-shelf storage components to provide high-throughput streaming to disk. With onboard processors, the intelligence of measurement systems has become more decentralized by having processing elements closer to the sensor and the measurement itself. Modern data acquisition hardware includes high-performance multicore processors that can run acquisition software and processing-intensive analysis algorithms inline with the measurements. These intelligent measurement systems can analyze and deliver results more quickly without waiting for large amounts of data to transfer—or without having to log it in the first place—which optimizes the system to use disk space more efficiently.

NI.COM/DAQ-TRENDS 7
The unification of DAQ hardware and onboard intelligence has enabled systems to be increasingly embedded or remote and, in many industries, has paved the way for entirely new applications. As a result, the Internet of Things is finally unfolding before our very eyes as the physical world is embedded with intelligence and humans are now able to collect data sets about virtually any environment around them. The ability to process and analyze these new data sets about the physical world will have profound effects across a massive array of industries. From health care to energy generation, from transportation to fitness equipment, and from building automation to insurance, the possibilities are virtually endless.
In most of the industries described above, content (or the data collected) is not the problem. There are plenty of smart people collecting lots of useful data out there. To date this has mainly been an IT problem. The Internet of Things is generating massive amounts of data from remote, field-based equipment spread literally across the world and sometimes in the most remote and inhospitable environments. These distributed acquisition and analysis nodes (DAANs) embedded in other end products are effectively computer systems with software drivers and images that often connect to several computer networks in parallel. They form some of the most complex distributed systems and generate some of the largest data sets the world has ever seen. These systems need: 1) remote network-based systems management tools to automate the configurations, maintenance, and upgrades of the DAANs and 2) a way to efficiently and cost-effectively process all of that data.
Complicating matters is that if you reduce the traditional IT topology for most of the organizations collecting such data to a simple form, you find they are actually running two parallel networks of distributed systems: “the embedded network” that is connected to all of the field devices (DAANs) collecting the data and “the traditional IT network” where the most useful data analysis is implemented and distributed to users. And more often than not, there is a massive fracture between these two parallel networks within organizations and they are incapable of interoperating. This means that the data sets cannot get to the point(s) where they are most useful. Think of the power an oil and gas company could achieve by collecting real-time data on the amount of oil coming out of the ground and running through a pipeline in Alaska and then being able to get that data to the
accounting department, the purchasing department, the logistics department, or the financial department—all located in Houston—within minutes or hours instead of days or months.
The existence of parallel networks within organizations and the major investment made in them have been major inhibitors for the Internet of Things in the past. However, today cloud storage, cloud computational power, and cloud-based “big data” tools have met these challenges.
It is simple to use cloud storage and cloud computing resources to create a single aggregation point for data coming in from a large number of embedded devices (for example the DAANs) and provide access to that data from any group within the organization. This solves the problem of the two parallel embedded and IT networks that don’t interoperate. Placing near infinite storage and computing resources from the cloud that are used and billed on-demand at the fingertips of users provides solutions to the challenges of distributed system management and crunching huge data sets of acquired measurement data. Finally, big data tool suites offered by cloud providers make it easy to ingest and make sense of these huge measurement data sets.
To summarize, cloud technologies offer three broad benefits for distributed system management and data access:
1. Aggregation of data: If the distance between elements of your system is measured in kilometers as opposed to millimeters, you may want to consider cloud data storage. For example, if you are monitoring the condition of each of the gear boxes in a wind farm with hundreds of turbines, collecting data can become extremely costly and cumbersome. With cloud storage, such systems can store data in a common location so that you can easily collect, analyze, and compare it.
2. Access to data: In some cases, the embedded data acquisition or monitoring system that you are designing is difficult to access physically. For example, if you are monitoring the health of a pipeline in a remote stretch of Alaska, you would ideally not need to send a technician to log the information and check the status of the system. If that data is being stored to the cloud, you can access it from anywhere, including connected PCs and mobile devices.
3. Offloading: The near infinite computing resources in the cloud provide an opportunity for software to offload computationally heavy tasks. These can be sophisticated image or signal processing or even compilation and development.
Matt Wood, Senior Manager and Principal Data Scientist, Amazon Web Services
The Rise of Cloud Storage and Computing

Moore’s Law at Work in Data LoggingWith our digital world growing more complex, the systems recording the physical and electrical phenomena of today and tomorrow need to meet new data acquisition and logging challenges.
Engineers and scientists have long been monitoring and recording the physical and electrical world. The first data recording system, the telegraph, was invented in the mid-19th century by Samuel Morse. That system automatically recorded the dots and dashes of Morse code, which were inscribed on paper tape by a pen moved by an electromagnet. In the early 20th century, the first chart recorder was built for environmental monitoring. These early chart recorders, which were completely analog and largely mechanical, dragged an ink pen over paper to record changes in electrical signals. The space program then created digital, high-speed data acquisition systems for both analog and digital data.
With our digital world growing more complex, the systems recording the physical and electrical phenomena of today and tomorrow need to meet new data acquisition and logging challenges. Today, chart recorders and data-logging systems largely lack paper and are predominantly digital including digital processors, memory, and communications to link them to the ever-connected world. Over the past decade, digital storage has increased almost exponentially while the corresponding cost has plummeted. As Moore’s law continues to progress, creating more powerful, less expensive, and smaller processors that use less energy, future data acquisition and logging systems will leverage this technology to grow more intelligent and feature-rich.
THE NEXT GENERATION OF DATA-LOGGING SYSTEMSOver the past two decades, the intelligence of data-logging systems has become more decentralized, with processing elements moving closer to the sensor and signal. Because of this change, remote DAQ systems and loggers are more integrated into the decision-making process as compared to just collecting data like they’ve done in the past.
There are many examples of high-performance logging systems that integrate the latest silicon and IP from companies like ARM, Intel, and Xilinx. A majority of the systems leverage a processor-only architecture while some systems incorporate a heterogeneous computing architecture that combines a processor with programmable logic. Examples of high-performance data-logging systems on the market today are:
●● Stand-alone NI CompactDAQ●● NI CompactRIO●● HBM QuantumX CX22W●● Yokogawa WE7000●● Graphtec GL900
There are many scenarios within data-logging applications where more intelligence is important. Within asset and structural monitoring applications, traditional data-logging systems just log every data point to disk, even when nothing substantial with the physical phenomenon being measured is happening. This results in megabytes and potentially gigabytes of data that need to be analyzed and sifted through offline. With more intelligence, systems can instead be monitoring a machine or structure continuously and quickly adapt when certain conditions are met. For instance, a system could be slowly monitoring the acceleration or load of a structure and continuously overwriting data being stored to disk, waiting for a trigger condition to be met. Once the condition is met, the system could alter its own behavior such as sampling at a higher rate for a short period of time along with making sure that data logged before and after the trigger event is not lost. Additionally, with more processing power, signal processing functionality can be embedded in the
NI.COM/DAQ-TRENDS 9
data-logging system itself on multicore processors or programmable logic. These more advanced systems can analyze the data inline and, in turn, deliver more meaningful results faster, which eliminates the need to wastefully transfer or store large amounts of data.
With data-logging systems featuring more intelligence and processing, the software they are running will be a primary way for vendors to differentiate themselves. Traditional data-logging software consists of turnkey tools that engineers use to configure the system and get to the measurements quickly, like HBM’s Catman or Yokogawa’s DAQLOGGER. The downside of turnkey tools is that they
tend to be less flexible; what you see is what you get. On the other end of the spectrum, engineers and scientists can take advantage of a text-based programming tool like Microsoft Visual Studio or a graphical programming approach like NI LabVIEW system design software to program the processors within these systems. Programming tools offer the most customization for these data-logging systems, including a wider range of signal processing and the ability to embed any type of intelligence, but they have a steeper learning curve compared to turnkey tools. The table on page 11 illustrates some future capabilities of high-performance data-logging systems based on Moore’s law and advancements in processing technologies.
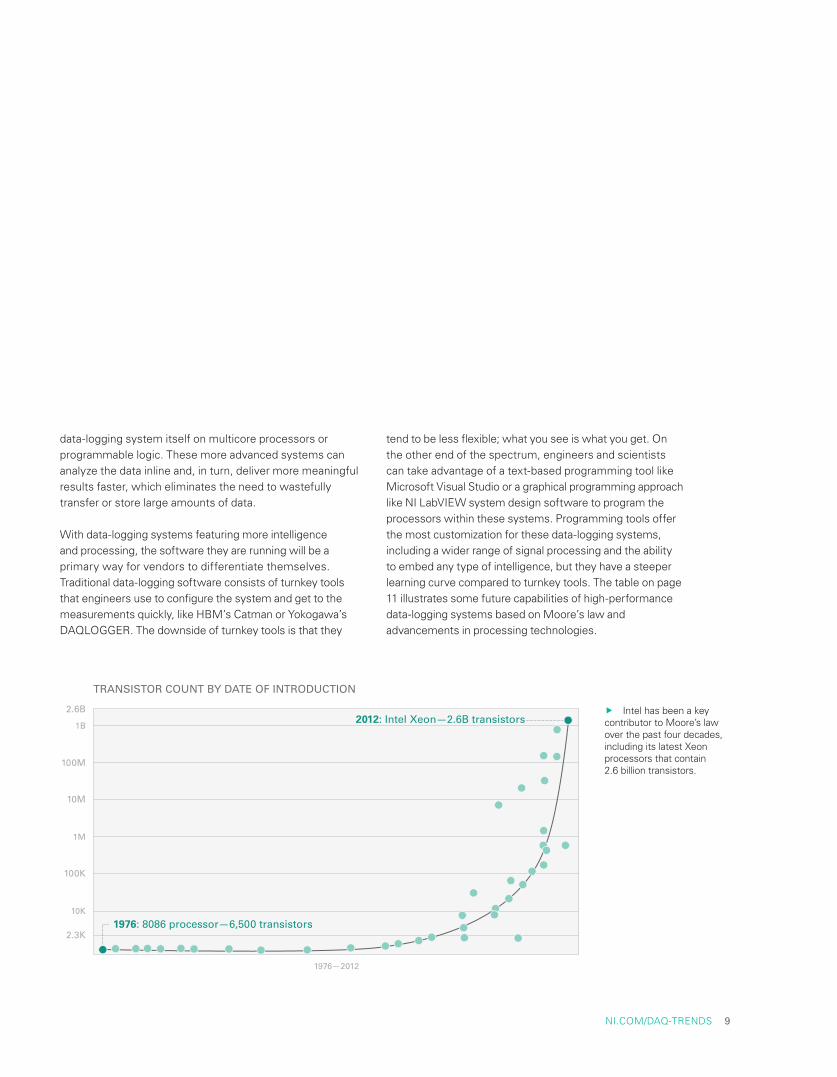
� Intel has been a key contributor to Moore’s law over the past four decades, including its latest Xeon processors that contain 2.6 billion transistors.
1976—2012
TRANSISTOR COUNT BY DATE OF INTRODUCTION
2.3K
10K
100K
1M
10M
100M
1B
2.6B2012: Intel Xeon—2.6B transistors
1976: 8086 processor—6,500 transistors

APPLICATIONS PUSHING THE LIMITS OF LOGGING SYSTEMSA variety of applications and industries have a need for more intelligence in their data-logging systems. Industries such as automotive, transportation, and the electric utility are already using high-performance data-logging systems.
AUTOMOTIVE AND TRANSPORTATIONVehicles being designed today include thousands of sensors and processors and millions of lines of code. With more intelligent vehicles come more parameters, both physical and electrical, to test and monitor. In addition, test engineers require the logging systems to be intelligent and rugged enough to use within the vehicles they’re testing. For instance, engineers at Integrated Test & Measurement (ITM) in the United States needed a high-performance and flexible in-vehicle test solution to determine the vibration levels of an on-highway vocational vehicle’s exhaust system during operation. They built a high-speed vibration logging solution that provided a wireless interface from a laptop or mobile device with the stand-alone NI CompactDAQ system programmed with LabVIEW system design software. The high-performance 1.33 GHz dual-core Core i7 Intel processor within the stand-alone NI CompactDAQ system enabled advanced capabilities such as advanced signal processing, high-speed streaming at over 6 MB/s to nonvolatile storage for all 28 simultaneously sampled accelerometer inputs, and Wi-Fi connectivity. In addition, with the latest version of the Data Dashboard for LabVIEW, engineers at ITM now have the ability to build a custom user interface and directly interact and control their vibration logging system on an iPad.
ELECTRICAL GRIDAnother industry pushing the limits of traditional data-logging systems is the utility industry. The electrical grid is changing greatly and the utility industry is investing a lot of resources to make it smarter. One way the grid is getting smarter is through the integration of more measurement systems and devices. One such device is a power quality analyzer. A typical power quality analyzer acquires and analyzes three voltages of the power network to calculate voltage quality defined in international standards. Voltage quality is described by frequency, voltage level variation, flicker, three-phase system unbalance, harmonic spectra, total harmonic distortion, and signaling voltages level. With the amount of analysis and high-speed measurements required within this application, a traditional logging system would not provide the horsepower needed. Engineers at ELCOM in India used LabVIEW and CompactRIO, an embedded acquisition system featuring an embedded processor and an FPGA, to create a flexible, high-performance power quality analyzer. Within this system, the processor was used for tasks such as advanced floating-point processing, high-speed streaming to disk, and network connectivity. The FPGA within CompactRIO allowed for an additional processing unit within the system and performed custom I/O timing and synchronization and any high-speed digital processing needed within the application.
FUTURE LOGGING SYSTEMS NEED TO BE SMARTERAs the world we live in becomes more complex, the systems monitoring and logging electrical and physical data from future machines, infrastructure, the grid, and vehicles need to keep up. The silicon and IP vendors seem to be doing their job by improving the performance, power, and cost of processing components. Now it’s up to the data acquisition companies to follow suit with higher performance logging systems that are intuitive, flexible, and smart enough to capture any and all types of data. With smarter data-logging systems, we should be able to get more intelligent data from any source and improve the performance, quality, and maintenance of the systems being built.
We foresee the need for DAQ systems that not only acquire data over a network, server, or PCs but also provide intelligence to help with the decision-making process. � Mariano Kimbara, Senior Research Analyst, Frost & Sullivan

NI.COM/DAQ-TRENDS 11
Future Features and Capabilities
Storage ●● Faster processors with integrated high-speed buses like PCI Express and USB 3.0 will enable faster streaming to disk rates
●● Flash storage will continue to increase in density and lower in cost, allowing hundreds of gigabytes and potentially terabytes of nonvolatile storage on high-end loggers
●● Vendors will offer seamless integration between data-logging systems and the cloud, enabling users to access data from anywhere
Processing ●● With more RAM and higher clock cycles on processors, data-logging systems will integrate more advanced signal processing and become less dependent on PCs for post-processing
●● More processing technologies will make their way to data-logging systems, like heterogeneous processing and programmable logic for high-end digital signal processing
I/O rates and timing
●● Logging systems will incorporate faster I/O rates (from 1 MHz to over 1 GHz) because faster processors will be able to handle more data
●● More custom timing options will be available by leveraging heterogeneous computing technologies and programmable logic
Application software ●● Software tools, both turnkey and programming, will run and be customizable directly on mobile devices
●● Vendors will give users a software experience that combines an easy-to-use, turnkey experience with the ability to quickly customize the system to meet unique application demands
Visualization ●● Integration with mobile devices, like smartphones and tablets, will be the norm●● Leading vendors will enable users to quickly create custom user interfaces on tablets and
smartphones, and via web-based software ●● Buttons and knobs will disappear and every screen within a data-logging system, whether a smart
device or an integrated display, will be multitouch enabled
Connectivity ●● With more networking capabilities and processing power embedded in processors, more connectivity and synchronization options will be integrated into logging systems such as Wi-Fi, cellular (GSM, 3G, 4G, and so on), Gigabit Ethernet, IEEE 1588, and so on)
Size and ruggedness ●● Low-power processing technologies like Intel’s Atom and ARM processors will enable high-performance loggers to be smaller with wider operating temperature ranges
� These future capabilities of high-performance data-logging systems are based on Moore’s law and advancements in processing technologies.
The first PC-based data acquisition systems consisted of a desktop PC with internal plug-in I/O boards. While the fundamental architecture has remained the same—an I/O device with analog-to-digital converters (ADCs), a PC with software, and a bus interface that connects the two—each component has evolved significantly over the years. New PC and bus technologies have provided engineers with more capability to meet the needs of new applications. The rise of laptops and USB, for example, made PC-based data acquisition more portable and accessible, bringing the advantages of PC-based measurements out into the field. PCI Express and PXI Express technologies provided significantly higher performance for high-channel count and high-sampling rate applications. New wireless technologies eliminated costly cables and extended the reach of data acquisition to even more places.
With the increasing complexity of modern vehicles, infrastructure, and machines, more conditions need to be measured in more places. Applications are demanding not just more data throughput but also lower power, smaller sizes, and more reach into new places. The emergence of several new bus technologies could evolve data acquisition systems and help address the challenges of tomorrow’s measurement applications.
PCI EXPRESS 4.0Intel introduced PCI Express, the most common bus interface in desktop computers, in 2004. It provides significant performance improvements over its predecessor, PCI. Compared to PCI, which has a peak theoretical bandwidth of 132 MB/s that is shared across multiple devices, PCI Express delivers dedicated bandwidth per device, up to 16 data lanes, and is capable
of up to 250 MB/s per lane. That’s up to 4 GB/s per device if the device has implemented all 16 lanes. PXI Express systems, which are based on PCI Express technology, also offer these benefits.
The engineers at PCI-SIG, the industry consortium developing the standard, haven’t stopped there. They’ve been working hard to iterate on the standard and have released several revisions over the past few years, each offering more performance. PCI Express 4.0, the next major revision of the bus, provides 16 gigatransfers per second (GT/s). That translates to bandwidth up to 2 GB/s per lane and a total of 32 GB/s per device for all 16 lanes. For high-performance data acquisition systems that require the data throughput of PCI Express or PXI Express, PCI Express 4.0 could provide 8X more data throughput, resulting in the ability to stream more channels at higher resolutions and faster sampling rates. PCI Express 4.0 is still in development and is expected to release in the 2014–2015 timeframe.
USB 3.0USB has become one of the most popular bus interfaces in the history of computers. Among PC and device manufacturers, USB adoption is virtually 100 percent. This bus made it fundamentally easier to connect external devices to computers by replacing the array of connectors at the back of PCs and simplifying the software configuration of connected devices, including data acquisition devices.
The latest revision, USB 3.0 (SuperSpeed), offers significant performance enhancements and backward compatibility with existing USB devices. Compared to USB 2.0
New bus technologies are poised to evolve data acquisition systems and address the challenges of future measurement applications.
Emerging Bus Technologies

NI.COM/DAQ-TRENDS 13
(Hi-Speed), which has a maximum throughput of 35 MB/s, USB 3.0 uses four additional wires and implements full-duplex communication to achieve much higher transfer rates up to 625 MB/s. The maximum power provided by a single bus port has increased to 900 mA, which will allow more devices to be powered off the bus instead of external
power sources. To achieve higher data rates, the cable connector had to be redesigned; however, USB 3.0 still maintains backward compatibility with USB 2.0 ports.
USB 3.0 shows the potential, when combined with the latest data acquisition technology, to provide a system that
Bus Technology Enhancements Impact on Data Acquisition
PCI Express 4.0 ●● 8X more data throughput than PCI Express 1.0 (up to 32 GB/s per device)
●● Increased streaming capability for high-performance DAQ applications
USB 3.0 ●● Significantly improved performance over USB 2.0 (up to 625 MB/s) and more power provided by the bus (900 mA)
●● Increased streaming capability for simple and portable data acquisition applications
Thunderbolt ●● Twice the performance of USB 3.0 (up 1.25 GB/s per device)
●● Increased streaming capability for simple and portable data acquisition applications
Power-over-Ethernet+ ●● Pass electrical power over an Ethernet cable (up to 100 m)
●● Improved flexibility and cost savings for distributed data acquisition applications
802.11ac ●● Double the transfer rates of 802.11n (up to 1.3 Gbit/s)
●● Increased streaming capability for wireless data acquisition applications
Wi-Fi Direct ●● Connect Wi-Fi devices without the need for a wireless router or access point
●● Simplified configuration for point-to-point wireless data acquisition
Bluetooth Smart ●● Lower power than classic Bluetooth (possible battery life of over 1 year)
●● More cost-effective, smaller, stand-alone form factors for monitoring applications
LTE ●● Significantly faster data rates than current 3G technologies (up to 300 Mbit/s)
●● Networked data acquisition systems across long distances

is not only simple and portable but also high-performance and high-throughput. PC vendors are beginning to offer USB 3.0 technology.
THUNDERBOLTThunderbolt is a new bus technology developed by Intel and Apple that aims to consolidate multiple cables into one by combining data, video, audio, and power into a single connection. It offers twice the performance of USB 3.0 for up to 1.25 GB/s of throughput per device. Part of the reason that Thunderbolt can offer such impressive performance is that it’s based on PCI Express technology. Each Thunderbolt port can also provide up to 10 W of power to connected devices.
Despite the apparent benefits of Thunderbolt over USB 3.0, it is brand new, so it may be a while before it becomes as ubiquitous as USB and is used in data acquisition systems.
POWER-OVER-ETHERNET+Power-over-Ethernet (PoE) is a method for safely passing electrical power along with data over an Ethernet cable. Specialized equipment is used to supply power in common mode over two or more differential pairs of wires found in Ethernet cables. The latest IEEE 802.3at-2009 standard, or PoE+, provides up to 25.5 W of power and can be run up to 100 m.
PoE is most widely used among enterprise network administrators for deploying corporate networks; however, as Ethernet becomes a more popular bus for data acquisition systems, it may grow into a compelling option for engineers and scientists. Though it provides both data and power, USB is capable of lengths only up to 5 m and provides less than 2.5 W of power. With the increased power and distance that PoE delivers, it could offer more flexibility, simplicity, and cost savings for remote data acquisition applications using Ethernet as a bus.
802.11ACWi-Fi is one of the most popular ways to connect computing devices to local area networks and the Internet. With Wi-Fi based data acquisition systems, engineers can leverage existing wireless infrastructure to eliminate cables and save money. However, high-performance data acquisition applications that require the continuous streaming of lots of data have been slow to adopt Wi-Fi. Compared to other bus interfaces, Wi-Fi has a much slower data throughput that varies based on the quality of the wireless signal.
An upcoming Wi-Fi standard, 802.11ac, will alleviate some of the throughput limitations and exceed Gigabit transfer rates. It uses the same 5 GHz spectrum as 802.11n, but it also uses channels that are 80 MHz wide rather than 40 MHz and features eight spatial streams rather than four. The theoretical maximum speed is 1.3 Gbit/s, which is considerably faster than the 802.11n maximum speed of 450 Mbit/s. In addition to higher speeds, 802.11ac saves power. Since it is more efficient at the same transmit power as 802.11n, it expends less energy per byte. Initial tests have shown it to be 5X more economical on battery life. 802.11ac is still in development, and the first PC products featuring this technology are expected to be available in 2013.
WI-FI DIRECTFor remote data acquisition applications that have several monitoring points, the use of existing infrastructure by Wi-Fi data acquisition systems is a huge benefit. However, for simple applications that require only a point-to-point connection, Wi-Fi requires some network configuration and increases complexity. New Wi-Fi Direct technology aims to simplify this connectivity.
Wi-Fi Direct is a standard that connects Wi-Fi devices without a wireless router or access point. It works by embedding a software access point in the device. Previously, Wi-Fi devices directly connected using an ad hoc connection. Wi-Fi Direct updates this concept

NI.COM/DAQ-TRENDS 15
and makes it much easier, faster, and more secure. Compared to Bluetooth, which can reach transfer rates up to 3 Mbit/s and has a range of approximately 30 ft, Wi-Fi Direct can move data up to 250 Mbit/s and has a range up to 200 ft. Similar to Bluetooth, Wi-Fi Direct devices can discover each other automatically. Wi-Fi Direct is available in some devices today and is expected to see greater adoption among PC products in 2013.
BLUETOOTH SMARTBluetooth is a short-range, low-power wireless technology that is used to create a wireless point-to-point connection between devices and computers or mobile devices. Unlike Wi-Fi, which provides high-speed access to local area networks, Bluetooth’s primary aim is to replace cables with a wireless connection while maintaining the existing infrastructure.
The latest revision of Bluetooth creates some interesting new opportunities for data acquisition applications. Bluetooth Smart is part of the latest Bluetooth specification, Bluetooth 4.0. It is optimized to be low energy, so it uses only a fraction of the power that classic Bluetooth devices use. In some cases, Bluetooth Smart devices will be able to operate more than a year on the same battery.
Although it doesn’t feature the speed and distance advantages of Wi-Fi connections, Bluetooth Smart operates with extremely low power consumption and cost-efficiency. This presents opportunities for a wide range of new data acquisition applications in much smaller, stand-alone form factors. Some personal fitness and health applications already incorporate the technology. Several gadgets monitor a user’s daily physical activity and sync with mobile devices. The use of Bluetooth Smart is still preliminary, but it shows the potential to move into a new area of smaller, lower-cost, lower-power data acquisition systems that connect to mobile devices.
LTEOver the years, cellular networks have evolved from providing mobile phone coverage to offering high-speed data connections. Engineers have used cellular technology to create networks of data acquisition systems that expand beyond the walls of a local area network to wide area networks across the world. However, for high-speed streaming applications, cellular technology has rarely been an option because of the cost and slow data throughput.
LTE is a fourth-generation cellular technology that will ease these limitations. Current 3G technologies offer peak data rates around 200 kbit/s to 500 kbit/s. LTE uses new modulation and digital signal processing techniques to increase capacity and provide data rates around 300 Mbit/s. Currently, LTE service is offered by many cellular providers and coverage is continuing to expand. Engineers can take advantage of LTE technology in data acquisition systems today by combining an LTE hotspot with a Wi-Fi or Ethernet data acquisition device. As the cost of cellular technology drops and usage increases, this technology could be directly integrated into data acquisition devices.
INTEGRATION WITH NEXT GENERATION DATA ACQUISITION SYSTEMSHistorically, as new PC and bus technologies have emerged, data acquisition vendors have incorporated the technologies into their products and expanded the capability of data acquisition systems. Although none of the mentioned bus technologies exist in data acquisition products today, it provides a glimpse of what the future could hold for tomorrow’s measurement applications.
Frost & Sullivan foresees a big change in the next five years in the data acquisition market in terms of adoption of wireless data acquisition systems.� Jessy Cavazos, Industry Director for Test & Measurement, Frost & Sullivan
The worldwide proliferation of mobile devices has given people unlimited and instant access to information. Questions no longer go unanswered, as information is made available from anywhere, anytime. Mobile technology has created a natural expectation to have continuous access to information and it is now influencing the data acquisition market. Engineers and scientists are creating systems that can be accessed through mobile devices. These systems alert technicians when tests are complete and provide the ability to change data on the go.
In the data acquisition space, engineers are using mobile technologies with constant access to information to achieve efficiency gains and in many cases avoid issues before they become costly problems. Mobile technology is evolving quickly, which makes implementation and setting standards difficult. To capitalize, engineers and scientists must evolve their skill sets by understanding options for mobile integration and keeping tabs on the outlook for future mobile systems.
EMERGING TRENDS AND TECHNOLOGIESMobile Operating Systems. The mobile device market is still young. Market shares change dramatically and new disruptions happen often. This turbulent market makes it difficult for engineers to know which hardware and operating systems to standardize on. Knowledge of where the market has come from, how it is behaving now, and thoughts of where it will go can help mitigate standardization risks.
Smartphones and tablets didn’t take off until Apple released the iPhone and the iPad in 2007 and 2010, respectively. And while companies such as Blackberry (formerly Research in Motion (RIM)), Nokia, and Palm have all occupied space in the mobile device market, none have captured consumer sentiment like Apple has with the iPhone and iPad. As a result, Apple, as well as Google, have become market leaders.
Google released its open-source Android operating system in 2008 for smartphones and added tablet support in 2011. The company follows a different business model from Apple by working with OEMs to include Android on its devices free of charge. Apple on the other hand does not license the iOS operating system to OEMs and instead chooses to manufacture its own devices.
Many technology pundits have drawn parallels to the PC market of the 1980s when Apple took the same approach of not licensing its operating system to OEMs while Microsoft did. Eventually Windows won the PC market battle by flooding the market with products, and many see Google doing the same in the mobile device market.
When Android entered the smartphone market at the end of 2008, Blackberry (RIM) was the market leader with 43 percent market share while Apple held 24 percent. At the end of 2012, Android became the market leader with 64 percent market share, Apple at 19 percent, and Blackberry down to 5 percent. These numbers highlight
Mobile Technology’s Influence on Data AcquisitionMobile access to measurement applications is no longer just a nice addition; it is an expectation.

Mobile computing devices are evolving and providing opportunities for wireless data acquisition systems. This is going to change the data acquisition market.� Jessy Cavazos, Industry Director for Test & Measurement, Frost & Sullivan
the dramatic shifts that can happen in the smartphone market in a short amount of time.
A similar trend is happening within the tablet space. When Android added official support for tablets in 2011, iOS had market leadership with 83.9 percent market share while Android held 14.2 percent. At the end of 2012, iOS still held the market with 54 percent but Android had moved to 43 percent. Android continues to stay open and allow OEMs to manufacture a wide array of devices that has allowed the company to quickly grab significant market share.
Engineers integrating remote connectivity into measurement systems should know which operating systems are the most prevalent. A company should look for an operating system that is compatible or supported by its customer base. Supporting mobile operating systems that are little used is not normally advised and can be a waste of resources.
Windows 8 Tablets. Microsoft released Windows 8 at the end of 2012. Besides the user interface overhaul from earlier Windows releases, Windows 8 runs on tablets as well as PCs. Microsoft has historically dominated the PC market, but with the steady decline in PC sales, the company is under pressure to enter the fast growing tablet market to maintain business liquidity.
Microsoft released two versions of Windows 8, Windows 8 RT and Windows 8 Pro. Windows 8 RT runs on ARM-based tablets and can only run applications
that are purchased through the Windows Store. Traditional software applications, such as Adobe Photoshop or NI LabVIEW, won’t run on them since they are historically compiled for x86-based chip architectures and Windows 8 RT devices are ARM-based.
Microsoft is also manufacturing its own tablet that runs Windows 8 called the Microsoft Surface. In February 2013, the Microsoft Surface with Windows 8 Pro was released. This device is noteworthy because it technically resembles an Ultrabook’s capability, can run traditional software applications, and has the tablet form factor.
Engineers will be interested in the Surface for measurement systems because it has a USB port and supports x86-based applications. These devices will run existing measurement applications while adding a mobile form factor so the benefits of mobility can be added to existing systems with little extra development. The Surface is the first generation of tablet devices from Microsoft that can evolve in future versions with improvements in battery life, hard disk space, and software refinements.
NI.COM/DAQ-TRENDS 17

MEASUREMENT OPTIONS FOR MOBILE TECHNOLOGY INTEGRATIONMobile technology is a relatively new addition for measurement systems, but common solutions are starting to evolve. The most basic solution is using a mobile device to take handheld measurements and another is to use the mobile device as a human machine interface (HMI) for remote measurement systems.
Handheld Measurements. The idea of handheld measurement devices isn’t new. Handheld digital multimeters have been around for years along with a host of other handheld measurement devices on the market. Overall these are dedicated measurement devices created for a singular specific purpose. However, the evolution of the technology behind mobile devices provides the opportunity to create more flexible and reliable handheld measurement devices.
Mobile devices and their operating systems offer powerful platforms that give application developers access to hundreds of thousands of apps so they can customize and create in these platform environments. Companies are now creating measurement devices that can be plugged directly into mobile devices. Native apps created by measurement hardware manufacturers can interact with the plug-in device to read data. In addition, if the manufacturers used an open standard for data transfer, app developers could create apps to interact with the plug-in hardware and could give users a completely different experience.
One consideration that engineers should make when choosing a mobile plug-in measurement device is the interface. Common interface standards, like USB, should be the primary consideration for these measurement systems. Proprietary interfaces are riskier when creating a measurement system that needs to be supported for a number of years. Hardware manufacturers that use proprietary interfaces could change them in future releases with no warning. This could force engineers to spend time and money updating their systems to use the new proprietary interface. Standard interfaces should be sought out so that measurement systems are future proofed and less tied to a specific manufacturer.
Other than directly connecting to mobile devices, wireless measurement devices offer an effective solution for handheld measurements. New data acquisition devices have built-in wireless capabilities and can be accessed from mobile devices or traditional PCs. One mobile device can take a measurement from many wireless measurement devices. Native apps or software IDEs can be used to program these wireless measurement devices. As measurement systems increasingly need more flexibility, engineers can expect that
measurement device manufacturers will release more wireless measurement devices.
Remote HMI. When adding a remote HMI to a measurement system, one of the first considerations is how to communicate between the measurement system and the HMI. Standard network protocols like TCP or UDP can be used, but a growing trend is to use a technology built on TCP and HTTP called web services. A web service is an application programming interface (API) that can be accessed via HTTP requests. When called, web services return a human-readable response. Modern web services use JSON responses but other response options are XML, HTML, or plain text. Engineers can then program effective interfaces that render the web service response as something more visually pleasing, such as a waveform graph.
There are several reasons why engineers and IT departments are choosing web services over other communication technologies. First, web services are straightforward and simple to access from any programming language, including C++, Objective C, and LabVIEW. Second, since web services sit on top of common network protocols, the communication is considered “IT friendly” compared with proprietary network protocols. Third, web services can also be easily encrypted via industry-standard technologies like Secure Sockets Layer (SSL) or Transport Layer Security (TLS).
Another consideration is how to view the data communicated from the measurement system. Many different technologies can be used to create a data client, which is the GUI that permits someone to view or control the measurement data being transmitted from the measurement system. A standard web browser can send HTTP requests to the web service. Using HTML and JavaScript, a data client can be created to view the returned data on a graph instead of just XML. Building a custom data client that uses a web browser provides the flexibility to customize the look and functionality while using technologies that don’t require an extra run-time engine to operate. HTML is also cross-platform compatible, so one data client can be created to work on multiple operating systems. Another alternative to HTML is to create native apps that run on specific mobile operating systems.
Native apps provide better performance and usability when compared to web-based (HTML) apps. A caveat is that native apps need custom development for each mobile operating system. Apps written for Android, for example, need to be ported to iOS. HTML5 is promising because it works with most operating systems, but the technology is still quite young. Notably, Facebook switched from an HTML5 app to native apps after performance and usability complaints were heaped on its HTML5 app. HTML5 is

quickly improving performance on mobile operating systems, so the technology will probably be a more viable option in the near future.
The first step to create a remote HMI for a measurement system is choosing how to transmit the measurement data and selecting which data client technology to standardize on. Engineers are learning more about the options for creating remote HMI solutions, making this functionality a primary consideration in measurement system platform choice.
Mobile Security. The more mobile devices are used to connect to secure information, such as bank accounts or private company data, the more they become the target of hackers. Attacks by malware, software aimed at disrupting computer operations, have risen exponentially over the past few years in mobile operating systems. Symantec, a global security software company, lists “mobile attacks” as one of its top five trends to watch out for in 2013. As engineers are adding mobile technology to their measurement systems, mobile security needs to be a primary concern.
Common ways to combat mobile security threats are to download only apps from official app stores and use antivirus software apps on the mobile devices. Most manufacturers offer best practices to enhance security for their mobile devices. Engineers should look into the specific security details for their mobile devices and add necessary security measures. Simple steps such as requiring a login or pin code and turning on “remote wipe” services to erase all information on a device if it gets stolen or lost can help mitigate some risks.
The rise of enterprise app stores will also assist in mobile security in the workplace. Mobile operating system providers now make it possible for companies to create their own internal app stores with company-approved apps. This is a great way for IT departments to distribute apps that access company databases as well as push suggested mobile apps like antivirus protection.
MOBILE’S FUTURE IN TEST AND MEASUREMENT SYSTEMSFuture test and measurement systems will continue to evolve into a more networked state. Mobile access is becoming a primary requirement for test and measurement systems, and engineers are future proofing those systems now. Older GPIB instruments will be replaced with newer Ethernet instruments while wireless measurement devices will continue to grow market share as mobile devices become more powerful computing platforms. All of these trends lead to a future where mobile technology will be used more prevalently with data acquisition systems.
NI.COM/DAQ-TRENDS 19
� This chart shows new security threats to mobile operating systems per quarter for the last two years.
Q1 2011 Q2 2011 Q3 2011 Q1 2012 Q2 2012 Q3 2012Q4 2011
17
35
74
60 60
67
51

� ni.com/daq-trends
C000000
From well-managed forests
100%©2013 National Instruments. All rights reserved. Big Analog Data, CompactRIO, LabVIEW, National Instruments, NI, ni.com, and NI CompactDAQ are trademarks of National Instruments. Other product and company names listed are trademarks or trade names of their respective companies. 351034A-01