daron acemoglu james robinson thierry...
TRANSCRIPT
Electronic copy available at: http://ssrn.com/abstract=2132939
Massachusetts Institute of Technology Department of Economics
Working Paper Series
Can’t We All Be More Like Scandinavians? Asymmetric
Growth and Institutions in an Interdependent World?
Daron Acemoglu James Robinson Thierry Verdier
Working Paper 12-22 August 20, 2012
Room E52-251 50 Memorial Drive
Cambridge, MA 02142
This paper can be downloaded without charge from the Social Science Research Network Paper Collection at
http://ssrn.com/abstract=2132939
Electronic copy available at: http://ssrn.com/abstract=2132939
Can’t We All Be More Like Scandinavians? AsymmetricGrowth and Institutions in an Interdependent World
Daron AcemogluMIT
James A. RobinsonHarvard
Thierry VerdierParis School of Economics
August 2012.
Abstract
Because of their more limited inequality and more comprehensive social welfare systems,many perceive average welfare to be higher in Scandinavian societies than in the United States.Why then does the United States not adopt Scandinavian-style institutions? More generally,in an interdependent world, would we expect all countries to adopt the same institutions? Toprovide theoretical answers to this question, we develop a simple model of economic growthin a world in which all countries benefit and potentially contribute to advances in the worldtechnology frontier. A greater gap of incomes between successful and unsuccessful entrepreneurs(thus greater inequality) increases entrepreneurial e§ort and hence a country’s contribution tothe world technology frontier. We show that, under plausible assumptions, the world equilibriumis asymmetric: some countries will opt for a type of “cutthroat” capitalism that generates greaterinequality and more innovation and will become the technology leaders, while others will free-ride on the cutthroat incentives of the leaders and choose a more “cuddly” form of capitalism.Paradoxically, those with cuddly reward structures, though poorer, may have higher welfare thancutthroat capitalists; but in the world equilibrium, it is not a best response for the cutthroatcapitalists to switch to a more cuddly form of capitalism. We also show that domestic constraintsfrom social democratic parties or unions may be beneficial for a country because they preventcutthroat capitalism domestically, instead inducing other countries to play this role.
JEL Classification: O40, O43, O33, P10, P16.Keywords: cutthroat capitalism, economic growth, inequality, innovation, interdepen-
dences, technological change.
We thank Pascual Restrepo for superb research assistance and Leopoldo Fergusson and seminar participantsat Brown University, Copenhagen University, El Rosario University in Bogotá and 2011 Latin American andCaribbean Economic Association meetings for comments and suggestions. Acemoglu and Robinson gratefullyacknowledge support from the Canadian Institute for Advanced Research.
1
Electronic copy available at: http://ssrn.com/abstract=2132939
1 Introduction
Against the background of the huge inequalities across countries, the United States, Denmark,
Finland, Norway and Sweden are all prosperous, with per capita incomes more than 40 times
those of the poorest countries around the world today. Over the last 60 years, all four countries
have had similar growth rates.1 But there are also notable di§erences between them. The United
States is richer than Denmark, Finland and Sweden, with an income per capita (in purchasing
power parity, 2005 dollars) of about $43,000 in 2008. Denmark’s is about $35,870, Finland’s
is about $33,700 and Sweden’s stands at $34,300 (OECD, 2011).2 The United States is also
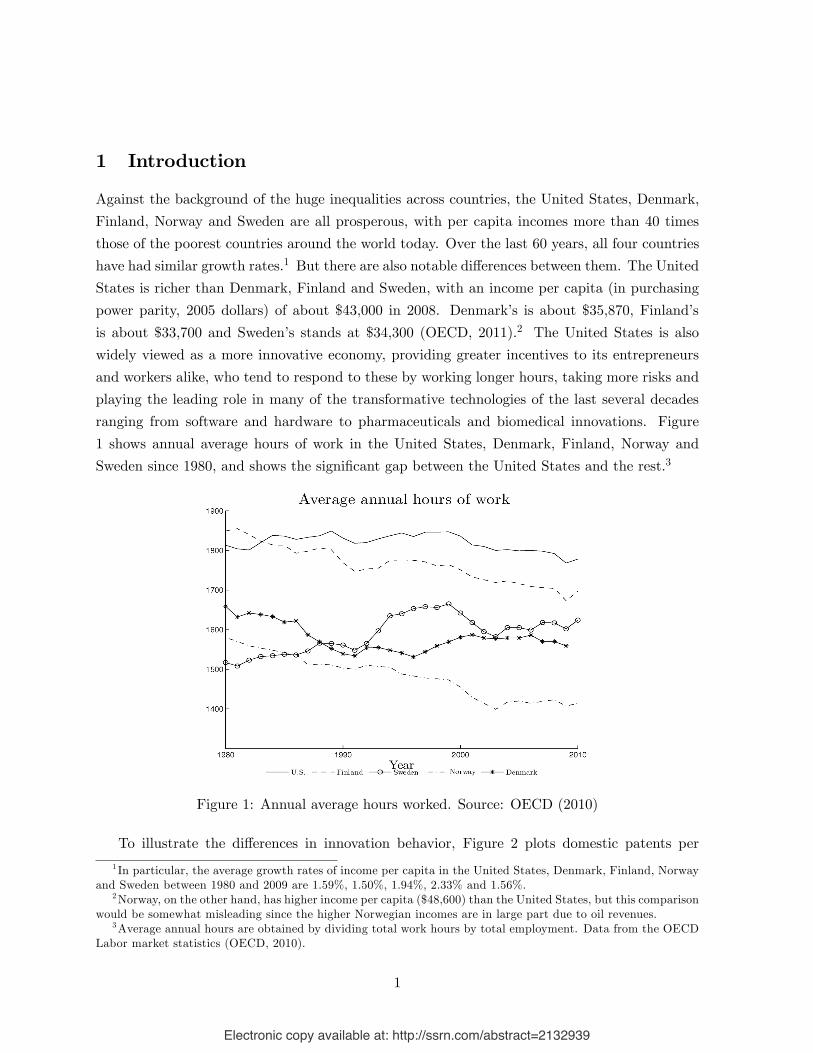
widely viewed as a more innovative economy, providing greater incentives to its entrepreneurs
and workers alike, who tend to respond to these by working longer hours, taking more risks and
playing the leading role in many of the transformative technologies of the last several decades
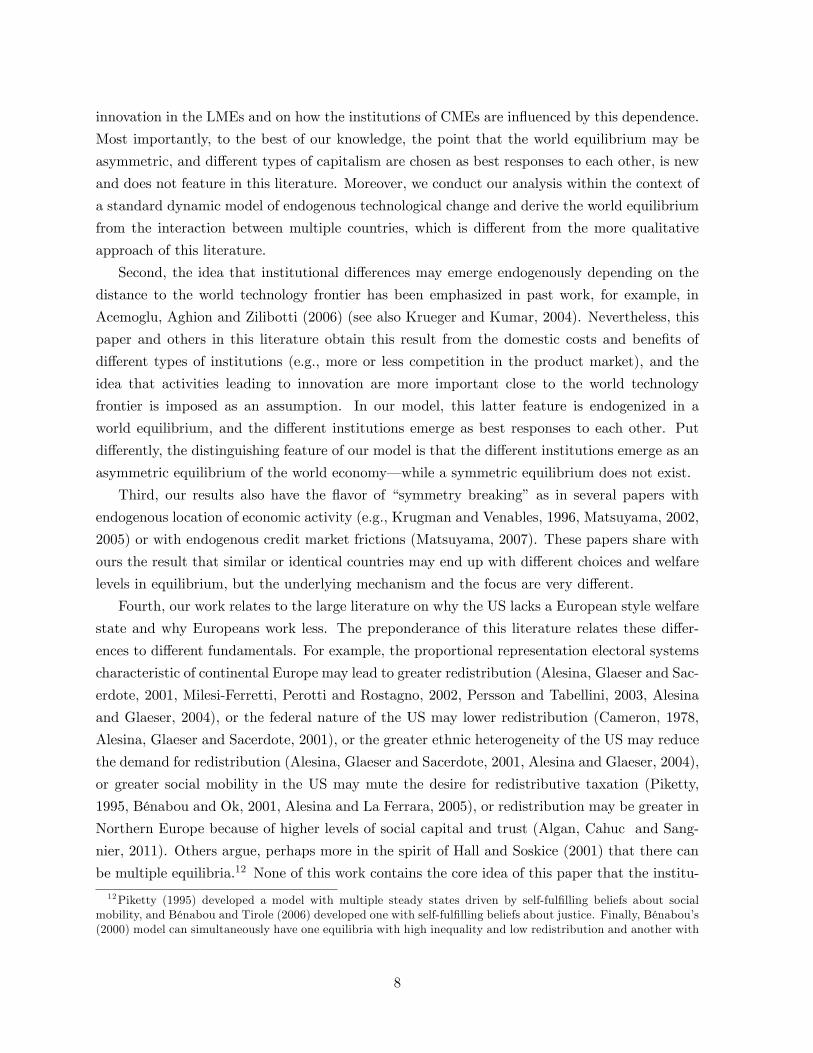
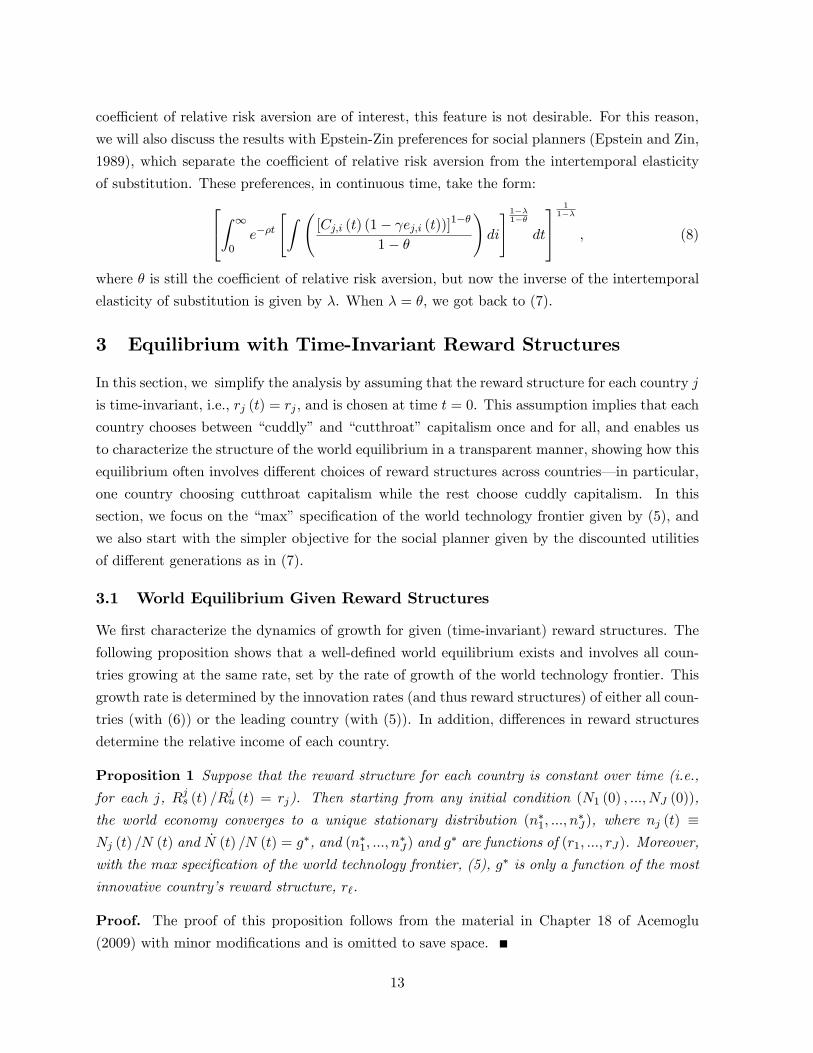
ranging from software and hardware to pharmaceuticals and biomedical innovations. Figure
1 shows annual average hours of work in the United States, Denmark, Finland, Norway and
Sweden since 1980, and shows the significant gap between the United States and the rest.3
Figure 1: Annual average hours worked. Source: OECD (2010)
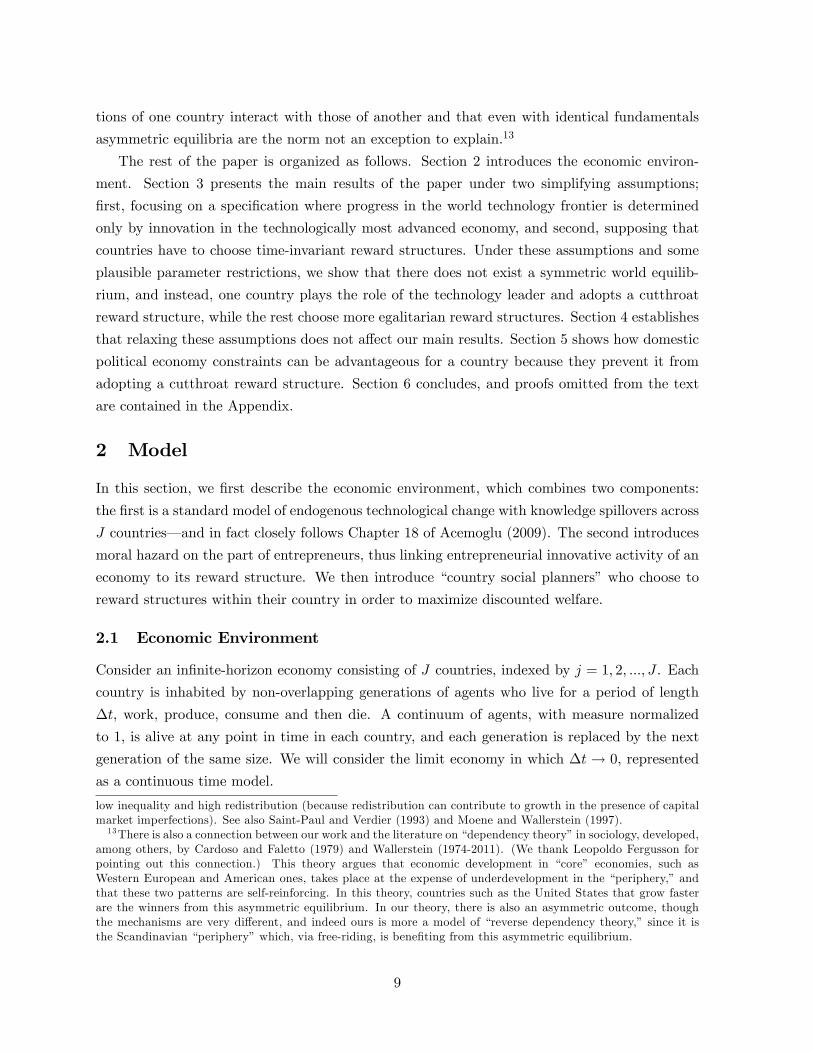
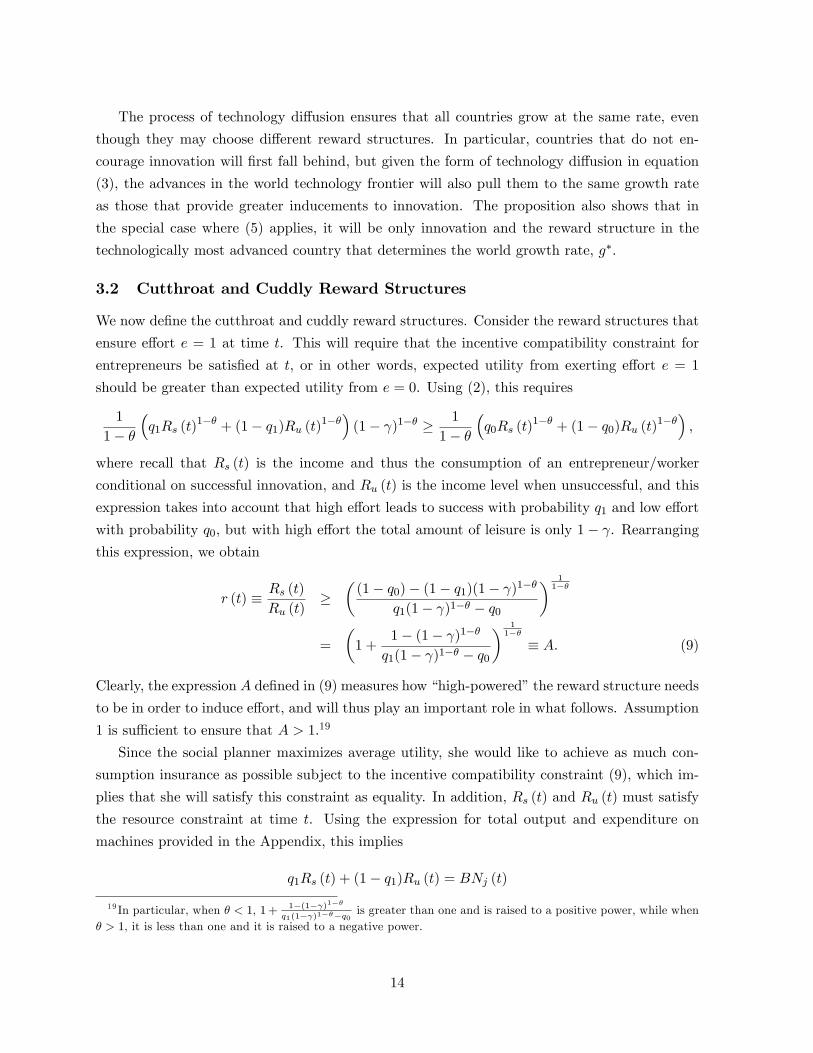
To illustrate the di§erences in innovation behavior, Figure 2 plots domestic patents per
1 In particular, the average growth rates of income per capita in the United States, Denmark, Finland, Norwayand Sweden between 1980 and 2009 are 1.59%, 1.50%, 1.94%, 2.33% and 1.56%.
2Norway, on the other hand, has higher income per capita ($48,600) than the United States, but this comparisonwould be somewhat misleading since the higher Norwegian incomes are in large part due to oil revenues.
3Average annual hours are obtained by dividing total work hours by total employment. Data from the OECDLabor market statistics (OECD, 2010).
1
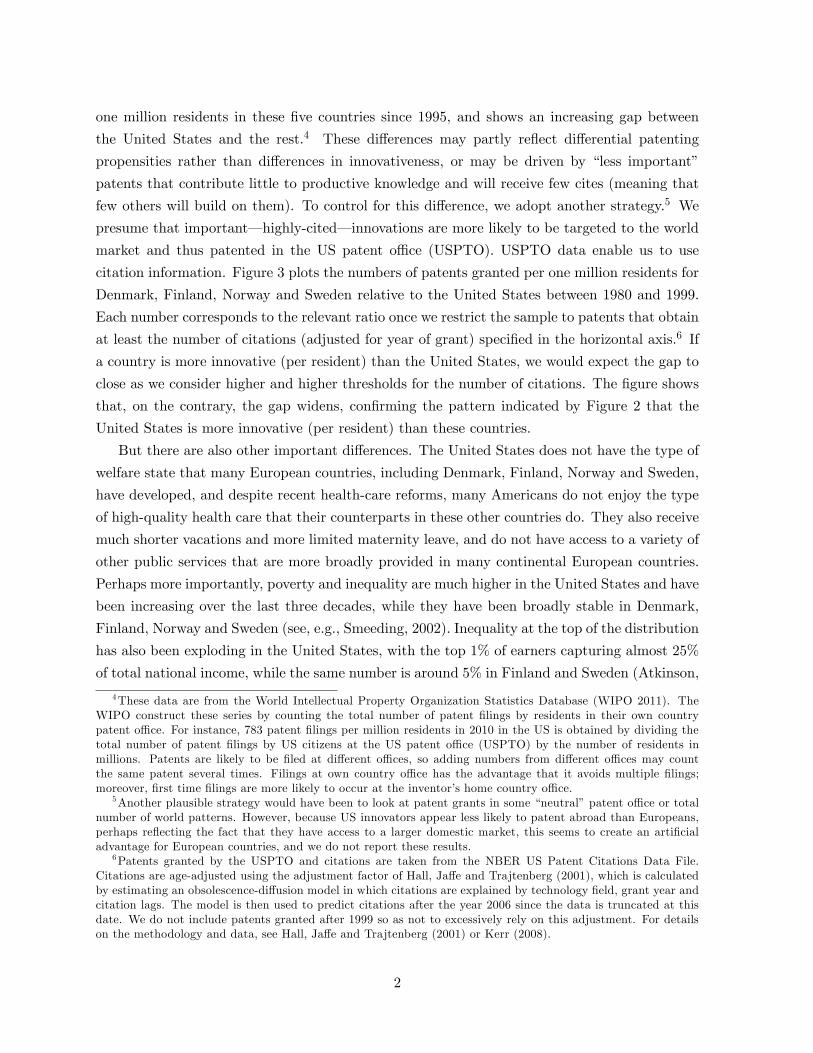
one million residents in these five countries since 1995, and shows an increasing gap between
the United States and the rest.4 These di§erences may partly reflect di§erential patenting
propensities rather than di§erences in innovativeness, or may be driven by “less important”
patents that contribute little to productive knowledge and will receive few cites (meaning that
few others will build on them). To control for this di§erence, we adopt another strategy.5 We
presume that important–highly-cited–innovations are more likely to be targeted to the world
market and thus patented in the US patent o¢ce (USPTO). USPTO data enable us to use
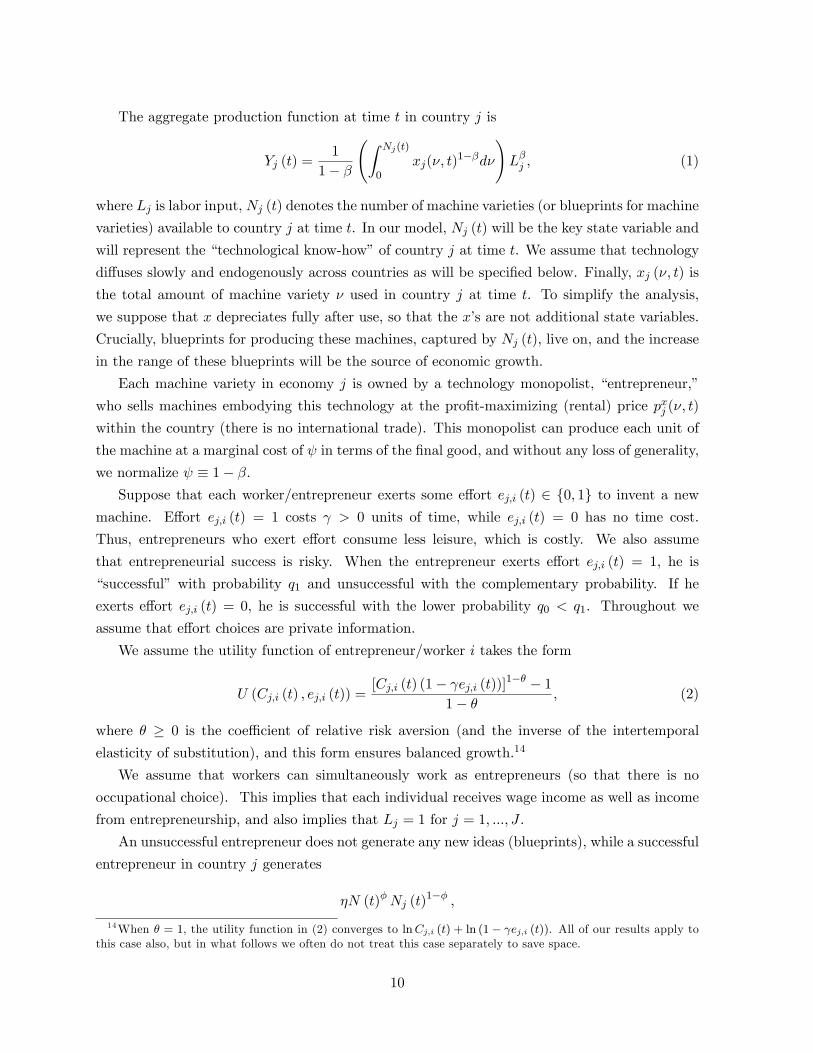
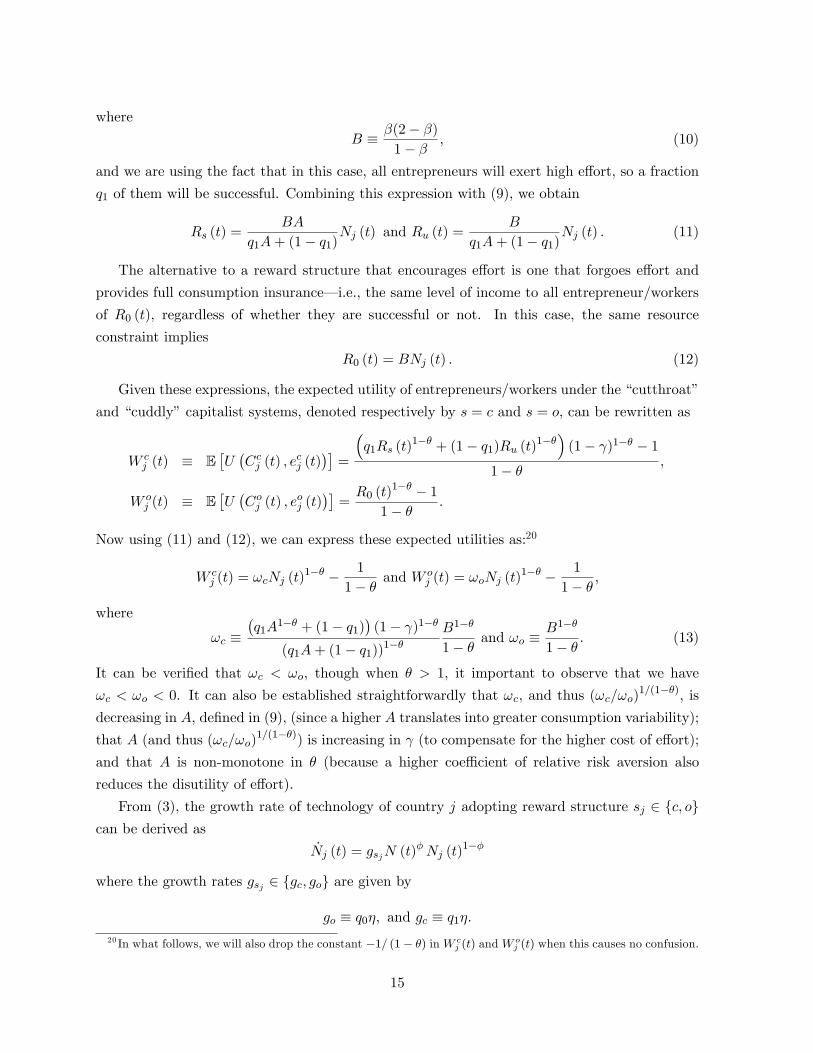
citation information. Figure 3 plots the numbers of patents granted per one million residents for
Denmark, Finland, Norway and Sweden relative to the United States between 1980 and 1999.
Each number corresponds to the relevant ratio once we restrict the sample to patents that obtain
at least the number of citations (adjusted for year of grant) specified in the horizontal axis.6 If
a country is more innovative (per resident) than the United States, we would expect the gap to
close as we consider higher and higher thresholds for the number of citations. The figure shows
that, on the contrary, the gap widens, confirming the pattern indicated by Figure 2 that the
United States is more innovative (per resident) than these countries.
But there are also other important di§erences. The United States does not have the type of
welfare state that many European countries, including Denmark, Finland, Norway and Sweden,
have developed, and despite recent health-care reforms, many Americans do not enjoy the type
of high-quality health care that their counterparts in these other countries do. They also receive
much shorter vacations and more limited maternity leave, and do not have access to a variety of
other public services that are more broadly provided in many continental European countries.
Perhaps more importantly, poverty and inequality are much higher in the United States and have
been increasing over the last three decades, while they have been broadly stable in Denmark,
Finland, Norway and Sweden (see, e.g., Smeeding, 2002). Inequality at the top of the distribution
has also been exploding in the United States, with the top 1% of earners capturing almost 25%
of total national income, while the same number is around 5% in Finland and Sweden (Atkinson,
4These data are from the World Intellectual Property Organization Statistics Database (WIPO 2011). TheWIPO construct these series by counting the total number of patent filings by residents in their own countrypatent o¢ce. For instance, 783 patent filings per million residents in 2010 in the US is obtained by dividing thetotal number of patent filings by US citizens at the US patent o¢ce (USPTO) by the number of residents inmillions. Patents are likely to be filed at di§erent o¢ces, so adding numbers from di§erent o¢ces may countthe same patent several times. Filings at own country o¢ce has the advantage that it avoids multiple filings;moreover, first time filings are more likely to occur at the inventor’s home country o¢ce.
5Another plausible strategy would have been to look at patent grants in some “neutral” patent o¢ce or totalnumber of world patterns. However, because US innovators appear less likely to patent abroad than Europeans,perhaps reflecting the fact that they have access to a larger domestic market, this seems to create an artificialadvantage for European countries, and we do not report these results.
6Patents granted by the USPTO and citations are taken from the NBER US Patent Citations Data File.Citations are age-adjusted using the adjustment factor of Hall, Ja§e and Trajtenberg (2001), which is calculatedby estimating an obsolescence-di§usion model in which citations are explained by technology field, grant year andcitation lags. The model is then used to predict citations after the year 2006 since the data is truncated at thisdate. We do not include patents granted after 1999 so as not to excessively rely on this adjustment. For detailson the methodology and data, see Hall, Ja§e and Trajtenberg (2001) or Kerr (2008).
2
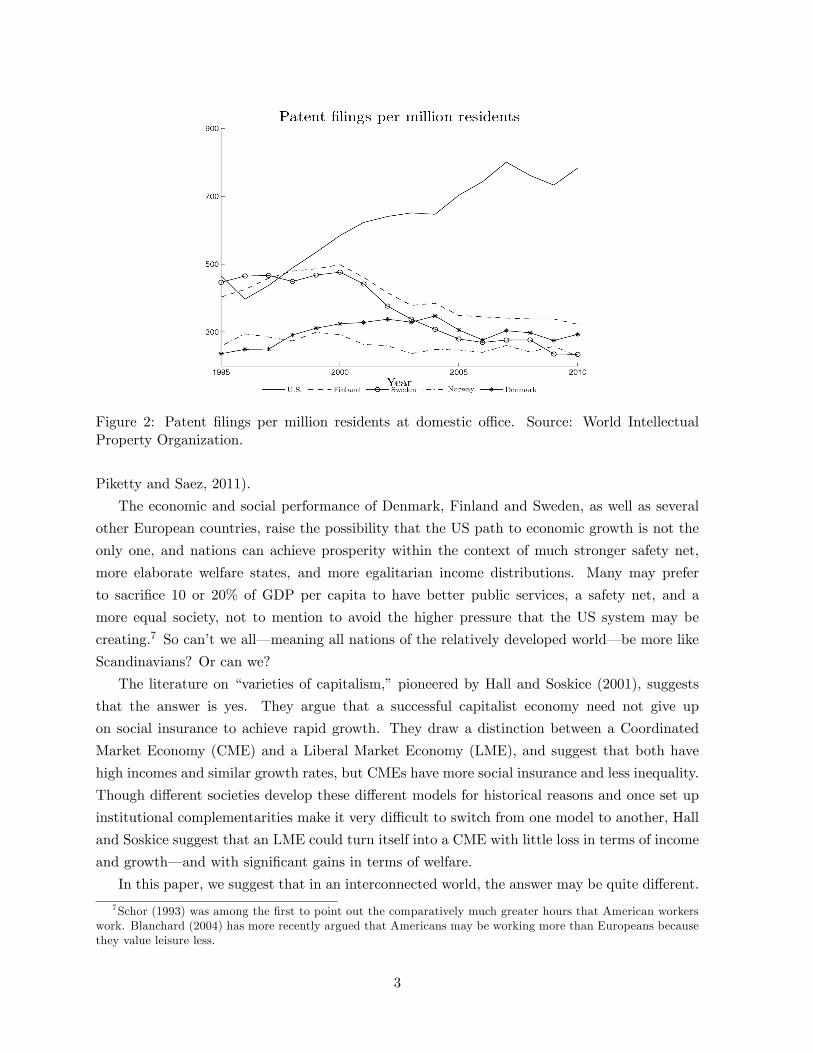
Figure 2: Patent filings per million residents at domestic o¢ce. Source: World IntellectualProperty Organization.
Piketty and Saez, 2011).
The economic and social performance of Denmark, Finland and Sweden, as well as several
other European countries, raise the possibility that the US path to economic growth is not the
only one, and nations can achieve prosperity within the context of much stronger safety net,
more elaborate welfare states, and more egalitarian income distributions. Many may prefer
to sacrifice 10 or 20% of GDP per capita to have better public services, a safety net, and a
more equal society, not to mention to avoid the higher pressure that the US system may be
creating.7 So can’t we all–meaning all nations of the relatively developed world–be more like
Scandinavians? Or can we?
The literature on “varieties of capitalism,” pioneered by Hall and Soskice (2001), suggests
that the answer is yes. They argue that a successful capitalist economy need not give up
on social insurance to achieve rapid growth. They draw a distinction between a Coordinated
Market Economy (CME) and a Liberal Market Economy (LME), and suggest that both have
high incomes and similar growth rates, but CMEs have more social insurance and less inequality.
Though di§erent societies develop these di§erent models for historical reasons and once set up
institutional complementarities make it very di¢cult to switch from one model to another, Hall
and Soskice suggest that an LME could turn itself into a CME with little loss in terms of income
and growth–and with significant gains in terms of welfare.
In this paper, we suggest that in an interconnected world, the answer may be quite di§erent.
7Schor (1993) was among the first to point out the comparatively much greater hours that American workerswork. Blanchard (2004) has more recently argued that Americans may be working more than Europeans becausethey value leisure less.
3
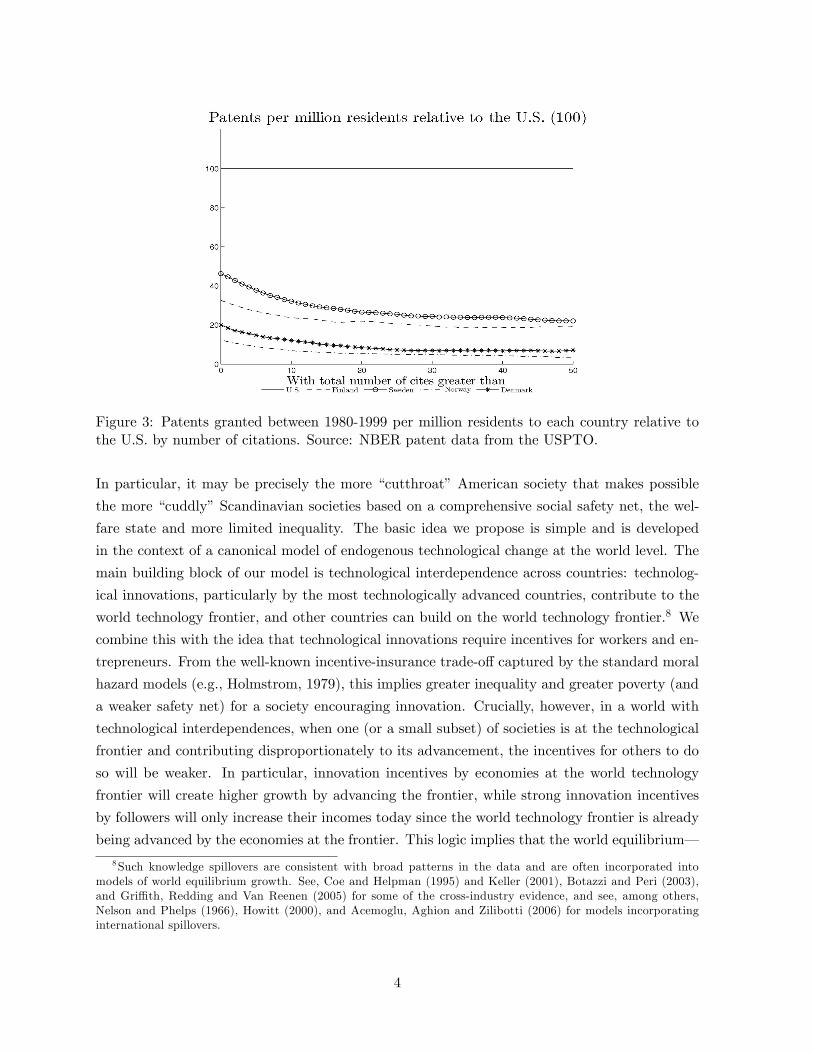
Figure 3: Patents granted between 1980-1999 per million residents to each country relative tothe U.S. by number of citations. Source: NBER patent data from the USPTO.
In particular, it may be precisely the more “cutthroat” American society that makes possible
the more “cuddly” Scandinavian societies based on a comprehensive social safety net, the wel-
fare state and more limited inequality. The basic idea we propose is simple and is developed
in the context of a canonical model of endogenous technological change at the world level. The
main building block of our model is technological interdependence across countries: technolog-
ical innovations, particularly by the most technologically advanced countries, contribute to the
world technology frontier, and other countries can build on the world technology frontier.8 We
combine this with the idea that technological innovations require incentives for workers and en-
trepreneurs. From the well-known incentive-insurance trade-o§ captured by the standard moral
hazard models (e.g., Holmstrom, 1979), this implies greater inequality and greater poverty (and
a weaker safety net) for a society encouraging innovation. Crucially, however, in a world with
technological interdependences, when one (or a small subset) of societies is at the technological
frontier and contributing disproportionately to its advancement, the incentives for others to do
so will be weaker. In particular, innovation incentives by economies at the world technology
frontier will create higher growth by advancing the frontier, while strong innovation incentives
by followers will only increase their incomes today since the world technology frontier is already
being advanced by the economies at the frontier. This logic implies that the world equilibrium–
8Such knowledge spillovers are consistent with broad patterns in the data and are often incorporated intomodels of world equilibrium growth. See, Coe and Helpman (1995) and Keller (2001), Botazzi and Peri (2003),and Gri¢th, Redding and Van Reenen (2005) for some of the cross-industry evidence, and see, among others,Nelson and Phelps (1966), Howitt (2000), and Acemoglu, Aghion and Zilibotti (2006) for models incorporatinginternational spillovers.
4
with endogenous technology transfer–may be asymmetric, and some countries will have greater
incentives to innovate than others. Since innovation is associated with more high-powered in-
centives, these countries will have to sacrifice insurance and equality. The followers, on the other
hand, can best respond to the technology leader’s advancement of the world technology frontier
by ensuring better insurance to their population–a better safety net, a welfare state and greater
equality.
The bulk of our paper formalizes these ideas using a simple (canonical) model of world equilib-
rium with technology transfer. Our model is a version of Romer’s (1990) endogenous technologi-
cal change model with multiple countries (as in Acemoglu, 2009, Chapter 18). R&D investments
within each economy advance that economy’s technology, but these build on the knowledge stock
of the world–the world technology frontier. Incorporating Gerschenkron (1962)’s famous in-
sight, countries that are further behind the world technology frontier have an “advantage of
backwardness” in that there is more unused knowledge at the frontier for them to build upon
(see also Nelson and Phelps, 1966). We depart from this framework only in one dimension: by
assuming, plausibly, that there is a moral hazard problem for workers (entrepreneurs) and for
successful innovation they need to be given incentives, which comes at the cost of consumption
insurance.9 A fully forward-looking (country-level) social planner chooses the extent of “safety
net,” which in our model corresponds to the level of consumption for unsuccessful economic
outcomes for workers (or entrepreneurs). The safety net then determines a country-level reward
structure shaping work and innovation incentives.
The main economic forces are simpler to see under two simplifying assumptions, which we
adopt in our benchmark model. First, we focus on the case in which the world technology frontier
is advanced only by the most advanced country’s technology. Second, we assume that social
planners (for each country) choose a time-invariant reward structure. Under these assumptions,
and some simple parameter restrictions (which essentially require risk aversion and the gains
from high e§ort to take intermediate values), we show that the world equilibrium is asymmetric:
one country (the frontier economy) adopts a “cutthroat” reward structure, with high-powered
incentives for success, while other countries free-ride on this frontier economy and choose a more
egalitarian, “cuddly,” reward structure. In the long-run, all countries grow at the same rate, but
those with cuddly reward structures are strictly poorer. Notably, however, these countries may
have higher welfare than the cutthroat leader. In fact, we prove that if the initial gap between
the frontier economy and the followers is small enough, the cuddly followers will necessarily have
higher welfare. Thus, our model confirms the intuition that all countries may want to be like
the “Scandinavians” with a more extensive safety net and a more egalitarian structure. Yet the
main implication of our theoretical analysis is that, under the assumptions of our model which
we view as a fairly natural approximation to reality, we cannot all be like the Scandinavians.
9To do this in the most transparent fashion, we assume that the world consists of a sequence of one-periodlived agents. We allow the social planner to have infinite horizon.
5
That is, it is not an equilibrium for the cutthroat leader, “the United States,” to also adopt
such a reward structure. This is because if, given the strategies of other countries, the cutthroat
leader did so, this would reduce the growth rate of the entire world economy, discouraging the
adoption of the more egalitarian reward structure. In contrast, followers are still happy to choose
more egalitarian reward structures because this choice, though making them poorer, does not
permanently reduce their growth rates, which are determined by the growth rate of the world
technology frontier shaped by innovations in the cutthroat leader.
This result makes it clear that the egalitarian reward structures in the follower countries
are made possible by the positive externalities created by the cutthroat technology leader. So
interpreting the empirical patterns in light of our theoretical framework, one may claim (with all
the usual caveats of course) that the more harmonious and egalitarian Scandinavian societies are
made possible because they are able to benefit from and free-ride on the knowledge externalities
created by the cutthroat American equilibrium.
The rest of our paper shows that our simplifying assumptions are not crucial for these main
insights, and also investigates the impact of other (domestic) institutional arrangements on the
nature of the world equilibrium. First, we characterize the equilibrium of the dynamic game
between (country-level) social planners that choose time-varying reward structures that are best
responses to the current state of the world economy and the strategies of others (more formally,
we look for the Markov perfect equilibrium of the game between the country social planners).
In this case, the equilibrium generally is time varying, but the major insights are similar. An
important di§erence is that in this case, we show that countries that start su¢ciently far from
the frontier will first adopt a cutthroat reward structure, and then switch to a cuddly, more
egalitarian reward structure once they approach the frontier. The reason for this is instructive.
The advantages of being backward, which are at the root of the long-run equilibrium leading
to a stable world income distribution, also imply that the return to greater innovativeness is
higher when a country is far from the world technology frontier. This encourages relatively
backward countries to also adopt a cutthroat reward structure. Nevertheless, once an economy
is su¢ciently close to the world technology frontier, the same forces as in our time-invariant
analysis kick in and encourage these follower economies to change their reward structures in
a more egalitarian, cuddly direction. Thus, under some parameter restrictions, the time path
of an economy has the flavor of the predictions of the “modernization theory,” starting with a
cutthroat reward structure and then changing in a more egalitarian direction to take advantage
of better insurance for their citizens. Nevertheless, the intuition is very di§erent from that
of the approaches based on modernization theory, and the driving force is again the positive
externalities created by the frontier economy.10
10 It is also worth nothing that the broad pattern implied by this analysis is in line with the fact that themore egalitarian reward structures and elements of the welfare state did not arise in follower countries integratedinto the world economy in the postwar era such as South Korea and Taiwan until they became somewhat more
6

Second, we relax the assumption that the world technology frontier is a§ected only by inno-
vation in the most technologically advanced country. We show that our main results extend to
this case, provided that the function aggregating the innovation decisions of all countries into
the world technology frontier is su¢ciently convex. In particular, such convexity ensures that
innovations by the more advanced countries are more important for world technological progress,
and creates the economic forces towards an asymmetric equilibrium, which is at the root of our
main result leading to an endogenous separation between cutthroat and cuddly countries.
Finally, we consider an extension in which we introduce domestic politics as a constraint
on the behavior of the social planner. We do this in a simple, reduced-form, assuming that
in some countries there is a strong labor movement (or social democratic party) ruling out
reward structures that are very unequal. We show that if two countries start at the same level
initially, the labor movement or social democratic party in country 1 may prevent cutthroat
capitalism in that country, inducing a unique equilibrium in which country 2 is the one adopting
the cutthroat reward structure. In this case, however, this is a significant advantage, because
if the two countries start at the same level, the cutthroat country always has lower welfare.
Therefore, a tradition of strong labor movement or social democratic party, by constraining
the actions of the social planner, can act as a commitment device to egalitarianism, inducing an
equilibrium in which the country in question becomes the beneficiary from the asymmetric world
equilibrium. This result highlights that even if we cannot all be like Scandinavians, there are
certain benefits from Scandinavian-type institutions–albeit at the cost of some other country
in the world equilibrium adopting the cutthroat reward structure. This result thus also has
the flavor of the domestic political conflicts in one country being “exported” to another, as the
strength of the unions or the social democratic party in country 1 makes the poor in country 2
su§er more–as country 2 in response adopts a more cutthroat reward structure.11
Our paper is related to several di§erent literatures. First, the issues we discuss are at the core
of the “varieties of capitalism” literature in political science, e.g., Hall and Soskice (2001) which
itself builds on earlier intellectual traditions o§ering taxonomies of di§erent types of capitalism
(Cusack, 2009) or welfare states (Esping-Anderson, 1990). A similar argument has also been
developed by Rodrik (2008). As mentioned above, Hall and Soskice (2001) argue that while both
CME and LMEs are innovative, they innovate in di§erent ways and in di§erent sectors. LMEs
are good at “radical innovation” characteristic of particular sectors, like software development,
biotechnology and semiconductors, while CMEs are good at “incremental innovation” in sectors
such as machine tools, consumer durables and specialized transport equipment (see Taylor, 2004,
and Akkermans, Castaldi, and Los, 2009, for assessments of the empirical evidence on these
issues). This literature has not considered that growth in an CME might critically depends on
prosperous.11There is a parallel between this result and Davis (1998), even though Davis takes institutions as exogenous
and emphasizes a very di§erent mechanism.
7
innovation in the LMEs and on how the institutions of CMEs are influenced by this dependence.
Most importantly, to the best of our knowledge, the point that the world equilibrium may be
asymmetric, and di§erent types of capitalism are chosen as best responses to each other, is new
and does not feature in this literature. Moreover, we conduct our analysis within the context of
a standard dynamic model of endogenous technological change and derive the world equilibrium
from the interaction between multiple countries, which is di§erent from the more qualitative
approach of this literature.
Second, the idea that institutional di§erences may emerge endogenously depending on the
distance to the world technology frontier has been emphasized in past work, for example, in
Acemoglu, Aghion and Zilibotti (2006) (see also Krueger and Kumar, 2004). Nevertheless, this
paper and others in this literature obtain this result from the domestic costs and benefits of
di§erent types of institutions (e.g., more or less competition in the product market), and the
idea that activities leading to innovation are more important close to the world technology
frontier is imposed as an assumption. In our model, this latter feature is endogenized in a
world equilibrium, and the di§erent institutions emerge as best responses to each other. Put
di§erently, the distinguishing feature of our model is that the di§erent institutions emerge as an
asymmetric equilibrium of the world economy–while a symmetric equilibrium does not exist.
Third, our results also have the flavor of “symmetry breaking” as in several papers with
endogenous location of economic activity (e.g., Krugman and Venables, 1996, Matsuyama, 2002,
2005) or with endogenous credit market frictions (Matsuyama, 2007). These papers share with
ours the result that similar or identical countries may end up with di§erent choices and welfare
levels in equilibrium, but the underlying mechanism and the focus are very di§erent.
Fourth, our work relates to the large literature on why the US lacks a European style welfare
state and why Europeans work less. The preponderance of this literature relates these di§er-
ences to di§erent fundamentals. For example, the proportional representation electoral systems
characteristic of continental Europe may lead to greater redistribution (Alesina, Glaeser and Sac-
erdote, 2001, Milesi-Ferretti, Perotti and Rostagno, 2002, Persson and Tabellini, 2003, Alesina
and Glaeser, 2004), or the federal nature of the US may lower redistribution (Cameron, 1978,
Alesina, Glaeser and Sacerdote, 2001), or the greater ethnic heterogeneity of the US may reduce
the demand for redistribution (Alesina, Glaeser and Sacerdote, 2001, Alesina and Glaeser, 2004),
or greater social mobility in the US may mute the desire for redistributive taxation (Piketty,
1995, Bénabou and Ok, 2001, Alesina and La Ferrara, 2005), or redistribution may be greater in
Northern Europe because of higher levels of social capital and trust (Algan, Cahuc and Sang-
nier, 2011). Others argue, perhaps more in the spirit of Hall and Soskice (2001) that there can
be multiple equilibria.12 None of this work contains the core idea of this paper that the institu-
12Piketty (1995) developed a model with multiple steady states driven by self-fulfilling beliefs about socialmobility, and Bénabou and Tirole (2006) developed one with self-fulfilling beliefs about justice. Finally, Bénabou’s(2000) model can simultaneously have one equilibria with high inequality and low redistribution and another with
8
tions of one country interact with those of another and that even with identical fundamentals
asymmetric equilibria are the norm not an exception to explain.13
The rest of the paper is organized as follows. Section 2 introduces the economic environ-
ment. Section 3 presents the main results of the paper under two simplifying assumptions;
first, focusing on a specification where progress in the world technology frontier is determined
only by innovation in the technologically most advanced economy, and second, supposing that
countries have to choose time-invariant reward structures. Under these assumptions and some
plausible parameter restrictions, we show that there does not exist a symmetric world equilib-
rium, and instead, one country plays the role of the technology leader and adopts a cutthroat
reward structure, while the rest choose more egalitarian reward structures. Section 4 establishes
that relaxing these assumptions does not a§ect our main results. Section 5 shows how domestic
political economy constraints can be advantageous for a country because they prevent it from
adopting a cutthroat reward structure. Section 6 concludes, and proofs omitted from the text
are contained in the Appendix.
2 Model
In this section, we first describe the economic environment, which combines two components:
the first is a standard model of endogenous technological change with knowledge spillovers across
J countries–and in fact closely follows Chapter 18 of Acemoglu (2009). The second introduces
moral hazard on the part of entrepreneurs, thus linking entrepreneurial innovative activity of an
economy to its reward structure. We then introduce “country social planners” who choose to
reward structures within their country in order to maximize discounted welfare.
2.1 Economic Environment
Consider an infinite-horizon economy consisting of J countries, indexed by j = 1, 2, ..., J . Each
country is inhabited by non-overlapping generations of agents who live for a period of length
t, work, produce, consume and then die. A continuum of agents, with measure normalized
to 1, is alive at any point in time in each country, and each generation is replaced by the next
generation of the same size. We will consider the limit economy in which t ! 0, represented
as a continuous time model.
low inequality and high redistribution (because redistribution can contribute to growth in the presence of capitalmarket imperfections). See also Saint-Paul and Verdier (1993) and Moene and Wallerstein (1997).13There is also a connection between our work and the literature on “dependency theory” in sociology, developed,
among others, by Cardoso and Faletto (1979) and Wallerstein (1974-2011). (We thank Leopoldo Fergusson forpointing out this connection.) This theory argues that economic development in “core” economies, such asWestern European and American ones, takes place at the expense of underdevelopment in the “periphery,” andthat these two patterns are self-reinforcing. In this theory, countries such as the United States that grow fasterare the winners from this asymmetric equilibrium. In our theory, there is also an asymmetric outcome, thoughthe mechanisms are very di§erent, and indeed ours is more a model of “reverse dependency theory,” since it isthe Scandinavian “periphery” which, via free-riding, is benefiting from this asymmetric equilibrium.
9
The aggregate production function at time t in country j is
Yj (t) =1
1
Z Nj(t)
0xj(, t)
1d
!Lj , (1)
where Lj is labor input, Nj (t) denotes the number of machine varieties (or blueprints for machine
varieties) available to country j at time t. In our model, Nj (t) will be the key state variable and
will represent the “technological know-how” of country j at time t. We assume that technology
di§uses slowly and endogenously across countries as will be specified below. Finally, xj (, t) is
the total amount of machine variety used in country j at time t. To simplify the analysis,
we suppose that x depreciates fully after use, so that the x’s are not additional state variables.
Crucially, blueprints for producing these machines, captured by Nj (t), live on, and the increase
in the range of these blueprints will be the source of economic growth.
Each machine variety in economy j is owned by a technology monopolist, “entrepreneur,”
who sells machines embodying this technology at the profit-maximizing (rental) price pxj (, t)
within the country (there is no international trade). This monopolist can produce each unit of
the machine at a marginal cost of in terms of the final good, and without any loss of generality,
we normalize 1 .Suppose that each worker/entrepreneur exerts some e§ort ej,i (t) 2 {0, 1} to invent a new
machine. E§ort ej,i (t) = 1 costs > 0 units of time, while ej,i (t) = 0 has no time cost.
Thus, entrepreneurs who exert e§ort consume less leisure, which is costly. We also assume
that entrepreneurial success is risky. When the entrepreneur exerts e§ort ej,i (t) = 1, he is
“successful” with probability q1 and unsuccessful with the complementary probability. If he
exerts e§ort ej,i (t) = 0, he is successful with the lower probability q0 < q1. Throughout we
assume that e§ort choices are private information.
We assume the utility function of entrepreneur/worker i takes the form
U (Cj,i (t) , ej,i (t)) =[Cj,i (t) (1 ej,i (t))]1 1
1 , (2)
where 0 is the coe¢cient of relative risk aversion (and the inverse of the intertemporal
elasticity of substitution), and this form ensures balanced growth.14
We assume that workers can simultaneously work as entrepreneurs (so that there is no
occupational choice). This implies that each individual receives wage income as well as income
from entrepreneurship, and also implies that Lj = 1 for j = 1, ..., J .
An unsuccessful entrepreneur does not generate any new ideas (blueprints), while a successful
entrepreneur in country j generates
N (t)Nj (t)1 ,
14When = 1, the utility function in (2) converges to lnCj,i (t) + ln (1 ej,i (t)). All of our results apply tothis case also, but in what follows we often do not treat this case separately to save space.
10

new ideas for machines, where N (t) is an index of the world technology frontier, to be endo-
genized below, and > 0 and > 0 are assumed to be common across the J countries. This
form of the innovation possibilities frontier implies that the technological know-how of country
j advances as a result of the R&D and other technology-related investments of entrepreneurs in
the country, but the e§ectiveness of these e§orts also depends on how advanced the world tech-
nology frontier is relative to this country’s technological know-how. When it is more advanced,
then the same sort of successful innovation will lead to more rapid advances, and the parameter
measures the extent of this.
Given the likelihood of success by entrepreneurs as a function of their e§ort choices and
defining ej (t) =Rej,i (t) di, technological advance in this country can be written as:
Nj (t) = (q1ej (t) + q0(1 ej (t))) N (t)Nj (t)1 , (3)
We also assume that monopoly rights over the initial set of ideas are randomly allocated
(independent of e§ort) to some of the current entrepreneurs, so that they are also produced
monopolistically.15
Throughout, we maintain the following assumption:16
Assumption 1:
minnq1(1 )1 q0 , (1 q0) (1 q1)(1 )1
o> 0
Finally, the world technology frontier is assumed to be given by
N (t) = G(N1 (t) , ..., NJ (t)), (4)
where G is a linearly homogeneous function. We will examine two special cases of this function.
The first is
G(N1 (t) , ..., NJ (t)) = max {N1 (t) , ..., NJ (t)} . (5)
which implies that the world technology frontier is given by the technology level of the most
advanced country, the technology leader, and all other countries benefit from the advances of
this technological leader. The second is a more general convex aggregator
G(N1 (t) , ..., NJ (t)) =1
J
2
4JX
j=1
Nj (t)1
3
5
1
, (6)
with < 0. As " 0 (6) converges to (5). For much of the analysis, we focus on the simplerspecification (5), though at the end of Section 4 we show that our general results are robust
when we use (6) with su¢ciently small.15The alternative is to assume that existing machines are produced competitively. This has no impact on any
of the results in the paper, and would just change the value of B in (10) below.16This assumption ensures that, both when < 1 and when > 1, e§ort will only be forthcoming if entrepre-
neurs are given incentives. That is, it is su¢cient to guarantee that with the same consumption conditional onsuccess and failure, no entrepreneur would choose to exert e§ort. Why Assumption 1 ensures this can be seenfrom equation (9).
11
2.2 Reward Structures
As noted above, entrepreneurial e§ort levels will depend on the reward structure in each country,
which determines the relative rewards to successful entrepreneurship. In particular, suppressing
the reference to country j to simplify notation, let Rs (t) denote the time t entrepreneurial
income for successful entrepreneurs and Ru (t) for unsuccessful entrepreneurs. Thus the total
income of a worker/entrepreneur is
Ri (t) = Ri (t) + w (t) ,
where w (t) is the equilibrium wage at time t.17 In what follows, it is su¢cient to look at the total
income Ri rather than just the entrepreneurial component Ri. The reward structure can then
be summarized by the ratio r (t) Rs (t) /Ru (t). When r (t) = 1, there is perfect consumptioninsurance at time t, but this generates e§ort e = 0. Instead, to encourage e = 1, the summary
index of the reward structure r (t) needs to be above a certain threshold, which we characterize
in the next section.
This description makes it clear that countries will have a choice between two styles of capi-
talism: “cutthroat capitalism” in which r (t) is chosen above a certain threshold, so that entre-
preneurial success is rewarded while failure is at least partly punished, and “cuddly capitalism”
in which r (t) = 1, so that there is perfect equality and consumption insurance, but this comes
at the expense of lower entrepreneurial e§ort and innovation.
Throughout we assume that the sequence of reward structures in country j, [rj (t)]1t=0 is
chosen by its country-level social planner. This assumption enables us to construct a simple
game between countries (in particular, it enables us to abstract from within-country political
economy issues until later). Limiting the social planner to only choose the sequence of reward
structures is for simplicity and without any consequence.18
The most natural objective function for the social planner is the discounted welfare of the
citizens in that country, given by
Z 1
0et
ZU (Cj,i (t) , ej,i (t)) di
dt =
Z 1
0et
Z[Cj,i (t) (1 ej,i (t))]1 1
1 di
!dt,
(7)
where is the discount rate that the social planner applies to future generations and
U (Cj,i (t) , ej,i (t)) denotes the utility of agent i in country j alive at time t (and thus the
inner integral averages across all individuals of that generation). One disadvantage of this ob-
jective function is that it imposes that the inverse of the intertemporal elasticity of substitution
is equal to the coe¢cient of relative risk aversion. Since comparative statics with respect to the
17Thus both Ru (t) and Rs (t) include the rents that entrepreneurs make in expectation because of existingideas being randomly allocated to them.18 If we allow the social planner to set prices that prevent the monopoly markup, nothing in our analysis below,
except that the value of B in (10), would change.
12
coe¢cient of relative risk aversion are of interest, this feature is not desirable. For this reason,
we will also discuss the results with Epstein-Zin preferences for social planners (Epstein and Zin,
1989), which separate the coe¢cient of relative risk aversion from the intertemporal elasticity
of substitution. These preferences, in continuous time, take the form:
2
4Z 1
0et
"Z [Cj,i (t) (1 ej,i (t))]1
1
!di
# 11
dt
3
5
11
, (8)
where is still the coe¢cient of relative risk aversion, but now the inverse of the intertemporal
elasticity of substitution is given by . When = , we got back to (7).
3 Equilibrium with Time-Invariant Reward Structures
In this section, we simplify the analysis by assuming that the reward structure for each country j
is time-invariant, i.e., rj (t) = rj , and is chosen at time t = 0. This assumption implies that each
country chooses between “cuddly” and “cutthroat” capitalism once and for all, and enables us
to characterize the structure of the world equilibrium in a transparent manner, showing how this
equilibrium often involves di§erent choices of reward structures across countries–in particular,
one country choosing cutthroat capitalism while the rest choose cuddly capitalism. In this
section, we focus on the “max” specification of the world technology frontier given by (5), and
we also start with the simpler objective for the social planner given by the discounted utilities
of di§erent generations as in (7).
3.1 World Equilibrium Given Reward Structures
We first characterize the dynamics of growth for given (time-invariant) reward structures. The
following proposition shows that a well-defined world equilibrium exists and involves all coun-
tries growing at the same rate, set by the rate of growth of the world technology frontier. This
growth rate is determined by the innovation rates (and thus reward structures) of either all coun-
tries (with (6)) or the leading country (with (5)). In addition, di§erences in reward structures
determine the relative income of each country.
Proposition 1 Suppose that the reward structure for each country is constant over time (i.e.,
for each j, Rjs (t) /Rju (t) = rj). Then starting from any initial condition (N1 (0) , ..., NJ (0)),
the world economy converges to a unique stationary distribution (n1, ..., nJ), where nj (t)
Nj (t) /N (t) and N (t) /N (t) = g, and (n1, ..., nJ) and g
are functions of (r1, ..., rJ). Moreover,
with the max specification of the world technology frontier, (5), g is only a function of the most
innovative country’s reward structure, r`.
Proof. The proof of this proposition follows from the material in Chapter 18 of Acemoglu
(2009) with minor modifications and is omitted to save space.
13
The process of technology di§usion ensures that all countries grow at the same rate, even
though they may choose di§erent reward structures. In particular, countries that do not en-
courage innovation will first fall behind, but given the form of technology di§usion in equation
(3), the advances in the world technology frontier will also pull them to the same growth rate
as those that provide greater inducements to innovation. The proposition also shows that in
the special case where (5) applies, it will be only innovation and the reward structure in the
technologically most advanced country that determines the world growth rate, g.
3.2 Cutthroat and Cuddly Reward Structures
We now define the cutthroat and cuddly reward structures. Consider the reward structures that
ensure e§ort e = 1 at time t. This will require that the incentive compatibility constraint for
entrepreneurs be satisfied at t, or in other words, expected utility from exerting e§ort e = 1
should be greater than expected utility from e = 0. Using (2), this requires
1
1
q1Rs (t)
1 + (1 q1)Ru (t)1(1 )1
1
1
q0Rs (t)
1 + (1 q0)Ru (t)1,
where recall that Rs (t) is the income and thus the consumption of an entrepreneur/worker
conditional on successful innovation, and Ru (t) is the income level when unsuccessful, and this
expression takes into account that high e§ort leads to success with probability q1 and low e§ort
with probability q0, but with high e§ort the total amount of leisure is only 1 . Rearranging
this expression, we obtain
r (t) Rs (t)
Ru (t)
(1 q0) (1 q1)(1 )1
q1(1 )1 q0
11
=
1 +
1 (1 )1
q1(1 )1 q0
11
A. (9)
Clearly, the expression A defined in (9) measures how “high-powered” the reward structure needs
to be in order to induce e§ort, and will thus play an important role in what follows. Assumption
1 is su¢cient to ensure that A > 1.19
Since the social planner maximizes average utility, she would like to achieve as much con-
sumption insurance as possible subject to the incentive compatibility constraint (9), which im-
plies that she will satisfy this constraint as equality. In addition, Rs (t) and Ru (t) must satisfy
the resource constraint at time t. Using the expression for total output and expenditure on
machines provided in the Appendix, this implies
q1Rs (t) + (1 q1)Ru (t) = BNj (t)
19 In particular, when < 1, 1+ 1(1)1
q1(1)1q0is greater than one and is raised to a positive power, while when
> 1, it is less than one and it is raised to a negative power.
14
where
B (2 )1
, (10)
and we are using the fact that in this case, all entrepreneurs will exert high e§ort, so a fraction
q1 of them will be successful. Combining this expression with (9), we obtain
Rs (t) =BA
q1A+ (1 q1)Nj (t) and Ru (t) =
B
q1A+ (1 q1)Nj (t) . (11)
The alternative to a reward structure that encourages e§ort is one that forgoes e§ort and
provides full consumption insurance–i.e., the same level of income to all entrepreneur/workers
of R0 (t), regardless of whether they are successful or not. In this case, the same resource
constraint implies
R0 (t) = BNj (t) . (12)
Given these expressions, the expected utility of entrepreneurs/workers under the “cutthroat”
and “cuddly” capitalist systems, denoted respectively by s = c and s = o, can be rewritten as
W cj (t) E
UCcj (t) , e
cj (t)
=
q1Rs (t)
1 + (1 q1)Ru (t)1(1 )1 1
1 ,
W oj (t) E
UCoj (t) , e
oj (t)
=R0 (t)
1 11
.
Now using (11) and (12), we can express these expected utilities as:20
W cj (t) = !cNj (t)
1 1
1 and W o
j (t) = !oNj (t)1
1
1 ,
where
!c q1A
1 + (1 q1)(1 )1
(q1A+ (1 q1))1B1
1 and !o
B1
1 . (13)
It can be verified that !c < !o, though when > 1, it important to observe that we have
!c < !o < 0. It can also be established straightforwardly that !c, and thus (!c/!o)1/(1), is
decreasing in A, defined in (9), (since a higher A translates into greater consumption variability);
that A (and thus (!c/!o)1/(1)) is increasing in (to compensate for the higher cost of e§ort);
and that A is non-monotone in (because a higher coe¢cient of relative risk aversion also
reduces the disutility of e§ort).
From (3), the growth rate of technology of country j adopting reward structure sj 2 {c, o}can be derived as
Nj (t) = gsjN (t)Nj (t)
1
where the growth rates gsj 2 {gc, go} are given by
go q0, and gc q1.20 In what follows, we will also drop the constant 1/ (1 ) in W c
j (t) and Woj (t) when this causes no confusion.
15
This reiterates that at any point in time, a country choosing a cutthroat reward structure will
have a faster growth of its technology stock.
We next introduce a second assumption, which ensures that the cutthroat growth rate, gc,
is not so high as to lead to infinite welfare for the country social planners and will also be
maintained throughout (without explicitly being stated):
Assumption 2:
(1 ) gc > 0.
3.3 Equilibrium Reward Structures
We now characterize the equilibrium of the game between the country social planners. Since re-
ward structures are chosen once and for all at time t = 0, the interactions between the country so-
cial planners can be represented as a static game with the payo§s given as the discounted payo§s
implied by the reward structures of all countries (given initial conditions {N1 (0) , ..., NJ (0)}).We will characterize the Nash equilibria of this static game. We also restrict attention to the sit-
uation in which the same country, denoted `, remains the technology leader throughout. Given
our focus on the world technology frontier specification in (5), the fact that this country is the
leader implies at each t implies that N` (t) = max {N1 (t) , ..., NJ (t)} for all t. This assumptionsimplifies the exposition in this section.21
We next introduce the key condition which will ensure that the technology leader prefers
a cutthroat reward structure. It is straightforward to verify that when this condition is not
satisfied, all countries will choose a cuddly reward structure. Thus this condition restricts
attention to the interesting part of the parameter space.
Condition 1:!c
(1 )gc>
!o (1 )go
.
Why this condition ensures that the technology leader, country `, prefers a cutthroat reward
structure can be seen straightforwardly by noting that when the growth rate of the world tech-
nology frontier is determined by innovation in country `, !c(1)gc is the discounted value from
such a cutthroat reward structure, while the discounted value of a cuddly reward structure is!o
(1)go given that all other countries are choosing a cuddly strategy.22
Now recalling that nj(t) Nj (t) /N (t) = Nj (t) /N` (t), for j 6= ` we have
nj(t)
nj(t)=
N` (t)
Nj (t)
gsj g` = nj(t)
gsj g`.
21Essentially, it enables us to pick a unique equilibrium among asymmetric equilibria. A byproduct of theanalysis in Section 5 is to show how this assumption can be relaxed without a§ecting our main results.22 If the country in question chose a cuddly reward structure while some other country chose the cutthroat
structure, then this other country would necessarily become the leader at some point. Here we are restrictingattention to the case in which this other country would be the leader from the beginning, which is without muchloss of generality.
16
where g` = gc, and we have imposed that the leader is choosing a cutthroat reward structure.
This di§erential equation’s solution is
Nj (t) =
Nj (0)
+gsjgc
egct 1
(N` (0))
1
, (14)
enabling us to evaluate the welfare of the country j social planner from reward structure sj 2{c, o}:
Wj(sj) =
Z 1
0etW
sjj (t) =
Z 1
0et!sjN` (0)
1nj(0)
+gsjgc
egct 1
1
dt (15)
= !sjN` (0)1
gsjgc
1Z 1
0e((1)gc)t
1 +
gcgsjnj (0)
1egct
1
dt ,
where recall that nj(0) Nj (0) /N` (0). The second line of (15) highlights that, under Condition1, the long-run growth rate of all countries will be gc, and thus ensure that these welfare levels
are well defined. This implies the following straightforward result:
Proposition 2 Suppose that each country chooses a time-invariant reward structure at time
t = 0. Suppose also that country social planners maximize (7), the world technology frontier is
given by (5), Condition 1 holds, and
!c!o
11
<
gogc
1
0
BB@
R10 e((1)gc)t
1 +
gcgonj (0)
1egct
1dt
R10 e((1)gc)t
1 +
nj (0)
1egct
1dt
1
CCA
11
for each j 6= `.
(16)
Then there exists no symmetric equilibrium. Moreover, there exists a unique world equilibrium in
which the initial technology leader, country ` remains so throughout, and this equilibrium involves
country ` choosing a cutthroat reward structure, while all other countries choose a cuddly reward
structure. In this world equilibrium, country ` grows at the rate gc throughout, while all other
countries asymptotically grow also at this rate, and converge to a level of income equal to a
fraction go/gc of the level of income of country `.
Proof. Suppose first that country ` chooses a cutthroat reward structures throughout. Then
the result that country j strictly prefers to choose a cuddly reward structure follows immediately
from comparing Wj(c) and Wj(o) given by (15) (remembering that when > 1, we have !c <
!o < 0 and thus the direction of inequality is reversed twice, first when we divide by !o and
second when we raise the left-hand side to the power 1/ (1 )).The result that there exists no symmetric equilibrium in which all countries choose the same
reward structure follows from this observation: when (16) holds, all j 6= ` will choose a cuddly
reward structure when ` chooses a cutthroat one; and Condition 1 implies that when j 6= `
17
choose a cuddly reward structure, country ` strictly prefers to choose a cutthroat one. This also
characterizes the unique equilibrium in which ` remains the technology leader throughout.
Finally, convergence to a unique stationary distribution of income with the same asymptotic
growth rate follows from Proposition 1, and the ratio of income between the leader and followers
in this stationary distribution is given from the limit of equation (14).
The important implication is that, under the hypotheses of the proposition, the world equilib-
rium is necessarily asymmetric–i.e., a symmetric equilibrium does not exist. Rather, it involves
one country choosing a cutthroat reward structure, while all others choose cuddly reward struc-
tures. The intuition for this result comes from the di§erential impacts of the leader, country `,
and non-leader countries on the world growth rate. Because country `’s innovations and reward
structure determine the pace of change of the world technology frontier, if it were to switch from
a cutthroat to a cuddly reward structure, this would have a growth e§ect on the world economy
(and thus on itself). The prospect of permanently lower growth discourages country ` from
choosing a cuddly reward structure. In contrast, any other country deviating from the asym-
metric equilibrium and choosing a cutthroat reward structure would only enjoy a beneficial level
e§ect : such a country would increase its position relative to country `, but would not change
its long-run growth rate (because its growth rate is already high thanks to the spillovers from
the cutthroat incentives that country ` provides to its entrepreneurs). The contrast between the
growth e§ect of the reward structure of the leader and the level e§ect of the reward structure
of followers is at the root of the asymmetric equilibrium (and the non-existence of asymmetric
equilibrium).23
Condition (16), which ensures that the world equilibrium is asymmetric, is in terms of the
ratio of two integrals which do not in general have closed-form solutions. Nevertheless, the
special case where = 1 admits a closed-form solution and is useful to illustrate the main
insights. In particular, in this case (16) simplifies to :
!c!o
<
gogc
0
@R10 e(gc)t
1 +
gcgonj (0)
1egct
dt
R10 e(gc)t
1 +
nj (0)
1egct
dt
1
A =nj (0)
( gc) + gonj (0)
( gc) + gc(17)
Inspection of (17) shows that an asymmetric equilibrium is more likely to emerge when nj (0) is
close to 1 for all followers–since the last expression is strictly increasing in nj (0). This implies
that, bearing in mind that country ` is the technology leader initially, the asymmetric equilibrium
is more likely to emerge when all countries are relatively equal to start with. Intuitively, the
innovation possibilities frontier (3) implies that a country that is further behind the world
23Naturally, with any asymmetric equilibrium of this type, there are in principle several equilibria, with onecountry playing the role of the leader and choosing a cutthroat reward structure, while others choose cuddlyreward structures. Uniqueness here results from the fact that we have imposed that the same country remainsthe leader throughout, which picks the initial technology leader as the country choosing the cutthroat rewardstructure.
18
technology frontier (i.e., low nj (0)) has a greater growth potential–and in fact will grow faster
for a given level of innovative activity. This also implies that the additional gain in growth
from choosing a cutthroat reward structure is greater the lower is nj (0). Consequently, for
countries that are significantly behind the world technology frontier (or behind country `), the
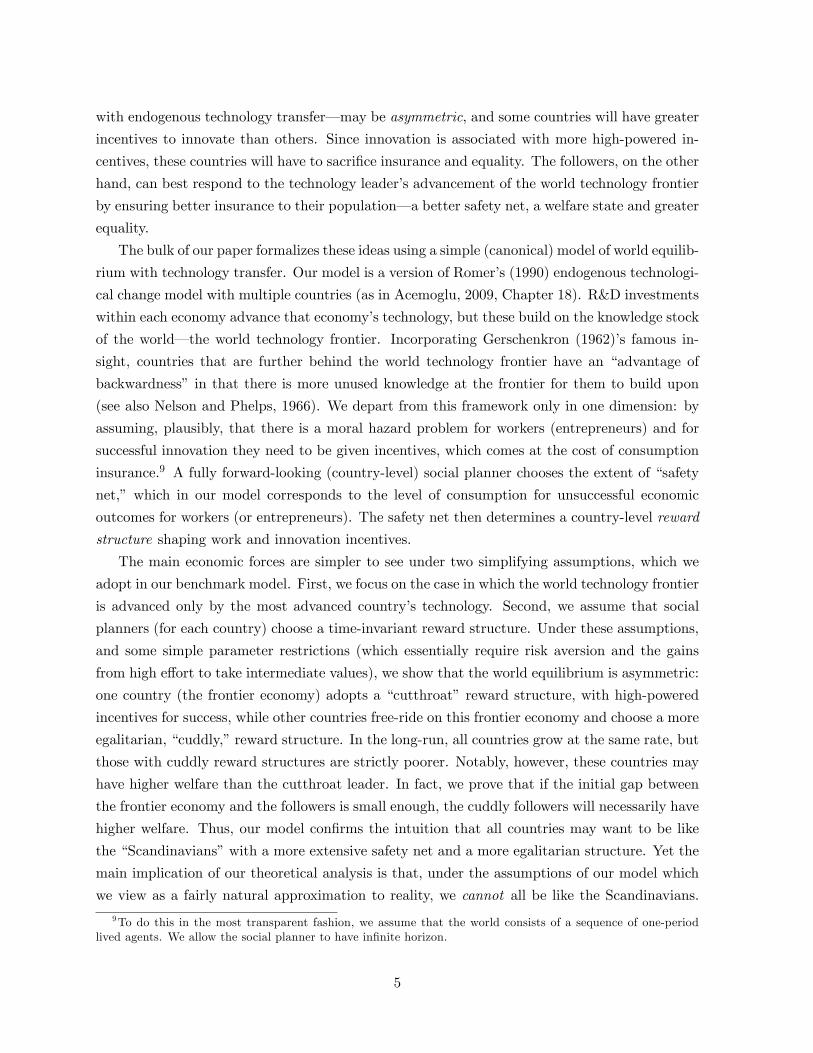
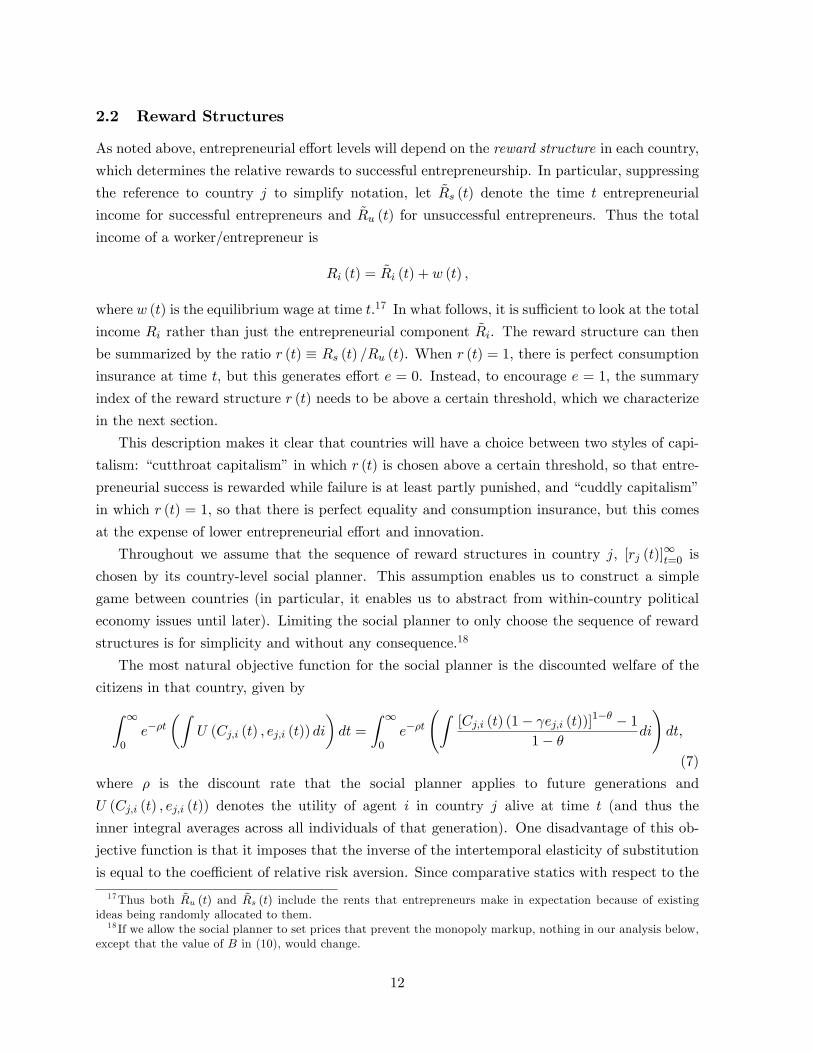
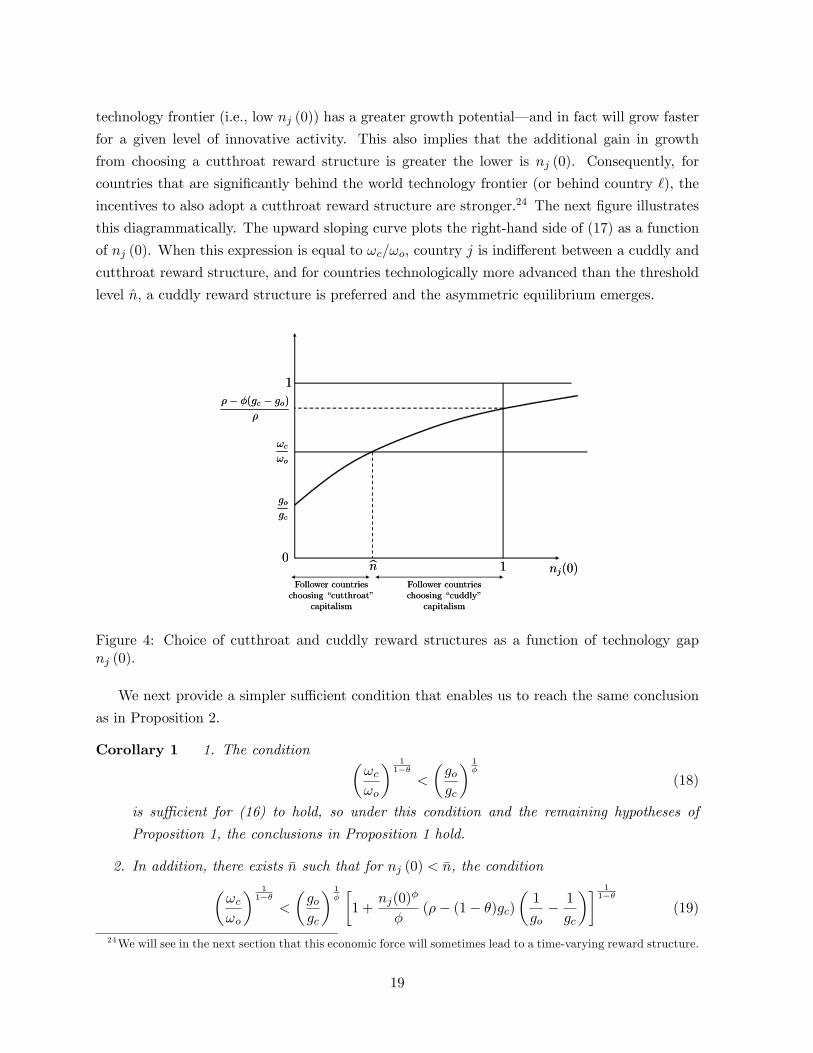
incentives to also adopt a cutthroat reward structure are stronger.24 The next figure illustrates
this diagrammatically. The upward sloping curve plots the right-hand side of (17) as a function
of nj (0). When this expression is equal to !c/!o, country j is indi§erent between a cuddly and
cutthroat reward structure, and for countries technologically more advanced than the threshold
level n, a cuddly reward structure is preferred and the asymmetric equilibrium emerges.
Figure 4: Choice of cutthroat and cuddly reward structures as a function of technology gapnj (0).
We next provide a simpler su¢cient condition that enables us to reach the same conclusion
as in Proposition 2.
Corollary 1 1. The condition!c!o
11
<
gogc
1
(18)
is su¢cient for (16) to hold, so under this condition and the remaining hypotheses of
Proposition 1, the conclusions in Proposition 1 hold.
2. In addition, there exists n such that for nj (0) < n, the condition
!c!o
11
<
gogc
11 +
nj(0)
( (1 )gc)
1
go1
gc
11
(19)
24We will see in the next section that this economic force will sometimes lead to a time-varying reward structure.
19
is su¢cient for (16) to hold, so under this condition and the remaining hypotheses of
Proposition 1, the conclusions in Proposition 1 hold.
Proof. See the Appendix, where we also prove that the su¢cient condition (18) is satisfied for
a non-empty set of parameter values.
We next provide a simple result characterizing when Condition 1 (which ensures that the
leader prefers a cutthroat reward structure) and (18) (which ensures that followers choose a
cuddly reward structure) are simultaneously satisfied. This result illustrates the role of risk
aversion in the asymmetric equilibria described above.25
Corollary 2 1. Condition (18) is satisfied for 2 (0, ) (where 1 q
q0(1q0)q1(1q1)
) and
(, ) where > 0 and 0 < (, ) <1. Moreover (, ) is decreasing in and.
2. Condition 1 is satisfied for 20, and 2 ((, ), (1 )gc), where > 0. Moreover
(, ) is decreasing in and in .
Therefore, this corollary implies that, under the specified conditions, the asymmetric equi-
librium will arise (or more accurately, the su¢cient conditions for an asymmetric equilibria will
be satisfied) when (, ), i.e., when the coe¢cient of relative risk aversion is su¢ciently
high. But to ensure Assumption 2 also holds, this coe¢cient needs to be less than some thresh-
old > 1. Note, however, that as increases (so that there are greater technology spillovers
from the leader to followers), (, ) decreases, making these conditions more likely to be sat-
isfied. Naturally, as the second part of the corollary specifies, we also need not to be too
small, otherwise it would not be a best response for the technology leader to choose a cutthroat
reward structure. Though intuitive, this corollary su§ers from the feature that changes in not
only correspond to changes in the coe¢cient of relative risk aversion but also to changes in the
intertemporal elasticity of substitution. For this reason, the next subsection considers the more
general preferences in (8) which separate these two parameters.
Remark 1 We have so far restricted countries to choose either cutthroat or cuddly reward
structures for all of their entrepreneurs. In the next section, we allow for mixed reward structures
whereby some entrepreneurs are given incentives to exert high e§ort, while others are not. It is
straightforward to see that in this case, (16) continues to be su¢cient, together with Assumptions
1-3, for there not to exist a symmetric equilibrium, but is no longer necessary. Su¢ciency
follows simply from the following observation: condition (16) implies that for followers a cuddly
reward structure is preferred to a cutthroat one, so even when intermediate reward structures
are possible, the equilibrium will not involve a cutthroat reward structure, hence will not be
25Recall, however, that (18) is a su¢cient condition–not the exact condition– for such a symmetric equilibriato exist.
20

symmetric. The reason why (16) is not necessary is that when > 1 , welfare is concave in
the fraction of agents receiving cutthroat incentives (as we show in the next section), and thus
even if a cuddly reward structure is not preferred to a cutthroat one, an intermediate one may
be. In particular, denoting the fraction of entrepreneurs receiving cutthroat incentives by u, the
necessary condition for the follower to adopt a cuddly reward structure is
@Wj (u = 0)
@u= (!c !o)
Z 1
0et
nj(0)
+ egct 1 1
dt
+(1 )!c(gc go)
gc
Z 1
0et
nj(0)
+egct 1
11
egct 1dt < 0.
We can also note that under Assumptions 1 and 2 and Condition 1, there cannot be a fully
mixed reward structure equilibrium where all countries choose a fraction u of entrepreneurs to
receive cutthroat incentives. Suppose that all countries, except the technology leader, choose a
mixed reward structure with the fraction u of entrepreneurs receiving cutthroat incentives. If
the leader also chose u, it would remain the leader forever, with discounted utility of
W` (u) =
!cu + !o(1 u)
(1 ) (gcu + go(1 u))which is strictly increasing in u, so that the leader would in fact prefer fully cutthroat rewards.
3.4 The E§ects of Risk Aversion
To study the e§ects of risk aversion, we first show that the results derived so far apply with the
Epstein-Zin preferences for this social planner as in (8) (Epstein and Zin, 1989). To do this, we
first need to modify Assumption 2 and Condition 1 by substituting for instead of (since it
is the intertemporal elasticity of substitution that matters in this case):
Assumption 20:
(1 ) gc > 0.
Condition 10:
!c!o
11
>
(1 )gc (1 )go
11
.
We can then establish a generalization of Proposition 2 that applies with social planner
preferences given by (8).
Proposition 3 Suppose that each country chooses a time-invariant reward structure at time
t = 0. Suppose also that country social planners maximize (8); the world technology frontier is
given by (5); Assumptions 1 and 20and Condition 1
0hold; and
!c!o
11
<
gogc
1
0
BB@
R10 e((1)gc)t
1 +
gcgonj (0)
1egct
1dt
R10 e((1)gc)t
1 +
nj (0)
1egct
1dt
1
CCA
11
for each j 6= `.
(20)
21
Then there exists no symmetric equilibrium. Moreover, there exists a unique world equilibrium in
which the initial technology leader, country ` remains so throughout, and this equilibrium involves
country ` choosing a cutthroat reward structure, while all other countries choose a cuddly reward
structure. In this world equilibrium, country ` grows at the rate gc throughout, while all other
countries asymptotically grow also at this rate, and converge to a level of income equal to a
fraction go/gc of the level of income of country `.
Proof. The proof is essentially identical to that of Proposition 2 after noting that with (8),
following the same steps as above, welfare is given by:
Wj(sj) =
Z 1
0et
Wsjj (t)
11
dt
11
= !1
1sj N` (0)
gsjgc
1
"Z 1
0e((1)gc)t
1 +
gcgsjnj (0)
1egct
1
dt
# 11
.
Therefore, with the more general Epstein-Zin preferences given in (8), Proposition 2 remains
essentially unchanged except that , as the inverse of the intertemporal elasticity of substitution,
replaces in the integrals. This also immediately implies that Corollary 1 also applies in this
case and we do not state it to save space. The more interesting implication of these more general
preferences arises when we turn to the implications of changes in the coe¢cient of relative risk
aversion. The following corollary strengthens Corollary 2 and shows that asymmetric equilibria
are more likely to arise for intermediate values of the coe¢cient of relative risk aversion.
Corollary 3 Suppose 1q
q0(1q0)q1(1q1)
. Then Conditions 10and (20) are jointly satisfied
for intermediate values of the coe¢cient of relative risk aversion .
Proof. Conditions 10and (20) are jointly satisfied if
(1 )gc (1 )go
11
<
!c!o
11
<
gogc
1
0
BB@
R10 e((1)gc)t
1 +
gcgonj (0)
1egct
1dt
R10 e((1)gc)t
1 +
nj (0)
1egct
1dt
1
CCA
11
.
Only the middle term depends on . Straightforwardly, this term is decreasing in for given A
and also decreasing in A. Moreover, as shown in the proof of Corollary 2, A is decreasing in for
. Thus!c!o
11
is monotonically decreasing in . Furthermore, lim!max!c!o
11
= 0
for max 1log(
1q01q1
)
log(1) > 1, establishing the corollary.
This result is intuitive: if the coe¢cient of relative risk aversion is too high, then no country,
not even those at the frontier, would adopt cutthroat incentives, and if there is very limited risk
aversion, then all countries are more likely to choose cutthroat incentives.
22
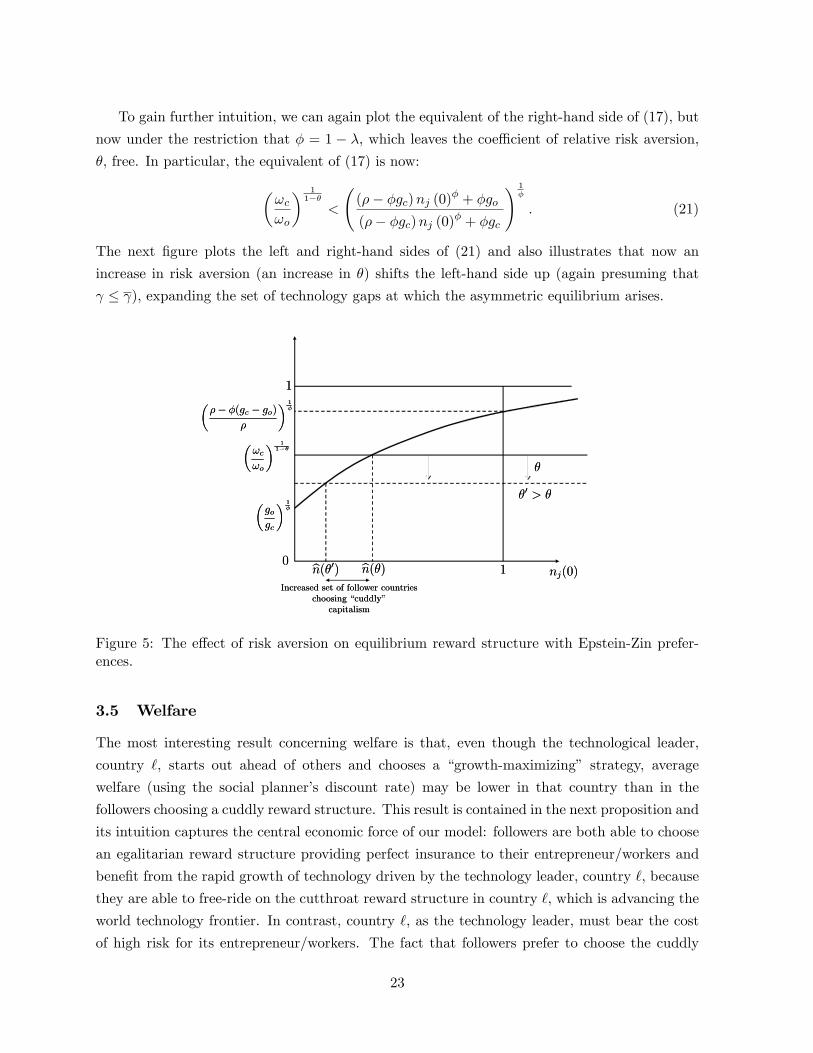
To gain further intuition, we can again plot the equivalent of the right-hand side of (17), but
now under the restriction that = 1 , which leaves the coe¢cient of relative risk aversion,
, free. In particular, the equivalent of (17) is now:
!c!o
11
<
( gc)nj (0) + go( gc)nj (0) + gc
! 1
. (21)
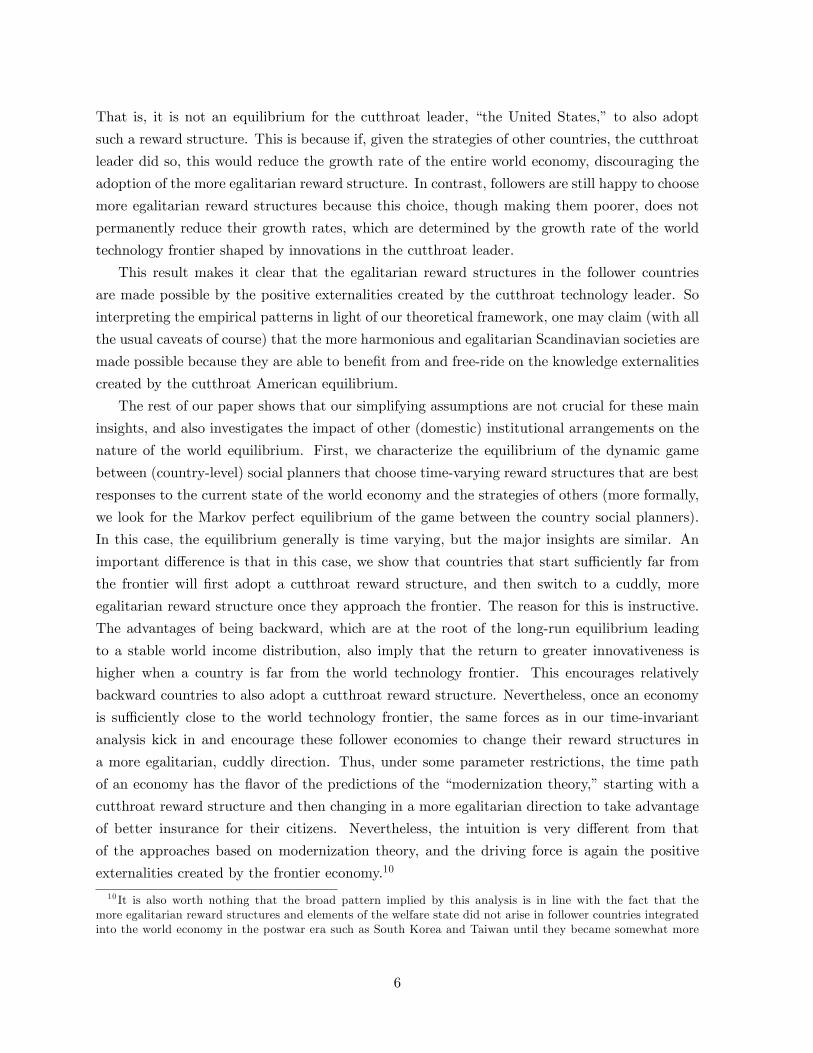
The next figure plots the left and right-hand sides of (21) and also illustrates that now an
increase in risk aversion (an increase in ) shifts the left-hand side up (again presuming that
), expanding the set of technology gaps at which the asymmetric equilibrium arises.
Figure 5: The e§ect of risk aversion on equilibrium reward structure with Epstein-Zin prefer-ences.
3.5 Welfare
The most interesting result concerning welfare is that, even though the technological leader,
country `, starts out ahead of others and chooses a “growth-maximizing” strategy, average
welfare (using the social planner’s discount rate) may be lower in that country than in the
followers choosing a cuddly reward structure. This result is contained in the next proposition and
its intuition captures the central economic force of our model: followers are both able to choose
an egalitarian reward structure providing perfect insurance to their entrepreneur/workers and
benefit from the rapid growth of technology driven by the technology leader, country `, because
they are able to free-ride on the cutthroat reward structure in country `, which is advancing the
world technology frontier. In contrast, country `, as the technology leader, must bear the cost
of high risk for its entrepreneur/workers. The fact that followers prefer to choose the cuddly
23
reward structure implies that, all else equal, the leader, country `, would have also liked to
but cannot do so, because it realizes that if it did, the growth rate of world technology frontier
would slow down–while followers know that the world technology frontier is being advanced by
country ` and can thus free-ride on that country’s cutthroat reward structure.
Proposition 4 Suppose that countries are restricted to time-invariant reward structures, and
Condition 1 and (16) (or Condition 10and (20)) hold, so that country ` adopts the cutthroat
strategy and country j adopts the cuddly strategy. Then their exists > 0 such that for all
nj (0) > 1 , welfare in country j is higher than welfare in country `.
Proof. Consider the case where n` (0) = nj (0). Then the result follows immediately from (16)
(or (20)), since, given this condition, country j strictly prefers to choose a cuddly rather than a
cutthroat reward structure. If it were to choose a cutthroat structure, it would have exactly the
same welfare as country `. Next by continuity, this is also true for nj (0) > 1 for su¢cientlysmall and positive.
4 Equilibrium with Time-Varying Rewards Structures
In this section, we relax the assumption that reward structures are time-invariant, and thus
assume that each country chooses sj(t) 2 {c, o} at time t, given the strategies of other countries,thus defining a di§erential game among the J countries. We focus on the Markov perfect
equilibria of this di§erential game, where strategies at time t are only conditioned on payo§
relevant variables, given by the vector of technology levels. To start with, we focus on the world
technology frontier given by (5), and at the end, we will show that the most important insights
generalize to the case with general aggregators of the form (6) provided that these aggregators
are su¢ciently “convex,” i.e., putting more weight on technologically more advanced countries.
Throughout this section, we also suppose that country social planners maximize (7).
4.1 Main Result
In this subsection, we focus on the world technology frontier given by (5), and also assume that
at the initial date, there exists a single country ` that is the technology leader, i.e., a single ` for
which N` (0) = max {N1 (0) , ..., NJ (0)}. We also allow follower countries to provide cutthroatreward structures to some of their entrepreneurs while choosing a cuddly reward structure for
the rest. Hence, we define uj (t) as the fraction of entrepreneurs receiving a cutthroat reward
structure,26 and thus
! (uj(t)) = !o(1 uj(t)) + !cuj(t)
g((uj(t)) = go(1 uj(t)) + gcuj(t),26 It is straightforward to see that it is never optimal to give any entrepreneur any other reward structures than
perfect insurance or the cutthroat reward structure that satisfies the incentive compatibility constraint as equality
24
with uj (t) 2 [0, 1], and uj (t) = 0 at all points in time corresponds to a cuddly reward structureand uj (t) = 1 for all time is cutthroat throughout, like those analyzed in the previous section.
The problem of the country j social planner can then be written as
Wj(Nj (t) ,N` (t)) = maxuj(·)2[0,1]
Z 1
te(t)! (uj())Nj ()
1 d (22)
such that Nj () = g((uj()) N` ()Nj ()
1 ,
with N` () = N (t) egc(t) (for t).
Depending on what the country j social planner can condition on for the choice of time t reward
structure, this would correspond to either a “closed loop” or “open loop” problem–i.e., one
in which the strategies are chosen at the beginning or are updated as time goes by. In the
Appendix, we show that the two problems have the same solution, so the distinction is not
central in this case. The main result in this section is as follows.
Proposition 5 Suppose country social planners maximize (7), the world technology frontier is
given by (5), Condition 1 holds, and technology spillovers are large in the sense that > 1 .Let
em (1 )(!o !c) gc + (gc go)!c
(!o !c) (+ gc). (23)
Then the world equilibrium is characterized as follows:
1. If
em <gogc, (24)
there exist m < go/gc and 0 < T < 1 such that for nj (0) < m1/, the reward structure
of country j is cutthroat (i.e., sj(t) = c or uj (t) = 1) for all t T , and cuddly (i.e.,
sj(t) = o or uj (t) = 0) for all t > T ; for nj (0) m1/, the reward structure of country
j is cuddly (i.e., sj(t) = o or uj (t) = 0) for all t. Moreover, m > 0 if < 1, and m < 0
if is su¢ciently large (in which case the cuddly reward structure applies with any initial
condition). Regardless of the initial condition (and the exact value of m), in this case,
nj (t)! (go/gc)1/.
2. Ifgogc< em < 1, (25)
there exists 0 < T < 1 such that for nj (0) < em1/, the reward structure of country
j is cutthroat (i.e., sj(t) = c or uj (t) = 1) for all t T , and then at t = T when
nj (T ) = em1/, the country adopts a “mixed” reward structure and stays at nj (t) = em1/
(i.e., uj (t) = uj 2 (0, 1)) for all t > T ; for nj (0) > em1/, the reward structure of
country j is cuddly (i.e., sj(t) = o or uj (t) = 0) for all t T , and then at t = T when
25
nj (T ) = em1/, the country adopts a mixed reward structure and stays at nj (t) = em1/
(i.e., uj (t) = uj 2 (0, 1)) for all t > T .
3. If
em > 1, (26)
then the reward structure of country j is cutthroat for all t (i.e., sj(t) = c or uj (t) = 1 for
all t).
Proof. See the Appendix.
This proposition has several important implications. First, the equilibrium of the previous
section emerges as a special case, in particular when condition (24) holds and the initial gap
between the leader and the followers is not too large (i.e., nj (0) is greater than the threshold
specified in the proposition), or whenm < 0. In this case, the restriction to time-invariant reward
structures is not binding, and exactly the same insights as in the previous section obtain.
Secondly, however, the rest of the proposition shows that the restriction to time-invariant
reward structures is generally binding, and the equilibrium involves countries changing their
reward structures over time. In fact, part 1 of the proposition shows that, in line with the
discussion following Proposition 2, the growth benefits of cutthroat reward structures are greater
when the initial gap between the leader and the country in question is larger, because this creates
a period during which this country can converge rapidly to the level of income of the technological
leader, and a cutthroat reward structure can significantly increase this convergence growth rate.
In consequence, for a range of parameters, the equilibrium involves countries that are su¢ciently
behind the technological leader choosing cutthroat reward structures, and then after a certain
amount of convergence takes place, switching to cuddly capitalism. This pattern, at least from
a bird’s eye perspective, captures the sort of growth and social trajectory followed by countries
such as South Korea and Taiwan, which adopted fairly high-powered incentives with little safety
net during their early phases of convergence, but then started building a welfare state.
Thirdly, part 2 shows that without the restriction to time-invariant reward structures, some
countries may adopt mixed reward structures when they are close to the income level of the
leader. With such reward structures some entrepreneurs are made to bear risk, while others
are given perfect insurance–and thus are less innovative. This enables them to reach a growth
rate between that implied by a fully cuddly reward structure and the higher growth rate of the
cutthroat reward structure.
Finally, for another range of parameters (part 3 of the proposition), there is “institutional”
and technology convergence in that followers also adopt cutthroat reward structures. When
this is the case, technology spillovers ensure not only the same long-run growth rate across all
countries but convergence in income and technology levels. In contrast, in other cases, countries
maintain their di§erent institutions (reward structures), and as a result, they reach the same
growth rate, but their income levels do not converge.
26
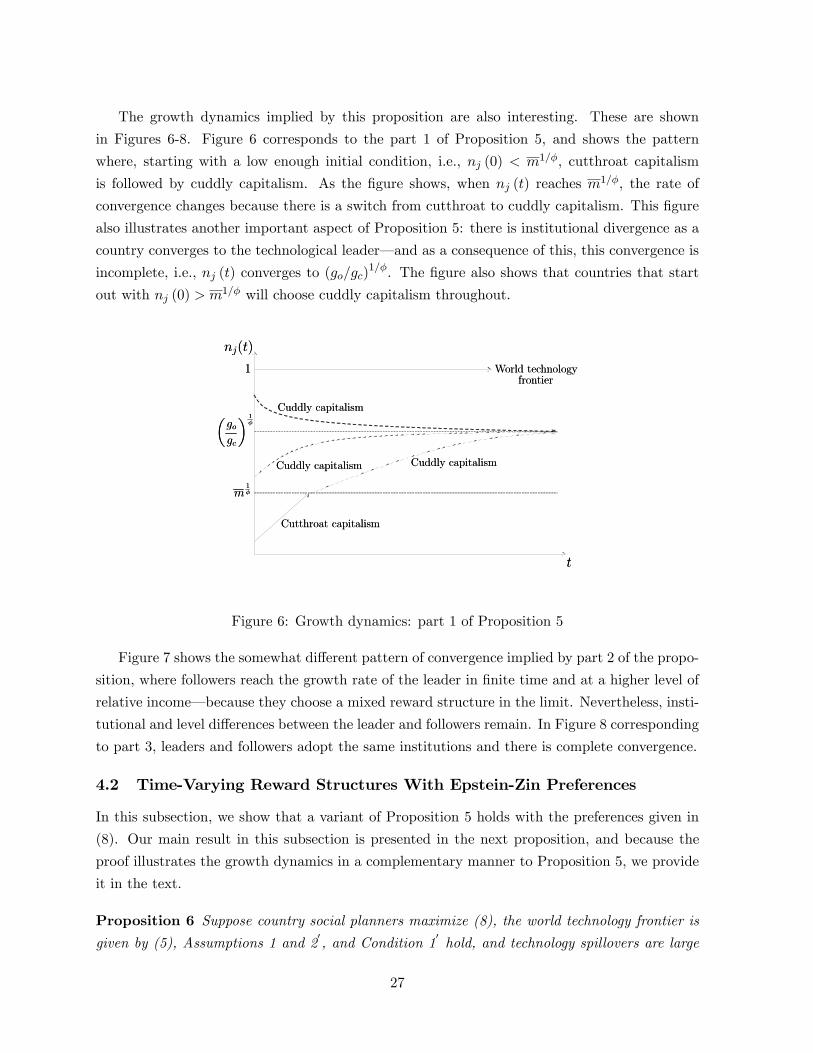
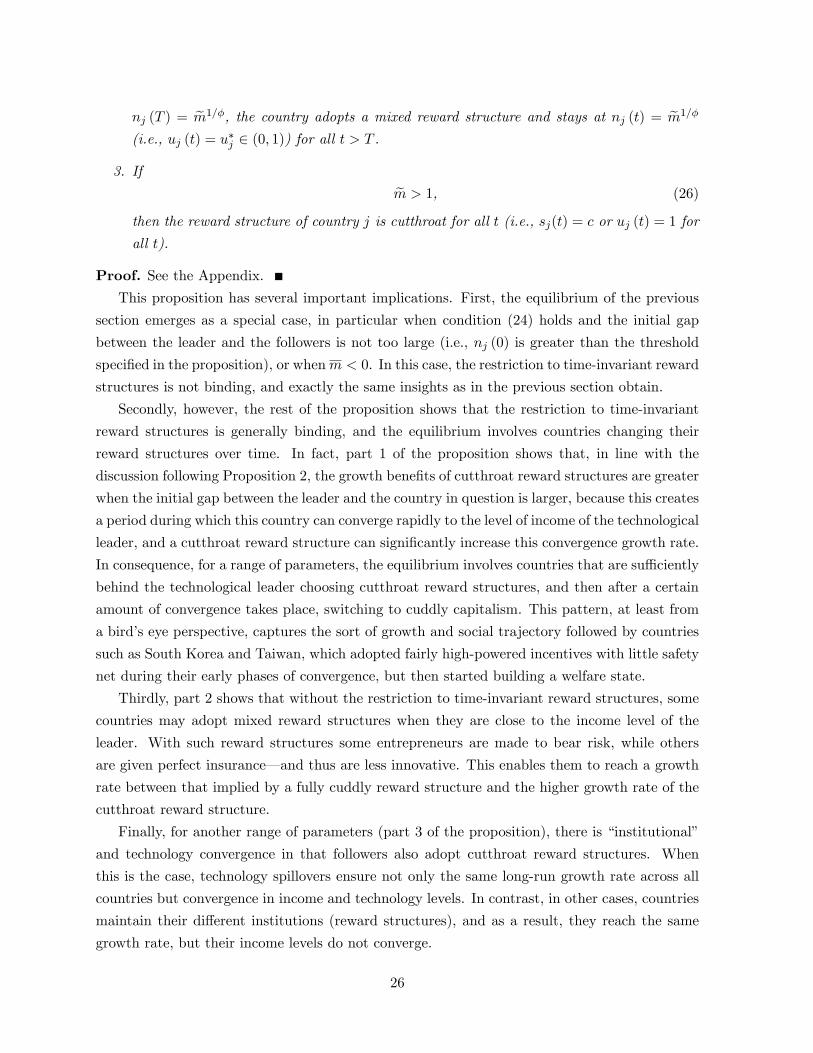
The growth dynamics implied by this proposition are also interesting. These are shown
in Figures 6-8. Figure 6 corresponds to the part 1 of Proposition 5, and shows the pattern
where, starting with a low enough initial condition, i.e., nj (0) < m1/, cutthroat capitalism
is followed by cuddly capitalism. As the figure shows, when nj (t) reaches m1/, the rate of
convergence changes because there is a switch from cutthroat to cuddly capitalism. This figure
also illustrates another important aspect of Proposition 5: there is institutional divergence as a
country converges to the technological leader–and as a consequence of this, this convergence is
incomplete, i.e., nj (t) converges to (go/gc)1/. The figure also shows that countries that start
out with nj (0) > m1/ will choose cuddly capitalism throughout.
Figure 6: Growth dynamics: part 1 of Proposition 5
Figure 7 shows the somewhat di§erent pattern of convergence implied by part 2 of the propo-
sition, where followers reach the growth rate of the leader in finite time and at a higher level of
relative income–because they choose a mixed reward structure in the limit. Nevertheless, insti-
tutional and level di§erences between the leader and followers remain. In Figure 8 corresponding
to part 3, leaders and followers adopt the same institutions and there is complete convergence.
4.2 Time-Varying Reward Structures With Epstein-Zin Preferences
In this subsection, we show that a variant of Proposition 5 holds with the preferences given in
(8). Our main result in this subsection is presented in the next proposition, and because the
proof illustrates the growth dynamics in a complementary manner to Proposition 5, we provide
it in the text.
Proposition 6 Suppose country social planners maximize (8), the world technology frontier is
given by (5), Assumptions 1 and 20, and Condition 1
0hold, and technology spillovers are large
27
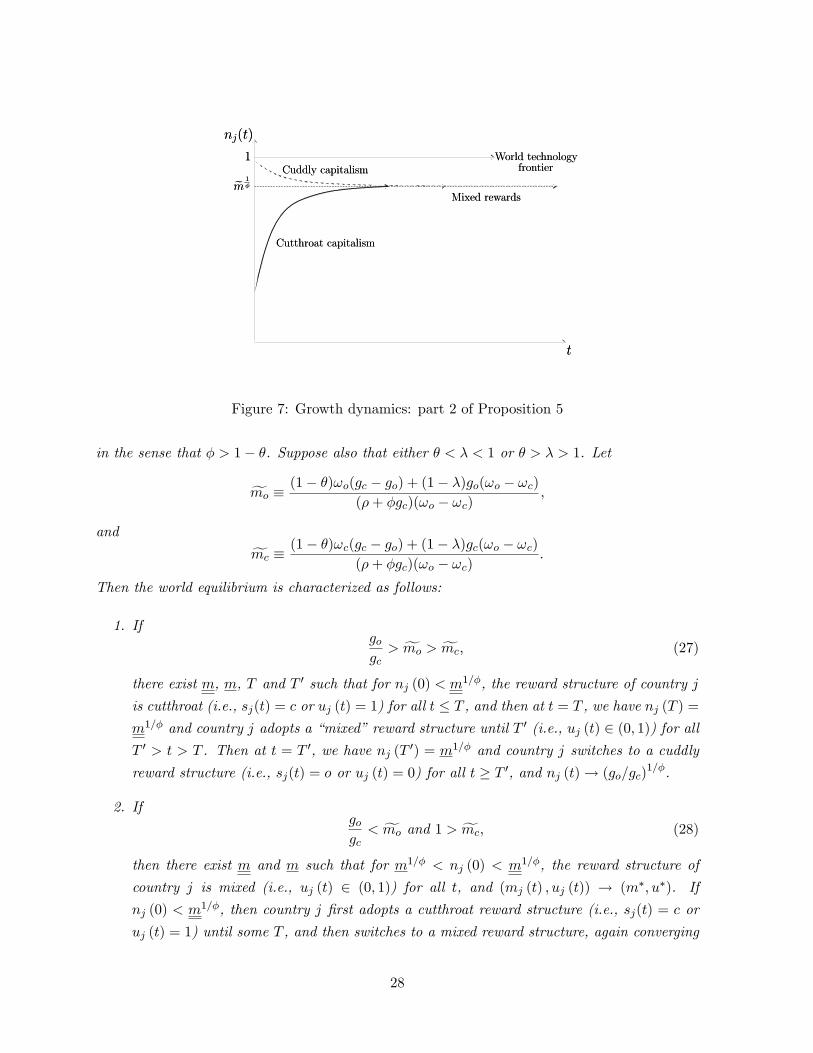
Figure 7: Growth dynamics: part 2 of Proposition 5
in the sense that > 1 . Suppose also that either < < 1 or > > 1. Let
fmo (1 )!o(gc go) + (1 )go(!o !c)
(+ gc)(!o !c),
and
fmc (1 )!c(gc go) + (1 )gc(!o !c)
(+ gc)(!o !c).
Then the world equilibrium is characterized as follows:
1. Ifgogc> fmo > fmc, (27)
there exist m, m, T and T 0 such that for nj (0) < m1/, the reward structure of country j
is cutthroat (i.e., sj(t) = c or uj (t) = 1) for all t T , and then at t = T , we have nj (T ) =m1/ and country j adopts a “mixed” reward structure until T 0 (i.e., uj (t) 2 (0, 1)) for allT 0 > t > T . Then at t = T 0, we have nj (T 0) = m1/ and country j switches to a cuddly
reward structure (i.e., sj(t) = o or uj (t) = 0) for all t T 0, and nj (t)! (go/gc)1/.
2. Ifgogc< fmo and 1 > fmc, (28)
then there exist m and m such that for m1/ < nj (0) < m1/, the reward structure of
country j is mixed (i.e., uj (t) 2 (0, 1)) for all t, and (mj (t) , uj (t)) ! (m, u). If
nj (0) < m1/, then country j first adopts a cutthroat reward structure (i.e., sj(t) = c or
uj (t) = 1) until some T , and then switches to a mixed reward structure, again converging
28
Figure 8: Growth dynamics: part 3 of Proposition 5
to a unique (m, u), and if nj (0) > m1/, then country j first adopts a cuddly reward
structure (i.e., sj(t) = o or uj (t) = 0) until some T 0, and then switches to a mixed reward
structure, again converging to a unique (m, u).
3. If
fmo > fmc > 1, (29)
then for any nj (0) < 1, the reward structure of country j is cutthroat for all t (i.e.,
sj(t) = c or uj (t) = 1 for all t).
Proof. Now the optimization problem for a follower country, dropping the j subscript, can be
written as
maxu(t)R10 etw(u(t))
11m(t)
1 N`(t)
1dt s.t: m(t) = [g(u(t)) gcm(t)],N`(t) = gcN`(t)
m(0) = (N(0)/N`(0)) given.
Here, u(t) 2 [0, 1] is again the fraction of entrepreneurs receiving cutthroat incentives, and
m(t) (N (t) /N` (t)). Now substituting for N`, this is equivalent to:
maxu(t)R10 e((1)gc)tw(u(t))
11m(t)
1 dt s.t: m(t) = [g(u(t)) gcm(t)],
m(0) = (N(0)/N`(0)) given.
The current value Hamiltonean for this problem can be written as
H = w(u(t))11m(t)
1 + µ(t)[g(u(t)) gcm(t)],
which is strictly concave in m when > 1 , and strictly concave in u when 1 > > or
> > 1.
29

Consider the candidate solution given by the Maximum Principle, i.e., as a solution to the
following equations:
@H
@u= (t)
1 1
(!c !o)! (u (t))1 m(t)
1 + µ(t)(gc go) = 0 for 0 u (t) 1
m(t) = [g(u(t)) gcm(t)]
µ(t) = ( (1 )gc + gc)µ(t)1
! (u (t))11 m(t)
11,
together with the transversality condition, not taking the form
limt!1
e((1)gc)tµ(t) = 0.
If the first condition cannot be satisfied for interior u (t), we have a corner solution at 0 or 1. In
particular, substituting for u (t) = 0, we obtain the following curve in the (m,µ) space:
0(t) 1 1
(!c !o)!1o m(t)
1 + µ(t)(gc go) = 0,
and substituting for u (t) = 1,
1(t) 1 1
(!c !o)!1c m(t)
1 + µ(t)(gc go) = 0.
To the right of the first curve shown in Figure 9, the candidate solution involves u (t) = 0, and
to the left of the second curve, u (t) = 1. In-between, the solution involves mixed rewards. The
corresponding rewards can be straightforwardly solved out for
u(t) = 1
!o !c
2
4
(1 )µ(t)(gc go)
(1 )(!o !c)m(t)1
! 1
!o
3
5 .
Substituting this into the above di§erential equations for m (t) and µ (t), we obtain two
autonomous di§erential equations in these two variables describing the dynamics with mixed
rewards:
m(t) =
2
4go (gc go)!o !c
2
4
(1 )µ(t)(gc go)
(1 )(!o !c)m(t)1
! 1
!o
3
5 gcm(t)
3
5 ,
µ(t) = ( (1 )gc + gc)µ(t)1
(1 )(gc go)(1 )(!o !c)
1
µ(t)1m(t)
(1)+1(1) .
When these di§erential equations intersect with the 0(t) and 1(t) curves, then u (t) takes the
value 0 or 1, respectively, and these two di§erential equations simplify to
m(t) = [go gcm(t)], (30)
µ(t) = ( (1 )gc + gc)µ(t)1
!11o m(t)
11
30
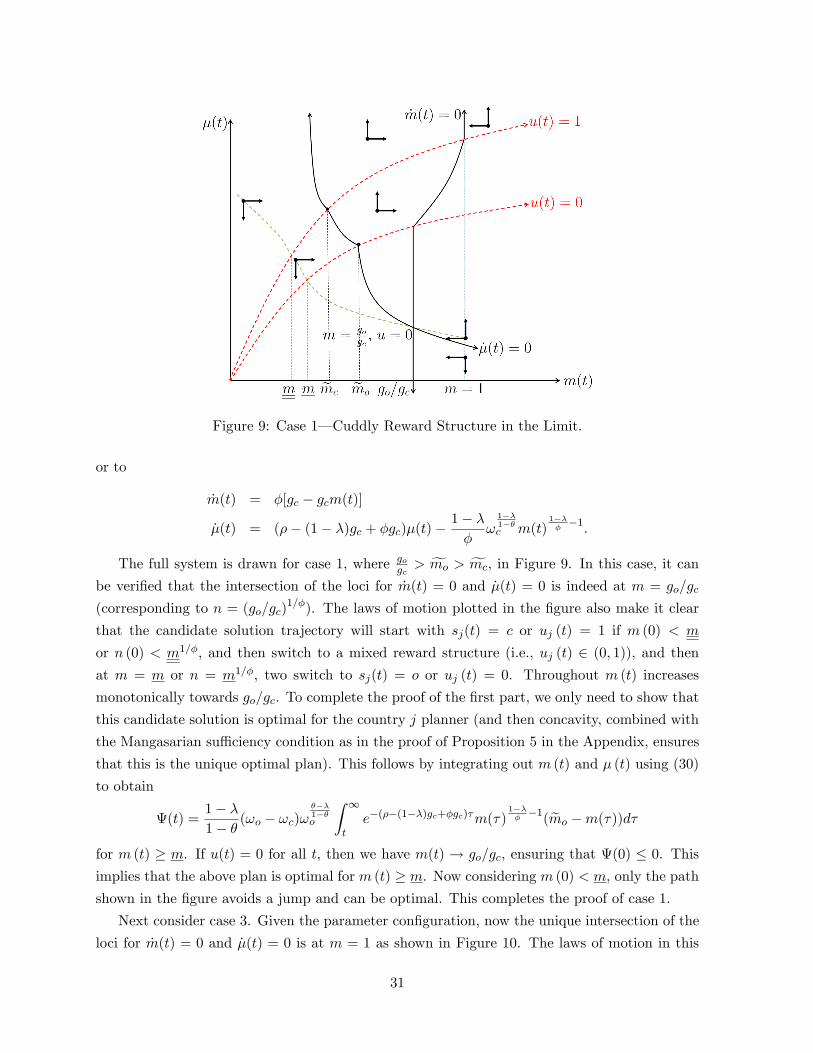
Figure 9: Case 1–Cuddly Reward Structure in the Limit.
or to
m(t) = [gc gcm(t)]
µ(t) = ( (1 )gc + gc)µ(t)1
!11c m(t)
11.
The full system is drawn for case 1, where gogc> fmo > fmc, in Figure 9. In this case, it can
be verified that the intersection of the loci for m(t) = 0 and µ(t) = 0 is indeed at m = go/gc
(corresponding to n = (go/gc)1/). The laws of motion plotted in the figure also make it clear
that the candidate solution trajectory will start with sj(t) = c or uj (t) = 1 if m (0) < m
or n (0) < m1/, and then switch to a mixed reward structure (i.e., uj (t) 2 (0, 1)), and thenat m = m or n = m1/, two switch to sj(t) = o or uj (t) = 0. Throughout m (t) increases
monotonically towards go/gc. To complete the proof of the first part, we only need to show that
this candidate solution is optimal for the country j planner (and then concavity, combined with
the Mangasarian su¢ciency condition as in the proof of Proposition 5 in the Appendix, ensures
that this is the unique optimal plan). This follows by integrating out m (t) and µ (t) using (30)
to obtain
(t) =1 1
(!o !c)!1o
Z 1
te((1)gc+gc)m()
11(emo m())d
for m (t) m. If u(t) = 0 for all t, then we have m(t) ! go/gc, ensuring that (0) 0. Thisimplies that the above plan is optimal for m (t) m. Now considering m (0) < m, only the pathshown in the figure avoids a jump and can be optimal. This completes the proof of case 1.
Next consider case 3. Given the parameter configuration, now the unique intersection of the
loci for m(t) = 0 and µ(t) = 0 is at m = 1 as shown in Figure 10. The laws of motion in this
31
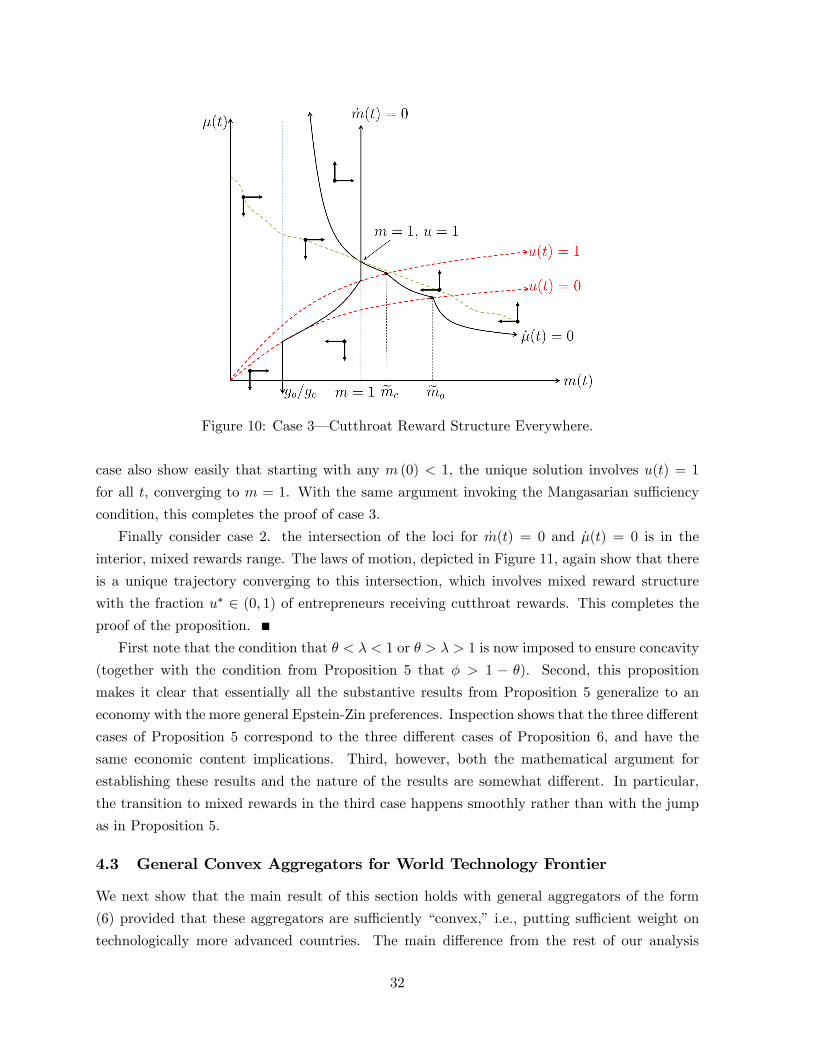
Figure 10: Case 3–Cutthroat Reward Structure Everywhere.
case also show easily that starting with any m (0) < 1, the unique solution involves u(t) = 1
for all t, converging to m = 1. With the same argument invoking the Mangasarian su¢ciency
condition, this completes the proof of case 3.
Finally consider case 2. the intersection of the loci for m(t) = 0 and µ(t) = 0 is in the
interior, mixed rewards range. The laws of motion, depicted in Figure 11, again show that there
is a unique trajectory converging to this intersection, which involves mixed reward structure
with the fraction u 2 (0, 1) of entrepreneurs receiving cutthroat rewards. This completes theproof of the proposition.
First note that the condition that < < 1 or > > 1 is now imposed to ensure concavity
(together with the condition from Proposition 5 that > 1 ). Second, this proposition
makes it clear that essentially all the substantive results from Proposition 5 generalize to an
economy with the more general Epstein-Zin preferences. Inspection shows that the three di§erent
cases of Proposition 5 correspond to the three di§erent cases of Proposition 6, and have the
same economic content implications. Third, however, both the mathematical argument for
establishing these results and the nature of the results are somewhat di§erent. In particular,
the transition to mixed rewards in the third case happens smoothly rather than with the jump
as in Proposition 5.
4.3 General Convex Aggregators for World Technology Frontier
We next show that the main result of this section holds with general aggregators of the form
(6) provided that these aggregators are su¢ciently “convex,” i.e., putting su¢cient weight on
technologically more advanced countries. The main di§erence from the rest of our analysis
32

Figure 11: Case 2–Mixed Reward Structure in the Limit.
is that with such convex aggregators, the world growth rate is no longer determined by the
reward structure (and innovative activities) of a single technology leader, but by a weighted
average of all economies. Nevertheless, the same economic forces exhibit themselves because the
convexity of these aggregators implies that the impact on the world growth rate of a change in
the reward structure of a technologically advanced country would be much larger than that of
a backward economy, and this induces the relatively advanced economies to choose cutthroat
reward structures, while relatively backward countries can free-ride and choose cuddly reward
structures safe in the knowledge that their impact on the long-run growth rate of the world
economy (and thus their own growth rate) will be small.
Proposition 7 Suppose that country social planners maximize (7) or (8), and the world tech-
nology frontier is given by (6). Then there exist < 0, > 0 and < 1 such that when
2 (, 0), and > there is no symmetric world equilibrium with all countries choosing
the same reward structure. Instead, there exists T < 1 such that for all t > T , a subset of
countries will choose a cutthroat reward structure while the remainder will choose a cuddly or
mixed reward structure.
Proof. See the Appendix.
5 Equilibrium under Domestic Political Constraints
In this section, we focus on the world economy with two countries, j and j0, and also simplify
the discussion by assuming that nj0 (0) = nj (0), by focusing on time-invariant reward structures
33
as in Section 3, and also by assuming that the world technology frontier is given by (5) again
as in Section 3. This implies that there are two asymmetric equilibria, one in which country
j is the technology leader and j0 the follower, and vice versa. We also suppose that the social
planner in country j is subject to domestic political constraints imposed by a labor movement or
a social democratic party, which prevent the ratio of rewards when successful and unsuccessful
to be more than some amount . There are no domestic constraints in country j0. If A,
then domestic constraints have no impact on the choice of country j, and there continue to be
two asymmetric equilibria.
Suppose instead that < A. This implies that because of domestic political constraints, it
is impossible for country j to adopt a cutthroat strategy regardless of the strategy of country j0.
This implies that of the two asymmetric equilibria, the one in which country j adopts a cutthroat
reward structure disappears, and the unique equilibrium (with time-invariant strategies) becomes
the one in which country j0 adopts the cutthroat strategy and country j chooses an egalitarian
structure. However, from Proposition 5 above, this implies that country j will now have higher
welfare than in the other asymmetric equilibrium (which has now disappeared). This simple
example thus illustrates how domestic political constraints, particularly coming from the left and
restricting the amount of inequality in society, can create an advantage in the world economy.
We next show that this result generalizes to the case in which the two countries do not start
with the same initial level of technology. To do this, we relax our focus on equilibria in which
the leader at time t = 0 always remains the leader. Let us also suppose, without loss of any
generality, that country j0 is technologically more advanced at t = 0, so that nj (0) 1. Thenwe have the following proposition.
Proposition 8 Suppose that country social planners maximize (7) and the world technology
frontier is given by (5). Suppose also that there are two countries j and j0 with initial technology
levels Nj0 (0) Nj (0) (which is without loss of any generality), they are restricted to time-
invariant reward structures, Condition 1 and (16) hold.
1. There exists > 0 such that for all nj (0) > 1, there are two asymmetric time-invariantequilibria, one in which country j adopts a cutthroat reward structure and country j0 adopts
a cuddly reward structure, and vice versa.
2. If domestic constraints imply that country j cannot adopt a cutthroat reward structure,
then the unique time-invariant equilibrium is the one in which country j0 adopts a cutthroat
reward structure and country j adopts a cuddly reward structure. The equilibrium welfare
of country j is greater than that of country j0.
Proof. The first part follows by noting that when Condition 1 holds and the gap between the
two countries is small (i.e., nj (0) > 1 ), then it also ensures that whichever country will
34
determine the rate of growth of the world technology in the near future prefers to choose the
cutthroat reward structure (and again for nj (0) > 1 , there exists T such that this country
determines the world growth rate for t > T ). Part 2 then immediately follows from Proposition
5.
An interesting implication of this result is that country j, which has a stronger labor move-
ment or social democratic party, benefits in welfare terms by having both equality and rapid
growth, but in some sense exports its potential labor conflict to country j0, which now has to
choose a reward structure with significantly greater inequality.
In the context of the comparison of the US to Scandinavian economies, the latter clearly have
a history of stronger labor movement and social democratic party, suggesting that this might
have been one of the factors influencing the specific pattern of asymmetric world equilibrium
that has developed over the last several decades. Friedman (2010) provides an overview of
existing cross-national historical data on union density which shows that in 1928, just prior
to the date when the Swedish Social Democrats took power (1932), its unionization rate was
32.0%. In Denmark, this was 39.7% and in Norway 17.4%. In the US this number was 9.9% in
1928. It is not just the extent of unionization but how it is organized. US Unions like those of
Britain tended to be along craft lines with multiple unions in a single firm, making it much more
di¢cult for the labor movement to act collectively. In Scandinavia unions were organized by
industry and were much more encompassing. Finally, the rise of social democratic parties which
cemented the Scandinavian model into place had its roots in the late 19th century (see Lundberg
and Åmark, 2001, for Sweden, Baldwin, 1992, more generally) and its particular universalistic
and tax financed nature was a result of what Gourevitch (1986) calls the “Red-Green Coalition”
which linked poor rural peasants with urban industrial workers (see also Baldwin, 1992). In the
US similar debates took place and the coalitions that formed within the Populist and Progressive
movements had Red-Green elements. Though they also managed to push progressive reforms,
such as the introduction of the income tax in 1913, these movements were weaker and failed to
unite with a factious labor movement. While the 1920s saw left-wing political parties come to
power in Denmark (the Social Democrats came to power in 1924) and Norway (Norwegian Labor
Party formed its first government in 1928), left-wing US political parties severely declined. Thus
just at the critical juncture where many of the institutions of 20th century developed countries
states were formed, the strength of labor movements and left-wing political parties was much
greater in Scandinavia than in the US.
6 Conclusion
In this paper, we have taken a first step towards a systematic investigation of institutional
choices in an interdependent world–where countries trade or create knowledge spillovers on
each other. Focusing on a model in which all countries benefit and potentially contribute to
35
advances in the world technology frontier, we have suggested that the world equilibrium may
necessarily be asymmetric. In our model economy, because e§ort by entrepreneurs is private
information, a greater gap of incomes between successful and unsuccessful entrepreneurs–thus
greater inequality–increases innovative e§ort and a country’s contributions to the world tech-
nology frontier. Under plausible assumptions, in particular with su¢cient risk aversion and
a su¢cient return to entrepreneurial e§ort, some countries will opt for a type of “cutthroat”
capitalism that generates greater inequality and more innovation and will become the technol-
ogy leaders, while others will free-ride on the cutthroat incentives of the leaders and choose a
more “cuddly” form of capitalism. We have also shown that, paradoxically, starting with similar
initial conditions, those that choose cuddly capitalism, though poorer, will be better o§ than
those opting for cutthroat capitalism. Nevertheless, this configuration is an equilibrium because
cutthroat capitalists cannot switch to cuddly capitalism without having a large impact on world
growth, which would ultimately reduce their own welfare. This perspective therefore suggests
that the diversity of institutions we observe among relatively advanced countries, ranging from
greater inequality and risk taking in the United States to the more egalitarian societies sup-
ported by a strong safety net in Scandinavia, rather than reflecting di§erences in fundamentals
between the citizens of these societies, may emerge as a mutually self-reinforcing equilibrium. If
so, in this equilibrium, we cannot all be like the Scandinavians, because Scandinavian capitalism
depends in part on the knowledge spillovers created by the more cutthroat American capitalism.
Clearly, the ideas developed in this paper are speculative. We have theoretically shown
that a specific type of asymmetric equilibrium emerges in the context of a canonical model of
growth–with knowledge spillovers combined with moral hazard on the part of entrepreneurs.
Whether these ideas contribute to the actual divergent institutional choices among relatively
advanced nations is largely an empirical question. We hope that our paper will be an impetus
for a detailed empirical study of these issues.
In addition, there are other interesting theoretical questions raised by our investigation.
Similar institutional feedbacks may also emerge when countries interact via international trade
rather than knowledge spillovers. For example, if di§erent stages of production require di§erent
types of incentives, specialization in production resulting in a Ricardian equilibrium may also
lead to “institutional specialization”. In addition, while we have focused on a specific and
simple aspect of institutions, the reward structure for entrepreneurs, our results already hint
that there may be clusters of institutional characteristics that co-vary–for example, strong
social democratic parties and labor movements leading to cuddly capitalism domestically and
to cutthroat capitalism abroad. Institutional choices concerning educational systems, labor
mobility, and training investments may also interact with those related to reward structures for
entrepreneurs and workers. We believe that these are interesting topics for future study.
36
References
Acemoglu, Daron, Philippe Aghion and Fabrizio Zilibotti (2006) “Distance to Fron-
tier, Selection, and Economic Growth,” Journal of the European Economic Association, MIT
Press, vol. 4(1), pages 37-74, 03.
Acemoglu, Daron (2009) Introduction to Modern Economic Growth, Princeton University
Press.
Akkermans, Dirk, Carolina Castaldi, and Bart Los (2009) “Do ‘liberal market
economies’ really innovate more radically than ‘coordinated market economies’? Hall and Sos-
kice reconsidered,” Research Policy, 38, 181-91.
Alesina, Alberto and Edward L. Glaeser (2004) Fighting Poverty in the US and
Europe: A World of Di§erence, New York: Oxford University Press.
Alesina, Alberto, Edward L. Glaeser and Bruce Sacerdote (2001) “Why Doesn’t the
United States Have a European-Style Welfare State?” Brookings Paper on Economics Activity,
Fall 2001, 187-278.
Alesina, Alberto, Edward L. Glaeser and Bruce Sacerdote (2005) “Work and
Leisure in the U.S. and Europe: Why So Di§erent?” NBER Macroeconomic Annual, 1-64.
Alesina, Alberto and with Eliana La Ferrara (2005) “Preferences for Redistribution
in the Land of Opportunities,” Journal of Public Economics, 89, 897-931.
Algan, Yann, Pierre Cahuc and Marc Sangnier (2011) “E¢cient and Ine¢cient
Welfare States,” https://sites.google.com/site/pierrecahuc/ unpublished_papers.
Atkinson, Anthony B., Thomas Piketty and Emmanuel Saez (2007) “Top Incomes
in the Long Run of History” Journal of Economic Literature, 49:1, 3-71.
Baldwin, Peter (1992) The Politics of Social Solidarity: Class Bases of the European
Welfare State, 1875-1975, New York: Cambridge University Press.
Bénabou, Roland J.M. (2000) “Unequal Societies: Income Distribution and the Social
Contract,” American Economic Review, 90, 96-129.
Bénabou, Roland J.M. and Efe Ok (2001) “Social Mobility and the Demand for Re-
distribution: The POUM Hypothesis,” Quarterly Journal of Economics, 116(2), 447-487.
Bénabou, Roland J.M. and Jean Tirole (2006) “Belief in a Just World and Redistrib-
utive Politics,” Quarterly Journal of Economics, 121(2), 699-746.
Blanchard, Olivier (2004) “The Economic Future of Europe,” Journal of Economic Per-
spectives, 18(4), pages 3-26, Fall.
Bottazzi, Laura and Giovanni Peri (2003) “Innovation and spillovers in regions: Ev-
idence from European patent data,” European Economic Review, Elsevier, vol. 47(4), pages
687-710, August.
Cameron, David R. (1978) “The Expansion of the Public Economy: A Comparative
Analysis,” American Political Science Review, 72, 1243—61.
37
Cardoso, Fernando H. and Enzi Faletto Enzo (1979) Dependency and Development
in Latin America, Berkeley: University of California Press.
Coe, David and Elhanan Helpman (1995) “International R&D spillovers,” European
Economic Review vol. 39(5), pages 859-887, May.
Crouch, Colin (2009) “Typologies of Capitalism,” in Bob Hancké ed. Debating Varieties
of Capitalism: A Reader, New York: Oxford University Press.
Davis, Donald R. (1998) “Does European Unemployment Prop Up American Wages?
National Labor Markets and Global Trade,” American Economic Review, 88(3), 478-494.
Epstein, Larry G. and Stanley E. Zin (1989) “Substitution, Risk Aversion and Tem-
poral Behavior of Consumption and Asset Returns: A Theoretical Framework“ Econometrica,
vol. 57(4), pages 937-969.
Esping-Anderson, Gösta (1990) The Three Worlds of Welfare Capitalism, Princeton:
Princeton University Press.
Friedman, Gerald (2010) “Labor Unions in the United States,”
http://eh.net/encyclopedia/article/friedman.unions.us
Gerschenkron, Alexander (1962) Economic backwardness in historical perspective, a
book of essays, Belknap Press of Harvard University Press, Cambridge, Massachusetts.
Gri¢th, Rachel, Stephen Redding and John Van Reenen (2003) “R&D and Ab-
sorptive Capacity: Theory and Empirical Evidence,” Scandinavian Journal of Economics, Wiley
Blackwell, vol. 105(1), pages 99-118, 03.
Gourevitch, Peter (1986) Politics in Hard Times, Ithaca: Cornell University Press.
Hall, Bronwyn, Adam Ja§e, and Manuel Trajtenberg (2001) “The NBER Patent
Citation Data File: Lessons, Insights and Methodological Tools,” NBER Working Paper 8498.
Hall, Peter and David Soskice (2001) Varieties of Capitalism: The Institutional Foun-
dations of Comparative Advantage, Oxford University Press, USA.
Hölmstrom, Bengt (1979) “Moral Hazard and Observability,” The Bell Journal of Eco-
nomics, Vol. 10, No. 1 , pp. 74-91.
Howitt, Peter (2000) “Endogenous Growth and Cross-Country Income Di§erences,”
American Economic Review, American Economic Association, vol. 90(4), pages 829-846, Sep-
tember.
Keller, Wolfgang (2001) “Knowledge Spillovers at the World’s Technology Frontier,”
CEPR Discussion Papers 2815, C.E.P.R. Discussion Papers.
Kerr, William (2008) “Ethnic Scientific Communities and International Technology Dif-
fusion,” Review of Economics and Statistics, 90:3, 518-537
Krueger, Dirk and Krishna Kumar (2004) “US-Europe di§erences in technology-driven
growth: quantifying the role of education,” Journal of Monetary Economics, Elsevier, vol. 51(1),
pages 161-190, January.
38
Krugman, Paul and Anthony Venables (1996) “Integration, specialization, and ad-
justment,” European Economic Review, 40, 959-967.
Lundberg, Urban and Klas Åmark (2001) “Social Rights and Social Security: The
Swedish Welfare State, 1900—2000,” Scandinavian Journal of History, 26:3, 157-176.
Matsuyama, Kiminori (2002) “Explaining Diversity: Symmetry-Breaking in Comple-
mentarity Games,” American Economic Review, 92, 241-246.
Matsuyama, Kiminori (2005) “Symmetry-Breaking,” in L. Blume and S. Durlauf, eds.,
the New Palgrave Dictionary of Economics, 2nd Edition, Palgrave Macmillan.
Matsuyama, Kiminori (2007) “Aggregate Implications of Credit Market Imperfections,”
in D. Acemoglu, K. Rogo§, and M. Woodford, eds., NBER Macroeconomics Annual 2007,
Volume 22.
Milesi-Ferretti, Gian Maria, Roberto Perotti and Massimo Rostagno (2002)
“Electoral Systems and Public Spending,” Quarterly Journal of Economics,
Moene, Karl Ove and Michael Wallerstein (1997) “Pay Inequality,” Journal of Labor
Economics, 15(3), 403-430.
Nelson, Richard and Edmond Phelps (1966) “Investment in Humans, Technological
Di§usion, and Economic Growth,” The American Economic Review, Vol. 56, No. 1/2, pp.
69-75.
OECD (2010) Hours Worked: Average annual hours actually worked, OECD
Employment and Labour Market Statistics (database), viewed 23 January 2012,
http://stats.oecd.org/Index.aspx.
OECD (2011) OECD statistics, viewed 23 January 2012, http://stats.
oecd.org/Index.aspx.
Persson, Torsten and Guido Tabellini (2003) The Economic E§ect of Constitutions,
Cambridge: MIT Press.
Piketty, Thomas (1995) “Social mobility and redistributive politics,” Quarterly journal
of economics, 110(3), 551-584.
Rodrik, Dani (2008) “Second-Best Institutions,” American Economic Review, 98(2), 100-
104.
Romer, Paul (1990) “Endogenous Technological Change,” Journal of Political Economy,
98:5, pp. S71-S102.
Saint-Paul, Gilles and Thierry Verdier (1993) “Education, democracy and growth,”
Journal of Development Economics, 42, 399-407.
Sapir, André (2006) “Globalization and the Reform of European Social Models,” Journal
of Common Market Studies, Vol. 44, No. 2, pp. 369-390.
Schor, Juliet (1993) The Overworked American: The Unexpected Decline of Leisure, Basic
Books.
39
Smeeding, Timothy (2002) “Globalization, Inequality, and the Rich Countries of the G-
20: Evidence from the Luxembourg Income Study (LIS),” Center for Policy Research Working
Papers 48, Maxwell School, Syracuse University.
Taylor, Mark Z. (2004) “Empirical Evidence Against Varieties of Capitalism’s Theory of
Technological Innovation,” International Organization, 58, 601-631.
Wallerstein, Immanuel (1974-2011) The Modern World System, 4 Volumes, New York:
Academic Press.
WIPO, Economics and Statistics Division (2011) World Intellectual Prop-
erty Indicators, World Intellectual Property Organization, viewed 23 January 2012,
http://www.wipo.int/ipstats/en/statistics/patents/.
Appendix
Derivation of Equation (12) . To derive (12), we need to characterize the equilibrium prices
and quantities in country j as a function of current technology Nj (t). This follows directly from
Chapter 18 of Acemoglu (2009). Here it su¢ces to note that the final good production function
(1) implies iso-elastic demand for machines with elasticity 1/, and thus each monopolist will
charge a constant monopoly price of / (1 ), where recall that is the marginal cost in termsof the final good of producing any of the machines given its blueprint (invented or adapted from
the world technology frontier). Our normalization that 1 then implies that monopoly
prices and equilibrium quantities are given by pxj (, t) = 1 and xj(, t) = Lj = 1 for all j, and t.
This gives that total expenditure on machines in country j at time t will beXj(t) = (1 )Nj(t),while total gross output is
Yj(t) =1
1 Nj(t).
Therefore, total net output, left over for distributing across all workers/entrepreneurs is
NYj (t) Yj (t)Xj (t) = BNj (t), where
B (2 )1
,
which gives us (12).
Proof of Corollary 1. We first proved the second part of the corollary. By integration by
parts,
Z 1
0et
egct 1
1dt =
et
egct 1
1
1
0
+
Z 1
0
et
(1 ) egctgc
egct 1
11dt
=
R10 et
egct 1
11dt
(1)gc(1)gc
.
40

Then, a first-order Taylor approximation of (15) for nj(0) Nj (0) /Nl (0) small gives
Wj (sj) =
Z 1
0et!sjN` (0))
1(gsjgc
egct 1
)1 +
1
nj(0)(gsjgc
egct 1
)11dt+R (nj (0))
= !sj (N` (0)1
gsjgc
11 +
nj(0)
(1 ) gcgsj
Z 1
0et
egct 1
1dt+R (nj (0)) ,
where R (nj (0)) is the residual which goes to zero as nj (0)! 0. Thus there exists n > 0 such
that for nj (0) < n, Wj (c) <Wj (o) if
!c!o
11
<
gogc
1
0
@1 +nj(0)
(1)gc
go
1 +nj(0)
(1)gc
gc
1
A
11
.
Next another first-order Taylor approximation of the right-hand side of this expression gives
(18), and with the same reasoning implies that there exists some 0 < n n such that for
nj (0) < n, Wj (c) <Wj (o) if (18) holds.
The second part now follows by setting nj (0) = 0, and noting that in the right-hand side of
(16), the term in large parentheses (the ratio of the two integrals) is always greater than 1, so
that!c!o
11
<gogc
1is a su¢cient condition for all nj (0).
Proof of Corollary 2.
Part 1: It is straightforward to verify that!c!o
11
is decreasing in A (defined in (9))
and . Its dependence on is more complicated. As noted in the text, it is decreasing in A.
Di§erentiation and algebra then establishes A is increasing in when 1 q
q0(1q0)q1(1q1)
.
Also,!c!o
11
is decreasing in for fixed A. Therefore,!c!o
11
is decreasing in when .
Moreover, defining max 1log(
1q01q1
)
log(1) > 1, we also have lim!max!c!o
11
= 0. Thus there
exists (, ) 2 (0, max()) such that when (, ),!c!o
11
<gogc
1, and moreover
(, ) is decreasing in and (the latter from the fact that the right-hand side of inequality
is increasing in .
Part 2: When < 1, Condition 1 requires that
!c!o> (1 )gc (1 )go
.
Since !c!o< 1 and (1 )gc > (1 )go, there exists a unique (, ) 2 [(1 )gc,1) such that
is inequality satisfied if and only if < (, ). When > 1, !c < !o < 0, and Condition 1
requires!c!o< (1 )gc (1 )go
.
In this case, some algebra establishes that the same conclusion follows provided that 1
qq0(1q0)q1(1q1)
and 21, ()
where () > 1. Moreover, in both cases (, ) is decreasing in
and .
41
Proof of Proposition 5. We rewrite (22) with a change of variable for mj (Nj/N`) 1as:
Wj(mj (t)) = N` (t) maxu(.)2[0,1]
Z 1
te((1)gc)(t)! (u())mj ()
1 d (31)
·mj () = [g (u ()) gcmj ())] .
The solution to this problem would be the “closed loop” best response of follower j to the
evolution of the world technology frontier driven by the technology leader, `. The Markov
perfect equilibrium corresponds to the situation in which all countries use “open loop” strategies.
However, given our focus on equilibria in which the same country, `, remains the leader and
adopts a cutthroat reward structure (under Condition 1), the open loop and the closed loop
solutions coincide, because under this scenario, country ` always adopts a cutthroat reward
structure, regardless of the strategies of other countries. Hence we can characterize the equilibria
by deriving the solution to (31).
We now proceed by defining the current-value Hamiltonian, suppressing the country index
j to simplify notation,
H(m (t) , u (t) , µ (t)) = !(u (t))m (t)1 + µ (t) [g(u (t)) gcm (t)] ,
where µ(t) is the current-value co-state variable. We next apply the Maximum Principle to
obtain a candidate solution. This implies for the control variable (reward structure) u (t) the
following bang-bang form:
u (t)
8<
:
= 12 [0, 1]= 0
if (t) < 0 (t) = 0 (t) > 0
(32)
where (t) is the switching function:
(t) (!o !c)m (t)1 µ (t) [gc go] . (33)
In addition,
·m (t) = [g(u (t)) gcm (t)] with m (0) > 0 given (34)·µ (t) = ( (1 )gc + gc)µ (t)
1
m (t)11! (u (t)) ,
and the transversality condition,
limt!1
e((1)gc)tµ(t) = 0. (35)
Now combining (33) with (34), we have
(t) = ( (1 )gc + gc)(t) + (!o !c)(+ gc)m(t)11(emm(t)) , (36)
42

where em is given by (23) in the statement of Proposition 5. Integrating (36), we obtain
(t) = (!o !c)(+ gc)Z 1
te(((1)gc+gc))(t)m()
11(m() em) d . (37)
Moreover, (32) implies that in the candidate solution, cutthroat (cuddly) reward structures
will be adopted at time t when (t) < 0 (> 0). Notice first that (34) implies that
·m (t) [go gcm (t)]
Thus,
m(t) gogc+ (m(0)
gogc)egct (38)
Next observe the following about the candidate solution.
1. Suppose em < go/gc (corresponding to part 1 of Proposition 5). One can first notice that
the control variable u (t) can only take the extreme values 0 or 1. To see this, suppose to obtain
a contradiction that in some interval t 2 [t1, t2], u(t) 2 (0, 1). Then also (t) = 0 on that sameinterval [t1, t2]. Therefore for t 2 [t1, t2], (t) = 0, but then (36) implies that m(t) is a constantequal to em. Thus ·
m (t) = 0 and u(t) = eu = (gc em go) /(gcgo), which together with em < go/gc
implies that eu < 0, yielding a contradiction.Next consider the following cases:
• If m (0) > go/gc, Then (38) implies that m(t) go/gc > em for all t. Hence (37) implies
that (t) > 0 for all t, and thus u (t) = 0 for all t (which also implies from (34) that m (t)
is monotonically decreasing towards go/gc).
• If m (0) < go/gc, then (38) implies that lim infm (t) go/gc > em, and thus lim inf (t) >0. Hence there exists T 0 such that for t > T 0, (t) > 0, and thus u (t) = 0. Two cases
need to be considered:
- Case i) For all t 2 [0, T 0], (t) > 0 and therefore for all t 0, u (t) = 0 (and m (t) is
monotonically increasing towards go/gc).
- Case ii) There exists t0 2 [0, T 0] such that (t0) = 0. Let to < T be the maximum of suchdates t0. We have (to) = 0. By definition of to, for all t > to (t) > 0. Hence we also have
0(to) > 0. Equation (36) implies that m(to) < em. Suppose now that there is another datet” < to such that (t”) = 0 and take the largest of such dates t1 < to. By construction,
0 (t1) < 0. Also given that for all t to (t) 0, and the continuity of (t), (t) < 0 onthe interval t 2 (t1, to) and (to) = (t1) = 0. Hence for t 2 (t1, to), we also have u(t) = 1and m(t) increasing in t (from (34)). It follows that m(t1) < m(to) < em. However, (36),0 (t1) < 0 and (t1) = 0 jointly imply that m(t1) > em, yielding a contradiction Hence
there cannot exist another date t” < to such that (t”) = 0. Hence the function (t)
cannot change sign on [0, to). Given that at to (to) = 0, one should have (t) < 0 on
[0, to).
43
- From the previous discussion, it follows that there exists at most one date T 0 at whichthe function (t) changes sign. When such a date T exists, it must be that (t) < 0 and
u(t) = 1 for t 2 [0, T ) and (t) > 0 and u(t) = 0 for t 2 (T,1) . The existence of suchtime T depends on the sign of (0). When (0) < 0, there exists such switching date
T at which (t) changes signs (< 0 to > 0). When conversely (0) > 0 the switching
function is positive for all t. Note also that m (t) is increasing in m (0). Now consider the
case where > 1. Then em < 0, and from (37), (0) > 0, so that there is no switching.
Next consider the case where < 1. Then em > 0, and this together with the condition
> 1 gives
@ (0)
@m(0)= (!o !c)(+ gc)
Z 1
0e(((1)gc+gc))
@m()
@m(0)
1
m()1
1emm()
12d > 0.
Hence (0) is increasing inm (0), and thus there existsm such that (0) ? 0 ifm (0) ? m(i.e., n (0) ? m1/).
2. Suppose 1 > em > go/gc (corresponding to part 2 of Proposition 5). Then the following
choice of rewards structure satisfies (32):
u (t) =
8<
:
0 if m (t) > emu if m (t) = em1 if m (t) < em
where u is such that em = g(u)/gc, and when m (t) = em, we have ·m (t) = 0 and (t) = 0,
ensuring that this choice of reward structure does indeed satisfy (32). Note also that in this
case whenever m (t) > em (m (t) < em) m (t) declines (increases) to em monotonically, and at
m (t) = em, it remains constant.3. Suppose em > 1 (corresponding to part 3 of Proposition 5). In this case, (t) < 0 for all
t (regardless of initial conditions), and thus u (t) = 1 for all t. Given this reward structure, in
this case m (t) monotonically converges to 1.
Finally, in each case, the candidate solution satisfies the transversality condition (35), and
the assumption that 1 < ensures that Mangasarian’s su¢ciency condition is satisfied
(e.g., Acemoglu, 2009, Chapter 7). Thus the candidate solution characterized above is indeed a
solution and is unique. This completes the proof of Proposition 5.
Proof of Proposition 7. We will prove that under the hypotheses of the proposition, there
does not exist a symmetric equilibrium. We focus on the case in which preferences are given by
(7). The proof for the case in which they are given by (8) is similar.
Suppose first that all countries choose a cuddly reward structure for all t 0. Then the
world economy converges to a Balanced Growth Path (BGP) where every country has the same
44

level of income, Nj (t) / (1 ) = N (t) / (1 ), and grows at the same rate, which from (6) is
equal to·N(t)/N(t) = go. The time t welfare of country j in this equilibrium can be written as
Woj (t) =
Z 1
te(t)!o
Nj ()
N()
1N()1d ,
which implies that for any > 0, there exists T1 such that for all t > T1, we are close enough to
the steady state equilibrium in the sense that 1 < Nj(t)N(t) < 1 + ,
·N/N < go + , and
Woj (t) <
!oN(t)1(1 + )1
(1 )(go + )
Consider now a deviation of one country k to a cutthroat reward structure at all times t > T1.
Denote by bNj(t), the new growth path of country j and by bN(t) the growth path to the worldtechnology frontier. The world economy converges again to a new BGP with growth rate bg.This BGP growth rate can be written as
bg = 1
J
1+
(J 1)g
11
o + g11
c
1
1+
> go.
After this deviation, we have bNk(t) > Nk(t) and bNk(t) > N(t) for all t > T1. Then for 1 > 0,
there exists T 01 > T1 and 01 such that for all t > T
01,
·bNk/ bNk bg 1, and welfare of country k
satisfies
Wck(T1) =
Z 1
T1
e(tT1)!c bNk(t)1dt
=
Z T 01
T1
e(tT1)!c bNk(t)1dt+ e(T01T1)
Z 1
T 01
e(tT01)!c bNk(t)1dt
> e(T01T1)!c
bNk(T 01)1
(1 )(bg 0) .
Now using the fact that bNk(T 01) Nk(T01) ego(T
01T1)Nk(T1), a su¢cient condition for the
deviation for country k to be profitable is
e((1)go)(T01T1)!c
Nk(T1)1
(1 )(bg 1)> !o
Nk(T1)1(1 + )1
(1 )(go + )
> Wok(T1) =
Z 1
T1
e((1)go)(tT1)!oNk (t)1 dt.
Rearranging terms, this can be written as
!c!o
11
> (1 + ) e(1)go
1 (T 01T1) (1 )(bg 1) (1 )(g0 + )
11
. (39)
Next suppose that all countries adopt a cutthroat reward structure for all t 0. In this case,the world economy converges to a BGP where every country has the same level of income and
45

grows at the same rate, which from (6) is equal to·N(t)/Nj(t) = gc. With a similar reasoning,
for > 0, there exists T2 such that for all j and t > T2, 1 < Nj (t) /N(t) < 1 + and·N/N < gc + . Thus
Wcj (t) <
!cN(t)1(1 + )1
(1 )(gc + )
Consider now a deviation of one country k to a cuddly reward structure at all time t > T2 while
all other countries j 6= k stay with cutthroat reward structures throughout. Denote the path oftechnology of country j after this deviation by eNj(t), and the path of world technology frontier
by eN (t). Clearly,·eN(t)/ eNj(t) = eg < gc, and moreover eNk(t) Nk (t) for all t > T2. Let us also
note that
eg =
·eN j(t)
eN(t)=1
J
(J 1)gc
1 + g
1
o
1
> go.
Now, again fixing 2 > 0, there exists T 02 > T2 such that for all t > T02,
·eNk/ eNk eg 2, and the
welfare of country k satisfies
Wok(T2) =
Z 1
T2
e(tT )!o eNk(t)1dt
=
Z T 02
T2
e(tT2)!o eNk(t)1dt+ e(T02T2)
Z 1
T 02
e(tT”2)!o eNk(t)1dt
> !oNk(T2)1
Z T 02
T2
e(tT )e(1)go(tT )dt+ e(T02T2)!o
Nk(T2)1e(1)g0(T
02T2)
(1 )(eg 2)
> !oNk(T2)1 1 e((1)go)(T
02T2)
(1 ) go+ e((1)go)(T
02T2)!o
Nk(T2)1
(1 )(eg 2),
where the second line uses the fact eNk(t) > Nk(T2)eg0(tT2). Then a su¢cient condition for thedeviation to the cuddly reward structure for country k to be profitable is
e((1)go)(T02T2)!o
Nk(T2)1
(1 )(eg 2)> !c
N(T2)1(1 + )1
(1 )(gc + ).
Since Nk(T2) > N(T2)(1 ), this su¢cient condition can be rewritten as
1 1 +
(1 )(gc + )) (1 )(eg 2)
11
e(1)go
1 (T 02T2) >
!c!o
11
. (40)
Thus combining (39) and (40), we obtain that the following is a su¢cient condition for an
asymmetric equilibrium not to exist after some time T = max {T1, T2}:
1 1 +
(1 )(gc + )) (1 )(eg 2)
11
e(1)go
1 (T 02T2) >
!c!o
11
>1 1 +
e
1 (T01T1)
(1 )(bg 1) (1 )(go + )
11
.
(41)
46

Now note that as " 0 in (6), bg ! gc and eg ! gc. Therefore, for 0 > 0, there exists
< 0 such that for > , bg 0 < go and eg 0 < go. Thus choosing , 1, 2, and 0 su¢cientlysmall, the following is also a su¢cient condition:
e(1)go
1 (T 02T2) >
!c!o
11
> e(1)go(T 01T1)
1
(1 )gc (1 )go
11
. (42)
Finally, choosing su¢ciently close to (1 ) gc and defining T {T 01 T1, T02 T2}, a further
su¢cient condition is obtained as
e(gcgo)T >
!c!o
11
> e(gcgo)T (1 )gc (1 )go
11
. (43)
For given choices of and 1, T is fixed. Hence there exists > (1 ) gc such that for(1 ) gc < < , the right-hand side term inequality is close to zero and the left-hand term is
given by some positive number. Next recall that
!c!o
11
=
q1A
1 + (1 q1)1
1
(1 )
q1A+ (1 q1).
When < 1, this tends to 0 as ! 1 q0q1
1/(1). When > 1, this tends to 0 as !
1 1q01q1
1/(1). Thus in both cases (for a fixed value of ) their exists < 1 such that for
> ,!c!o
11
is sandwiched between these two terms, ensuring that (43) is satisfied and a
symmetric equilibrium does not exist.
Finally, when these conditions are satisfied, a similar analysis to that in the proof of Propo-
sition 5 implies that the equilibrium will take the form where after some T , subset of countries
choose a cuddly reward structure and the remaindered choose a cutthroat reward structure.
47