darren urada, ph.d and elise tran, b.a. ucla integrated substance abuse programs cadpaac / adp...
TRANSCRIPT

Darren Urada, Ph.D and Elise Tran, B.A.UCLA Integrated Substance Abuse Programs
CADPAAC / ADP Quarterly Meeting
January 23, 2013
Integration Survey of CADPAAC Administrators: 2012 Results
AcknowledgementsUCLA team, past & present: Valerie Antonini, MPH, Aaron Call, Sarah Cousins, MPH, Desiree Crevecoeur-MacPhail, Ph.D., Jia Fan, M.S., Thomas Freese, Ph.D., Rachel Gonzales, Ph.D., Grant Hovik, Adi Jaffe, Ph.D., Adam King, Sherry Larkins, Ph.D., Stella Lee, Allison
Ober, Ph.D., Brandy Oeser, MPH, Alex Olson, Howard Padwa, Ph.D., Diego Ramirez, Beth Rutkowski, MPH, Elizabeth Schaper, Suzanne
Spear, Ph.D., Cheryl Teruya, Ph.D., Umme Warda, M.S., Richard Rawson, Ph.D.
Funded by the:California Department of Alcohol and Drug Programs
The authors’ views and recommendations do not necessarily represent those of the funders, UCLA, or the UCLA Integrated Substance Abuse Programs.

About the Survey
• Follow-up to a similar 2010 Survey• Integration, training needs
– Are we moving in the right direction?– How far along are we?

Great Response!
Surveys e-mailed to each county (57)
• 2010: 44 counties (77% response rate)• 2012: 53 counties (93% response rate)
• Thank you!
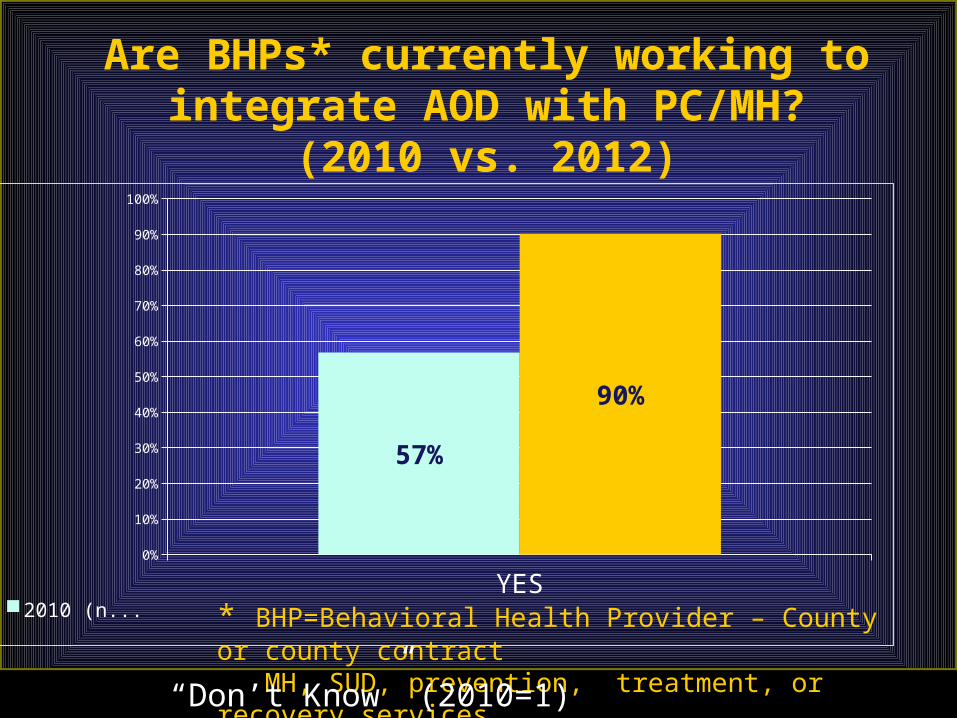
Are BHPs* currently working to integrate AOD with PC/MH?
(2010 vs. 2012)
YES0%
10%
20%
30%
40%
50%
60%
70%
80%
90%
100%
57%
90%
2010 (n=44)2012 (n=51) * BHP=Behavioral Health Provider – County or county contract
MH, SUD, prevention, treatment, or recovery services.
“Don’t Know” (2010=1)

Are BHPs currently working to integrate AOD with PC/MH?
(2012 details)
None
With MH in PC
With PC
With PC and MH
0% 10% 20% 30% 40% 50% 60% 70% 80%
10%
10%
14%
67%
2012 (n=51)

If no current work, are BHPs planning to do integration in the next year?
Don’t Know(43%)
No(14%)
Yes(43%)
2012 (n=7)
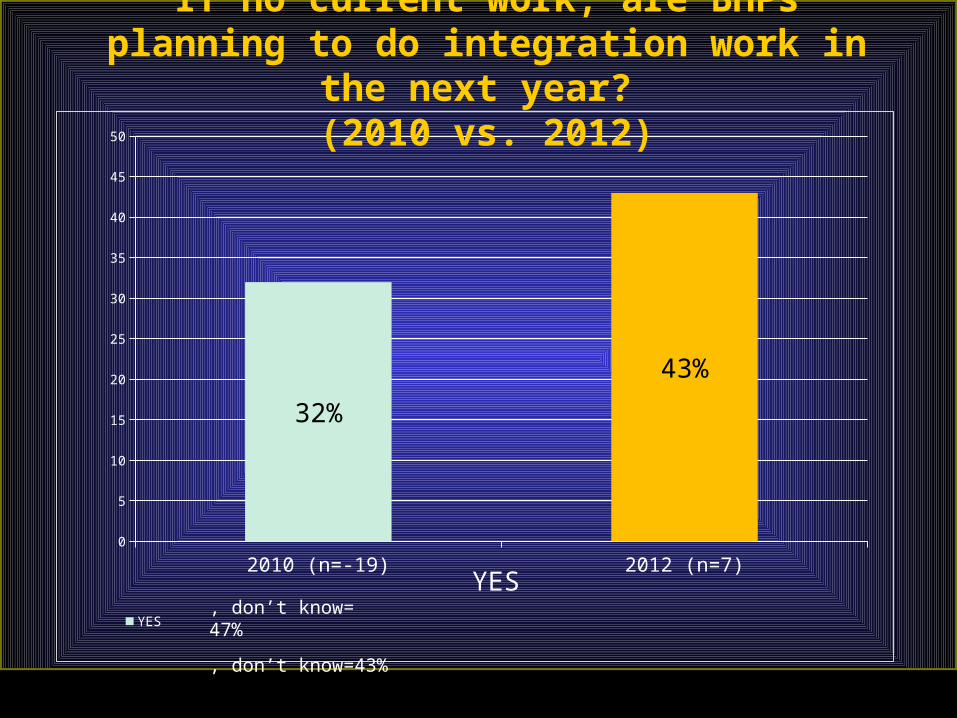
2010 (n=-19) 2012 (n=7)0
5
10
15
20
25
30
35
40
45
50
32%
43%
YES
YES
If no current work, are BHPs planning to do integration work in the next year?
(2010 vs. 2012)
, don’t know= 47%
, don’t know=43%
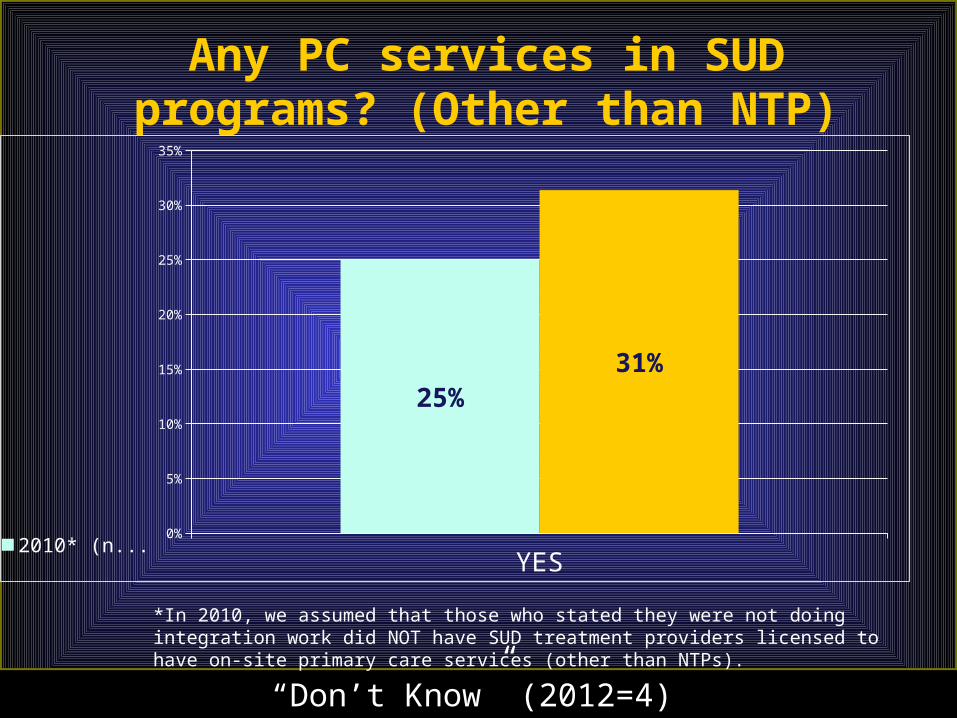
Any PC services in SUD programs? (Other than NTP)
YES0%
5%
10%
15%
20%
25%
30%
35%
25%31%
2010* (n=44)2012 (n=51)
“Don’t Know” (2012=4)
*In 2010, we assumed that those who stated they were not doing integration work did NOT have SUD treatment providers licensed to have on-site primary care services (other than NTPs).

Any AOD services in PC settings?(2010 vs. 2012)
YES0%
5%
10%
15%
20%
25%
30%
35%
40%
45%
50%
23%
45%
2010 (n=44)2012 (n=51)
“Don’t Know” (2010=2; 2012=3).
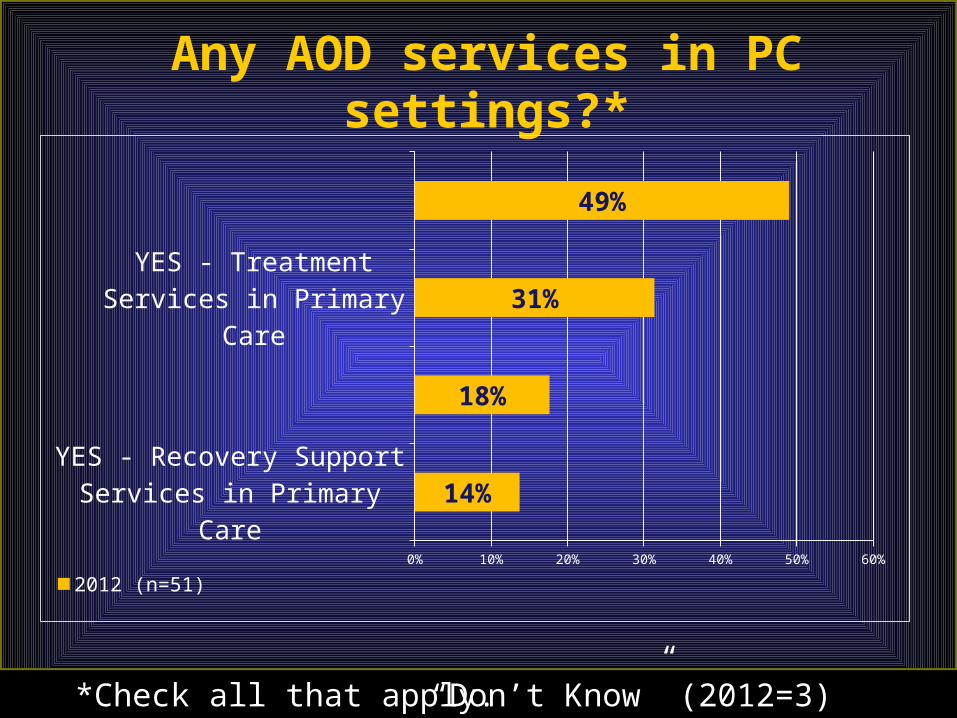
Any AOD services in PC settings?*
YES - Recovery Support Services in Primary Care
YES - Primary Prevention Activities in Primary Care
YES - Treatment Services in Primary Care
NO
0% 10% 20% 30% 40% 50% 60%
14%
18%
31%
49%
2012 (n=51)
*Check all that apply. “Don’t Know” (2012=3)

Distribution of AOD services in PC settings (2010 vs. 2012)
75% or more
Between 50% and 75%
Between 25% and 50%
Some, but less than 25%
None (0%)
0% 10% 20% 30% 40% 50% 60% 70% 80% 90%
2%
13%
78%
10%
8%
12%
61%
2010 (n=45)2012 (n=51)
“Don’t Know” (2010=3; 2012=5).

Where integrated, types of PC Settings with AOD Services*
Private clinics
Private physician offices
Non-FQHC CHC
Other
FQHC look-alike
FQHC
0% 10% 20% 30% 40% 50% 60% 70% 80% 90% 100%
4%
9%
22%
22%
30%
91%
2012 (n=23)
*Check all that apply. “Don’t Know” (2012=1).

Where integrated, AOD services offered in PC, part 1/2*
Education and information dissemina-tion
Brief intervention for drugs
Screening of pregnant women for AOD/SUD (e.g., 4 P’s)
Brief intervention for alcohol
Case management/coordination of services
Routine screening for alcohol
Routine screening for drugs
0% 10% 20% 30% 40% 50% 60% 70% 80%
57%
61%
65%
65%
65%
70%
70%
2012 (n=23)
*Check all that apply.

AOD services offered in PC, part 2*
Psychosocial treatment for nico-
tine
Brief intervention for nicotine
Recovery support services
Routine screening for nicotine
Psychosocial treatment for
drugs
Psychosocial treatment for
alcohol
0% 10% 20% 30% 40% 50% 60%
9%
17%
39%
43%
48%
52%
2012 (n=23)
*Check all that apply.

Barriers to Integrating AOD with PC*(2010 vs. 2012)
Legal barriers
Other barriers
Certification or licensing issues
Partnering with primary care providers
Documentation barriers
Financing barriers
0% 10% 20% 30% 40% 50% 60% 70% 80% 90% 100%
10%
26%
42%
54%
68%
74%
13%
33%
29%
63%
63%
92%
2010 (n=24)
2012 (n=50)
*Check all that apply.

Greatest Training Needs
Other
MI
Ethics and Confidentiality
MAT
Prescription Drug Abuse
SBIRT
Working in the Health Care System
Chronic Disease Associated with SUD/MH
Integration Strategies
0 5 10 15 20 25 30 35
2
3
13
16
16
21
23
24
31
2012 (n=50)

Level of AOD/PC Integration
(0) Not engaged in any activity related to integration
(1) Learning about integration
(2) Starting to communicate with primary care providers
(3) Planning integration initiatives with primary care providers
(4) Engaged in integration initiatives
0% 5% 10% 15% 20% 25% 30%
2%
26%
28%
16%
28%
2012 (n=50)

Level of AOD/PC Integration(2010 vs. 2012)
(0) Not engaged in any activity re-lated to integration
(1) Learning about integration
(2) Starting to communicate with primary care providers
(3) Planning integration initiatives with primary care providers
(4) Engaged in integration initiatives
0% 5% 10% 15% 20% 25% 30% 35% 40% 45% 50%
2%
26%
28%
16%
28%
43%
7%
21%
17%
12%
2010 (n=42)2012 (n=50)

Percentage of SUD treatment providers billing private insurance
75% or more
Between 50% and 75%
Between 25% and 50%
Some, but less than 25%
None (0%)
0% 10% 20% 30% 40% 50% 60%
6%
10%
12%
34%
20%
7%
2%
7%
51%
23%
2010 (n=26)2012 (n=50)
“Don’t Know” (2010=4; 2012=9).

Is your county involved with safety net programs to prepare for 2014?
Projects include:• CMSP• LIHP• Dual Eligibles• Path-2-Health
No (22%)
Yes (74%)
Don’t Know (4%)
2012 (n=49)

Structure of BH and Health Services(2010 vs 2012)
MH, SUD, and health services in 1 department/agency
MH, SUD, and health services in 3 separate departments/agencies
BH services (MH and SUD) under 1 department/agency; health services separate
Some other structure
0% 10% 20% 30% 40% 50% 60%
26%
4%
56%
14%
31%
5%
48%
17%
2010 (n=42)
2012 (n=50)

PC in SUD vs. AOD services in PC
YES0%
5%
10%
15%
20%
25%
30%
35%
40%
45%
50%
31%
45%
PC in SUD (n=51)SUD in PC (n=51)
“Don’t Know” (PC in SUD=4; SUD in PC=3).

Funding: AOD services in PC vs PC in AOD pgms
Medicare
Drug Medi-Cal
Other Grants
Federal Block Grant
Other
Private Insurance
Enhanced Medi-Cal
Self Pay
Medi-Cal
MHSA / Prop 63
0% 10% 20% 30% 40% 50% 60% 70%
44%
44%
25%
38%
44%
56%
63%
9%
17%
17%
22%
22%
26%
35%
35%
39%
48%
SUD in PC (n=23)PC in SUD (n=16)
*Check all that apply. “Don’t Know” (SUD in PC=1).
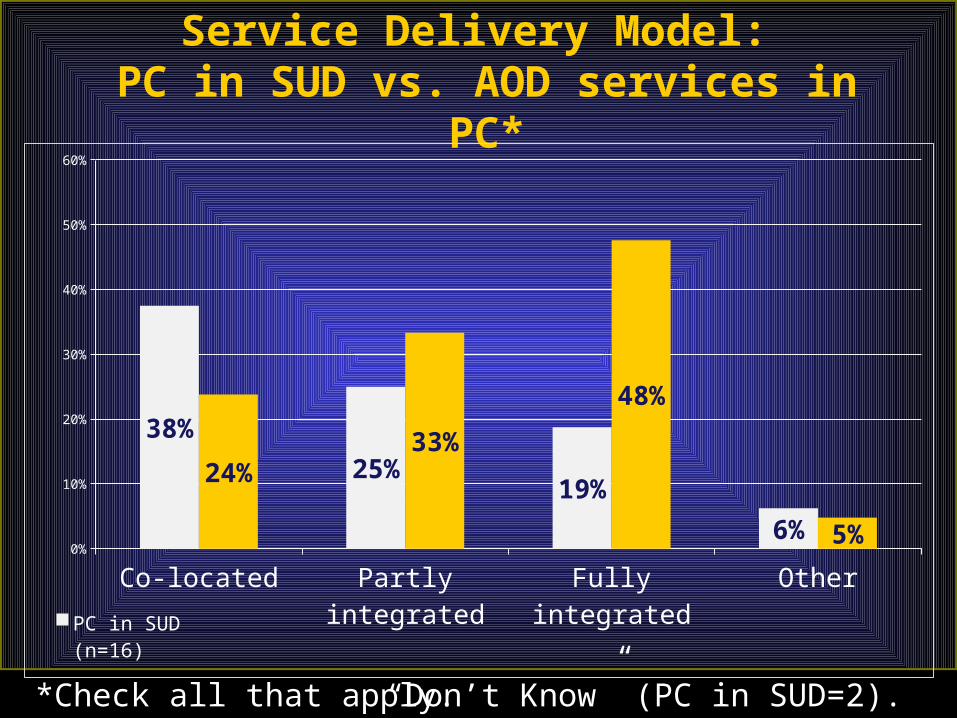
Service Delivery Model: PC in SUD vs. AOD services in PC*
Co-located Partly integrated Fully integrated Other0%
10%
20%
30%
40%
50%
60%
38%
25%19%
6%
24%33%
48%
5%
PC in SUD (n=16)SUD in PC (n=21)
*Check all that apply. “Don’t Know” (PC in SUD=2).

Interest in Collaboration:Integration Learning Collaborative (ILC)• Great interest in ILC participation:
– 39 counties would like to participate or continue participation
– 14 counties would be willing to present their county's integration work in the ILC. We have some great ideas planned!
• Next meeting will be on February 27, 2013 and will feature a panel of rural counties
Integration Learning Collaborative
• Interactive forum where county administrators and other key stakeholders collaborate to identify successful models of integration and solutions to challenges. See:
http://www.uclaisap.org/Affordable-Care-Act/html/learning-collaborative
• These slides will be available shortly at this website.

Progress
We’re not there yet, but we’re moving in the right direction!

Questions?
CONTACT
Darren Urada, Ph.D.
UCLA Integrated Substance Abuse Programs
Thank you!