darwin harbour precinct marine sediment quality - ntepa · darwin harbour precinct marine sediment...
TRANSCRIPT

D R A F T R E P O R T
Darwin Harbour Precinct Marine Sediment Quality
Prepared for
Department of Infrastructure Planning and Environment
3 May 2004
URS Australia Pty Ltd Level 3, Hyatt Centre, 20 Terrace Road East Perth Western Australia 6004 Job No.: 36909-007-557 Tel.: (08) 9221 1630; Fax: (08) 9221 1639 Report No.: R1007 E-mail: [email protected] Ref: DK:M&C1962/PER ABN 46 000 691 690 Author: Ian Baxter, Tim Dowden-Parker

TABLE OF CONTENTS
1. INTRODUCTION............................................................................................. 1
1.1 DARWIN WHARF PRECINCT REDEVELOPMENT ................................. 1 1.2 THIS DOCUMENT ........................................................................................ 1 1.3 HISTORIC USE OF DARWIN WHARF PRECINCT................................... 1 1.4 CONTAMINANTS OF CONCERN............................................................... 2
2. SAMPLING PROTOCOL................................................................................ 3
2.1 LOCATION OF SITES................................................................................... 3 2.2 SEDIMENT COLLECTION........................................................................... 3 2.3 SAMPLE ANALYSIS .................................................................................... 4
3. RESULTS AND DISCUSSION ....................................................................... 5
3.1 PRESENTATION OF RESULTS................................................................... 5 3.2 METALS......................................................................................................... 5
3.2.1 Exceedences of Maximum Levels...................................................... 5 3.2.2 Exceedences of Screening Levels ...................................................... 6 3.2.3 Metals in QA/QC Samples ................................................................. 6
3.3 ORGANOTINS............................................................................................... 7 3.4 HYDROCARBONS........................................................................................ 7
4. SUMMARY...................................................................................................... 8
4. REFERENCES................................................................................................ 9
Darwin Harbour Wharf Precinct Marine Sediment Quality URS Ref: 36907-007-557 / R1007 / DK:M&C1962/PER Page i

TABLE OF CONTENTS LIST OF TABLES Table 1 Sample Site Locations and Field Descriptions.............................................. 10 Table 2 Detection Limits and Analytical Methods..................................................... 11 Table 3 Concentrations of Contaminants within Marine Sediments .......................... 12 Table 4 Particle Size Distribution within Marine Sediments ..................................... 13 Table 5 Polynuclear Aromatic Hydrocarbons in Sediments – November 2003......... 14 Table 6 Elutriate Testing Results ............................................................................... 15 Table 7 Site Summary Assessments........................................................................... 16 LIST OF FIGURES Error! No table of figures entries found. Figure 1 Site location plan Figure 2 Marine sediment sampling sites and areas of metal, TBT and hydrocarbon
contamination LIST OF PLATES
Darwin Harbour Wharf Precinct Marine Sediment Quality URS Ref: 36907-007-557 / R1007 / DK:M&C1962/PER Page ii

1. INTRODUCTION 1.1 DARWIN WHARF PRECINCT REDEVELOPMENT The Darwin Wharf Precinct is located to the immediate south of Darwin city centre (Figure 1). Current and historical land uses across the project area have provided a spectrum of waterfront industrial, retail and tourism-related activities over the years. It is understood that the proposed future land use for this area is a landmark residential development with buildings up to 15 stories high. The site has historically been utilised for a broad range of industrial purposes, and it is therefore anticipated that significant remediation works will be necessary. Existing fuel tanks will be demolished and the site rehabilitated for a compatible alternative use. Integrated environmental, geotechnical and site contamination studies have been undertaken by URS to characterise the precinct and thereby assist the Northern Territory Government assessment of the proposed redevelopment. 1.2 THIS DOCUMENT This document presents the results of a marine sediment quality survey conducted from 31 October to 4 November 2003. The objective of the survey was to characterise typical heavy metal, TBT and hydrocarbon concentrations within the intertidal and subtidal sediments of the project area. This characterisation was designed to assist with the assessment of disposal options for sediments removed during development of the Wharf Precinct. The survey was conducted by Peter Smith and Ian Baxter of URS, with logistical support and work vessels provided by Territory Dive Services, Darwin. 1.3 HISTORIC USE OF DARWIN WHARF PRECINCT The Darwin port area was established in the late 1800s and has been utilized for varied port related and land based uses since this time. The wharf area was initially a significant avenue for stock trade. Trade of metal ores became increasingly significant as the mining industry developed in the Northern Territory. A more recent shift to tourism and commercial activity has occurred at Stokes Hill wharf. In general, the Wharf Precinct has been used for various industrial purposes over the years, for storage of many different substances and uncontrolled landfilling has occurred across the central portion of the site. The Fort Hill area has its origins from the earliest establishment of Port Darwin and Palmerston (later to be renamed Darwin). The foreshore below Fort Hill was the site of Goyder’s landing for the initial surveys of the area in the 1870s. From these early days, Fort Hill became the site for unloading shipping. Its historic and current usage includes: • Former Iron Ore and Zinc Concentrate Storage Area; • Bulk Materials “Iron Ore” Wharf; • Sulphuric Acid Storage Tank Area; • Royal Australian Navy Refuelling Facility; • Shipping Container Storage and Handling Area; and • Quarantine Incinerator.
Darwin Harbour Wharf Precinct Marine Sediment Quality URS Ref: 36907-007-557 / R1007 / DK:M&C1962/PER Page 1

1. INTRODUCTION The Stokes Hill area occupies approximately 5 ha of the eastern portion of the Wharf Precinct. It comprises: • Fuel Tank Storage Area; • Former Stokes Hill Power Station; • Stokes Hill Wharf; and • Sewer Pump Station. The Iron Ore Wharf was constructed around 1970 to service the Frances Creek iron ore mine. The Iron Ore Wharf is designed for dry bulk exports and bulk liquid imports and was the focus for substantial movement of metal ores and chemicals, predominantly iron ore and zinc concentrate. It also has facilities for discharge of bulk petroleum, bulk sulphuric acid and LPG. Dry bulk cargoes are loaded via one travelling gantry loader. Historical information currently available also indicated that drums of Uranium Oxide (U3O8) (also known as Yellow Cake) were stored at the site. Shipment of Yellow Cake has always been a controlled process and therefore contamination relating to the storage and shipment of this substance is thought to be unlikely. 1.4 CONTAMINANTS OF CONCERN As a result of the previous land and water use history, the key potential contaminants of concern in the Wharf Precinct are considered to be metals, hydrocarbons and tributyltin (TBT). Sources of potential metal contamination of the sediments include: • stormwater runoff and dust deposition from former mineral stockpiles at the base of the
Fort Hill and Iron Ore wharves; • dust deposition and spillage from conveyor transfers and loading of minerals at the
wharves; • vessels using the wharf facilities, including Stokes Hill Wharf; and • degradation products and waste from maintenance of the wharf structures. Most of the hydrocarbons entering the world’s oceans are a result of chronic low levels of contamination from runoff, rather than from major oil spill events. Potential sources of hydrocarbon contamination at the Wharf Precinct are from underground pressurised fuel lines to the Fort Hill and Iron Ore wharves; the RAN refuelling storage facility; and formerly from fuel storage at the Power Station. In the late 1960s, TBT came into widespread use as an antifoulant additive to marine paints applied to the hulls of vessels. The leaching of TBT from the paint was effective in preventing the growth of fouling organisms on the hulls, but also led to other detrimental environmental effects. TBT in port sediments is typically associated with paint flakes, which may be dislodged from vessel hulls during berthing or whilst alongside wharves, when their hulls rub against the wharf structures during the rise and fall of the tides.
Darwin Harbour Wharf Precinct Marine Sediment Quality URS Ref: 36907-007-557 / R1007 / DK:M&C1962/PER Page 2

2. SAMPLING PROTOCOL 2.1 LOCATION OF SITES Sample locations were selected based on the findings of a Phase 1 study (URS 2003), in which historical contaminant data were reviewed and the activities that may have contributed contaminants to the harbour were identified. Heavy metals, TBT and hydrocarbons tend to accumulate in sedimentary environments, particularly in fine sediments. Potential sources of contaminants to harbour intertidal and subtidal sediments were identified as being: • land-based contaminants transported to the harbour via stormwater drains; • the power station cooling water outfalls; and • ship-loading activities. The proposed future use of the area (as at October 2003) was also considered when locating sampling sites. Several sites were located in areas that may be dredged as part of the proposed redevelopment. A total of 13 sites were sampled, comprising 12 sites around the Wharf Precinct (Table 1 and Figure 2) and one reference site, located in the Elizabeth River approximately 6 km upstream from the East Arm Port (Figure 1). Sampling from the reference site was undertaken to provide information on background levels, against which the Wharf Precinct data could be compared. Background data can assist in determining the degree to which any elevations in contaminant levels at the Wharf Precinct are from anthropogenic sources. 2.2 SEDIMENT COLLECTION At each site, samples were collected for analyses of concentrations of metals, organic carbon, TBT and Particle Size Distribution (PSD). Collection was undertaken using a 1 m long polycarbonate core (internal diameter 50 mm) driven by hand into sediments considered representative for each site, capped and returned to the vessel in a vertical orientation to retain any layering, which may have been present. The core was laid out on a clean sheet of plastic cling wrap and cut in half along the length of the core using a wooden disposable spatula. From one half of the core, two sub-samples (one for metals, organic carbon and TBT analyses and one for PSD determination) were taken from each of the 0-50 cm and 50-100 cm segments. The second half of the core was retained in 50 cm lengths and stored frozen for further testing if required. Each sample was placed into a separate, labelled sterile plastic whirlpak, which was in turn placed within a labelled plastic self-seal bag for protection, stored on ice and frozen at the earliest opportunity. The use of plastic, rather than glass, storage containers is necessary as metals tend to sorb onto glass surfaces, which could lead to an underestimate of the metals concentrations in the sediments. Samples were transported frozen, in insulated containers with freezer bricks, to the analysing laboratories. Sediments sampled for hydrocarbon analysis were collected by scraping a glass jar across the sediment surface (to a depth of 25 mm) in an area considered representative for that site. Sediment samples were collected for hydrocarbon analysis in acid-washed, solvent-rinsed glass jars. Glass, rather than plastic, storage containers were used to prevent any hydrocarbon contamination that can occur from plastics. The foil lining on the lid prevented any contact
Darwin Harbour Wharf Precinct Marine Sediment Quality URS Ref: 36907-007-557 / R1007 / DK:M&C1962/PER Page 3

2. SAMPLING PROTOCOL between the sample and the plastic lid of the jar. Once full, excess sediment was removed from the thread at the neck of the jar, a foil-lined cap secured and the labelled jar placed into a plastic self-seal bag and stored on ice. Following QA/QC practice recommended in the National Ocean Disposal Guidelines (‘the Guidelines’) (Environment Australia 2002), 10% field replication was achieved by collecting triplicate samples at one site, by driving two additional cores into the sediment alongside the first core. The sediments in these cores were sub-sampled in the same manner described above and labelled so as to be identifiable to URS as replicates, but so that they were unrecognisable to the analysing laboratory as replicates. Site geographical coordinates and descriptions of seabed characteristics (topography, thickness of the surface sediment layer, benthic biota, etc.) were recorded on a Habitat Data Sheet. A description of the sediments (including colour, odour, predominant grain size, and the presence of distinct horizons, shell fragments or biota) was recorded onto a Sample Record Form. This form also listed the unique identifier number for each sample collected. 2.3 SAMPLE ANALYSIS Samples obtained from the field survey were submitted to three laboratories: • ALS (NATA-registered laboratory No. 6112); • ARL (NATA-registered laboratory No. 2377); and • CSIRO Particle Analysis Facility at Waterford, W.A. The analyses undertaken by each laboratory, the Practical Quantitation Limits and the analytical methods are provided in Table 2. The selection of metals to be analysed was based on existing contaminant data for the area. Practical Quantitation Limits for the above analytes were at or below those recommended in Table 3 of the Guidelines. Details of the laboratory methods are included as Appendix A. The selected laboratories were compliant with the laboratory QA/QC procedures detailed in Section 3.6.1 of the Guidelines. The relative percent difference (RPD) was determined for field and laboratory duplicates to provide an indication of the precision of the analyses. Laboratory duplicates with an RPD of greater than +35% were reanalysed. Likewise, field duplicates with an RPD of greater than +50% were reanalysed.
Darwin Harbour Wharf Precinct Marine Sediment Quality URS Ref: 36907-007-557 / R1007 / DK:M&C1962/PER Page 4

3. RESULTS AND DISCUSSION 3.1 PRESENTATION OF RESULTS The results of the analyses conducted by ALS, ARL and CSIRO are presented in Tables 3 and 4. Guideline screening and maximum levels for metals and TBT are included in Table 3. Screening levels are defined in the Guidelines as concentrations below which toxic effects on organisms are not expected, while maximum levels are defined as concentrations at which toxic effects on organisms are probable if the contaminant is in a biologically available form. In the sections below, the concentrations of potential contaminants are discussed with respect to Guideline screening and maximum levels. The contaminant status of each of the sites is summarised in Table 7. 3.2 METALS 3.2.1 Exceedences of Maximum Levels Cadmium, lead and zinc were the only metal species for which the Guideline maximum levels were exceeded: • zinc at site DW07 at the western end of Kitchener Bay; and • cadmium, lead and zinc at site DW08, also at the western end of Kitchener Bay and 40 m
inshore from DW07. At site DW07 zinc concentrations were between 482 and 823 mg/kg, exceeding the maximum level (410 mg/kg). Cadmium (3-7 mg/kg) and lead (84-127 mg/kg) concentrations at the site exceeded the Guideline screening levels (1.5 mg/kg and 50 mg/kg respectively), but were below the maximum levels (10 mg/kg and 220 mg/kg respectively). These exceedences were limited to the upper 50 cm of sediment - in the 50-100 cm sample the concentrations of cadmium, lead and zinc (1 mg/kg, 7 mg/kg and 5 mg/kg respectively) were below screening levels. At site DW08, only the surface 50 cm of sediment could be sampled due to the presence of a firm substrate at greater depth. The cadmium concentrations in two subsamples from one of the field replicate samples collected at the site (10 mg/kg and 11 mg/kg) were equal to, and greater than, the maximum level. Lead concentrations within the same two subsamples (237 mg/kg and 278 mg/kg) also exceeded the maximum level. Cadmium and lead concentrations in all except one of the other subsamples analysed were below the maximum levels but exceeded the screening levels. In the remaining subsample, cadmium was below the laboratory PQL and the lead concentration was only 14 mg/kg. In certain of the replicate samples collected at site DW08, zinc concentrations were up to 1,400 mg/kg, exceeding the Guideline maximum level of 410 mg/kg, though concentrations in most samples were just below the maximum level (356-388 mg/kg). The zinc concentration was below the guideline screening level (200 mg/kg) in only one of the subsamples analysed (36 mg/kg) – the same subsample in which the lowest cadmium and lead concentrations were recorded. The high variability in metals concentrations between field replicate and laboratory duplicate samples is discussed in more detail in Section 3.2.3 below.
Darwin Harbour Wharf Precinct Marine Sediment Quality URS Ref: 36907-007-557 / R1007 / DK:M&C1962/PER Page 5

3.2.2 Exceedences of Screening Levels Other exceedences of Guideline screening levels were: • arsenic (20 mg/kg) at site DW11 (35 mg/kg), at the reference site (DWREF) and DW01
(31 mg/kg at both sites), in the lower sample from site DW12 (26 mg/kg) and in one of the subsamples at site DW08 (22 mg/kg);
• cadmium (1.5 mg/kg) at sites DW10 and DW12 (2 mg/kg at both sites); and • lead (50 mg/kg) at site DW10 (63 mg/kg). Previous analyses of Darwin Harbour sediments (e.g. LeProvost Dames & Moore [LDM] 1997; Department of Land Planning and Environment [DLPE] 2000; URS 2002) have returned arsenic concentrations in excess of the Guideline screening level. DLPE (2000) considered that some areas of the harbour, such as the upper reaches of West Arm, had naturally high levels of metals such as arsenic as a result of natural weathering of bedrock within the catchment. This would explain two of the findings of the present study - the elevated arsenic levels at the reference site (remote from potential anthropogenic inputs of arsenic) and in the 50-100 cm depth sample at site DW12 (likely to be beneath the layer of sediments deposited since European settlement and therefore below the depth of potential anthropogenic input of arsenic). Hence, the elevated levels at sites DW01 (near the former power station cooling water outfall), DW08 (at the western end of Kitchener Bay) and DW11 (at the Iron Ore Wharf) are unlikely to be due to anthropogenic inputs. Cadmium concentrations at site DW10 (on the shoreward side of Fort Hill Wharf) and site DW12 (at the western end of the Wharf Precinct) may be elevated due to anthropogenic inputs, as suggested by the elevated concentrations at sites DW07 and DW08 in Kitchener Bay. Cadmium was not detected at the reference site. The concentration of lead at site DW10 was considerably higher than at the reference site (9 mg/kg) and, given its location, could reasonably be expected to be due to anthropogenic inputs. The higher concentration in the surface sample than in the 50-100 cm depth sample from the site (28 mg/kg) also suggests that there have been inputs of lead since European settlement. 3.2.3 Metals in QA/QC Samples The required RPD between laboratory duplicates (+35%) was exceeded for cadmium (sites DW07 and DW08) and for zinc at site DW07. The required RPD between the field replicates collected at site DW08 (+50%) was exceeded for cadmium, lead and zinc. The samples were re-analysed as required, yet the high variability in concentrations remained (refer Table 3). This has been attributed by the analysing laboratory (ALS) to an uneven distribution of metals within the samples. ALS reported the presence of “granular and particulate matter distributed through the brown silty matrix” in the samples from these sites. The samples were not fully homogenised by the laboratory prior to sample extraction for analysis, as to do so would have released metals bound within the mineral matrix of the sediments. The purpose of the analyses conducted for this study was to determine the “biologically available” concentrations of metals (in accordance with the Guidelines), rather than to determine total metal content, so full homogenisation was not appropriate. As a consequence, individual subsamples could be expected to have quite widely differing concentrations of those metals associated with the particulate matter.
Darwin Harbour Wharf Precinct Marine Sediment Quality URS Ref: 36907-007-557 / R1007 / DK:M&C1962/PER Page 6
3.3 ORGANOTINS Concentrations of TBT are presented in Table 3. There are no Guideline levels for dibutyltin (DBT) and monobutyltin (MBT), which are not considered to be environmental hazards (G. Batley, CSIRO, pers. comm.), therefore they have not been included in the table. TBT was detected at most sites, however the Guideline trigger value of 5 ng Sn/g (normalised to 1% Total Organic Carbon [TOC]) was exceeded only at site DW09 (12 ng Sn/g). This site is some 50 m off the face of Fort Hill Wharf, which has received large numbers of vessels since the introduction of TBT as an antifoulant in the late 1960s. 3.4 HYDROCARBONS The highest concentrations of petroleum hydrocarbons (11-16 mg/kg) were present at sites DW03, DW07 and DW08 in Kitchener Bay, site DW09 (off Fort Hill Wharf) and DW11 (landward of the Iron Ore Wharf and Navy refuelling facility). Concentrations at the remaining sites were 6-10 mg/kg. Petroleum hydrocarbons were also present at the reference site, though the concentration (4.9 mg/kg) was lower than in any of the samples from the Wharf Precinct sites. There are no Guideline criteria levels for petroleum hydrocarbons, only for individual polycyclic aromatic hydrocarbons (PAHs). Analysis of sediment samples for PAHs (refer Table 5) revealed the following:
1. The Guideline screening level for Total PAHs was exceeded at sites DW01 (adjacent the old power station cooling water outfall), DW02 (at the eastern end of Kitchener Bay) and DW08 (at the western end of Kitchener Bay).
2. The concentrations of most PAHs were highest at site DW01, where the Guideline maximum level for acenaphthene was exceeded and the screening levels for six other PAHs (anthracene, fluoranthene, fluorene, naphthalene, phenanthrene and pyrene) were also exceeded.
3. At site DW02, screening levels were exceeded for eight PAHs (acenaphthene, benz(a)anthracene, chrysene, dibenz(a.h)anthracene, fluoranthene, fluorene, phenanthrene and pyrene).
4. Screening levels for acenaphthene and fluorene were also exceeded at sites DW03, DW08 and DW11.
5. The Guideline Screening Level for fluoranthene was also exceeded at site DW03. 6. There were no PAHs detected at the reference site (DW01).
Darwin Harbour Wharf Precinct Marine Sediment Quality URS Ref: 36907-007-557 / R1007 / DK:M&C1962/PER Page 7
4. SUMMARY The results of the sampling programme indicated that the surface 50 cm of sediments within Kitchener Bay may be unsuitable for unconfined sea disposal due to:
• elevated concentrations (relative to Guideline criteria levels) of cadmium, lead, zinc and PAHs at the western end of the bay; and
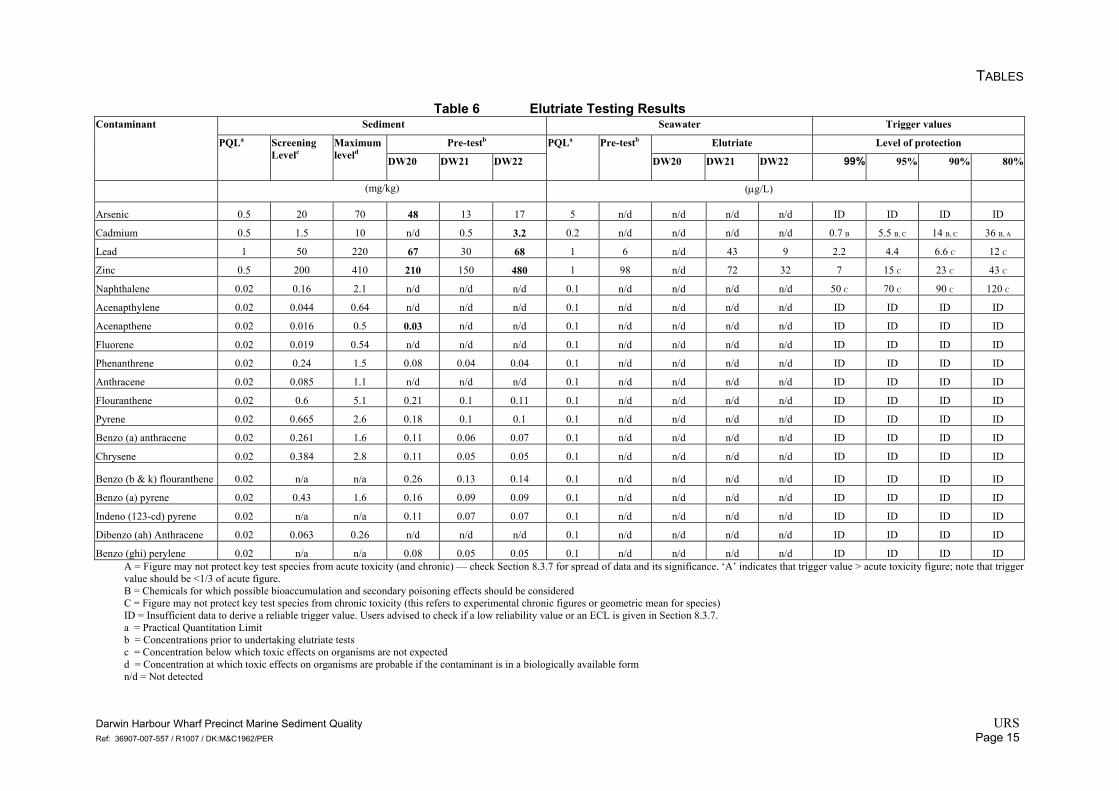
• elevated concentrations of PAHs at the eastern end of the bay. Elutriate testing of three sediment samples collected from within Kitchener Bay (Table 6) indicated that:
• the water quality trigger values for lead and zinc were exceeded in the elutriate from the samples collected in the western and central parts of the bay, hence ecotoxicological testing of the sediments will most likely be required if sea disposal of these sediments is to be considered;
• arsenic, cadmium and PAHs in all three sediment samples were not bioavailable and hence these contaminants will not influence spoil disposal options; and
• at the eastern end of Kitchener Bay all of the contaminants of concern were not bioavailable, hence the sediments are suitable for unconfined sea disposal.
Outside of Kitchener Bay, some limitations in spoil disposal options could occur for sediments from:
• the western end of the Wharf Precinct (due to elevated cadmium concentrations); • behind the Iron Ore Wharf and Navy refuelling facility or adjacent the old power
station cooling water outfall (elevated PAHs); • behind Fort Hill Wharf (elevated cadmium and lead); and • off the face of Fort Hill Wharf (elevated TBT).
If dredging works were to be proposed at these locations, then elutriate tests of the sediments could be undertaken to ascertain their suitability for unconfined sea disposal.
Darwin Harbour Wharf Precinct Marine Sediment Quality URS Ref: 36907-007-557 / R1007 / DK:M&C1962/PER Page 8

4. REFERENCES DLPE 2000. Managing Darwin Harbour and it Catchment. A Summary of NT Government Activities. 2000 Update. Northern Territory Department of Lands, Planning and Environment, Darwin. Environment Australia 2002. National Ocean Disposal Guidelines for Dredged Material. Commonwealth of Australia, Canberra. LDM 1997. Darwin Harbour Marine Habitats Survey. Report to Phillips Oil Company Australia by LeProvost Dames & Moore, Perth, Western Australia. Appendix K of Darwin LNG Plant – Draft Environmental Impact Statement, Report No. R635. URS 2002. Geochemical Survey, Head of Proposed Jetty. Report to Phillips Petroleum Company Australia Pty Ltd and Darwin LNG Project by URS Australia. Report No. R924, Appendix J of Darwin 10 MTPA LNG Facility: Public Environmental Report, Report No. R841. URS 2003. Phase 1 Site Contamination and Geotechnical Preliminary Site Investigation Report and Sampling and Analysis Plan – Darwin Waterfront Project. Report to Department of Infrastructure Planning and Environment, Northern Territory by URS Australia Pty Ltd, Darwin, Northern Territory, Report No. 36909-007/579-F6009.4, October 2003.
Darwin Harbour Wharf Precinct Marine Sediment Quality URS Ref: 36907-007-557 / R1007 / DK:M&C1962/PER Page 9

TABLES
Table 1 Sample Site Locations and Field Descriptions
Region Site Eastinga Northinga WaterDepthb
Core Sample Analytesc
Field Description
Reference Site DWREF 710832 8616082 Surface M, PSD, TPH Moved from planned position due to proximity of Hudson Creek industrial infrastructure. Relocated to mouth of Elizabeth River. Grey silty sand with gravel
Power Station Outfall
DW01 701310 8621332 2.5 Surface M, PSD, TBT, TPH
East of power station outfall. Dark grey silt with some shell material and gravel.
Kitchener Bay DW02 701103 8621013 -1.7 Surface & Subsurface
M, PSD East Kitchener Bay. Intertidal site. West of Stokes Hill Wharf access road. Grey silt, with thin veneer of light tan silt
DW03 701093 8620971 -1.2 Surface &Subsurface
M, PSD, TBT, TPH
East Kitchener Bay, alongside seaplane pontoon. Light tan silt veneer over dark grey silt.
DW04 700938 8620925 -2 Surface &Subsurface
M, PSD Central Kitchener Bay. Intertidal site. Dark grey clay silt, with thin veneer of light tan silt
DW05 700838 8620877 -2.3 Surface M, PSD, TBT, TPH
Central Kitchener Bay, west of DW04. Intertidal site. Dark grey clay silt, with thin veneer of light tan silt.
DW07 700716 8620715 -1.5 Surface &Subsurface
M, PSD, TBT, TPH
West Kitchener Bay, adjacent to old Fort Hill Wharf. Thin light silt veneer over dark grey silt.
DW08 700667 8620753 -2.5 Surface M, PSD, TBT, TPH
West Kitchener Bay, alongside base of old Fort Hill Wharf. Dark grey silt thin veneer of light tan silt
Stokes Hill Wharf
DW06 701029 8620700 11.5 Surface M, PSD, TBT, TPH
Off southern face of Stokes Hill wharf. Light tan silt veneer over dark grey silt.
Fort Hill Wharf DW09 700722 8620527 15.4 Surface M, PSD, TBT, TPH
Off southern face of Fort Hill Wharf. Light tan medium coarse shelly sand, with shell fragments and gravel.
DW10 700521 8620564 6.1 Surface &Subsurface
M, PSD, TBT, TPH
Landward of Fort Hill Wharf. Light tan silty medium sand veneer ~10 cm deep over dark grey silt.
Iron Ore / Fuel Wharf
DW11 700402 8620547 9.8 Surface M, PSD, TBT, TPH
Landward of wharf. Light tan medium shelly sand ~5 mm thick over grey silty gravel to 5 cm diameter
Western Edge of Wharf Precinct
DW12 700239 8620769 -1.9 Surface &Subsurface
M, PSD, TBT, TPH
Light tan silt veneer over dark grey silty fine sand.
a Positions are related to GDA94 Zone 52 b metres relative to chart datum c metals (M), tributyltin (TBT), total petroleum hydrocarbons (TPH), particle size distribution (PSD)
Darwin Harbour Wharf Precinct Marine Sediment Quality URS Ref: 36907-007-557 / R1007 / DK:M&C1962/PER Page 10

TABLES
Table 2 Detection Limits and Analytical Methods
Laboratory Analytes PQL* Methods Metals
As, Cd, Cr, Cu, Mn, Ni, Pb, Zn.
Al, Fe.
1 mg/kg
10 mg/kg
EN – 69/EG-005 Based on USEPA 200.2 (mod) /
USEPA 6010
TOC 0.2% EP-005
ALS
TBT 0.2 µgSn/kg EP-090 ARL TPH 0.1 mg/kg Extraction with acetone/hexane
Gas Chromatography - FID CSIRO PSD N/A Laser Diffraction
*PQL: Practical quantitation limit
Darwin Harbour Wharf Precinct Marine Sediment Quality URS Ref: 36907-007-557 / R1007 / DK:M&C1962/PER Page 11

TABLES
Table 3 Concentrations of Contaminants within Marine Sediments
Aluminium Arsenic Cadmium Chromium Copper Iron Lead Manganese Nickel Zinc TOCa Moisture Content TPH TBTb Normalised TBT
mg/kg % mg/kg ng Sn/g ng Sn/g
PQL c 50 0.5 0.5 0.5 0.5 50 1 1 0.5 0.5 0.005 - - - -Screening Leveld
n/a 20 1.5 80 65 n/a 50 n/a 21 200 n/a- - -
5
Maximum Levele
n/a 70 10 370 270 n/a 220 n/a 52 410 n/a- - - 72
DWREF 4760 31 <1 29 5 48,000 9 181 5 9 0.34 28.6 4.9 - -
DW01 6740 31 1 29 4 36,000 11 149 5 8 0.42 33.4 8.4 1.6 3.8
DW02U 8530 11 1 23 10 18,000 29 200 7 60 0.63 43.3 6.7 - -
DW02L 7470 10 1 20 8 16,300 13 209 6 22 0.56 39.3 - - -
DW03U 10500 8 <1 26 12 18,000 18 182 8 49 0.71 49.4 16 0.7 1
DW03L 9450 10 1 24 22 18,300 33 190 7 74 0.59 41.9 - - -
DW04U 7770 9 1 21 9 16,300 12 194 6 17 0.48 37.7 - - -
DW04L 5670 9 1 15 4 12,900 8 221 5 7 0.31 31.4 - - -
DW05 4280 8 <1 15 9 12,900 10 171 5 20 0.49 34.1 9.5 0.2 0.4
DW06 9680 9 <2 25 6 17,100 10 187 7 26 0.93 60 8 2.2 2.4
DW07U 5850 14 3 19 17 17,400 106 169 5 778 0.58 36.9 12 0.7 1.2
DW07Uf 6050 16 5/7/7h 19 19 17,200 84/126/127h 173 6 482/745/823h - 36.6 - - -
DW07L 6760 14 1 18 3 15,800 7 223 6 5 0.29 37.2 - - -
DW08 6420 17 <1/4/4h 18 19 16,100 14/67/88h 190 6 36/388/446h 0.54 39.4 12 <0.2 <0.4
DW08g 7400 22 8/10/11h 22 30 18,200 183/237/238h 146 6 382/851/1400h 0.41 38 - - - DW08g 6710 15 6 21 29 17,100 119 138 6 372 0.42 34.4 - - - DW08f 6700 15 2/3/4h 24 23 20,400 75/75/126h 144 7 356/381/382h 0.39 38.6 - - -
DW09 8310 19 <1 24 11 29,900 14 166 9 72 0.3 35.3 11 3.6 12
DW10U 9440 12 2 25 13 19,000 63 208 7 127 0.99 48.4 6.1 0.5 0.5
DW10L 8530 17 1 24 11 20,100 28 197 7 54 0.99 45.8 - - -
DW11 5510 35 1 39 11 37,200 16 179 7 29 0.55 30.5 13 <0.2 <0.4
DW12U 3200 11 2 13 7 14,800 24 176 4 168 0.31 27.1 8.1 <0.2 <0.6
DW12L 4620 26 <1 20 5 20,400 6 173 6 6 0.42 32.7 - - -
a. Total Organic Carbon (% dry weight) e. Concentration at which toxic effects on organisms are probable if the contaminant is in a biologically available form b. Tributyltin (TBT) f. Laboratory duplicate c. Practical Quantitation Limit g. Field replicate d. Concentration below which toxic effects on organisms are not expected h. Re-analysis
Darwin Harbour Wharf Precinct Marine Sediment Quality URS Ref: 36907-007-557 / R1007 / DK:M&C1962/PER Page 12

TABLES
Table 4 Particle Size Distribution within Marine Sediments
% Composition Clay Silt Fine Sand Medium Sand Coarse Sand Gravel a Site <4 µm 4 - 62 µm 62 – 250 µm 250 – 500 µm 500 – 2000 µm >2000 µm
DWREF 2 11 25 22 17 22DW01 3 15 29 20 11 22 DW02 U 7 45 44 4 <1 <1 DW02 L 8 51 40 0 <1 <1 DW03 U 6 46 48 0 <1 <1 DW03 L 8 54 38 0 <1 <1 DW04 U 7 54 39 0 <1 1 DW04 L 9 39 50 1 1 1 DW05 7 39 48 2 1 2 DW06 10 43 46 0 <1 <1 DW 07 U 7 31 43 14 3 1 DW 07 L 5 33 60 <1 1 <1 DW 08 6 36 50 1 3 4 DW 09 4 54 5 1 12 24 DW 10 U 13 52 29 2 3 1 DW 10 L 13 46 21 1 7 13 DW 11 4 39 4 3 16 34 DW 12 U 5 23 57 10 4 1 DW 12 L 4 15 52 16 7 5
a Including shell fragments
Darwin Harbour Wharf Precinct Marine Sediment Quality URS Ref: 36907-007-557 / R1007 / DK:M&C1962/PER Page 13

TABLES
Table 5 Polynuclear Aromatic Hydrocarbons in Sediments – November 2003
ScreeningLevel
Maximum Level a b
DWREF DW01 DW02 DW03 DW05 DW07 DW08 DW09 DW11
PAH (µg/kg) 2-Methylcholanthrene n/ac n/a <10 <20 <20 <20 <20 <10 <20 <10 <102-Methylnaphthalene 70 670 <10 1,330 26 68 <20 <10 19 <10 117.12 Dimethylbenz(a)anthracene n/a n/a <10 <20 <20 <20 <20 <10 <20 <10 <10Acenaphthene 16 500 <10 611 121 55 <20 <10 25 <10 43 Acenaphthalene 44 640 <10 19 17 <20 <20 <10 27 <10 <10Anthracene 85 1100 <10 148 37 19 <20 <10 38 <10 28Benz(a)anthracene 261 1600 <10 161 378 114 42 19 212 10 189Benzo(a)pyrene 430 1600 <10 72 389 117 48 20 234 <10 145Benzo(b)fluoranthene n/a n/a <10 82 402 134 52 25 214 <10 223Benzo(e)pyrene n/a n/a <10 49 296 82 35 16 152 <10 107Benzo(g.h.i)perylene n/a n/a <10 35 246 67 31 13 130 <10 78Benzo(k)fluoranthene n/a n/a <10 39 303 94 30 <10 140 <10 64Chrysene 384 2,800 <10 236 410 122 40 20 205 11 182Coronene n/a n/a <10 <20 <20 <20 <20 <10 <20 <10 <10Dibenz(a.h)anthracene 63 260 <10 <20 63 18 <20 <10 27 <10 18Fluoranthene 600 5,100 <10 762 909 272 87 33 518 19 463Fluorene 19 540 <10 504 40 34 <20 <10 19 <10 24 Indeno(1.2.3.cd)pyrene n/a n/a <10 33 236 65 30 12 124 <10 75N-2-Fluorenyl acetamide n/a n/a <100 <200 <200 <200 <200 <100 <200 <100 <100Naphthalene 160 2,100 <10 468 30 27 <20 <10 12 <10 <10Perylene n/a n/a <10 28 135 39 20 <10 76 <10 50Phenanthrene 240 1,500 <10 1,360 451 177 30 15 233 15 219Pyrene 665 2,600 <10 503 692 231 94 45 432 30 360Total PAH 4,000 45,000 320 6720 5441 2015 939 438 3097 355 2429
Method = EP-032B-SS a. Concentration below which toxic effects on organisms are not expected
b. Concentration at which toxic effects on organisms are probable if the contaminant is in a biologically available form c. None Applicable
Darwin Harbour Wharf Precinct Marine Sediment Quality URS Ref: 36907-007-557 / R1007 / DK:M&C1962/PER Page 14
TABLES
Table 6 Elutriate Testing Results Sediment Seawater Trigger values
Pre-testb Elutriate Level of protection
Contaminant
PQLa
ScreeningLevelc
Maximum leveld DW20 DW21 DW22
PQLa Pre-testb
DW20 DW21 DW22 99% 95% 90% 80%
(mg/kg) (µg/L) Arsenic 0.5 20 70 48 13 17 5 n/d n/d n/d n/d ID ID ID ID
Cadmium 0.5 1.5 10 n/d 0.5 3.2 0.2 n/d n/d n/d n/d 0.7 B 5.5 B, C 14 B, C 36 B, A
Lead 1 50 220 67 30 68 1 6 n/d 43 9 2.2 4.4 6.6 C 12 C
Zinc 0.5 200 410 210 150 480 1 98 n/d 72 32 7 15 C 23 C 43 C
Naphthalene 0.02 0.16 2.1 n/d n/d n/d 0.1 n/d n/d n/d n/d 50 C 70 C 90 C 120 C
Acenapthylene 0.02 0.044 0.64 n/d n/d n/d 0.1 n/d n/d n/d n/d ID ID ID ID
Acenapthene 0.02 0.016 0.5 0.03 n/d n/d 0.1 n/d n/d n/d n/d ID ID ID ID
Fluorene 0.02 0.019 0.54 n/d n/d n/d 0.1 n/d n/d n/d n/d ID ID ID ID
Phenanthrene 0.02 0.24 1.5 0.08 0.04 0.04 0.1 n/d n/d n/d n/d ID ID ID ID
Anthracene 0.02 0.085 1.1 n/d n/d n/d 0.1 n/d n/d n/d n/d ID ID ID ID
Flouranthene 0.02 0.6 5.1 0.21 0.1 0.11 0.1 n/d n/d n/d n/d ID ID ID ID
Pyrene 0.02 0.665 2.6 0.18 0.1 0.1 0.1 n/d n/d n/d n/d ID ID ID ID
Benzo (a) anthracene 0.02 0.261 1.6 0.11 0.06 0.07 0.1 n/d n/d n/d n/d ID ID ID ID
Chrysene 0.02 0.384 2.8 0.11 0.05 0.05 0.1 n/d n/d n/d n/d ID ID ID ID
Benzo (b & k) flouranthene 0.02 n/a n/a 0.26 0.13 0.14 0.1 n/d n/d n/d n/d ID ID ID ID
Benzo (a) pyrene 0.02 0.43 1.6 0.16 0.09 0.09 0.1 n/d n/d n/d n/d ID ID ID ID
Indeno (123-cd) pyrene 0.02 n/a n/a 0.11 0.07 0.07 0.1 n/d n/d n/d n/d ID ID ID ID
Dibenzo (ah) Anthracene 0.02 0.063 0.26 n/d n/d n/d 0.1 n/d n/d n/d n/d ID ID ID ID
Benzo (ghi) perylene 0.02 n/a n/a 0.08 0.05 0.05 0.1 n/d n/d n/d n/d ID ID ID IDA = Figure may not protect key test species from acute toxicity (and chronic) — check Section 8.3.7 for spread of data and its significance. ‘A’ indicates that trigger value > acute toxicity figure; note that trigger value should be <1/3 of acute figure. B = Chemicals for which possible bioaccumulation and secondary poisoning effects should be considered C = Figure may not protect key test species from chronic toxicity (this refers to experimental chronic figures or geometric mean for species) ID = Insufficient data to derive a reliable trigger value. Users advised to check if a low reliability value or an ECL is given in Section 8.3.7. a = Practical Quantitation Limit b = Concentrations prior to undertaking elutriate tests c = Concentration below which toxic effects on organisms are not expected d = Concentration at which toxic effects on organisms are probable if the contaminant is in a biologically available form n/d = Not detected
Darwin Harbour Wharf Precinct Marine Sediment Quality URS Ref: 36907-007-557 / R1007 / DK:M&C1962/PER Page 15

TABLES
Table 7 Site Summary Assessments
Region Site Guideline Exceedencea Summary Assessment Screening Maximum Reference Site DWREF Arsenic Natural weathering of bedrock within the Darwin Harbour catchment is considered by DLPE (2000) to be a source of
arsenic enrichment of harbour sediments Power Station Outfall DW01 Arsenic No elevation of metals concentrations attributable to former power station outfall. Arsenic levels considered natural.
DW02 No contaminants of concern. DW03 Highest concentration of petroleum hydrocarbons recorded during survey, PAHs under investigation. DW04 No contaminants of concern. DW05 No contaminants of concern. DW07b Cadmium
Lead Zinc
Kitchener Bay
DW08b Cadmium Lead
Zinc
Moderate levels of contamination in surface 0.5 m layer, probably linked to former minerals storage at base of Fort Hill Wharf. Evidence of contamination by petroleum hydrocarbons, probably linked to fuel handling at wharf, PAHs under investigation. Elutriate and perhaps ecotoxicological tests would be required if unconfined sea disposal is to be considered.
Stokes Hill Wharf DW06 No contaminants of concern. DW09 TBT Due to TBT level, elutriate tests would be required if unconfined sea disposal is to be considered. Evidence of
contamination by petroleum hydrocarbons, PAHs under investigation. Fort Hill Wharf
DW10 CadmiumLead
Moderate levels of contamination in surface 0.5 m layer, probably linked to former storage and loading of minerals at Fort Hill Wharf. Elutriate tests would be required if unconfined sea disposal is to be considered.
Iron Ore / Fuel Wharf DW11 Arsenic Arsenic levels considered natural. Evidence of contamination by petroleum hydrocarbons, probably linked to fuel offloading at wharf, PAHs under investigation.
Western Edge of Wharf Precinct
DW12 ArsenicCadmium
Arsenic levels considered natural, as concentration in subsurface (0.5-1.0 m) sediments greater than in surface 0.5 m sediment layer. Elevated cadmium in surface 0.5 m sediment layer would require elutriate tests to be conducted if unconfined sea disposal is to be considered.
a National Ocean Disposal Guidelines for Dredged Material (Environment Australia 2002) b Mean concentrations from all subsample analyses
Darwin Harbour Wharf Precinct Marine Sediment Quality URS Ref: 36907-007-557 / R1007 / DK:M&C1962/PER Page 16