data & analytics insights - november 2018
TRANSCRIPT

Data & AnalyticsInsights
November 2018
2
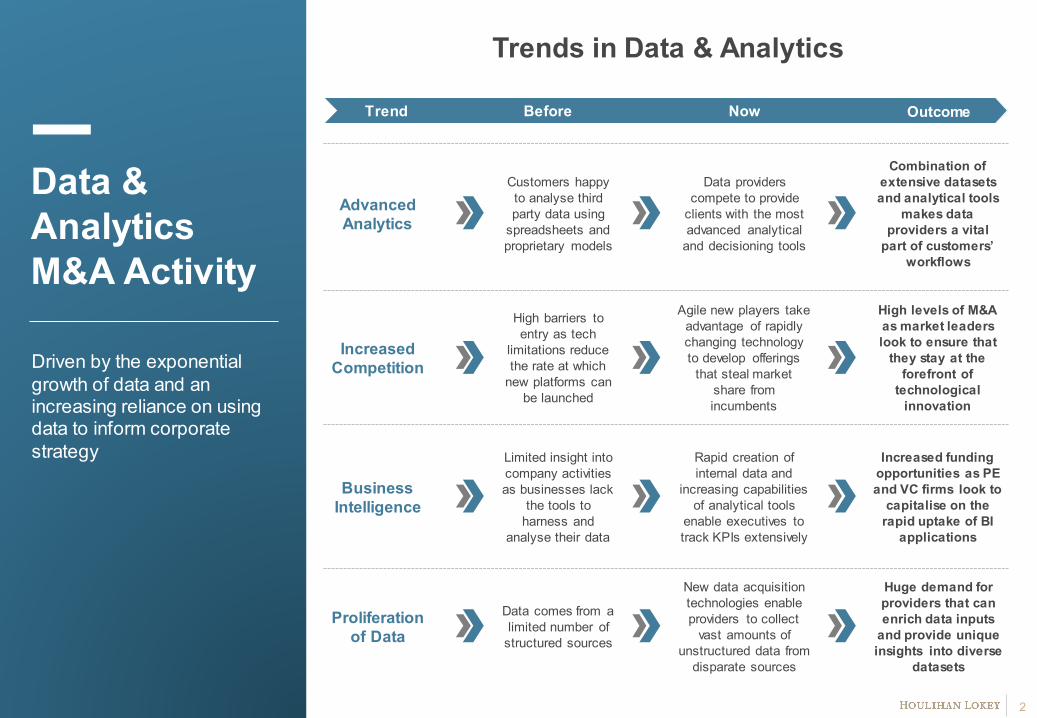
Trends in Data & Analytics
Trend Before Now Outcome
Advanced Analytics
Customers happy to analyse third party data using
spreadsheets and proprietary models
Data providers compete to provide
clients with the most advanced analytical
and decisioning tools
Combination of extensive datasets and analytical tools
makes data providers a vital
part of customers’ workflows
Agile new players take advantage of rapidly changing technologyto develop offerings
that steal market share from incumbents
Increased Competition
High barriers to entry as tech
limitations reduce the rate at which
new platforms can be launched
High levels of M&A as market leaders look to ensure that
they stay at the forefront of
technological innovation
Increased funding opportunities as PE and VC firms look to
capitalise on the rapid uptake of BI
applications
Limited insight into company activities as businesses lack
the tools to harness and
analyse their data
Business Intelligence
Rapid creation of internal data and
increasing capabilities of analytical tools
enable executives to track KPIs extensively
Proliferation of Data
New data acquisition technologies enable providers to collect
vast amounts of unstructured data from
disparate sources
Huge demand for providers that can enrich data inputs
and provide unique insights into diverse
datasets
Data comes from a limited number of
structured sources
Data & AnalyticsM&A Activity
Driven by the exponential growth of data and an increasing reliance on using data to inform corporate strategy
3
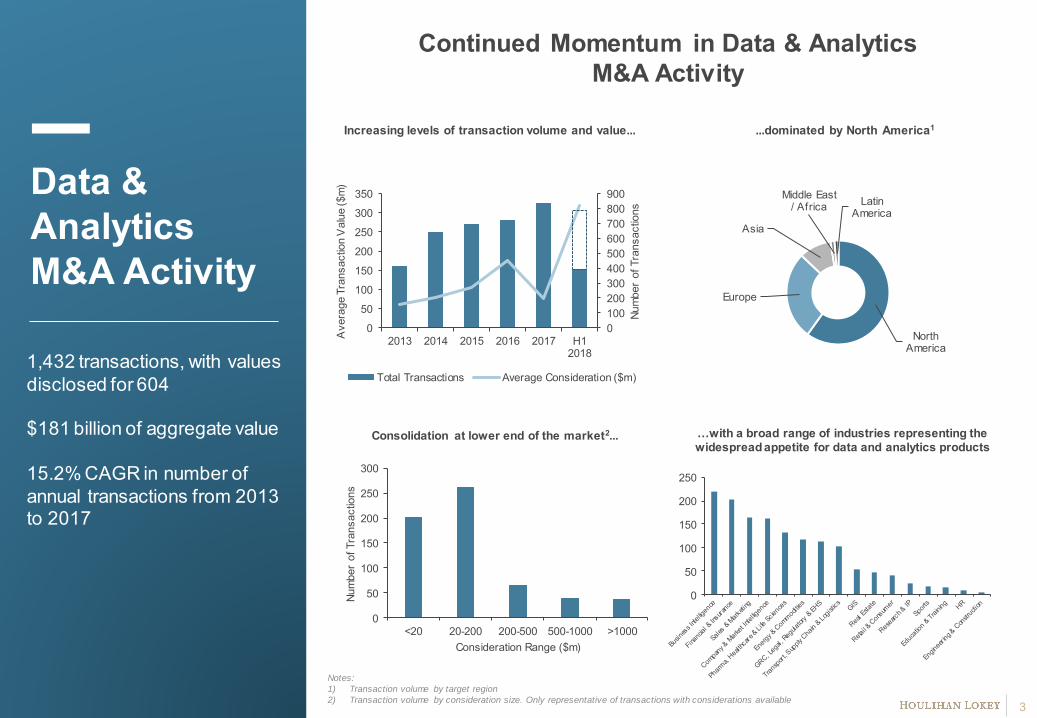
Continued Momentum in Data & Analytics M&A Activity
Data & AnalyticsM&A Activity
1,432 transactions, with values disclosed for 604
$181 billion of aggregate value
15.2% CAGR in number of annual transactions from 2013 to 2017
Increasing levels of transaction volume and value... ...dominated by North America1
Consolidation at lower end of the market2... …with a broad range of industries representing the widespread appetite for data and analytics products
Notes:
1) Transaction volume by target region
2) Transaction volume by consideration size. Only representative of transactions with considerations available
0
50
100
150
200
250
300
<20 20-200 200-500 500-1000 >1000
Num
ber
of T
rans
actio
ns
Consideration Range ($m)
0100200300400500600700800900
0
50
100
150
200
250
300
350
2013 2014 2015 2016 2017 H12018
Num
ber
of T
rans
actio
ns
Ave
rage
Tra
nsac
tion
Val
ue ($
m)
Total Transactions Average Consideration ($m)
.
0
50
100
150
200
250
North America
Europe
Asia
Middle East / Africa Latin
America
4
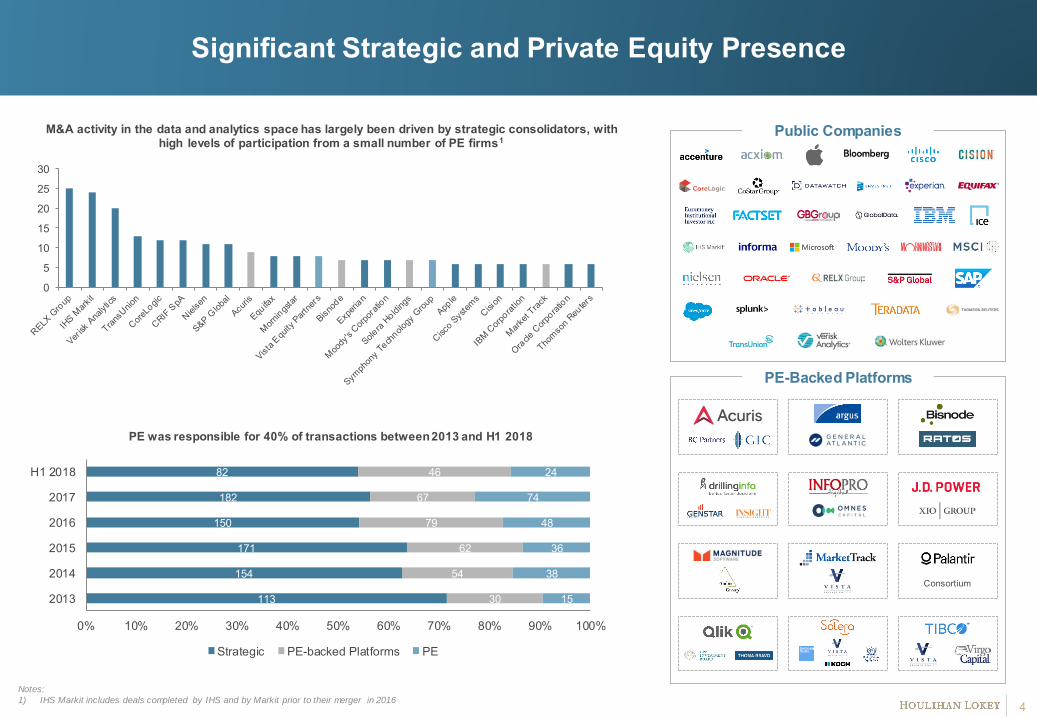
Significant Strategic and Private Equity Presence
M&A activity in the data and analytics space has largely been driven by strategic consolidators, with high levels of participation from a small number of PE firms1
PE was responsible for 40% of transactions between 2013 and H1 2018
Public Companies
113
154
171
150
182
82
30
54
62
79
67
46
15
38
36
48
74
24
0% 10% 20% 30% 40% 50% 60% 70% 80% 90% 100%
2013
2014
2015
2016
2017
H1 2018
Strategic PE-backed Platforms PE
0
5
10
15
20
25
30
Notes:
1) IHS Markit includes deals completed by IHS and by Markit prior to their merger in 2016
PE-Backed Platforms
Consortium
5
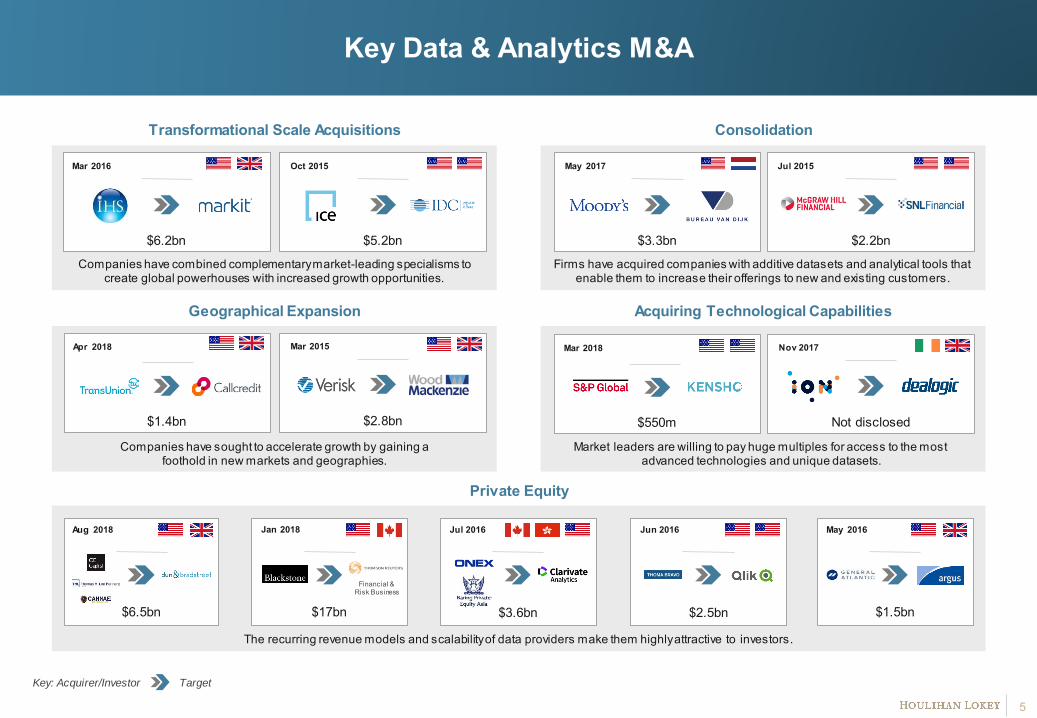
Key Data & Analytics M&A
Not disclosed
The recurring revenue models and scalability of data providers make them highly attractive to investors.
Companies have sought to accelerate growth by gaining a foothold in new markets and geographies.
Market leaders are willing to pay huge multiples for access to the most advanced technologies and unique datasets.
Firms have acquired companies with additive datasets and analytical tools that enable them to increase their offerings to new and existing customers.
Companies have combined complementary market-leading specialisms to create global powerhouses with increased growth opportunities.
Jul 2015
$2.2bn
Transformational Scale Acquisitions
Geographical Expansion
Consolidation
Private Equity
Acquiring Technological Capabilities
Key: Acquirer/Investor Target
Aug 2018
$6.5bn
May 2017
$3.3bn
Mar 2016
$6.2bn
Jan 2018
$17bn
Financial & Risk Business
Mar 2015
$2.8bn
Jun 2016
$2.5bn
May 2016
$1.5bn
Oct 2015
$5.2bn
Nov 2017
Not disclosed
Mar 2018
$550m
Apr 2018
$1.4bn
Jul 2016
$3.6bn

6
Some of the Key Factors ImpactingM&A Activity in the Sector
Houlihan LokeyInsight
Data & AnalyticsMarket Outlook
Over the next five years it is predicted that global expenditure on big data will increase from $130bn to $203bn per year. Digitization, the Internet of Things and a growing use of connected devices are all contributing to a massive increase in the rate at which data is created.
Rapid technological advancements are significantly increasing our capacity to capture and analyse large amounts of unstructured data. When combined with the exponential growth of data mentioned above, these developments present a great opportunity for information providers to collate data points from disparate sources and create datasets that can be sold to a wide range of end users. For example, social media data can be repackaged and sold to marketers for lead generation, to lenders for credit scoring, to insurers for pricing, and to legal teams for brand protection.
“…businesses are prepared to spend heavily to equip themselves with state-of-the-art AI capabilities that
make it easier to mine large amounts of data.”
In addition to raw data, customers are increasingly demanding analytical tools that make it easy for them to make decisions based on this information. In line with this, a recent report by IBM predicts that demand for data scientists will grow 28% by 2020 as businesses look to enhance their analytical capabilities. Above all, information providers are looking to develop advanced predictive and prescriptive analytics tools and grow expertise in Machine Learning and Artificial Intelligence.
In particular, businesses are prepared to spend heavily to equip themselves with state-of-the-art AI capabilities that make it easier to mine large amounts of data and increase productivity. One such example of this is S&P Global’s acquisition of Kensho, a firm that uses Machine Learning to scan actions such as political events to assess their impact on financial assets. Beyond financial services, AI has gained a lot of traction in industries such as pharma and cybersecurity, where it is being used to develop drugs and detect malicious activity, respectively.
7
Some of the Key Factors ImpactingM&A Activity in the Sector
Houlihan LokeyInsight
Data & AnalyticsMarket Outlook
In addition to third party data, companies are increasing their expenditure on products that enable them to analyse internal data to find operational efficiencies, optimize internal processes, and improve customer targeting. This manifested itself in our research, where M&A activity was highest in the Business Intelligence space than any other sector. The heightened demand for such products presents a significant opportunity for analytics providers, and there is no doubt that strategic consolidators will be looking to make acquisitions that extend their reach into this large addressable market.
The recurring revenue models, scalability, and diverse customer bases of data and analytics businesses have proved highly attractive to financial sponsors, who have been increasingly active in M&A in the sector over the past five years. The recent privatizations of Thomson Reuters Financial & Risk and Dun & Bradstreet, along with smaller deals for businesses such as Drillinginfo, Reorg Research, and EagleView Technologies are evidence of the continued appetite of private equity firms for deals in the data and analytics space.
“The recurring revenue models, scalability, and diverse customer bases of data and analytics businesses
have proved highly attractive to financial sponsors.”
As technological advances improve our capacity to curate and enrich data from diverse sources, and as AI and Machine Learning capabilities continue to improve, data and analytics products will become further engrained in the vital processes of most businesses, regardless of their industry. As a consequence, M&A activity in the sector is likely to increase as private equity firms look to capitalise on this trend and as industry behemoths use strategic acquisitions to pursue inorganic growth and gain access to the most advanced technology.
8
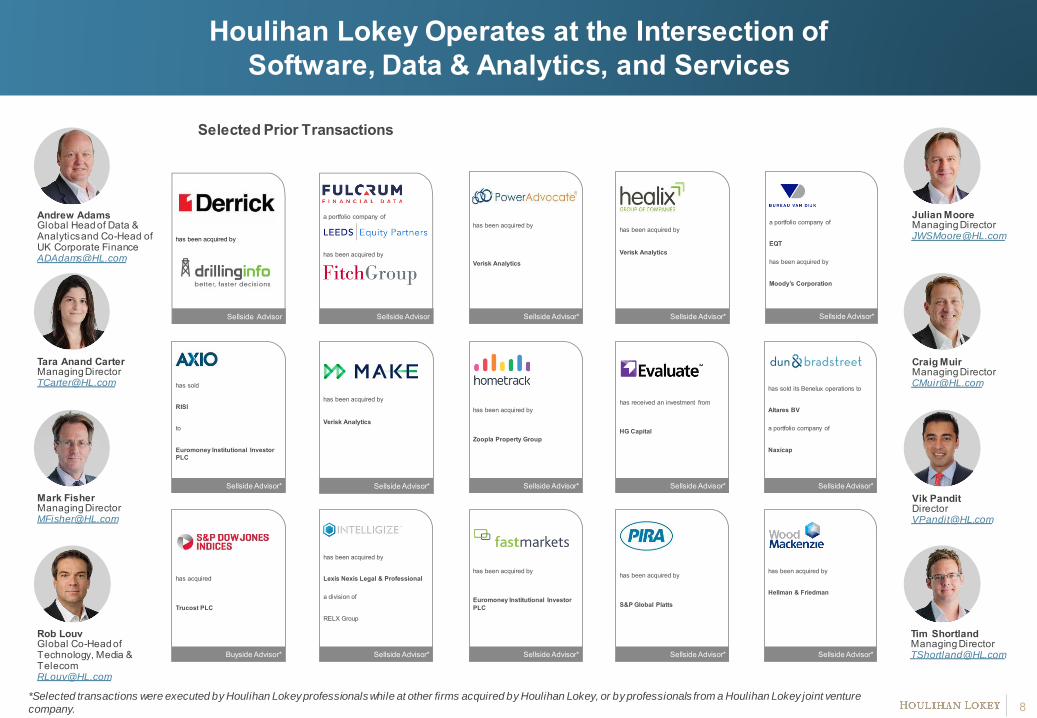
Houlihan Lokey Operates at the Intersection ofSoftware, Data & Analytics, and Services
Selected Prior Transactions
Mark FisherManaging [email protected]
Tara Anand CarterManaging [email protected]
Andrew AdamsGlobal Head of Data & Analytics and Co-Head ofUK Corporate [email protected]
Julian MooreManaging [email protected]
Craig MuirManaging [email protected]
*Selected transactions were executed by Houlihan Lokeyprofessionals while at other firms acquired by Houlihan Lokey, or by professionals from a Houlihan Lokey joint venture
company.
has been acquired by
Verisk Analytics
Sellside Advisor*
has been acquired by
Verisk Analytics
Sellside Advisor*
has been acquired by
Sellside Advisor
a portfolio company of
has been acquired by
Sellside Advisor
has sold
RISI
to
Euromoney Institutional Investor PLC
Sellside Advisor*
has acquired
Trucost PLC
Buyside Advisor*
has been acquired by
Lexis Nexis Legal & Professional
a division of
RELX Group
Sellside Advisor*
has been acquired by
Verisk Analytics
Sellside Advisor*
has been acquired by
Zoopla Property Group
Sellside Advisor*
has been acquired by
Euromoney Institutional Investor PLC
Sellside Advisor*
has received an investment from
HG Capital
Sellside Advisor*
has been acquired by
S&P Global Platts
Sellside Advisor*
a portfolio company of
EQT
has been acquired by
Moody’s Corporation
Sellside Advisor*
has sold its Benelux operations to
Altares BV
a portfolio company of
Naxicap
Sellside Advisor*
has been acquired by
Hellman & Friedman
Sellside Advisor*
Rob LouvGlobal Co-Head of Technology, Media & [email protected]
Tim ShortlandManaging [email protected]
9
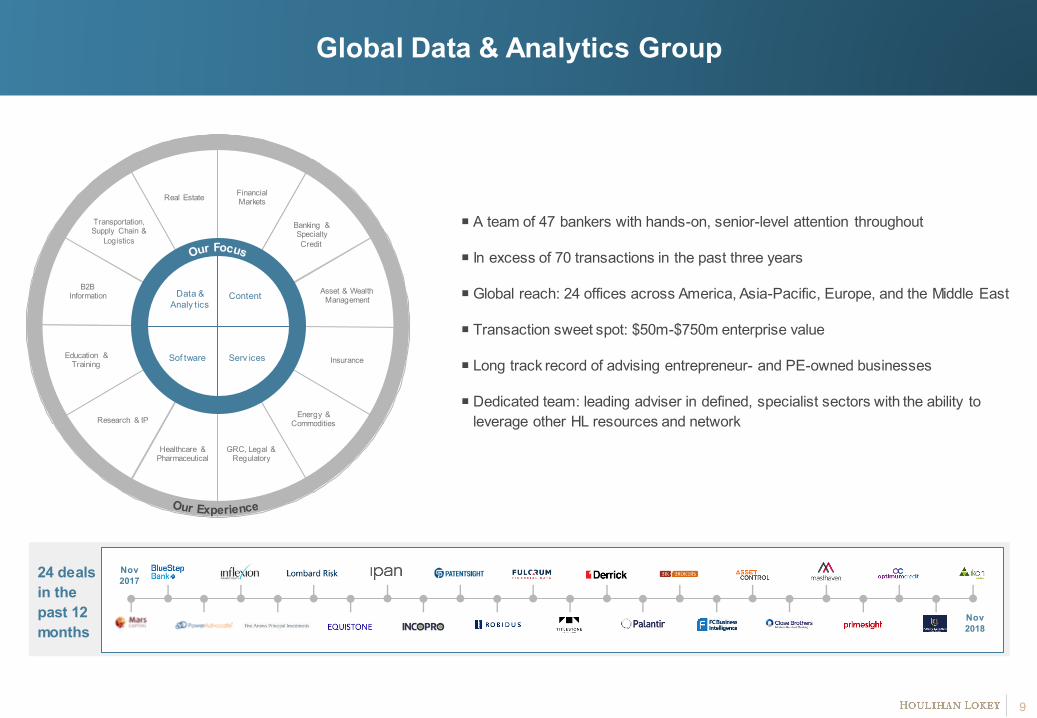
Global Data & Analytics Group
A team of 47 bankers with hands-on, senior-level attention throughout
In excess of 70 transactions in the past three years
Global reach: 24 offices across America, Asia-Pacific, Europe, and the Middle East
Transaction sweet spot: $50m-$750m enterprise value
Long track record of advising entrepreneur- and PE-owned businesses
Dedicated team: leading adviser in defined, specialist sectors with the ability to leverage other HL resources and network
Data & Analy tics
Content
Sof tware Serv ices
Real Estate Financial Markets
Banking & Specialty Credit
Asset & Wealth Management
Insurance
Energy & Commodities
GRC, Legal & Regulatory
Healthcare & Pharmaceutical
Research & IP
Education & Training
B2B Information
Transportation, Supply Chain &
Logistics
24 deals in the past 12 months
Nov 2017
Nov2018
10
M&A Analysis Methodology & Disclaimer
M&A data gathered from Mergermarket, PitchBook, S&P Capital IQ, Private Equity Wire, Finextra Research, MarketWatch, and GlobeNewswire. We have identified 1432 relevant transactions for the period 2013–H1 2018, of which 604 had considerations available. This includes acquisitions of both significant minority and majority stakes but does not include funding rounds.
Transactions are divided into 16 subsector categories: Business Intelligence, Company & Market Information, Education & Training, Energy & Commodities, Engineering & Construction, Financial & Insurance, GIS, GRC, Legal, Regulatory & EHS, HR, Pharmaceuticals, Healthcare & Lifesciences, Real Estate, Research & IP, Retail & Consumer, Sales & Marketing, Sports, Transport, Supply Chain & Logistics.
© 2018 Houlihan Lokey. All rights reserved. This material may not be reproduced in any format by any means or redistributed w ithout the prior w ritten consent of Houlihan Lokey.
Houlihan Lokey gathers its data from sources it considers reliable; how ever, it does not guarantee the accuracy or completeness of the information provided w ithin this presentation. The material presented reflects information know n to the authors at the time this presentation w as written, and this information is subject to change. Houlihan Lokey makes no representations or w arranties, expressed or implied, regarding the accuracy of this material. The view s expressed in this material accurately reflect the personal view s of the authors regarding the subject securities and issuers and do not necessarily coincide w ith those of Houlihan Lokey. Officers, directors, and partners in the Houlihan Lokey group of companies may have positions in the securities of the companies discussed. This presentation does not constitute advice or a recommendation, offer, or solicitation w ith respect to the securities of any company discussed herein, is not intended to provide information upon w hich to base an investment decision, and should not be construed as such. Houlihan Lokey or its aff iliates may from time to time provide investment banking or related services to these companies. Like all Houlihan Lokey employees, the authors of this presentation receive compensation that is affected by overall f irm profitability.
Houlihan Lokey is a trade name for Houlihan Lokey, Inc., and its subsidiaries and aff iliates, w hich include those in (i) the United States: Houlihan Lokey Capital, Inc., an SEC-registered broker-dealer and member of FINRA (www.finra.org)and SIPC (www.sipc.org) (investment banking services); Houlihan Lokey Financial Advisors, Inc. (f inancial advisory services); Houlihan Lokey Consulting, Inc. (strategic consulting services); HL Finance, LLC (syndicated leveraged finance platform); and Houlihan Lokey Real Estate Group, Inc. (real estate advisory services); (ii) Europe: Houlihan Lokey EMEA, LLP and Houlihan Lokey (Corporate Finance) Limited, authorized and regulated by the U.K. Financial Conduct Authority; Houlihan Lokey GmbH; Houlihan Lokey (Netherlands) B.V.; and Houlihan Lokey (España), S.A.; (iii) the United Arab Emirates, Dubai International Financial Centre (Dubai): Houlihan Lokey (MEA Financial Advisory) Limited, regulated by the Dubai Financial Services Authority for the provision of advising on f inancial products, arranging deals in investments, and arranging credit and advising on credit to professional c lients only; (iv) Singapore: Houlihan Lokey (Singapore) Private Limited, an "exempt corporate f inance adviser" able to provide exempt corporate f inance advisory services to accredited investors only; (v) Hong Kong SAR: Houlihan Lokey (China) Limited, licensed in Hong Kong by the Securities and Futures Commission to conduct Type 1, 4, and 6 regulated activities to professional investors only; (vi) China: Houlihan Lokey How ard & Zukin Investment Consulting (Beijing) Co., Limited (f inancial advisory services); (vii) Japan: Houlihan Lokey K.K. (f inancial advisory services); and (viii) Australia: Houlihan Lokey (Australia) Pty Limited (ABN 74 601 825 227), a company incorporated in Australia and licensed by the Australian Securities and Investments Commission (AFSL number 474953) in respect of f inancial s ervices provided to w holesale clients only. In the European Economic Area (EEA), Dubai, Singapore, Hong Kong, and Australia, this communication is directed to intended recipients, including actual or potential professional clients (EEA and Dubai), accredited investors (Singapore), professional investors (Hong Kong), and w holesale clients (Australia), respectively. Other persons, such as retail clients, are NOT the intended recipients of our communications or services and should not act upon this communication.

11
11
CORPORATE FINANCE
FINANCIAL ADVISORY SERVICESFINANCIAL RESTRUCTURINGSTRATEGIC CONSULTING
HL.com