data analysis and interpretation -...
TRANSCRIPT
Chapter-5: Data Analysis and Interpretation
112 | P a g e
DATA ANALYSIS AND INTERPRETATION
The previous chapter reviewed the growth structure of Retail Banking in India and
found that various products like Home loans, Consumer loan, Educational loan, Retail
deposits, ATMs facilities etc. have been expanding at an appreciable rate in India. It
discussed the working of retail banking in India and provided an insight into the
management of various retail products both in public sector banks and private sector
banks. A clear picture of the performance of public sector banks and private sector
banks in recent years came to fore highlighting that retail banking in private sector
banks grows at a faster rate than in public sector banks.
The present chapter analyses the data and, with the application of statistical
tools, interprets the facts and figures to test the set hypotheses in order to derive
logical inferences. Since the test of hypotheses involves measurement of the customer
perceptions of Service Quality of retail banking in public and private sector banks,
setting the dimensions of service quality to serve as benchmarks for measurement and
test of hypotheses becomes imperative. Accordingly, the present chapter is split into
two parts. Section-I presents a detailed view of the concept of Service Quality and
also lays down the various dimensions of the SERVQUAL Model applied to survey
and garner data about perceptions of customer satisfaction with retail banking services
in banks of both the sectors-public and private. Section-II on the other hand, is
devoted to the collection of data, its analysis and interpretation as well as to critically
test the hypotheses constructed on the service quality dimensions in retail banking in
India and draw conclusions.

Chapter-5: Data Analysis and Interpretation
113 | P a g e
SECTION-I
Quality of service is an intangible and multi-dimensional feature. Ascertainment of it
requires taking all of its conceivable dimensions into consideration. This section
identifies and delineates the different dimensions of “service quality”. The significant
attributes that can reflect the customer’s perception with regard to service quality in
retail banking are discussed here. An elaborate explanation of each attribute of
Service Quality dimension is also presented in this section.
Prior to proceeding to deal with the dimensions of service quality, a
conceptual discussion of ‘Quality’ and ‘Service’ and the ‘Service Quality’
significance in relation to banks will be pertinent.
A. CONCEPT OF “SERVICE QUALITY”
5.1. Quality
Quality is the foremost key requirement that influences the formation of perception
and level of satisfaction of the customer with regard to any product and service. In
terms of banking growth, quality plays an important role. The basic concept of quality
can be defined as, “meeting to the need of customer”. In most generalized way the
quality term can be defined as “the inclusion of all specified features and
characteristics as defined for product or service and its ability to satisfy the given
needs as per the requirement of user while using it.” Edward Deming (1999) define
Quality as, “A predictable degree of uniformity & dependability to low cost and
suited to the market”
Phillips Crosby (1980) defined quality as, “Quality is conformance to
requirements”.

Chapter-5: Data Analysis and Interpretation
114 | P a g e
Quality is a degree to which a set of inherent characteristics fulfills the requirements.
5.2. Service
Service is a patch up activity to fulfill someone’s need in the market. Service is
something, which can be experienced but cannot be touched or seen. Services offered
by service providers cannot be seen & touched, as they are intangible activities. Some
of the basic and comprehensive definitions of service as given by different authors
are:
1. “A service is any activity or benefit that one party can offer to another which
is essentially intangible and does not result in the ownership of anything.”
---Kotler, Armstrong, Saunders & Wong
2. “Services are the production of essentially intangible benefits and experience,
either alone or as part of a tangible product through some form of exchange,
with the intention of satisfying the needs, wants and desires of the consumers.”
--- C. Bhattachargee
Customer wants to avail different services offered to them by service
providers. Delivered service will become as the quality service if it meets the
customer’s expectation. But customer expectation depends upon the customer
perception, which may differ from person to person.
5.3. Service Quality
Service quality is a critical determinant of competitiveness of establishing and
sustaining satisfying relationships with customers. Service quality by its nature is an
exclusive and abstract concept, which has been defined from different perspective and
orientation. Groonroos (1984) has defined service quality as,” the outcome of an
Chapter-5: Data Analysis and Interpretation
115 | P a g e
evaluation process, where the customers compare their expectations with the services
they have received”.
Persuraman, Zeithaml and Berry (1985) defined service quality as the
customer’s comparison between service expectation and service performance.
Cronin & Taylor (1992) argued that conceptualization of service quality is a
gap between expectations and performance. According to them service quality should
be based on customers attitude towards the service.
Fogli (2006) define service quality as, “a global judgment or attitude relating
to a particular service, the customer’s overall impression of the relative inferiority or
superiority of the organization and its services. Service quality is a cognitive
judgment”.
Service quality is nothing but the difference between the service expectation &
service actually received by the customer. Customer has certain expectation about the
service. If the customers experiences the same service as they expect then this
difference will be zero and we can say that the service quality is very good.
Ostrowski et.al (1993) observed that service quality is a way of thinking about
how to satisfy customers so that they hold positive attitude towards the services they
have received.
5.4. Service Quality in Banks
Service quality is one of the critical success factors that influence the competitiveness
of an organization. A bank can differentiate itself from competitors by providing high
quality service. Service quality is one of the most attractive areas for researches over
the last decade in the retail banking sector. This study investigates the factors that
enable banks to attract and maintain their customers. In India, customers in the
Chapter-5: Data Analysis and Interpretation
116 | P a g e
banking sector are in a strong bargaining position due to the significant growth of
banks. Therefore banks have to provide, service carefully because of the cut throat
competition among the banks. Banks have to improve the service level continuously.
There is no guarantee that what is excellent service today is also applicable for
tomorrow. To survive in the competitive banking industry, banks have to develop new
strategies which will satisfy their customer. That is why in this competitive banking
environment, customer satisfaction is considered as the essence of success. High
customer satisfaction is important in maintaining a loyal customer base. High quality
of service will result in high customer satisfaction and increase customer loyalty.
Customer satisfaction is the outcome of service quality.
Many of the researches on service quality have been in the developed
countries even though service is among the fastest growing sectors in emerging
countries. The bulk of the researches on service quality in banks has been in the
context of US and European banking institution. However with India now at the path
of growth and aiming global integration has become a source of learning for many
other economies.
Banking sector in India has made remarkable progress since independence. It
has undergone a major transformation from class banking to mass banking. The
banking endeavors to provide effective customer service at lowest costs have been
further facilitated through innovation and communication aided by information
technology. IT based services such as automated teller machines (ATM), electronic
fund transfer, anywhere-anytime banking, smart cards, net banking, swift etc are no
longer alien concepts to Indian banking customers. As India continues to move
towards greater economic liberalization, meeting the expectations of the customers in
Chapter-5: Data Analysis and Interpretation
117 | P a g e
all areas relating to customer service has been of prime importance for the banking
sector in India. Global competition has forced Indian bankers to enter the trade-off
between winning new customers and retain old ones.
Issues concerning service quality in Indian Banking sectors have to be studied
extensively, so that they could sustain and grow on the face of stiff competition, by
learning from their counterparts in developed economics like the USA and Europe.
A successful banker must have the ability to anticipate and satisfy customer needs. To
provide faster and more efficient services the Indian banking sector has to realize the
importance of customer care and satisfaction.
Service quality and customer satisfaction are two closely related terms. Service
quality can be assessed in two ways:
1. Is it conforming to standard? and
2. Is it satisfying the customers?
Oliver (1999) states as, “Satisfaction is the consumer’s fulfillment response. It
is a judgment that a product or service feature, or the product or service itself,
provides a pleasurable level of consumption – related fulfillment”. Customer
satisfaction is related with the type of service quality. If the quality of service
provided by the service provider is good then this leads to higher customer
satisfaction.
Service quality management and improvement is the constant endeavor of
service-conscious organizations. Metric application serves as a tool for measuring
service quality and bringing about improvement in areas of deficiency. Large
organization introduce the quality metrics for improving the quality management
processes. They generally collect metrics on several attributes and defects. The

Chapter-5: Data Analysis and Interpretation
118 | P a g e
Metrics help to identify the strong and weak attributes. Improving upon the weak
areas, several organization are able to make their service quality better, efficient and
meeting the customer satisfaction.
B. MEASUREMENT OF SERVICE QUALITY
Measurement of quality of a service can be a very difficult exercise. Unlike
product where there is particular specification such as length, depth, width, weight,
colour etc. a service can have numerous intangibles or qualitative specification. In
addition there is expectation of the customer with regard to the service, which can
vary considerably based on a range of factors such as prior experience, personal needs
and what other people may have told them.
5.5. SERVQUAL
As a way of trying to measure service quality, researchers have developed a
methodology known as SERVQUAL – a perceived service quality questionnaire
survey methodology. SERVQUAL provides a technology for measuring and
managing service quality (SQ) developed by Parsuraman, Zaithaml and Berry in
1985.
Servqual is founded on the view that the customer’s assessment of Service
Quality is paramount. This assessment has been conceptualized as a gap between
what the customers expect by way of SQ from a class of service providers and their
own evaluation of the performance of a particular service provider.
The model is employed as a generic instrument for measuring Service Quality
across different service sectors. It is regarded as the most appropriate tool to measure
and assess service quality in industrial & commercial sectors like banking, telecom,

Chapter-5: Data Analysis and Interpretation
119 | P a g e
hospitals, and healthcare, hotels and fast food chain, travel &tourism, education and
hospitality etc.
Though not devoid of criticism whether the SERVQUAL dimensions for
assessment of service quality are applicable equally well to all sorts of industrial
sectors, yet the instrument has been developed for use in various service settings and
yields results which are most representative of the factual ascertainment of service
quality. Several academic researchers and practitioners worldwide have extensively
adopted the SERVQUAL instrument to measure service quality. Accordingly, the
SERVQUAL Model is being made use of by this study to assess and measure the
Service Quality in retail banking services rendered by public and private sector banks
in India.
C. SERVICE QUALITY DIMENSIONS
SERVQUAL is a multi-dimensional construct. It consists of five most important
dimensions. These dimensions are most representative and eliciting of the customer
satisfaction from the quality of a particular service. The relationship between service
quality and customer satisfaction based on SERVQUAL is depicted in the figure 5.1
below

Chapter-5: Data Analysis and Interpretation
120 | P a g e
TANGIBLES
RELIABILITY
RESPONSIVENESS
ASSURANCE
EMPATHY
Service Quality
Dimensions SERVQUAL
Customer Satisfaction in Retail Banking
in India
Fig.5.1. Service Quality Dimensions
The above diagram brings to fore the five components of the SERVQUAL
dimensions. These are Tangibles, Reliability, Responsiveness, Assurance and
Empathy. The perception of customers obtained on these five dimensions would
provide the measure of service quality. A brief description of each of these five
dimensions of SERVQUAL is presented below:
5.6. TANGIBLES
Tangibles refer to the factors which represents the physical features of the bank. They
are important for banking business as tangibles make the indelible first impression
during face to face contact between the customer and the bank. Impressive tangibles
fill the customers with confidence that they are dealing with the bank where their
financial interests are safe and secure. Examples of tangible factors are the use of
cutting –edge technology and equipment, modern amenities and physical facilities for
customers within bank premises, appearance and deportment of bank personnel, and
above all the physical features of bank building and inner layout which presents an
Chapter-5: Data Analysis and Interpretation
121 | P a g e
ambience attractive and appealing to customers. Pamphlets and brochures giving out
important information about product and services offered by bank also make an
important category of tangibles. The elegance and get up of the published material,
the clarity and articulation of information themselves imprint in customers’ mind an
everlasting impression of goodwill and pride to do business with such an standard
banking organization.
Thus, tangibles are always appealing in the banking sector. They form an
important dimension in the perception of customers with regard to the service quality
availed by them from the banks.
5.7. RELIABILITY
Reliability refers to the customers’ perception with regard to the redemption of
commitment by bank to render the service honestly, sincerely, timely, and
satisfactorily as envisioned by the customer. Factors included in the reliability
dimensions are such as, ‘performing what is promised’ and doing it ‘at the promised
time’ by the bank. Most importantly, reliability perception aims at inculcating in
customers’ mind the belief that the financial records and statements as maintained and
presented to customers by bank are error free, accurate and dependable. Customers
trust in the bank reflects the level of customer satisfaction with regard to reliability of
its service quality.
5.8. RESPONSIVENESS
The ‘Responsiveness’ dimension of service quality includes factors conditioning the
customers’ perception with regard to banks’ attention and action to issues related to
customers. Factors reflecting to responsiveness are rendering instant services,
quickness in attending to problems, promptness in taking action, sagaciousness in

Chapter-5: Data Analysis and Interpretation
122 | P a g e
decision making, disposition of grievance within committed time etc. With the
advancement of technology, customers expect that their problems will be responded
as soon as possible. Lack of responsiveness would make the customers switch over to
the other banks. This underscores the significance of responsiveness as a service
quality dimension.
5.9. ASSURANCE
Assurance refers to the service quality dimension that makes the customer sure that
the transaction dealings are fair and safe with the bank. Assurance involves factors
like trust on the bank employees, keeping privacy of customers’ transactions,
providing access to information to genuine customers etc. An overall feeling of
confidence in customers that bank employees have professional knowledge and
experience and render answer to customers queries which are genuine and trustworthy
is also an important attribute of assurance.
5.10. EMPATHY
The service quality represented by Empathy indicates the ability of the bank to
understand customers’ feelings and the situations they are in for help and assistance.
The attribute of empathy demands an inclination in the attitude of bank personnel to
give personal consideration and priority attention to customers. It deals with the
quality of personal interaction of the employees with their customers as well as
sympathetic response to their queries and complaints.
Chapter-5: Data Analysis and Interpretation
123 | P a g e
SECTION-II
The foregoing Section-I presented conceptual explanation of the service quality and
delineated on its nature and scope. Also the attributes of service quality and their
respective dimensions have been diagrammatically represented and textually
explained at length. The various factors included in each attribute that capture and
reflect the customer perception of the service quality have been identified for use in
the collection of data for the purpose of this study.
The present Section-II is accordingly ear-marked for collection of data on the
basis of SERVQUAL Dimensions and benchmarks set in the foregoing section to
ascertain service quality in retail banking rendered by public and private sector banks.
The analysis and interpretation of data with the help of statistical tools has also been
carried out in this section. On the basis of logical inferences drawn from the analysis
and interpretation of facts and figures, the hypotheses formulated for the study have
been tested at the end.
A. DATA COLLECTION
The study bases itself on primary data collected by using the SERVQUAL model for
ascertaining the service quality of retail banking in India. The information has been
elicited through a field survey by means of a well designed questionnaire comprising
of queries on the various service quality attributes and their dimensions as identified
and contained in the SERVQUAL. One additional attribute has been added to the
original SERVQUAL. This relates to ascertainment of ATM Service Quality which is
one of the most important factors that reflects the service quality of banks in retail
segment. The questionnaire has been administered on a randomly selected sample of
Chapter-5: Data Analysis and Interpretation
124 | P a g e
customers availing retail banking services from the private and public sector Indian
banks. The spread of survey covers nine districts of the State of Uttar Pradesh,
Uttarakhand and Delhi
A blow-up of the methodology adopted for primary data collection is
presented below.
5.11. UNIVERSE
The universe or population represents the entire group of units concerned with the
particular study. Thus, the population could consist of all the living and non-living
units in the country, or those in a particular geographical location, or a special ethnic
or economic group, depending on the purpose and coverage of the study.
In the present study all the customers of banks in India are considered as
Universe. These are the customers who have their accounts in different banks of the
country whether it is Public Sector Banks or Private Sector Banks. The universe of
this study is specifically concerned with those customers of banks in India who are
availing services of the retail banking segment.
As the collection of complete data from all the customers in the universe is not
possible, a select sample of geographical areas as well as of customers is chosen for
data collection for this study.
5.12. SAMPLE
Sample represents the subset of population. A sample is a finite part of a statistical
population whose properties are studied to gain information about the whole. When
dealing with people it can be defined as a set of respondents (people) selected from a
large population for the purpose of a survey.

Chapter-5: Data Analysis and Interpretation
125 | P a g e
For this research, samples have to be taken since it is not possible to cover
such a vast country as India on account of impediments of time, finance and other
resources required for the purpose. Hence, the geographical area for the survey as
well as the bank customers (respondents) to the questionnaire have been selected in
such a manner that the whole country is represented and the conduct of research work
gets convenient in handling and possible for completion.
As regards the geographical coverage, the Northern Region, which stands out
as the biggest region of India, has been chosen. Since this region consists of large
number of cities spread over different States and Union Territory, necessity arose to
further abridge the geographical area selecting a few important cities from the
Northern Region of India. Accordingly, nine big cities with huge banking population
have been taken as sample for survey under this study. These nine cities are spread
over three northern Indian States, namely, Uttar Pradesh, Uttarkhand and Delhi. The
city of Delhi also happens to be the Capital of India. Being a metropolitan and
cosmopolitan city, Delhi alone represents the whole of India and hence makes this
study more representative and reliable. Other selected cities besides Delhi are: Agra,
Aligarh, Lucknow, Mathura, Dehradun Moradabad, Kanpur, and Noida.
Respondents have been drawn from the nine cities to a manageable handling
limit of 500, of which 497 responded. The selection of these respondents is at random.
This mode of selection rules out any bias creeping into the opinion survey and lends
lot of credence to the outcome of the study.

Chapter-5: Data Analysis and Interpretation
126 | P a g e
5.13. QUESTIONNAIRE
Descriptive research has been conducted to gain an insight into consumers perceived
service quality, offered by banks with respect to five dimensions of SERVQUAL
scale. A structured questionnaire based on SERVQUAL scale (Persuraman et.al.
1985) has been used for data collection for this research with some modification. The
modified questionnaire maintains the number of dimensions of SERVQUAL to five,
but substitutes the dimension of ‘Empathy’ by ‘ATM Service Quality’. Thus, the five
dimensions of questionnaire comprise Tangibles, Reliability, Responsiveness,
Assurance and ATM Service Quality.
The design and structure of the questionnaire is simple, study specific
unambiguous and capable of seeking objective type of answers through marking a tick
only. The queries that elicit information about the perception of customers under five
dimensions have a direct bearing as the hypotheses of this study. Each of the five
dimensions asks questions specifically related to the dimensions. The customers have
been requested to rate the service quality variables at five point scale on the basis of
their perceived service quality and their satisfaction level towards the banks. Against
every question in each statement, five options of answers are given, i.e ‘Strongly
Agree’; ‘Agree’; ‘Neutral’; ‘Disagree’ and ‘Strongly Disagree’. Each respondent is
advised to tick the option that represents the perception most truly and faithfully.
5.14. ADMINISTRATION OF QUESTIONNAIRE
The universe for collection of data consists of the customers of private and public
sector banks spread all over India. Their full coverage being not possible on account
of restraints by a host of factors, a representative sample of respondents as well as the
geographical area as explained under ‘Sample’ technique has been taken for
Chapter-5: Data Analysis and Interpretation
127 | P a g e
administrating the questionnaire. The sample consists of 500 respondents (bank
customers) and the geographical area covered comprised of nine big cities of three
States in the Northern Region of India and includes the Capital city of Delhi which
alone represents the respondents from all parts of India. Besides Delhi, the other cities
are Aligarh, Agra, Lucknow, Moradabad, Mathura, Noida, Dehradun and Kanpur.
The mode of administration of questionnaire on respondents is through direct
personal investigation. It is blended with ‘Convenience’ of respondents. Since the
sample population of bank customers comprised of educated persons who could read,
understand and tick their perceptions in the boxes provided for answers in the
questionnaire at their convenient time, they were handed over questionnaire to be
collected from them at the pre-fixed time and date. Yet, while getting back the
questionnaire discussions and clarification were made to help get the perceptions
expressed by the respondents as they really felt. Larger number of respondents
approached, however, obliged by filling the questionnaire face to face. Thus, the
direct investigation method adopted for this study reassures that the information
collected is more accurate, reliable, and trustworthy in reflecting the results of this
research.
5.15. RESPONSE
Customers of the banks gave a highly encouraging response. About 600
questionnaires have been distributed out to cover the sample size of 500 out of which
497 completely filled questionnaire have been received from the different customers
of the banks. The response has, thus been more than 80 percent. Moreover, the
respondents took very cooperative and sincere interest and care of appropriately
ticking their perceptions on the scale of preference provided in the questionnaire and
Chapter-5: Data Analysis and Interpretation
128 | P a g e
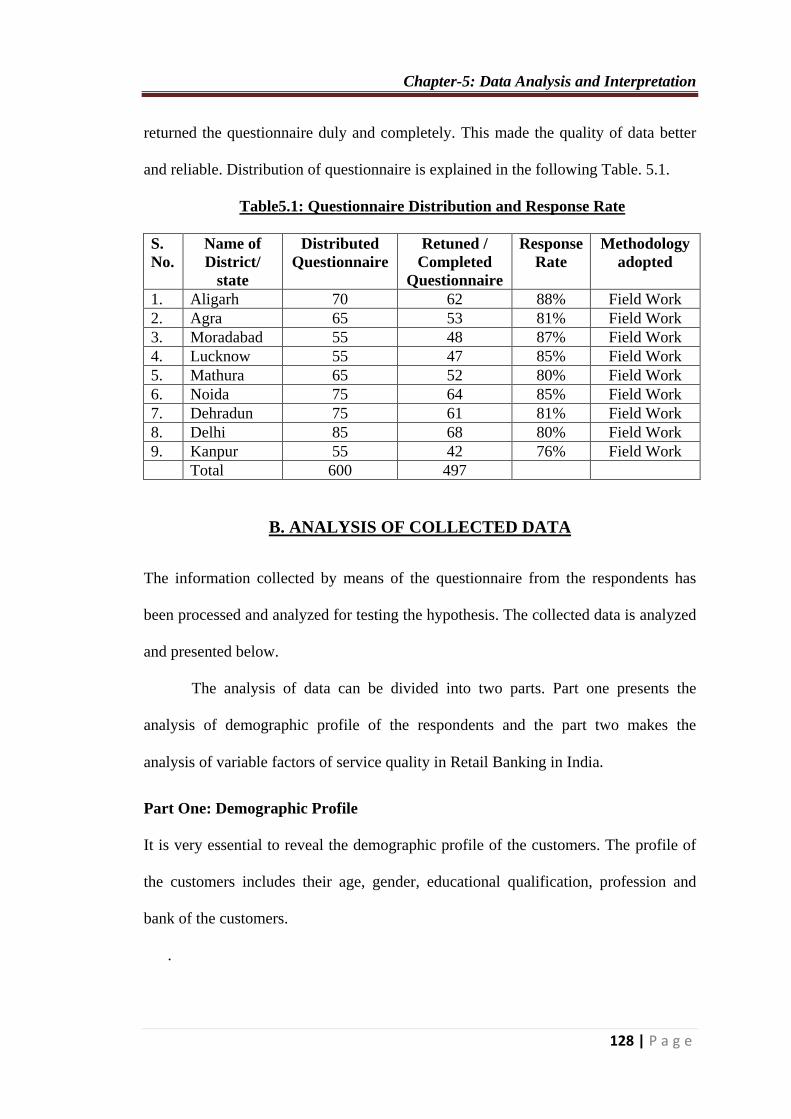
returned the questionnaire duly and completely. This made the quality of data better
and reliable. Distribution of questionnaire is explained in the following Table. 5.1.
Table5.1: Questionnaire Distribution and Response Rate
S.
No.
Name of
District/
state
Distributed
Questionnaire
Retuned /
Completed
Questionnaire
Response
Rate
Methodology
adopted
1. Aligarh 70 62 88% Field Work
2. Agra 65 53 81% Field Work
3. Moradabad 55 48 87% Field Work
4. Lucknow 55 47 85% Field Work
5. Mathura 65 52 80% Field Work
6. Noida 75 64 85% Field Work
7. Dehradun 75 61 81% Field Work
8. Delhi 85 68 80% Field Work
9. Kanpur 55 42 76% Field Work
Total 600 497
B. ANALYSIS OF COLLECTED DATA
The information collected by means of the questionnaire from the respondents has
been processed and analyzed for testing the hypothesis. The collected data is analyzed
and presented below.
The analysis of data can be divided into two parts. Part one presents the
analysis of demographic profile of the respondents and the part two makes the
analysis of variable factors of service quality in Retail Banking in India.
Part One: Demographic Profile
It is very essential to reveal the demographic profile of the customers. The profile of
the customers includes their age, gender, educational qualification, profession and
bank of the customers.
.

Chapter-5: Data Analysis and Interpretation
129 | P a g e
5.16. Age of the Respondents
Age of the customers is one of the important profile variables of the customers. It
shows their level of experience and maturity. In the banking industry, age plays a
predominant role in their level of satisfaction on the service quality of the banks. In
general the youngsters expect more than the elders who are highly experienced and
emotional. The age of the customers in the present study is confined to below 25
years, 25-35, 35-45, 45-55 and above 55. The distribution of the customers on the
basis of their age is given in Table 5.2
Table 5.2: Age Wise Distribution of Customers
Age (in years) Number of Customers Total
Number Public Sector Banks
(PSBs)
Private Sector Banks
(Prv. SBs)
Number Percentage Number Percentage
Below 25 134 26.96 0 0
25 – 35 109 21.93 104 20.93 213
35 – 45 42 8.45 30 6.04 72
45 – 55 42 8.45 15 3.02 57
Above 55 13 2.61 8 1.61 21
Total 340 68.4 157 31.6 497
From the above table it is clear that the important age group among the
customers is 25 to 35 years which constitute 21.93 percent in Public Sector Banks and
20.93 percent in Private Sector Banks The age group of below 25 years constitutes the
highest number of 134 customer or 26.96 percent in the Public Sector Banks while in
Private Sector Banks the age group below 25 years constitute the zero. The age group
of 35-45 years constitutes 42 respondents in Public Sector Bank and 30 respondents in
Private Sector Banks yielding a percentage of 8.45 and 6.04 respectively. The age
group above 55 which reveals the senior citizens customer of the banks constitutes 13
with a percentage of 2.61 in Public Sector Bank and 8 with the percentage of 1.61 in
Chapter-5: Data Analysis and Interpretation
130 | P a g e
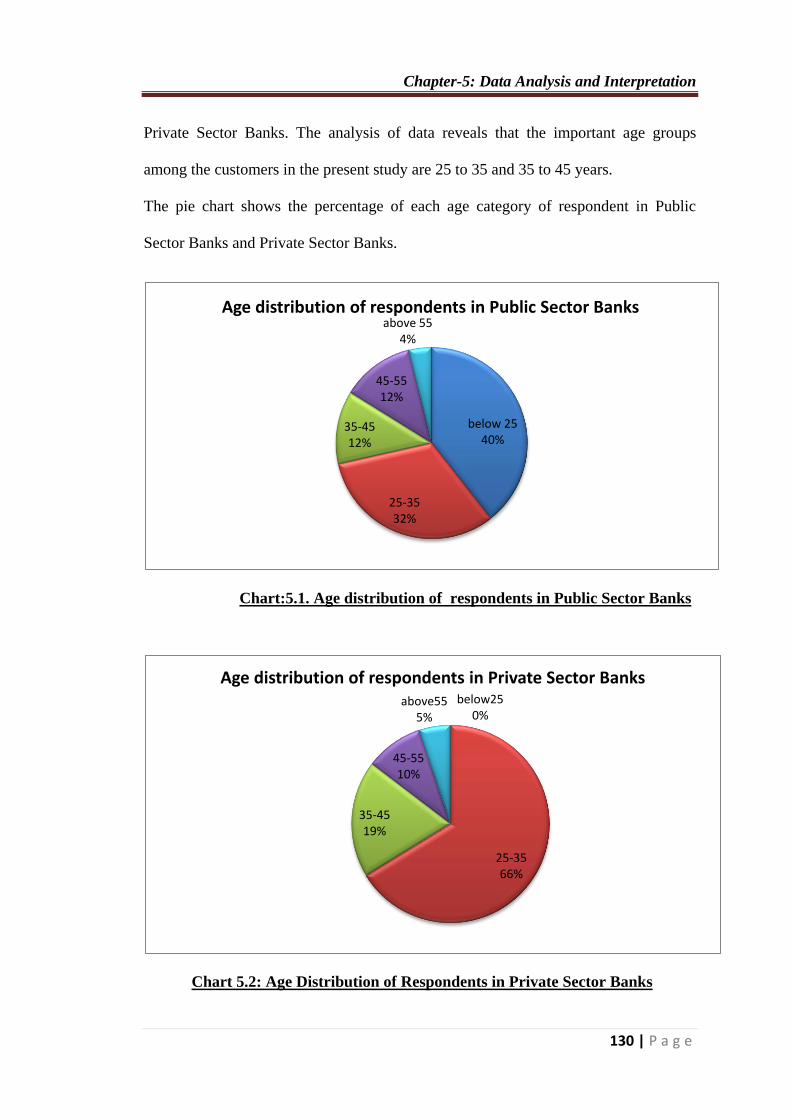
Private Sector Banks. The analysis of data reveals that the important age groups
among the customers in the present study are 25 to 35 and 35 to 45 years.
The pie chart shows the percentage of each age category of respondent in Public
Sector Banks and Private Sector Banks.
Chart:5.1. Age distribution of respondents in Public Sector Banks
Chart 5.2: Age Distribution of Respondents in Private Sector Banks
below 25 40%
25-35 32%
35-45 12%
45-55 12%
above 55 4%
Age distribution of respondents in Public Sector Banks
below25 0%
25-35 66%
35-45 19%
45-55 10%
above55 5%
Age distribution of respondents in Private Sector Banks
Chapter-5: Data Analysis and Interpretation
131 | P a g e
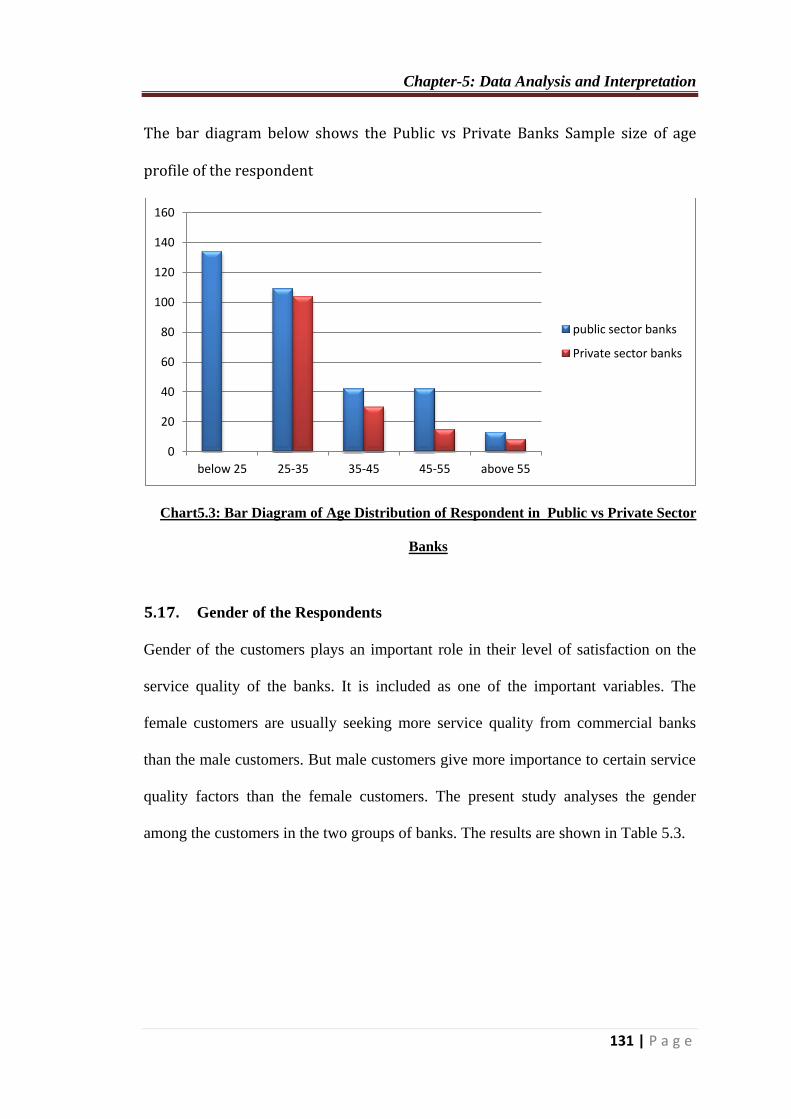
The bar diagram below shows the Public vs Private Banks Sample size of age
profile of the respondent
Chart5.3: Bar Diagram of Age Distribution of Respondent in Public vs Private Sector
Banks
5.17. Gender of the Respondents
Gender of the customers plays an important role in their level of satisfaction on the
service quality of the banks. It is included as one of the important variables. The
female customers are usually seeking more service quality from commercial banks
than the male customers. But male customers give more importance to certain service
quality factors than the female customers. The present study analyses the gender
among the customers in the two groups of banks. The results are shown in Table 5.3.
0
20
40
60
80
100
120
140
160
below 25 25-35 35-45 45-55 above 55
public sector banks
Private sector banks

Chapter-5: Data Analysis and Interpretation
132 | P a g e
Table 5.3: Distribution of the customers based on Gender
S.
No.
Gender Public Sector Banks Private Sector Banks Total
Number Percentage Number Percentage Number Percentage
1. Male 187 37.63 143 28.77 330 66.40
2. Female 144 28.97 23 4.63 167 33.60
Total 331 65.60 166 33.40 497 100.00
The pie chart shows the percentage of each gender category of respondent in Public
Sector Banks and Private Sector Banks.
Chart 5.4: Gender Profile of Respondent in Public Sector Banks
MALE 56%
FEMALE 44%
Gender profile of respondents in Public Sector Banks
Chapter-5: Data Analysis and Interpretation
133 | P a g e
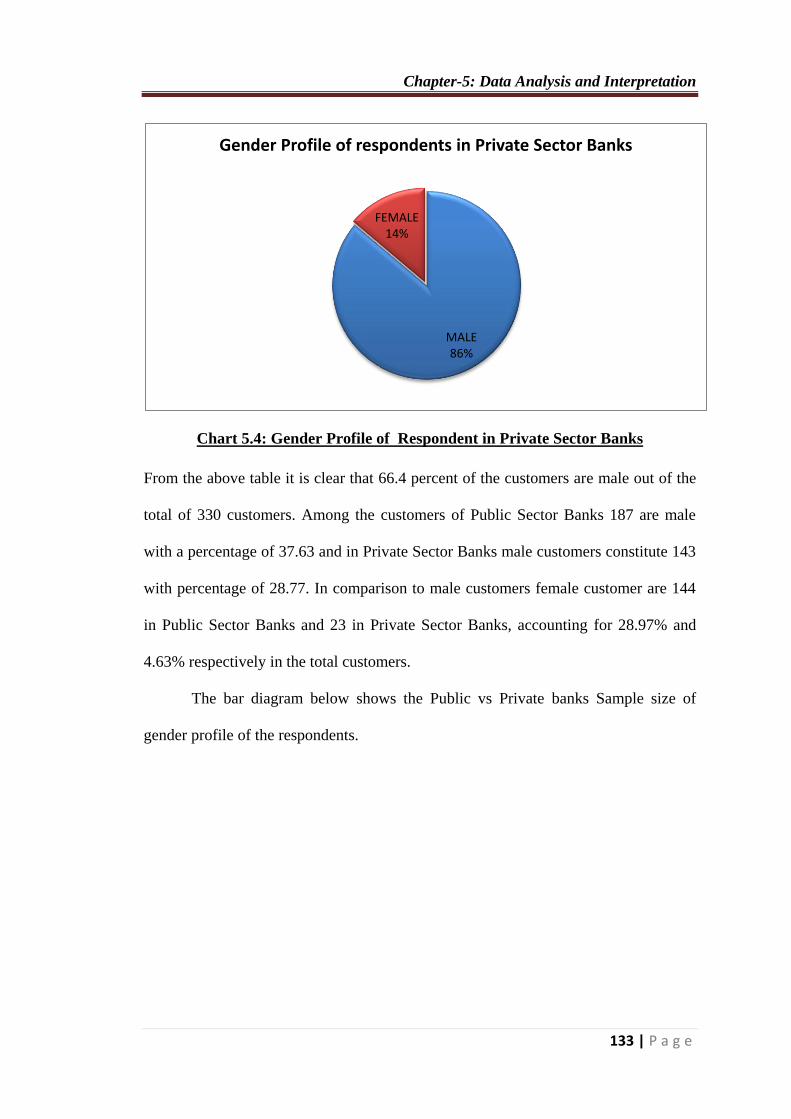
Chart 5.4: Gender Profile of Respondent in Private Sector Banks
From the above table it is clear that 66.4 percent of the customers are male out of the
total of 330 customers. Among the customers of Public Sector Banks 187 are male
with a percentage of 37.63 and in Private Sector Banks male customers constitute 143
with percentage of 28.77. In comparison to male customers female customer are 144
in Public Sector Banks and 23 in Private Sector Banks, accounting for 28.97% and
4.63% respectively in the total customers.
The bar diagram below shows the Public vs Private banks Sample size of
gender profile of the respondents.
MALE 86%
FEMALE 14%
Gender Profile of respondents in Private Sector Banks

Chapter-5: Data Analysis and Interpretation
134 | P a g e
5.5: Bar Diagram of Gender profile of Public vs Private Sector Banks
5.18. Level of Education of the Respondents
The level of education provides more knowledge and exposure on the competitive
service offered by the commercial banks with globalised scenario. Hence the level of
education of the customers is included as one of the profile variable. The highly
educated customers may be more aware of competitive service and expect more from
their banks as compared to uneducated customers. The education level of the
customers is confined to Under Graduate, Graduate, Post Graduate, Ph.D and others
(including less than Under Graduates). The data is computed in Table 5.4.
0
20
40
60
80
100
120
140
160
180
200
PUBLIC SECTOR BANKS PRIVATE SECTOR BANKS
Publis Vs Private Sector Banks
MALE
FEMALE
Chapter-5: Data Analysis and Interpretation
135 | P a g e
Table 5.4: Level of education of the customers
Education Number of Customers Public Sector banks Total
Public Sector Banks
(PSBs)
Private Sector Banks
(Prv. SBs)
Number Percentage Number Percentage Number Percentage
Undergraduate 41 8.25 02 0.40 43 8.65
Graduate 82 16.50 79 15.90 161 32.40
Postgraduate 119 23.94 69 13.88 188 37.82
Ph.D 26 5.23 01 0.20 27 5.43
Other 63 12.68 15 3.02 78 15.70
Total 331 66.60 166 33.40 497 100.00
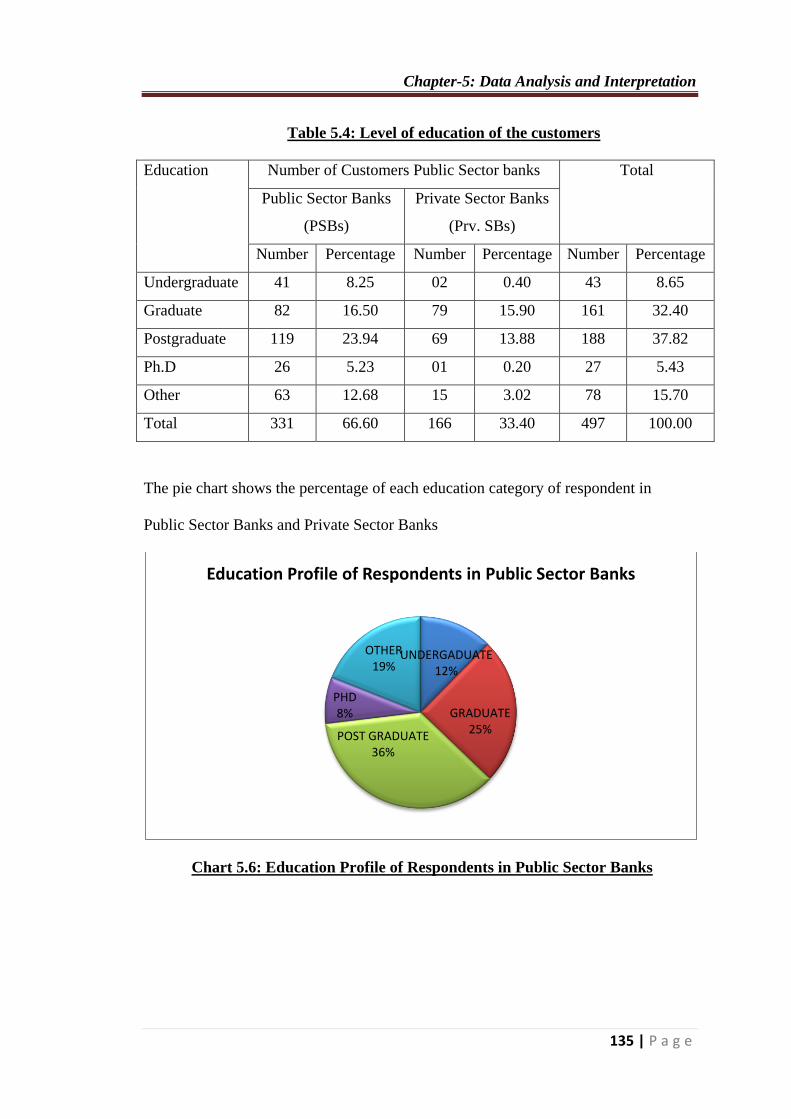
The pie chart shows the percentage of each education category of respondent in
Public Sector Banks and Private Sector Banks
Chart 5.6: Education Profile of Respondents in Public Sector Banks
UNDERGADUATE 12%
GRADUATE 25%
POST GRADUATE 36%
PHD 8%
OTHER 19%
Education Profile of Respondents in Public Sector Banks

Chapter-5: Data Analysis and Interpretation
136 | P a g e
Chart 5.7: Education Profile of Respondents in Private Sector Banks
Table 5.4 explains the distribution of customer on the basis of their level of education.
The dominant level of education among the customers is Graduation and Post
Graduation which constitute 32.4 percent and 37.82 percent to their respective total.
The number of customers who are Undergraduate is 41 or 8.25 percent in Public
Sector Banks and 2 or 0.40 percent in Private Sector Banks. The prominent level of
education among the customers is of graduates and Postgraduates which constitute
16.5 percent and 23.94 percent in Public Sector Banks and 15.9and 13.88 percent in
Private Sector Banks respectively. The number of customers with education upto
Ph.D. is 26 or 5.23 percent in Public Sector Banks and 1 or 0.20 percent in Private
Sector Banks respectively. The number of customer with the education level below
the undergraduate in ‘others’ category is 63 and constitute 12.68 percent in Public
Sector Banks and 15 or 3.02 percent in Private Sector Banks.
The bar diagram below shows the Public vs Private banks Sample size of education
profile of the respondent.
U.GADUATE 0%
GRADUATE 1%
POST GRADUATE
52%
PHD 46%
OTHER 1%
Education Profile of Respondents in Private Sector Banks

Chapter-5: Data Analysis and Interpretation
137 | P a g e
Dig.5.8: Education Profile of Respondents Public vs Private Sector Banks
5.19. Occupation of the Respondents
The occupation of the customer reveals the nature of work done by the customers.
Occupation of the customers influences their level of satisfaction on the perceived
service quality of Retail Banking. It includes as one of the profile variable. The
occupation of the customers is confined to government service, Private Services,
students, professionals and other jobs. The occupation of the customers is illustrated
in Table 5.5
0
20
40
60
80
100
120
140
PUBLIC SECTOR BANKS
PRIVATE SECTOR BANKS

Chapter-5: Data Analysis and Interpretation
138 | P a g e
Table 5.5: Occupation Profile of the Customers
Occupation Number of Customers Public Sector banks Total
Public Sector Banks
(PSBs)
Private Sector Banks
(Prv. SBs)
Number Percentage Number Percentage Number Percentage
Government
services
85 17.10 20 4.02 105 21.12
Private
Services
72 14.49 120 24.14 192 38.63
Students 124 24.95 09 1.82 133 26.77
Profession 16 3.22 06 1.21 22 4.43
Other 34 6.84 11 2.21 45 9.05
Total 331 66.60 166 33.40 497 100.00
The pie chart shows the percentage of each occupation category of respondents in
Public Sector Banks and Private Sector Banks.
Chart 5.9: Occupation Profile of Respondents in Public Sector Banks
GOVT.SERVICE 26%
PRIVATE SERVICE
22%
STUDENT 37%
PROFESSIONAL 5%
OTHERS 10%
Occupation profile of respondents in Public Sector Banks

Chapter-5: Data Analysis and Interpretation
139 | P a g e
Chart 5.10: Occupation Profile of Respondents In Private Sector Banks
The important occupations among the customers are Government Service, Private
Service and Students which constitute 21.12 percent 38.63 percent and 26.77 percent
respectively. The important occupation among the customers of PSBs is government
services and students which constitute 17.10 percent and 24.95 percent to their
respective total. In the Pr.SBs, the two important occupations are Private Services and
Government services which constitute 4.02 percent and 24.14 percent respectively. In
case of Public Sector Banks, Private Services constitutes 14.49, professional jobs
constitute 3.32 percent and others which include business constitute 6.84 percent. In
case of Private Sector Banks Government Services constitute 4.02 percent, students
1.82 percent, Professional Jobs constitutes 1.25 percent and others constitute 2.21
percent.
The bar diagram below shows the Public vs Private banks Sample size of occupation
profile of the respondents.
GOVT.SERVICE 12%
PRIVATE SERVICE 72%
STUDENT 5%
PROFESSIONAL 4%
OTHERS 7%
Occupation Profile of Customers in Private Sector Banks
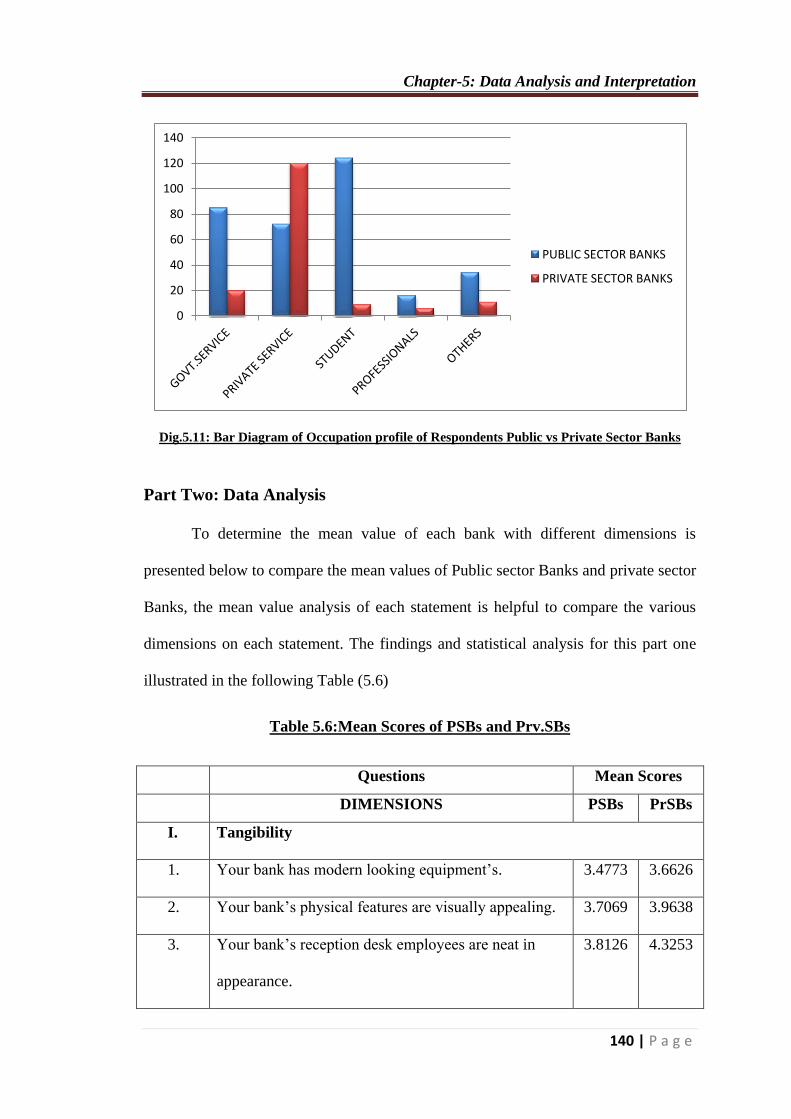
Chapter-5: Data Analysis and Interpretation
140 | P a g e
Dig.5.11: Bar Diagram of Occupation profile of Respondents Public vs Private Sector Banks
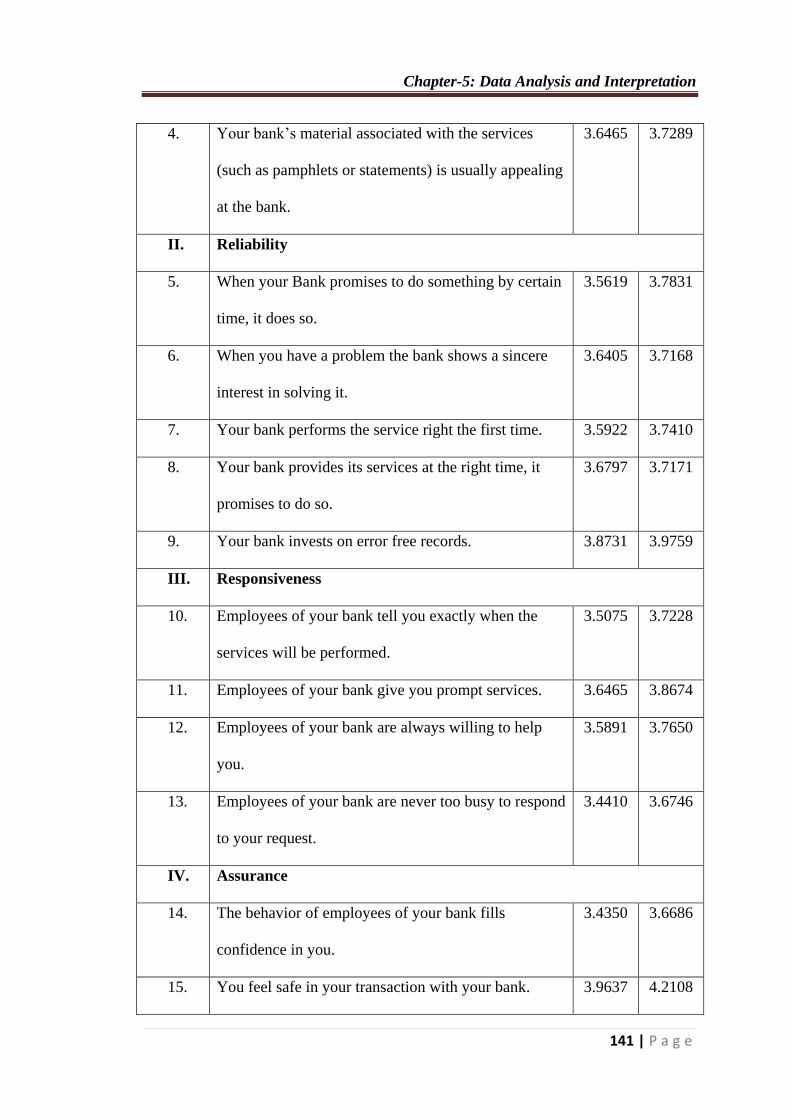
Part Two: Data Analysis
To determine the mean value of each bank with different dimensions is
presented below to compare the mean values of Public sector Banks and private sector
Banks, the mean value analysis of each statement is helpful to compare the various
dimensions on each statement. The findings and statistical analysis for this part one
illustrated in the following Table (5.6)
Table 5.6:Mean Scores of PSBs and Prv.SBs
Questions Mean Scores
DIMENSIONS PSBs PrSBs
I. Tangibility
1. Your bank has modern looking equipment’s. 3.4773 3.6626
2. Your bank’s physical features are visually appealing. 3.7069 3.9638
3. Your bank’s reception desk employees are neat in
appearance.
3.8126 4.3253
0
20
40
60
80
100
120
140
PUBLIC SECTOR BANKS
PRIVATE SECTOR BANKS
Chapter-5: Data Analysis and Interpretation
141 | P a g e
4. Your bank’s material associated with the services
(such as pamphlets or statements) is usually appealing
at the bank.
3.6465 3.7289
II. Reliability
5. When your Bank promises to do something by certain
time, it does so.
3.5619 3.7831
6. When you have a problem the bank shows a sincere
interest in solving it.
3.6405 3.7168
7. Your bank performs the service right the first time. 3.5922 3.7410
8. Your bank provides its services at the right time, it
promises to do so.
3.6797 3.7171
9. Your bank invests on error free records. 3.8731 3.9759
III. Responsiveness
10. Employees of your bank tell you exactly when the
services will be performed.
3.5075 3.7228
11. Employees of your bank give you prompt services. 3.6465 3.8674
12. Employees of your bank are always willing to help
you.
3.5891 3.7650
13. Employees of your bank are never too busy to respond
to your request.
3.4410 3.6746
IV. Assurance
14. The behavior of employees of your bank fills
confidence in you.
3.4350 3.6686
15. You feel safe in your transaction with your bank. 3.9637 4.2108

Chapter-5: Data Analysis and Interpretation
142 | P a g e
16. Employees of your Bank are polite with you. 3.6555 3.8975
17. Employees of your Bank have the knowledge to
answer your questions.
3.8701 3.9337
V. ATM Service Quality
18. Your Bank has quick cash withdrawal through ATM. 4.1359 4.0421
19. Your bank has suitable ATM location. 3.8489 3.5000
20. Your bank has safe and secure ATM transaction. 4.0604 4.3253
21. Your Bank ATM machine is user friendly. 3.9425 4.0180
22. Your bank has attractive appearance of ATM. 3.8489 3.7108
23. Your Bank has excellent quality of currency. 3.8429 3.8072
As shown in table (5.6) it is found that there is positive attitude towards all question
but with different mean values in public sector Banks and private sector Bank.

Chapter-5: Data Analysis and Interpretation
143 | P a g e
5.20. Dimension-I Tangibles
As shown in Table (5.6) the dimension tangible has positive attitude in the
respondents towards private sector Bank. Their mean values were greater than Public
Sector banks with different mean values.
The statement with the high mean in this dimensions is number (3) which
says, “your bank’s reception desk employees are neat in appearance” where its mean
is (4.3253) in private sector Banks in comparison to public sector banks where it is
(3.8126), whereas the lowest mean noted is (3.6626) in private sector banks and
3.4773) in Public Sector Banks in statement number (1) which said “your Bank has
modern looking equipments”.
5.21. Dimension II- Reliability
As shown in Table (5.6) there exist a positive attitude in the respondents towards the
Private Sector Banks because their means are greater than the Public sector Banks.
The statement with the high mean in this dimension is number (9) which says,
“Your bank invests on error free records”. The mean value of private sector banks
being (3.9759) is greater in comparison to (3.8731) in Public Sector Banks.
Whereas the lowest mean was (3.5619) in statement number (5) in Public
sector banks and (3.7831) in Private Sector Banks which said “when your Bank
promises to do something by certain time, it does so”.
5.22. Dimension III- Responsiveness
As shown in Table (5.6) in the dimension Responsiveness, there exists a positive
attitude in the respondents towards the Private Sector Banks in comparison to Public
sector Banks with different mean scores.

Chapter-5: Data Analysis and Interpretation
144 | P a g e
The statement with the highest mean in this dimension is number (11) which
says, “Employees of your Bank give you prompt services”. Its mean is (3.6465) in
Public Sector Banks and (3.8674) in Private Sector Bank.
Whereas the lowest mean of (3.4410) in Public Sector Banks and (3.6746) in
Private Sector Banks is in case of statement number (13) which said “Employees of
your bank are never too busy to respond to your request”.
5.23. Dimension IV- Assurance:
As shown in Table (5.6) there exists a positive attitude in the respondents towards the
Private Sector Banks because the mean scores of private sector Banks are greater than
the Public Sector Bank in all the questions under this dimension.
The statement with the high mean in this dimension is number (15) which
says, “You feel safe in your transactions with your Bank” where its mean has reached
(4.2108) in Private Sector Banks and (3.9637) in Public Sector Banks.
Whereas the lowest mean is (3.4350) in Public sector banks and (3.6686) in
Private Sector Banks in statement number (14) which said, “The behavior of your
employees fills confidence in you”.

Chapter-5: Data Analysis and Interpretation
145 | P a g e
5.24. Dimension V- ATM Service Quality
As shown in Table (5.6) there exists a positive attitude in the respondents towards the
Public Sector Banks as is evident from their means which are greater than the Private
Sector Banks having the different mean scores.
The statement with the high mean in this dimension ATM Service Quality is
number (18) which says, “Your bank has quick cash withdrawal through ATM”.
Where the mean values is (4.1359) in Public Sector Banks which is greater than in
Private Sector Banks where it is (4.0421).
Whereas the lowest mean was (3.8429) in Private Sector Bank and (3.8072) in
Public Sector Bank in statement number (23) which said “Your Bank has excellent
quality of Currency”.
The following Table 5.7 shows the mean values of five service quality
dimension used in analysis of data for this research. The highest mean score of 3.94 is
of ‘ATM Service Quality’ in Public Sector Banks and 3.90 in Private Sector Banks.
There is small variation in the mean score of reliability, responsiveness & assurance.
Table 5.7: Shows The Overall Mean In Each Dimension
Table 5.7: Item Statistics
Dimension Mean Score
Public Sector Banks Private Sector Banks
Tangibles 3.66 3.91
Reliability 3.66 3.80
Responsiveness 3.54 3.76
Assurance 3.73 3.92
ATM Service Quality 3.94 3.90
Total number of respondents: 497
The following diagram represents the mean values of all the five dimensions through
the graphs between Public Sector Banks and Private Sector Banks.

Chapter-5: Data Analysis and Interpretation
146 | P a g e
Dig.5.12: Mean Scores of Service Quality Dimensions in Public vs Private Sector Banks
5.25. Reliability and Validity Test
5.25.1. Reliability Test
Reliability is the consistency of the measurement; or the degree to which an
instrument measures the same way each time it is used under the same condition with
the same subject. In the present study Cronbach’s alpha (α) is used to measure the
reliability of data. Cronbach (1951) gave a measure to that which is loosely equivalent
to splitting data in two in every possible way and computing the correlation
coefficient for each split. The average of these values is equivalent to Cronbach’s
alpha (α) which is the most common measure of scale reliability. Kline (1999)
indicates that interpretation of Cronbach’s alpha is estimated such that a value of 0.7-
0.8 is an acceptable value for Cronbach’s alpha. Values substantially lower indicate
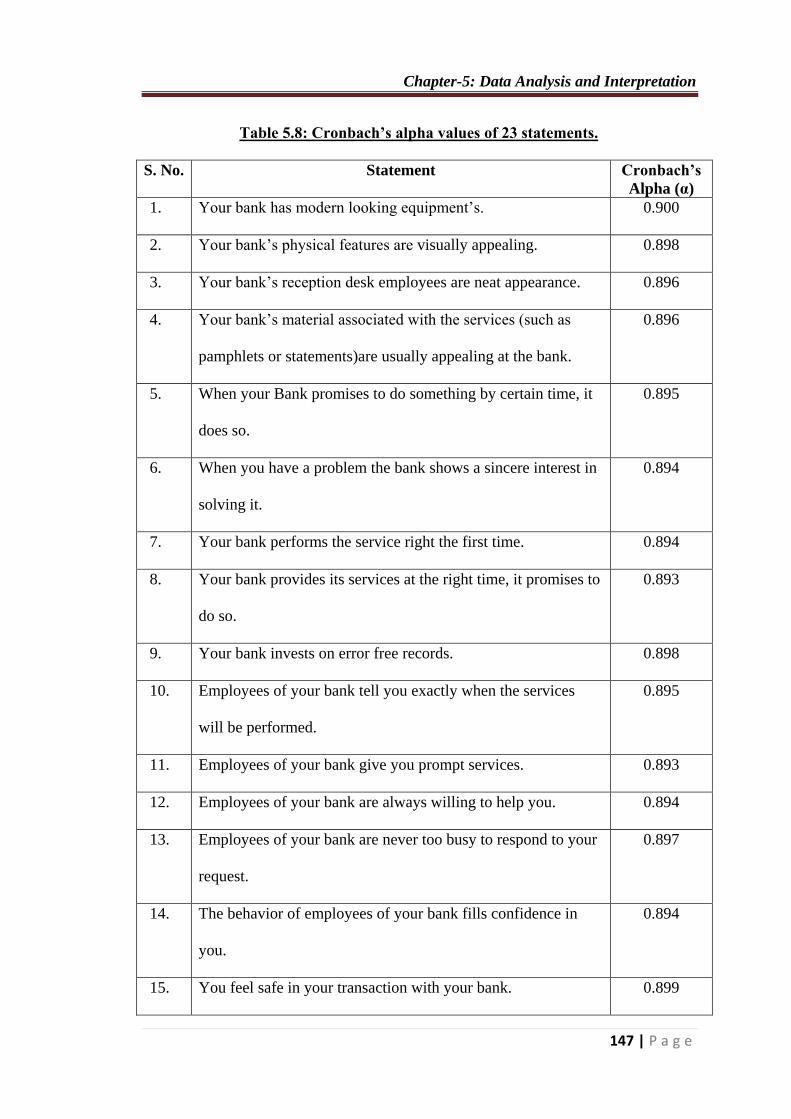
an unreliable scale. Following Table 5.8 shows the statement-wise reliability of 23
statements.
3.3
3.4
3.5
3.6
3.7
3.8
3.9
4
Mean Score Public Sector Banks
Mean Score Private Sector Banks
Chapter-5: Data Analysis and Interpretation
147 | P a g e
Table 5.8: Cronbach’s alpha values of 23 statements.
S. No. Statement Cronbach’s
Alpha (α)
1. Your bank has modern looking equipment’s. 0.900
2. Your bank’s physical features are visually appealing. 0.898
3. Your bank’s reception desk employees are neat appearance. 0.896
4. Your bank’s material associated with the services (such as
pamphlets or statements)are usually appealing at the bank.
0.896
5. When your Bank promises to do something by certain time, it
does so.
0.895
6. When you have a problem the bank shows a sincere interest in
solving it.
0.894
7. Your bank performs the service right the first time. 0.894
8. Your bank provides its services at the right time, it promises to
do so.
0.893
9. Your bank invests on error free records. 0.898
10. Employees of your bank tell you exactly when the services
will be performed.
0.895
11. Employees of your bank give you prompt services. 0.893
12. Employees of your bank are always willing to help you. 0.894
13. Employees of your bank are never too busy to respond to your
request.
0.897
14. The behavior of employees of your bank fills confidence in
you.
0.894
15. You feel safe in your transaction with your bank. 0.899

Chapter-5: Data Analysis and Interpretation
148 | P a g e
16. Employees of your Bank are polite with you. 0.895
17. Employees of your Bank have the knowledge to answer your
questions.
0.895
18. Your Bank has quick cash withdrawal through ATM. 0.896
19. Your bank has suitable ATM location. 0.899
20. Your bank has safe and secure ATM transaction. 0.897
21. Your Bank ATM machine is user friendly. 0.896
22. Your bank has attractive appearance of ATM. 0.894
23. Your Bank has excellent quality of currency. 0.892
The above table indicates the reliability of scale by calculating Cronbach’s
alpha. The items where the value of alpha is more than 0.7 are considered significant
for this research. The reliability table shows the statement wise values of alpha, which
is more than 0.7 in each statement.

Chapter-5: Data Analysis and Interpretation
149 | P a g e
The Cronbach’s alpha (α) values of the 23 items are narrated into five dimensions
namely Tangibles, Reliability, Responsiveness, Assurance and ATM Service quality.
These result of Cronbach’s alpha for five dimensions are given in Table (5.9)
Table 5.9: Reliability Analysis
S. NO. Dimensions No. of Item Cronbach’s
Alpha(α)
1. Tangibles 4 0.825
2. Reliability 5 0.842
3. Responsiveness 4 0.865
4. Assurance 4 0.807
5. ATM Service Quality 6 0.871
Overall Reliability 23 0.900
The reliability of five dimensions gets confirmed from the above table since
the reliability coefficients are higher than the standard minimum of 0.70 in each
dimension. The overall composite reliability of the variables is also higher than the
minimum threshold of 0.7 that is 0.900.
5.25.2. Validity of test:
Validity is the strength of our conclusions, inferences or propositions. Cook and
Campbell (1979) define it as the “best available approximation to the truth or falsity
of a given inference, proposition or conclusion”.
The test of validity of data for factor analysis has been conducted with the help
of KMO measure and Bartlett’s test of Sphericity.
The Kaiser-Meyer-Olkin (KMO) measures the validity of the dimensions for
factor analysis. The KMO statistics varies between 0 and 1. A value 0 indicates that
Chapter-5: Data Analysis and Interpretation
150 | P a g e
the sum of partial correlations is large relative to the sum of correlations, indicating
diffusion in the pattern of correlations. A value close to 1 indicates that patterns of
correlation are relatively compact and so factor analysis should yield distinct and
reliable factors. Kaiser(1974) recommends accepting values greater than 0.5 as
acceptable, values between 0.5 and 0.7 are mediocre, values between 0.7 and 0.8 are
good, values between 0.8 and 0.9 are great and values above 0.9 are superb. For these
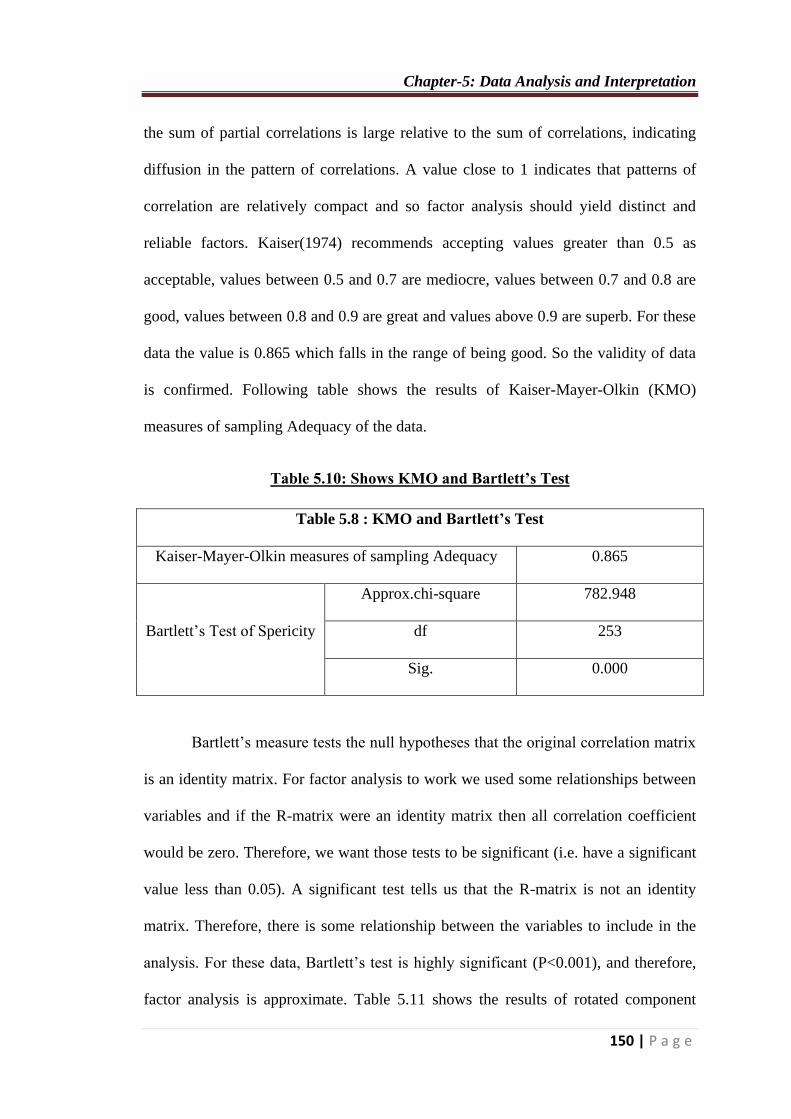
data the value is 0.865 which falls in the range of being good. So the validity of data
is confirmed. Following table shows the results of Kaiser-Mayer-Olkin (KMO)
measures of sampling Adequacy of the data.
Table 5.10: Shows KMO and Bartlett’s Test
Table 5.8 : KMO and Bartlett’s Test
Kaiser-Mayer-Olkin measures of sampling Adequacy 0.865
Bartlett’s Test of Spericity
Approx.chi-square 782.948
df 253
Sig. 0.000
Bartlett’s measure tests the null hypotheses that the original correlation matrix
is an identity matrix. For factor analysis to work we used some relationships between
variables and if the R-matrix were an identity matrix then all correlation coefficient
would be zero. Therefore, we want those tests to be significant (i.e. have a significant
value less than 0.05). A significant test tells us that the R-matrix is not an identity
matrix. Therefore, there is some relationship between the variables to include in the
analysis. For these data, Bartlett’s test is highly significant (P<0.001), and therefore,
factor analysis is approximate. Table 5.11 shows the results of rotated component

Chapter-5: Data Analysis and Interpretation
151 | P a g e
matrix. All the values of extraction are more than 0.40. Therefore, the data is found
suitable for further analysis.
Table 5.11: Rotated Component Matrix
Component Matrix
Statement Extraction
1. Your banks physical features equipment. 0.630
2. Your bank’s physical features are visually appealing. 0.658
3. Your bank’s reception desk employees are neat in
appearance.
0.648
4. Your bank’s material associated with the services (such as
pamphlets or statements) is usually appealing at the bank.
0.521
5. When your Bank promises to do something by certain time,
it does so.
0.687
6. When you have a problem the bank shows a sincere
interesting in solving it.
0.581
7. Your bank performs the service right the first time 0.589
8. Your bank provides its services at the right time, it promises
to do so.
0.542
9. Your bank invests on error free records. 0.606
10. Employees of your bank tell you exactly when the services
will be performed.
0.528
11. Employees of your bank give you prompt services. 0.593
12. Employees of your bank are always willing to help you. 0.522
13. Employees of your bank are never too busy to respond to 0.631

Chapter-5: Data Analysis and Interpretation
152 | P a g e
your request.
14. The behavior of employees of your bank fills confidence in
you.
0.549
15. You feel safe in your transaction with your bank. 0.671
16. Employees of your Bank are polite with you. 0.626
17. Employees of your Bank have the knowledge to answer
your questions.
0.697
18. Your Bank has quick cash withdrawal through ATM. 0.607
19. Your bank has suitable ATM location. 0.707
20. Your bank has safe and secure ATM transaction. 0.774
21. Your Bank ATM machine is user friendly. 0.749
22. Your bank has alternative appearance of ATM. 0.640
23. Your Bank has excellent quality of currency. 0.620
C. TESTING OF HYPOTHESES
Hypotheses testing are very important phase of the research process which determines
the results of the analysis. The primary data collected has been tabulated and
transferred to SPSS (Statistical package for Social Science) from Microsoft Excel
File. SPSS software has been used to analyze the primary data to test the hypotheses
of the study. Necessary statistical tools have been applied for the analysis of this
research while using SPSS software. The mean, One-Way ANOVA (analysis of
variance) and other statistical tests were used to compute the result.
Chapter-5: Data Analysis and Interpretation
153 | P a g e
For hypothesis testing mostly independent t-test and one way analysis of
variance (ANOVA) has been used for the analysis of data. In the present study
hypothesis were tested with the help of these two statistical tools.
Independent Samples t-test:
Independent samples t-test is used on the data if there are two independent samples
(or groups). It is used to compare the values of the means from two samples and test
whether it is likely that the samples are from populations having different mean
values. The independent t-test also called unpaired or the two samples t-test or
student’s t-test is an inferential statistical test that determines whether there is a
statistically significant difference between the mean in two groups (Cohen, 1998).
Independent t-test is used to compare the mean of a normally distributed
internal independent variable for two independent groups. When the two samples are
taken from the same population, it is very unlikely that the mean of the two samples
will be identical. When two samples are taken from two groups with different mean
scores, it is likely that the means of the two samples will differ.
For the present study comparing the mean values of the Public Sector banks
and Private Sector Banks on the different service quality dimensions of Retail
Banking in India. Independent t-test is used to signify the Hypothesis testing. When
reporting the result of an independent t-test, it is necessary to include the t-statistic
value, the degree of freedom and the significance value of the test (P-value).
The test result is computed as t (df)=t-statistic, P= significance value.
For computing the results statistical packages like SPSS is used. The data are
transferred to SPSS package and then compared the results. Statistical tests are
available to assess whether the two sample variance are significantly different. All
Chapter-5: Data Analysis and Interpretation
154 | P a g e
statistical tests produce a p-value and this is equal to the probability of obtaining the
observed difference, or one more extreme, if the null hypothesis is true. To put it
another way- if the null hypothesis is true, the p-value is the probability of obtaining a
difference at least as large as that observed due to sampling variation.
Consequently, if the p-value is small, the data support the alternative
hypothesis, if the p-value is large the data support the null hypothesis. A p-value of
0.05(5%) is generally regarded as sufficiently small to reject the null hypothesis. If
the p-value is larger than 0.01 then the null hypothesis is accepted. The significance
value considered for the present statistical test is 0.05(5%). The 1% value is also
commonly used in research to test the hypothesis.
In the present study there are only two levels of the independent variables (e.g.
Public Sector Banks and Private Sector Banks). If the data contains more than two
variables then t-test is inappropriate. For that purpose another statistical tool of
analysis of variance (ANOVA) is used.
One way analysis of variance(ANOVA)
One way analysis of variance (ANOVA) is used to determine whether there are any
significant differences between the means of three or more independent (unrelated)
groups. So it is used where there are more than two groups (Onwnegbuzie, 2002).
ANOVA determines the relationship of mean scores of more than two
variables. An ANOVA produces t-statistic or t-ratio, which is similar to the t-static in
that it compares the amount of systematic variances in the data to the amount of
unsystematic variance.
ANOVA is used to compare the variance (variability in scores) between the
different groups with the variability within each group. An ‘F’ ratio is calculated

Chapter-5: Data Analysis and Interpretation
155 | P a g e
which represents the variation between groups, divided by within the groups. A large
‘F’ ratio indicates that there is more variability between the groups.
To achieve the objects of the study, the following hypothesis were developed
for statistical testing.
Chapter-5: Data Analysis and Interpretation
156 | P a g e
HYPOTHESES (1)
HO: There is no significant difference in the perception of customers on the
Service Quality dimension of tangibles between Public Sector Banks and Private
Sector Banks in Retail Banking.
HO1: There is significant difference in the perception of customers on the service
quality dimension of tangibles in Public Sector Banks and Private Sector Banks
in Retail Banking.
In order to test the hypotheses, Independent Sample Test t-test is applied
because it compares the Service Quality of dimension (tangibles) in Public Sector
Banks and Private Sector Banks.
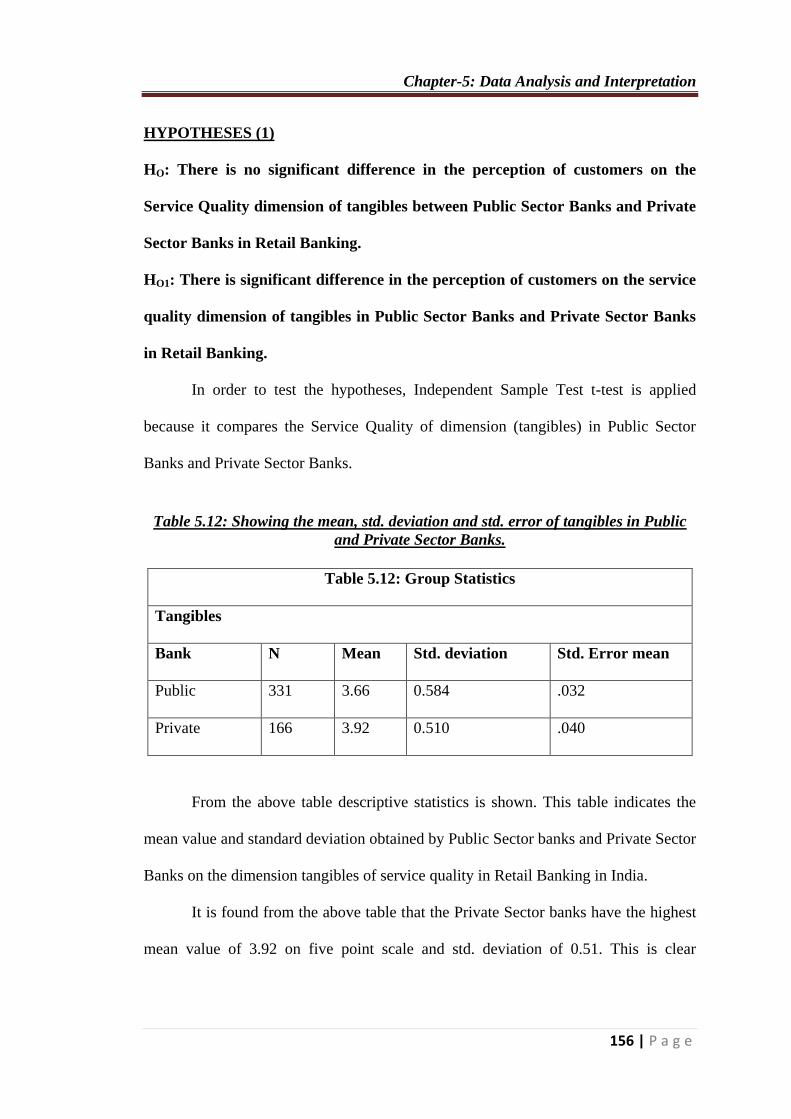
Table 5.12: Showing the mean, std. deviation and std. error of tangibles in Public
and Private Sector Banks.
Table 5.12: Group Statistics
Tangibles
Bank N Mean Std. deviation Std. Error mean
Public 331 3.66 0.584 .032
Private 166 3.92 0.510 .040
From the above table descriptive statistics is shown. This table indicates the
mean value and standard deviation obtained by Public Sector banks and Private Sector
Banks on the dimension tangibles of service quality in Retail Banking in India.
It is found from the above table that the Private Sector banks have the highest
mean value of 3.92 on five point scale and std. deviation of 0.51. This is clear

Chapter-5: Data Analysis and Interpretation
157 | P a g e
indication that the customers of Private Sector Banks have a positive perception on
the dimension of tangible in comparison to Public Sector Banks.
Table 5.13: Showing the F-value and sig. value of Tangibles between Public and
Private Sector Banks.
Table 5.13: Independent Samples Test
Tangibles
Levene’s Test
for equality of
variances
T-test for equality of means
F Sig. t Df Sig. (2
tailed)
Mean
difference
Std. Error
difference
Equal
variance
assumed
2.377 0.124
-4.884 494 .000 -. 260 .053
Equal
variance
not
assumed
-5.107 373.082 .000 -. 260 0.051
Table 5.13 shows the results of independent samples test used to access the
difference with perception of customers towards the dimension of tangibles on the
ground of Service Quality in Public Sector Banks and Private Sector Banks.
The t-value is -4.884 and sig. value is 0.000 which is less than 0.05 (95
Percent Confidence Internal), which indicates that there exists difference in the
perception of customer in the Service Quality factor of Tangibles between Public
Sector Banks and Private Sector Banks.
Hence, the hypotheses that there is no significant difference in the perception
of customers on the service quality dimension of Tangibles in Public Sector Banks
and Private Sector Banks stands rejected and alternative hypotheses is accepted.
Chapter-5: Data Analysis and Interpretation
158 | P a g e
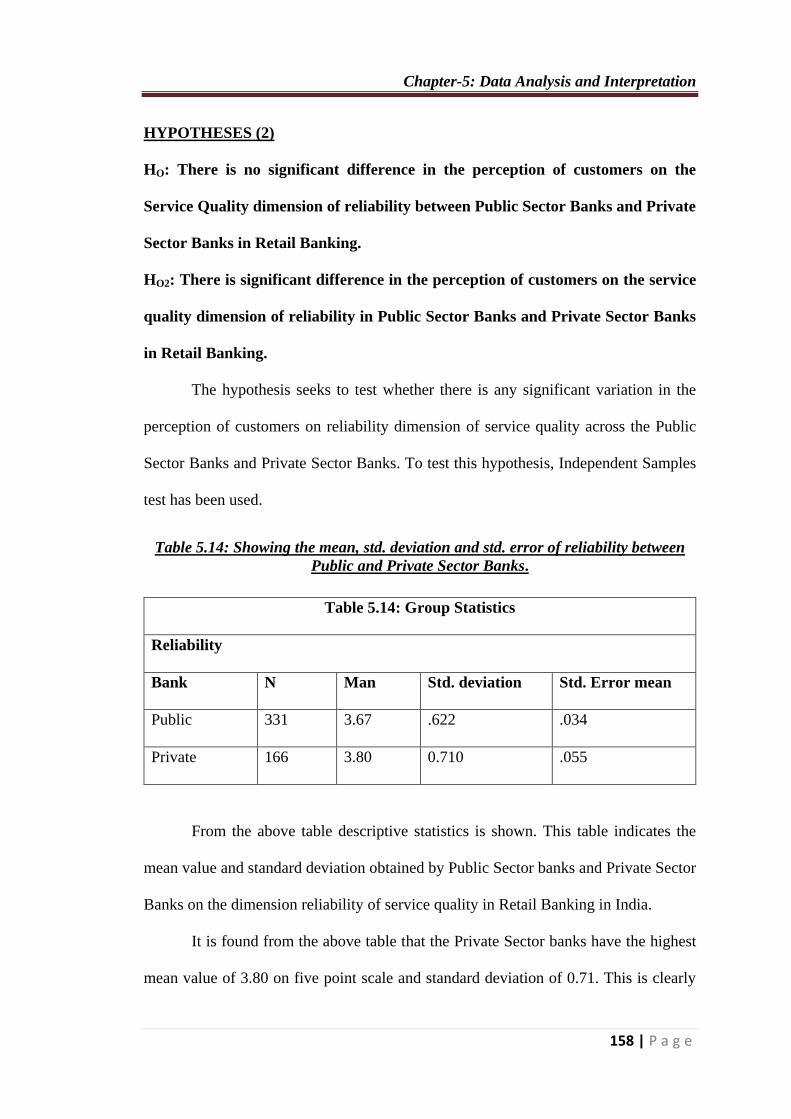
HYPOTHESES (2)
HO: There is no significant difference in the perception of customers on the
Service Quality dimension of reliability between Public Sector Banks and Private
Sector Banks in Retail Banking.
HO2: There is significant difference in the perception of customers on the service
quality dimension of reliability in Public Sector Banks and Private Sector Banks
in Retail Banking.
The hypothesis seeks to test whether there is any significant variation in the
perception of customers on reliability dimension of service quality across the Public
Sector Banks and Private Sector Banks. To test this hypothesis, Independent Samples
test has been used.
Table 5.14: Showing the mean, std. deviation and std. error of reliability between
Public and Private Sector Banks.
Table 5.14: Group Statistics
Reliability
Bank N Man Std. deviation Std. Error mean
Public 331 3.67 .622 .034
Private 166 3.80 0.710 .055
From the above table descriptive statistics is shown. This table indicates the
mean value and standard deviation obtained by Public Sector banks and Private Sector
Banks on the dimension reliability of service quality in Retail Banking in India.
It is found from the above table that the Private Sector banks have the highest
mean value of 3.80 on five point scale and standard deviation of 0.71. This is clearly
Chapter-5: Data Analysis and Interpretation
159 | P a g e
an indication that the customers of Private Sector Banks have a positive perception on
the dimension of reliability in comparison to Public Sector Banks.
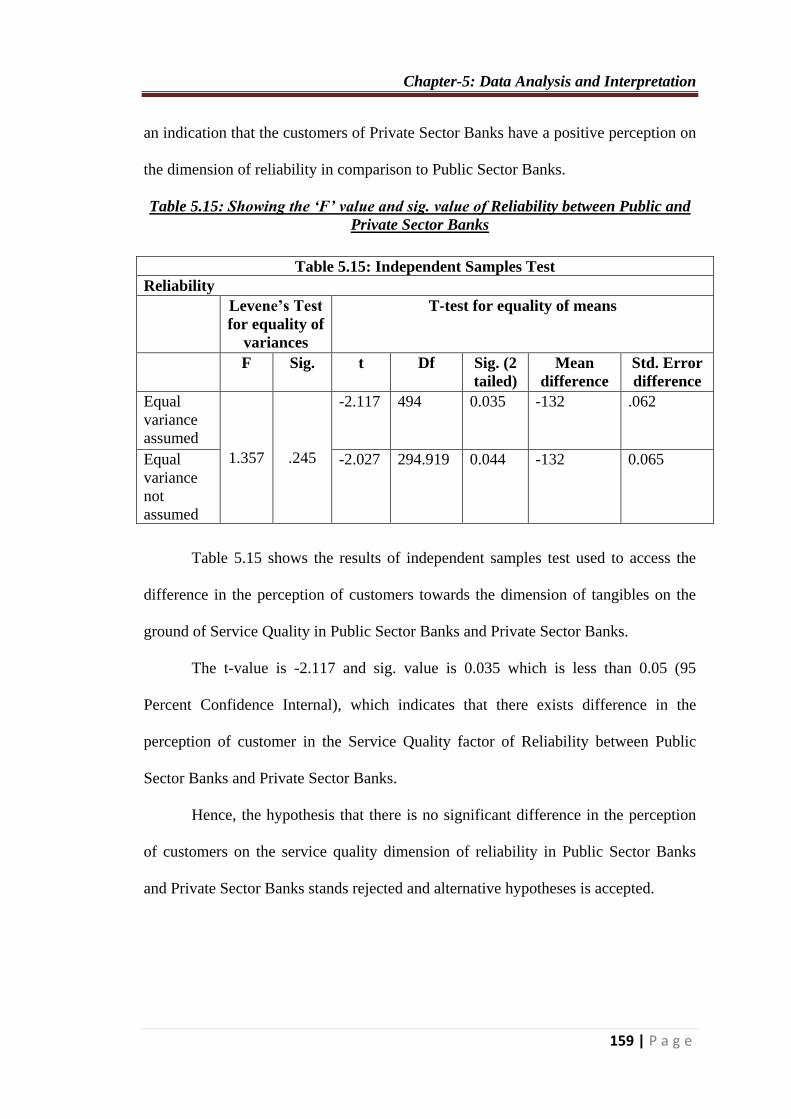
Table 5.15: Showing the ‘F’ value and sig. value of Reliability between Public and
Private Sector Banks
Table 5.15: Independent Samples Test
Reliability
Levene’s Test
for equality of
variances
T-test for equality of means
F Sig. t Df Sig. (2
tailed)
Mean
difference
Std. Error
difference
Equal
variance
assumed
1.357 .245
-2.117 494 0.035 -132 .062
Equal
variance
not
assumed
-2.027 294.919 0.044 -132 0.065
Table 5.15 shows the results of independent samples test used to access the
difference in the perception of customers towards the dimension of tangibles on the
ground of Service Quality in Public Sector Banks and Private Sector Banks.
The t-value is -2.117 and sig. value is 0.035 which is less than 0.05 (95
Percent Confidence Internal), which indicates that there exists difference in the
perception of customer in the Service Quality factor of Reliability between Public
Sector Banks and Private Sector Banks.
Hence, the hypothesis that there is no significant difference in the perception
of customers on the service quality dimension of reliability in Public Sector Banks
and Private Sector Banks stands rejected and alternative hypotheses is accepted.

Chapter-5: Data Analysis and Interpretation
160 | P a g e
HYPOTHESES (3)
HO: There is no significant difference in the perception of customers on the
service quality dimension of Responsiveness between Public Sector Banks and
Private Sector Banks in Retail Banking.
HO3: There is significant difference in the perception of customers on the Service
Quality dimension of Responsiveness between Public Sector Banks and Private
Sector Banks in Retail Banking.
The hypothesis seeks to test whether there is any significant variation in the
perception of customers on responsiveness dimension of service quality across the
Public Sector Banks and Private Sector Banks. To test this hypothesis, Independent
Samples test has been used.
Table 5.16: Showing the mean, std. deviation and std. error of Responsiveness
between Public and Private Sector Banks.
Table 5.16: Group Statistics
Responsiveness
Bank N Mean Std. deviation Std. Error mean
Public 331 3.54 .742 .041
Private 166 3.76 .646 .050
From the above table descriptive statistics is shown. This table indicates the
mean value and standard deviation obtained by Public Sector banks and Private Sector
Banks on the dimension responsiveness of service quality in Retail Banking in India.
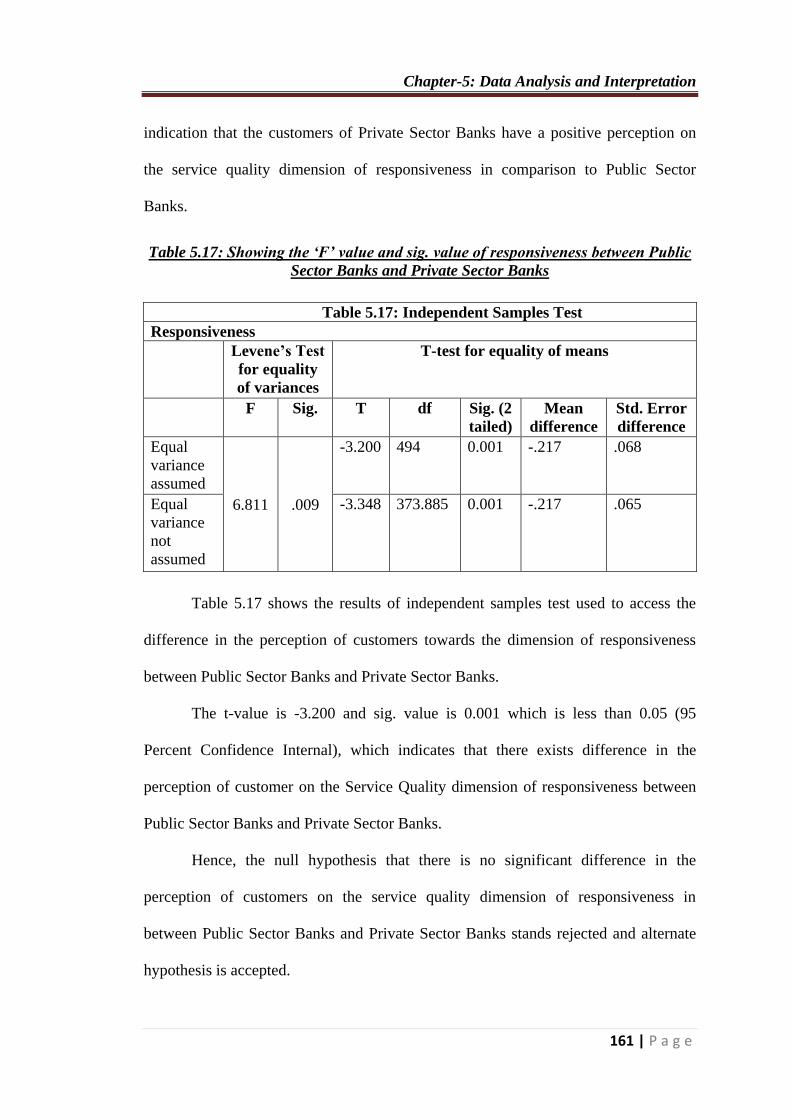
It is found from the above table that the Private Sector banks have the highest
mean value of 3.76 on five point scale and standard deviation of 0.64. This is a clear
Chapter-5: Data Analysis and Interpretation
161 | P a g e
indication that the customers of Private Sector Banks have a positive perception on
the service quality dimension of responsiveness in comparison to Public Sector
Banks.
Table 5.17: Showing the ‘F’ value and sig. value of responsiveness between Public
Sector Banks and Private Sector Banks
Table 5.17: Independent Samples Test
Responsiveness
Levene’s Test
for equality
of variances
T-test for equality of means
F Sig. T df Sig. (2
tailed)
Mean
difference
Std. Error
difference
Equal
variance
assumed
6.811 .009
-3.200 494 0.001 -.217 .068
Equal
variance
not
assumed
-3.348 373.885 0.001 -.217 .065
Table 5.17 shows the results of independent samples test used to access the
difference in the perception of customers towards the dimension of responsiveness
between Public Sector Banks and Private Sector Banks.
The t-value is -3.200 and sig. value is 0.001 which is less than 0.05 (95
Percent Confidence Internal), which indicates that there exists difference in the
perception of customer on the Service Quality dimension of responsiveness between
Public Sector Banks and Private Sector Banks.
Hence, the null hypothesis that there is no significant difference in the
perception of customers on the service quality dimension of responsiveness in
between Public Sector Banks and Private Sector Banks stands rejected and alternate
hypothesis is accepted.

Chapter-5: Data Analysis and Interpretation
162 | P a g e
HYPOTHESES (4)
HO: There is no significant difference in the perception of customers on the
Service Quality dimension of Assurance between Public Sector Banks and
Private Sector Banks in Retail Banking.
HO4: There is significant difference in the perception of customers on the Service
Quality dimension of Assurance between Public Sector Banks and Private Sector
Banks in Retail Banking.
The hypothesis seeks to test whether there is any significant variation in the
perception of customers on the Service Quality dimension of assurance between the
Public Sector Banks and Private Sector Banks. To test this hypothesis, Independent
Samples test has been used.
Table 5.18: Showing the mean, std. deviation and std. error of Assurance between
Public Sector Banks and Private Sector Banks.
Table 5.18: Group Statistics
Assurance
Bank N Man Std. deviation Std. Error mean
Public 331 3.73 .595 .033
Private 166 3.93 .611 .047
From the above table descriptive statistics is shown. This table indicates the
mean value and standard deviation obtained by Public Sector Banks and Private
Sector Banks on the dimension assurance of Service Quality in Retail Banking in
India.
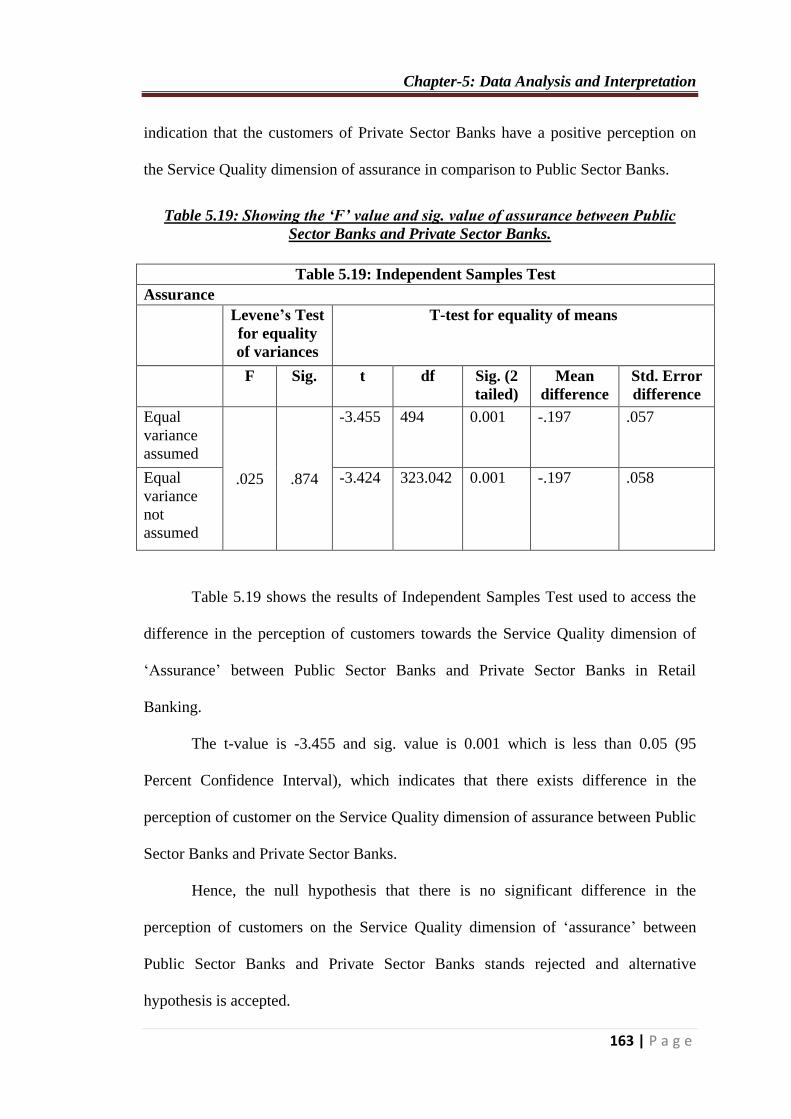
It has been found from the above table that Private Sector Banks have highest
mean value of 3.93 on five point scale and standard deviation of 0.61. This is a clear
Chapter-5: Data Analysis and Interpretation
163 | P a g e
indication that the customers of Private Sector Banks have a positive perception on
the Service Quality dimension of assurance in comparison to Public Sector Banks.
Table 5.19: Showing the ‘F’ value and sig. value of assurance between Public
Sector Banks and Private Sector Banks.
Table 5.19: Independent Samples Test
Assurance
Levene’s Test
for equality
of variances
T-test for equality of means
F Sig. t df Sig. (2
tailed)
Mean
difference
Std. Error
difference
Equal
variance
assumed
.025 .874
-3.455 494 0.001 -.197 .057
Equal
variance
not
assumed
-3.424 323.042 0.001 -.197 .058
Table 5.19 shows the results of Independent Samples Test used to access the
difference in the perception of customers towards the Service Quality dimension of
‘Assurance’ between Public Sector Banks and Private Sector Banks in Retail
Banking.
The t-value is -3.455 and sig. value is 0.001 which is less than 0.05 (95
Percent Confidence Interval), which indicates that there exists difference in the
perception of customer on the Service Quality dimension of assurance between Public
Sector Banks and Private Sector Banks.
Hence, the null hypothesis that there is no significant difference in the
perception of customers on the Service Quality dimension of ‘assurance’ between
Public Sector Banks and Private Sector Banks stands rejected and alternative
hypothesis is accepted.
Chapter-5: Data Analysis and Interpretation
164 | P a g e
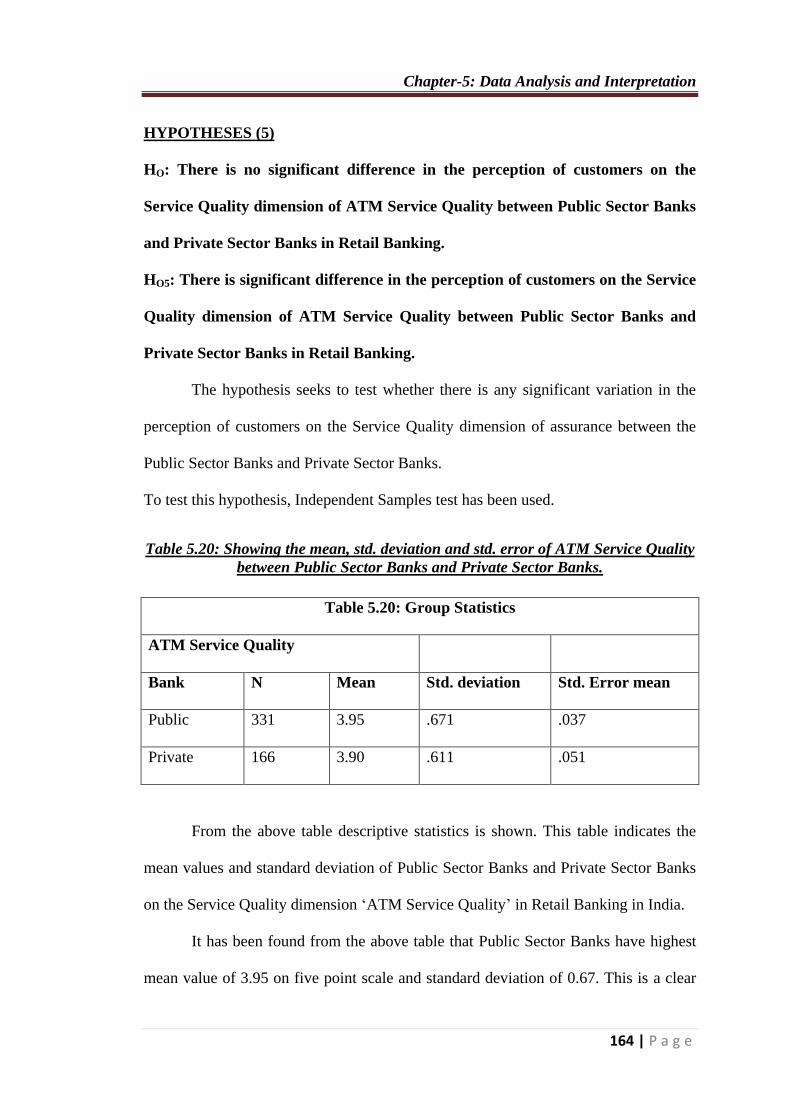
HYPOTHESES (5)
HO: There is no significant difference in the perception of customers on the
Service Quality dimension of ATM Service Quality between Public Sector Banks
and Private Sector Banks in Retail Banking.
HO5: There is significant difference in the perception of customers on the Service
Quality dimension of ATM Service Quality between Public Sector Banks and
Private Sector Banks in Retail Banking.
The hypothesis seeks to test whether there is any significant variation in the
perception of customers on the Service Quality dimension of assurance between the
Public Sector Banks and Private Sector Banks.
To test this hypothesis, Independent Samples test has been used.
Table 5.20: Showing the mean, std. deviation and std. error of ATM Service Quality
between Public Sector Banks and Private Sector Banks.
Table 5.20: Group Statistics
ATM Service Quality
Bank N Mean Std. deviation Std. Error mean
Public 331 3.95 .671 .037
Private 166 3.90 .611 .051
From the above table descriptive statistics is shown. This table indicates the
mean values and standard deviation of Public Sector Banks and Private Sector Banks
on the Service Quality dimension ‘ATM Service Quality’ in Retail Banking in India.
It has been found from the above table that Public Sector Banks have highest
mean value of 3.95 on five point scale and standard deviation of 0.67. This is a clear

Chapter-5: Data Analysis and Interpretation
165 | P a g e
indication that the customers of Public Sector Banks have a positive perception on the
Service Quality dimension of ATM Service Quality in comparison to Private Sector
Banks.
Table 5.21: Showing the ‘F’ value and sig. value of ATM Service Quality between
Public Sector Banks and Private Sector Banks
Table 5.21: Independent Samples Test
ATM Service Quality
Levene’s Test
for equality of
variances
T-test for equality of means
F Sig. t Df Sig. (2
tailed)
Mean
difference
Std. Error
difference
Equal
variance
assumed
.092 .762
-.659 494 .510 .042 .064
Equal
variance
not
assumed
-.662 335.158 .508 .042 .063
Table 5.21 shows the results of Independent Samples Test used to assess the
difference in the perception of customers towards the Service Quality dimension of
ATM Service Quality between Public Sector Banks and Private Sector Banks in
Retail Banking.
The t-value is 0.659 and sig. value is 0.510 which is greater than 0.05 (95
Percent Confidence Internal), which indicates that there exists no difference in the
perception of customers on the Service Quality dimension of ‘ATM Service Quality’
between Public Sector Banks and Private Sector Banks.
Hence, the null hypothesis that there is no significant difference in the
perception of customers on the Service Quality dimension of ATM Service Quality
between Public Sector Banks and Private Sector Banks stands accepted and
alternative hypothesis is rejected.
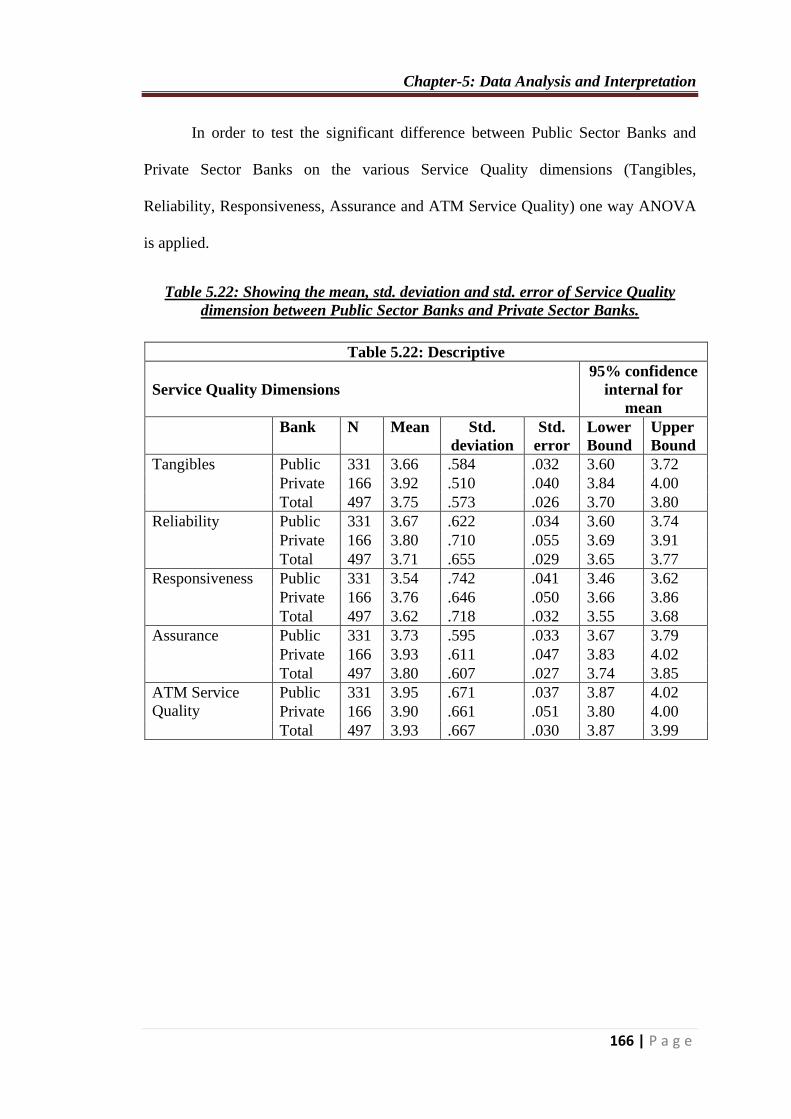
Chapter-5: Data Analysis and Interpretation
166 | P a g e
In order to test the significant difference between Public Sector Banks and
Private Sector Banks on the various Service Quality dimensions (Tangibles,
Reliability, Responsiveness, Assurance and ATM Service Quality) one way ANOVA
is applied.
Table 5.22: Showing the mean, std. deviation and std. error of Service Quality
dimension between Public Sector Banks and Private Sector Banks.
Table 5.22: Descriptive
Service Quality Dimensions
95% confidence
internal for
mean
Bank N Mean Std.
deviation
Std.
error
Lower
Bound
Upper
Bound
Tangibles Public 331 3.66 .584 .032 3.60 3.72
Private 166 3.92 .510 .040 3.84 4.00
Total 497 3.75 .573 .026 3.70 3.80
Reliability Public 331 3.67 .622 .034 3.60 3.74
Private 166 3.80 .710 .055 3.69 3.91
Total 497 3.71 .655 .029 3.65 3.77
Responsiveness Public 331 3.54 .742 .041 3.46 3.62
Private 166 3.76 .646 .050 3.66 3.86
Total 497 3.62 .718 .032 3.55 3.68
Assurance Public 331 3.73 .595 .033 3.67 3.79
Private 166 3.93 .611 .047 3.83 4.02
Total 497 3.80 .607 .027 3.74 3.85
ATM Service
Quality
Public 331 3.95 .671 .037 3.87 4.02
Private 166 3.90 .661 .051 3.80 4.00
Total 497 3.93 .667 .030 3.87 3.99

Chapter-5: Data Analysis and Interpretation
167 | P a g e
Table 5.23: Showing the ‘F’ value and sig. value of Service Quality dimension
between Public Sector Banks and Private Sector Banks.
Table 5.23: ANOVA
Service Quality Dimensions
Sum of
Squares
df Mean
square
F Sig.
Tangibles Between
Groups
7.485 1 7.485 23.854 0.000
Within
Groups
155.010 495 0.314
Total 162.495 496
Reliability Between
Groups
1.910 1 1.910 4.483 .035
Within
Groups
210.492 495 .426
Total 212.402 496
Responsiveness Between
Groups
5.182 1 5.182 10.238 .001
Within
Groups
250.032 495 .506
Total 255.214 496
Assurance Between
Groups
4.304 1 4.304 11.936 .001
Within
Groups
178.129 495 .361
Total 182.433 496
ATM Service
Quality
Between
Groups
.193 1 .193 .434 .510
Within
Groups
220.087 495 .446
Total 220.280 496

Chapter-5: Data Analysis and Interpretation
168 | P a g e
IV- SUMMARY OF HYPOTHESES TESTING
Table 5.24 presents summary of the hypotheses that were generated for this study and
the results obtained after analysis of data for various dimensions of Service Quality.
Table 5.24: Summary of Results of Hypotheses Testing
No. Hypotheses Results
HO1 No significant difference in the perception of customers on
the Service Quality dimension of Tangibles between Public
Sector Banks and Private Sector Banks in Retail Banking.
Rejected
HO2 No significant difference in the perception of customers on
the Service Quality dimension of Reliability between Public
Sector Banks and Private Sector Banks in Retail Banking.
Rejected
HO3 No significant difference in the perception of customers on
the Service Quality dimension of Responsiveness between
Public Sector Banks and Private Sector Banks in Retail
Banking.
Rejected
HO4 No significant difference in the perception of customers on
the Service Quality dimension of Assurance between Public
Sector Banks and Private Sector Banks in Retail Banking.
Rejected
HO5 No significant difference in the perception of customers on
the Service Quality dimension of ATM Service Quality
between Public Sector Banks and Private Sector Banks in
Retail Banking.
Accepted
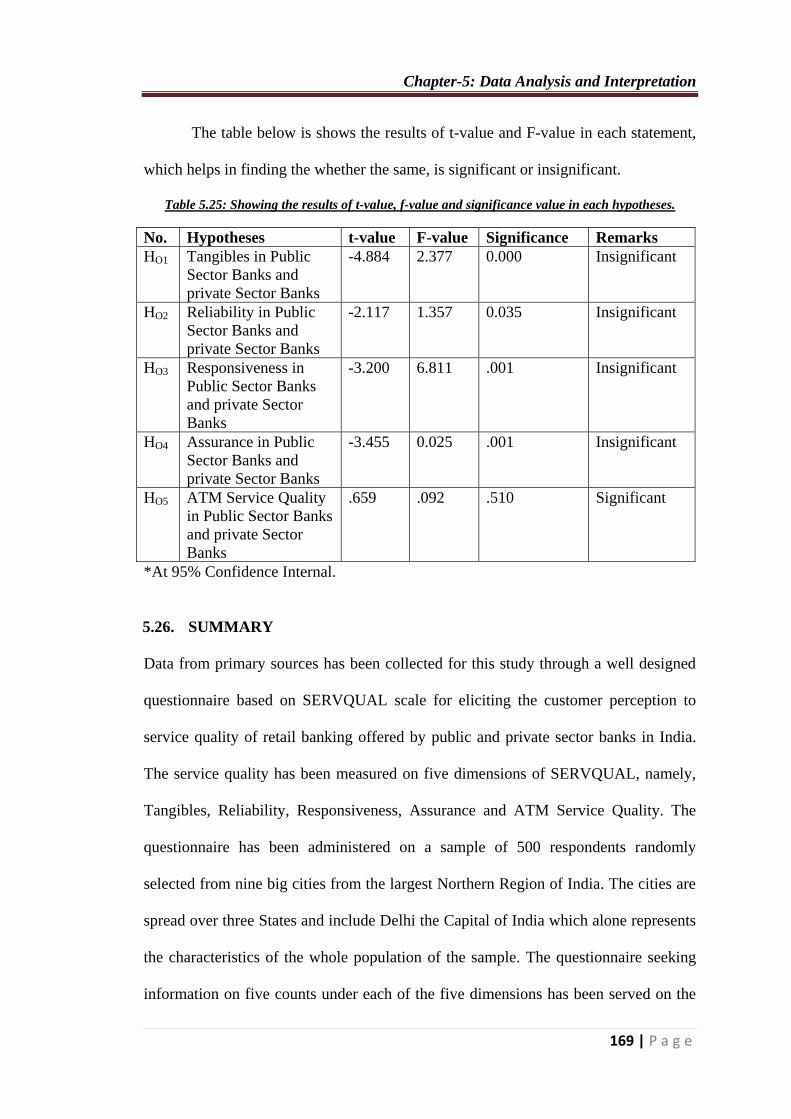
Chapter-5: Data Analysis and Interpretation
169 | P a g e
The table below is shows the results of t-value and F-value in each statement,
which helps in finding the whether the same, is significant or insignificant.
Table 5.25: Showing the results of t-value, f-value and significance value in each hypotheses.
No. Hypotheses t-value F-value Significance Remarks
HO1 Tangibles in Public
Sector Banks and
private Sector Banks
-4.884 2.377 0.000 Insignificant
HO2 Reliability in Public
Sector Banks and
private Sector Banks
-2.117 1.357 0.035 Insignificant
HO3 Responsiveness in
Public Sector Banks
and private Sector
Banks
-3.200 6.811 .001 Insignificant
HO4 Assurance in Public
Sector Banks and
private Sector Banks
-3.455 0.025 .001 Insignificant
HO5 ATM Service Quality
in Public Sector Banks
and private Sector
Banks
.659 .092 .510 Significant
*At 95% Confidence Internal.
5.26. SUMMARY
Data from primary sources has been collected for this study through a well designed
questionnaire based on SERVQUAL scale for eliciting the customer perception to
service quality of retail banking offered by public and private sector banks in India.
The service quality has been measured on five dimensions of SERVQUAL, namely,
Tangibles, Reliability, Responsiveness, Assurance and ATM Service Quality. The
questionnaire has been administered on a sample of 500 respondents randomly
selected from nine big cities from the largest Northern Region of India. The cities are
spread over three States and include Delhi the Capital of India which alone represents
the characteristics of the whole population of the sample. The questionnaire seeking
information on five counts under each of the five dimensions has been served on the
Chapter-5: Data Analysis and Interpretation
170 | P a g e
sampled respondents and data collected from them. With the application of statistical
tools, the data has been analyzed and interpreted. The results have been applied to test
the hypotheses formulated for this study. The outcome revealed that of the five
hypotheses framed, four null hypotheses have been tested negative and the fifth one
stands accepted.
The next chapter concludes this study. It consolidates the findings derived
from the analysis and interpretation of the data and formulates suggestions for making
up the deficiencies and upgrading the service quality in retail banking segment of
Indian banks in public and private sector.
Chapter-5: Data Analysis and Interpretation
171 | P a g e
REFERENCE:
Cronin, J.J. and Taylor, S.A., (1992), “Measuring service quality: A re-
examination and extension”, Journal of Marketing, 56, 55-68.
Oliver, R.L. (1980), “A cognitive model of the antecedents and consequences
of satisfaction decisions”, Journal of Marketing Research, Vol. XVII,
November, pp. 460-9.
Parasuraman, A., Zeithaml, V.A. and Berry, L.L. (1985), ‘A conceptual model
of service quality and its implications for future research”, Journal of
Marketing, 49, 4 1-50.
Parasuraman, A., Zeithaml, V.A. and Berry, L.L. (1988), “SERVQUAL: a
multiple-item scale for measuring consumer perceptions of service quality”,
Journal of Retailing, Vol. 64 No. 1, Spring, pp. 12-40.
Valarie A. Zeithaml&Bitner, (1989) “Service Marketing”- Integrating
Customer Focus Across The Firm, 3d edition, Tata McGraw-Hill Publication
Pg. 33.
Bhattacharjee (1988) “Service Marketing Concepts, planning &
implementation”, Excel Book, 1st edition , the quality definition jointly
developed by American National Standards Institute (ANSI) and the American
Society for Quality (ASQ) pg. 494.
Babakus, E. and Boiler, G.W. (1992), “An empirical assessment of the
SERVQUAL scale”, Journal of Business Research, Volume 24, Number 3, pp.
253-268.
Buttle, F. (1996), “SERVQUAL: review, critique, research agenda”, European
Journal of Marketing, Volume 30, Number 1, pp. 8-32.
Chapter-5: Data Analysis and Interpretation
172 | P a g e
Carman, J.M. (1990), “Customer perceptions of service quality: an assessment
of the SERVQUAL dimensions”, Journal of Retailing, Volume 66, Number 1,
pp. 33-55.
Gronroos, C. (1984), “A service quality model and its marketing
implications”, European Journal of Marketing, Volume 18, Number 4, pp. 36-
44.
Gronroos. C. (2001), “The perceived service quality concept — a mistake?”,
Managing Service Quality, Volume 11, Number 3, pp. 150-152.
Jayawardhena, C. (2004), “Measurement of service quality in Internet
banking: the development of an instrument”, Journal of Marketing and
Management, Volume 20, pp. 185-207.
Jiang, J.J., Klein, G. and Crampton, S.M. (2000), “A note on SERVQUAL
reliability and validity in information system service quality measurement”,
Decision Sciences, Volume 31, Number 3, pp. 725-744.
Kotler, P. and Armstrong, G. (1996), “Principles of Marketing”, Seventh
Edition, Prentice-Hall International, Englewood Cliffs, New Jersey, Chapter
21, pp. 656-681.
Ladhari, R. (2008), “Alternative measure of service quality: a review”, Journal
of Managing Service Quality, Volume 18, Number 1, pp. 65-86.
Parasuraman, A., Zeithaml, V.A., and Berry, L.L. (1985), “A conceptual
model of service quality and its implications for future research”, Journal of
Marketing, Volume 49, Fall, pp. 41-50.
Parasuraman, A., Zeithaml, V.A., and Berry, L.L. (1988), “SERVQUAL: a
multiple-item scale for measuring consumer perceptions of service quality”,

Chapter-5: Data Analysis and Interpretation
173 | P a g e
Journal of Retailing, Volume 64, Number 1, Spring, pp. 12-40. Parasuraman,
A., Zeithaml, V. and Berry, L.L. (1991b), “Refinement and reassessment of
the SERVQUAL scale”, Journal of Retailing, Volume 67, Number 4, pp. 420-
450.
Parasuraman, A., Zeithaml, V.A., and Berry, L.L. (1994), “Alternative scales
for measuring service quality: A comparative assessment based on
psychometric and diagnostic criteria”, Journal of Retailing, Volume 70,
Number 3, Spring, pp. 20 1-230.
Rust, R.T. and Oliver, R.L. (1994), “Service Quality: New Directions in
Theory and Practice”, Sage, London.
Saunders, M. Lewis, P. Thomhill, A. (2007), “Research Methods for Business
Students”, 3’ edition. Harlow: Pearson Education Limited.
Seth, N., Deshmukh, S.G., and Vrat, P. (2005), “Service quality models: a
review”, International Journal of Quality and Reliability Management,
Volume 22, Number 9, pp. 9 13-949.