data analysis for linguistics - cuni.cz
TRANSCRIPT

Data Analysis for Linguistics
Silvie Cinková, UFAL - 2017-02-07 TextLink Winter School

The math a linguist needs ain’t rocket science. And no one is asking you to be brilliant, just competent. The Lousy Linguist, 2010 http://thelousylinguist.blogspot.cz/2010/01/why-linguists-should-study-math.html

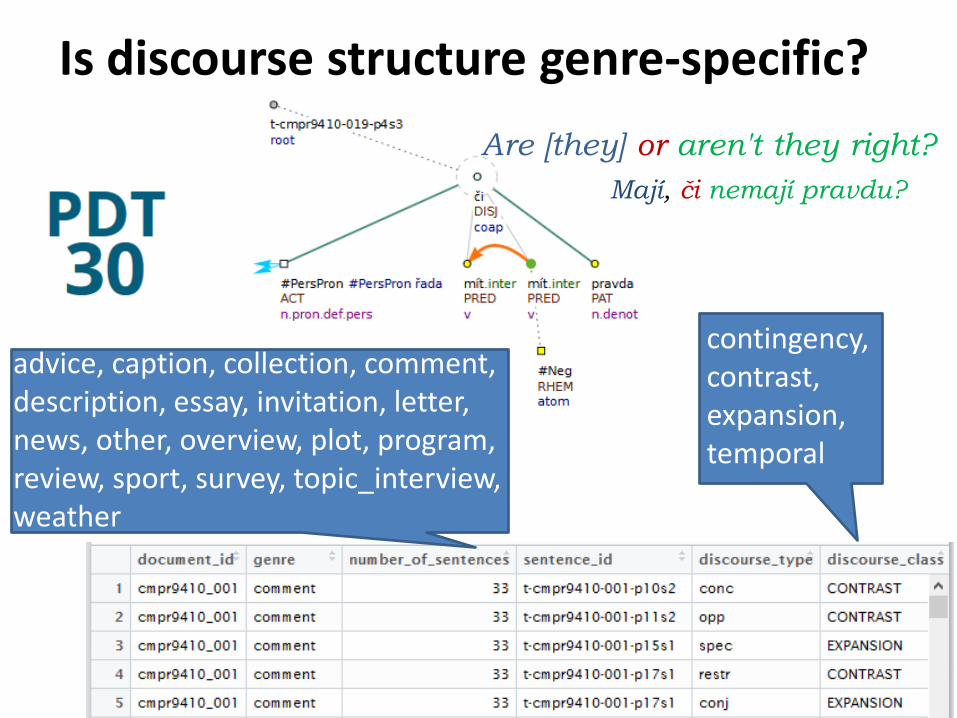
Is discourse structure genre-specific? Are [they] or aren't they right?
Mají, či nemají pravdu?
advice, caption, collection, comment, description, essay, invitation, letter, news, other, overview, plot, program, review, sport, survey, topic_interview, weather
contingency, contrast, expansion, temporal
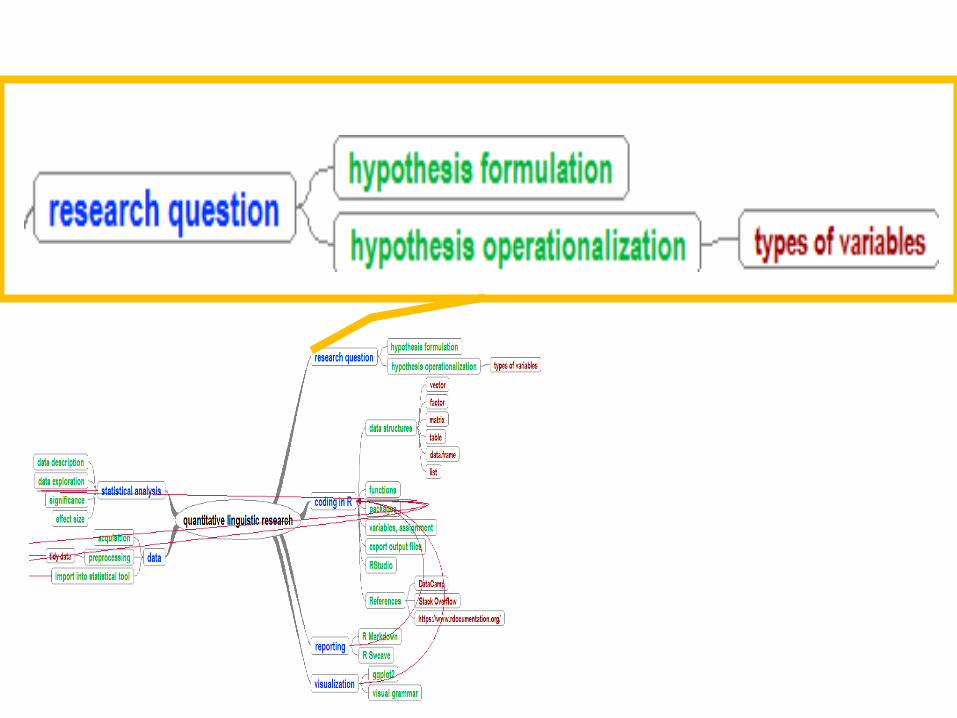

Hypothesis
• general statement concerned with more than just a singular event
• if... then, the... the... and their paraphrases • Potentially falsifiable
– no hedges: may, possibly,slightly, often...
• variables operationalized – length of sentence: tokens? characters? time?

Hypothesis Testing
Alternative Hypothesis
with statistical tests
H1: difference
H0: No
difference
Falsify H0
Null Hypothesis
Hypotheses cannot be verified, just falsified. Falsify the opposite!
Select an appropriate test!

Operationalization • Discourse structure = distribution of different
discourse classes • Hypothesis: Genres differ wrt the distribution of
different discourse classes. Genres and distribution of discourse classes are dependent of each other. There is an association between genre and discourse class.

• Set alpha level (aka significance level) • Select appropriate test • Test H0 • Reject or keep H0

Test Selection
• How many indep. variables? • Which types of variables? • How many observations? • Distribution of variable values? • Computing power?
Some tests assume the sample data fit a certain distribution Test goodness-of-fit to choose right

Variable Types • dependent
– the observed one • independent
– the controlled one
• categorical – male, female – brown, blue, green
• categorical + ordinal – beginner < intermediate <
advanced • quantitative + interval
– no zero point (Fahrenheit scale)
• quantitative + ratio – zero point
• quantitative + continuous ⁻ weight, height...
• quantitative + discrete ⁻ frequencies


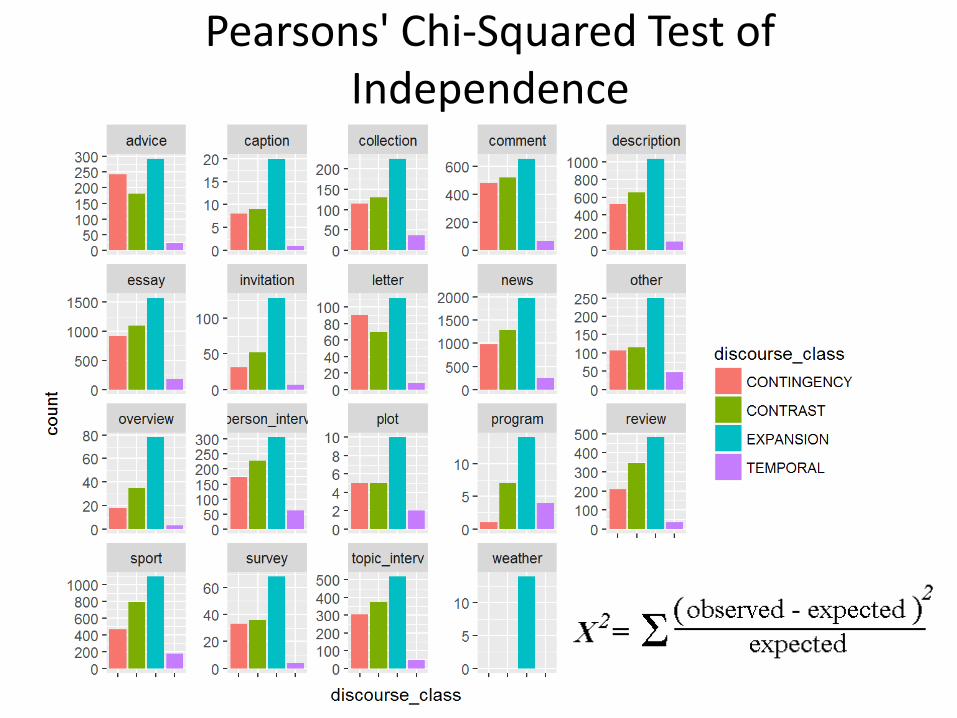
Pearsons' Chi-Squared Test of Independence

Assumptions of Chisq 1. Samples must be independent
(i.e. observations not paired)
2. All expected values must exceed 5


Initial Questions about Data Set Data Cleaning
• What is one observation? • Distribution of text lengths
– (how many how long texts?) • How much bulk text for each genre?
– no matter in how many documents • Distribution of text lenghts genrewise
– (how many how long texts for each genre?) • How many connectives in the texts genrewise? • Examine strange cases, remove errors

What is one observation here, conceptually?

Summarizing the Corpus I

Summarizing the Corpus II

Contingency Table (2-Way Table) Genre vs. Discourse Class

Summary of Text Lengths

Distribution of Text Lengths Histogram with Bins, Absolute Frequencies

Distribution of Text Lengths Histogram with Bins, Relative Frequencies

Genre vs. Bulk Text Length - Bar Plot

Distribution of Text Lengths Genrewise Histogram with Additional Variable

Distribution of Text Lengths Genrewise Box Plots with Whiskers

Numbers of Connectives in Different Texts Genrewise

Adding Unique Docs

Bulk Text Outlier Genres

How Many Connective Each Genre?
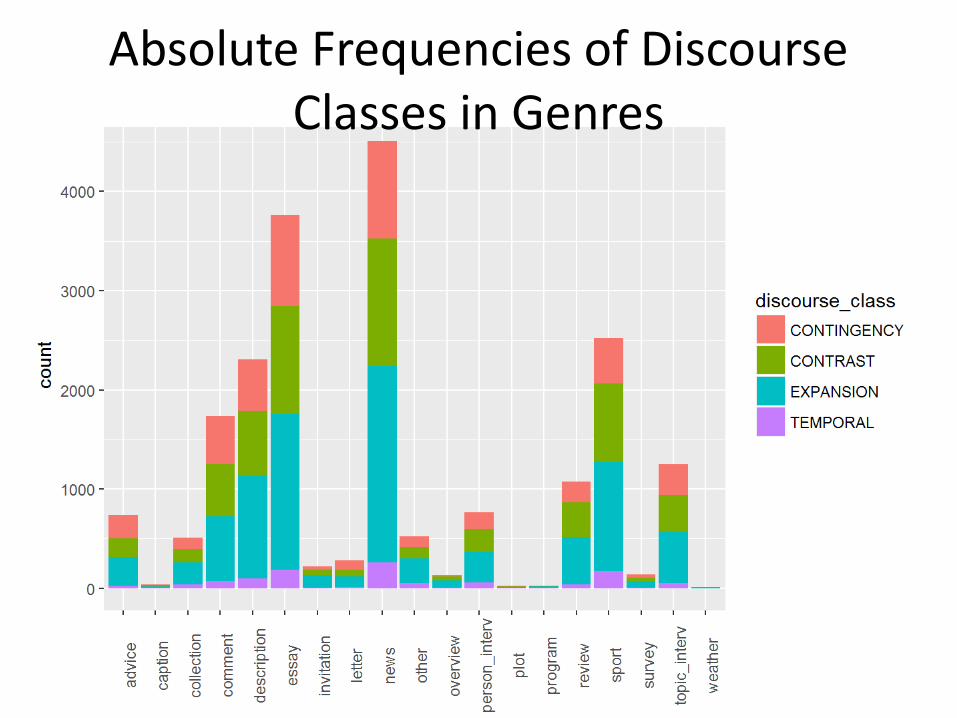
Absolute Frequencies of Discourse Classes in Genres

Proportions with Rugs

Mosaic Plot - Proportions of Discourse Classes Genrewise

Faceted Absolute Frequencies of Discourse Classes Genrewise,
Unified Scale

Faceted Absolute Frequencies of Discourse Classes Genrewise,
Individual Scales

Expected Value in Each Cell
4 701 5 398 8 850 1 066
741 38
507 ...
...
22 26
1072 2525
141 1247
14
20 555
Expected value must be larger than 5! (sometimes disputed...)


Chisq Test

Standardized Residuals

t-test or Wilcoxon-Mann-Whitney-U test to Compare Connectedness ?
• document connectedness (a toy variable): – number of connectives/number of words
• Hypothesis H1: Genres differ in document connectedness
• Distribution of a single quantitative variable compared across genres

Distribution of document connectedness in each genre

t-test Assumptions
• samples have normal distribution • each sample contains at least 30 observations

Histograms of Connectedness + Approx. Number of Texts in Genres

Shapiro-Wilk Test + Sample Sizes

Wilcoxon Test Outcomes

Normalized Deviation of Proportions (Gries 2008, Lijffijt & Gries 2012)
norm_DP_word <- (sum(abs(obs_word_prop - exp_word_prop))/2)/(1-min(exp_word_prop)).
A value between 0 and 1 for a given word. The lower, the more evenly is the word spread across the observed groups. Our application: Which discourse classes evenly spread across genres? Which biased towards some? (The test will not tell to which. ) Our result: all four discourse classes have NDP approx. 0,2. No drammatic bias, no dramatic differences.

Visualization Layers in ggplot2

Useful References • www.datacamp.com/
– a high-quality on-line course hub, very affordable for academics • www.stackoverflow.com
– questions and answers community portal for many prog. lang. • http://cran.r-project.org/web/views/NaturalLanguage
Processing.html – language-oriented R libraries
• http://r4ds.had.co.nz – preprint of a book about data science with R, the most up-
to-date methods • http://kbroman.org/knitr_knutshell/
– reporting - how to write RMarkDown documents