data analysis in dataverse & visualization of datasets on historical maps
TRANSCRIPT
CLIO INFRA
Data analysis in Dataverse & visualization of datasets on historical maps
Dataverse Community meeting 2015, June 11, Harvard University
Vyacheslav Tykhonov Richard Zijdeman Jerry de VriesInternational Institute of Social History
Introduction
The International Institute of Social History (IISH) collects information in the field of social history and makes it available to the public. The IISH is one of the major scientific heritage institutions in the Netherlands. In the field of socio-economic historical research IISH plays a prominent role.
CLIO INFRA is Digital Research Infrastructure for the Arts and Humanities developed to integrate a number of databases (hubs) consisting of data on global social, economic and institutional indicators over the past five centuries, with special attention for the past 200 years. Clio Infra developed by IISH.

Our missionClio Infra is the bridge between Data Collections and Research Datasets.
“Old school” researchers time:Collecting datasets in CSV, Access or Excel and other formats mostly on his own without real collaboration between all researchers in the same field. Very closed model.
Digital Humanities era:Young researchers use various computer tools to collect, analyze and combine research datasets they’ve got from older generation of researchers. They can contribute and help each other and build communities.
The future:The goal is to build tools to get datasets from “old school” researchers, standardize and store data in the Clouds in order provide access to Open Data for researchers all over the world and made possible collaboration between them.
Clio Infra Collaboration platform
Clio Infra functionality based on the Dataverse solution:- teams collaboratively can curate, share and analyze research datasets- teams members can share the responsibility to collect data on specific variables (for example, countries) and inform each other about changes and additions- dataset version control system is able to track changes in datasets- other researchers can download their own copy of the data if dataset is published as Open Data
Dataverse is flexible metadata store (repository) that connected with Research datasets storage by our Data Processing Engine (DPE)

Added Value for future Researchers
The benefits of data sharing can be classified in terms of Metadata and Data access and sharing (Collection tools) and Statistical Analysis and Data Mining (Research tools):
● access to a specific case study, citing and finding data● access to the universe of data from Dataverse network that can organize and display
them for browsing and searching● data filtering: researchers with proper authorization can obtain the subset of data
provided by data collector● data analysis to run descriptive statistics and graphics, visualization, plotting on
historical maps● Data APIs to export data for further analysis by popular statistical packages (STATA,
SPSS, R, iPython Notebook) and advanced data mining tools that will be developed in the future (always up-to-date solution)
Collaboration possibilities
Descriptive metadata:- dataset file- documentation- standardized tables with codes can be part of dataset
Sharing and collaboration capabilities:- requesting unique API token by every researcher - user of Dataverse- exchanging API token between researchers and granting permissions to work on the
same datasets as a team using data analysis tools
Collaboration Data Workflow
- Draft Datasets are visible only for owners- with API tokens researchers can get access to interactive dashboard to get some
insights about the data stored in the Dataverse- every dataset converted to dataframe- dashboard can provide access to all variables from the dataframe and visualize them
on charts, graphs, historical maps and treemaps
After dataset is prepared to go public, it can be published in Collabs:- guest users can download the copy of dataset- team members with permissions and authorized API token can contribute to dataset
Data Analysis in Clio Infra
● Data Processing Engine has python core and developed for nlgis.nl (Netherlands
Geographic Information System) and distributed as widget● interactive data exploration dashboard based on D3 library● every dataset from Dataverse is available as Data API (json) and can be connected to
any statistical package● filtering the data on specific years and variables based on dataframes (pandas, python
for data analysis)● data quality check is the quick visual tool to apply Benford’s law for all values from
specific dataset● dataframes can be open by researchers in various statistical packages like iPython
notebook, R Studio, SPSS, STATA, Mathlab, etc
Data Processing Engine (DPE) specification
● can split values from any dataset in number of categories specified by researcher (8 by default)
● algorithm to categorize data values in proper categories can be selected manually (percentile by default)
● can define maximum possible categories for specific dataset if there is no way to get categories number specified by user of the system (for example, if there are 2-3 categories of data values)
● data ranges should be defined to get possibility to visualize data on some chart or map in the right scale
● colors can be specified by user (Color Brewing, see http://colorbrewer2.org)● legend generated and attached to all visualizations automatically● values with missing data shown as 'no data' regions on map● all data values delivered by Data API to make the data analysis platform independent
and communicate with other systems or statistical packages
API Service (Data API)
Data API provided by Data Processing Engine is the most important functionality for the well equipped digital infrastructure:
● easy way to analyze data in popular statistical packages (STATA, SPSS, Excel)● use common data science programming languages like Python, R to perform more
advanced research using external Data Science libraries● analyze data with toolboxes like Wolfram|Alpha and other Discovery Platforms (added
value for the future)● suitable for other researchers and developers to use advanced technique and data
mining tools that aren’t developed yet
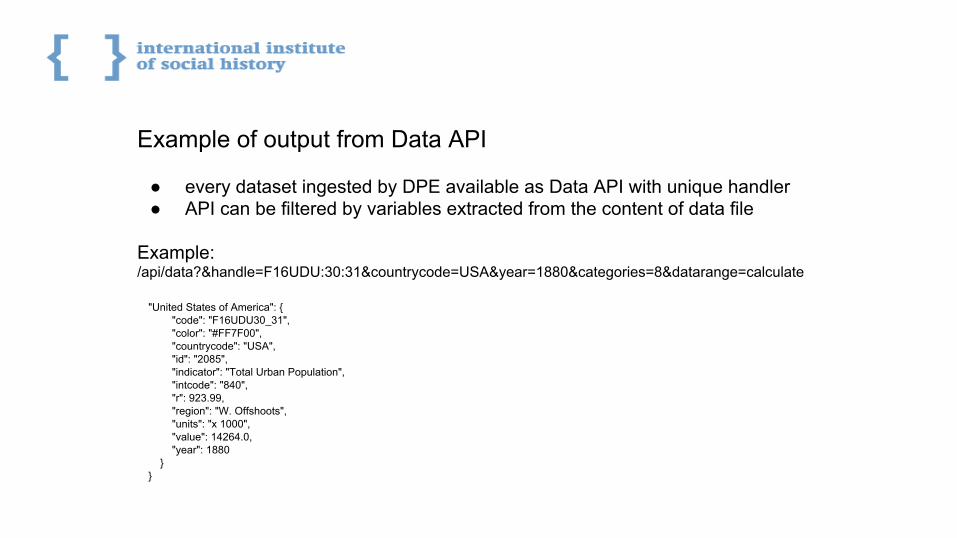
Example of output from Data API
● every dataset ingested by DPE available as Data API with unique handler● API can be filtered by variables extracted from the content of data file
Example:/api/data?&handle=F16UDU:30:31&countrycode=USA&year=1880&categories=8&datarange=calculate
"United States of America": { "code": "F16UDU30_31", "color": "#FF7F00", "countrycode": "USA", "id": "2085", "indicator": "Total Urban Population", "intcode": "840", "r": 923.99, "region": "W. Offshoots", "units": "x 1000", "value": 14264.0, "year": 1880 }}
Data visualization and plotting data on historical maps
● Data Processing Engine (DPE) is the core of data visualization process and connected to geoservice
● data attributes like scales and colors calculated by DPE on the fly based on the input of researcher (for example, number of categories to split data) and the part of Data API
● histograms, cross tabulations, enhanced descriptive statistics based on pandas dataframes
● visualization of datasets on historical maps will be available to plot data on maps for last 500 years
Historical maps services: Geoservice and Geocoder
Delivered by Webmapper.nl and integrated with common Clio Infra infrastructure.
Geoservice basic requirements:- should provide actual GeoAPI with historical polygons for all countries and regions
based on standardized codes- available as geojson/topojson for online visualization- QGIS toolbox should be supported to upload new maps and update old maps as shape
files
Geocoder should be able to standardize all geographical locations in different datasets:- USSR and Soviet Union should be recognized as one country with the same PID- Germany before and after 1990 - Indonesia before and after 1999

GeoAPI example
Geoservice can provide polygons for specific years on the national or world level rendered as topojson or geojson.
GeoAPI: /api/maps?world=on&year=1962
Polygons for all countries will be delivered as topojson:arcs":[[1782,2186]]}]}},"arcs":[[[8387,6231],[0,5],[1,1],[1,-1],[2,0],[2,-1],[3,-4],[1,-3],[0,-1],[-1,-5],[0,-1],[-1,2],[0,1],[-2,2],[-3,1],[-1,0],[-1,0],[-1,3],[0,1]],[[8390,6247],[1,1],[0,1],[2,1],[1,0],[1,-2],[-1,-5],[-1,0],[-1,1],[-1,1],[-1,1],[0,1]],[[8391,6204],[0,2],[-1,1],[-1,-1],[0,1],[0,1],[1,3],[1,0],[2,-6],[0,-1],[0,-1],[0,-1],[-1,1],[-1,1]],[[8364,6093],[0,2],[2,5],[1,0],[1,-2],[-1,-6],[-1,-3],[-1,0],[-1,0],[0,1],[0,3]],[[5941,6575],[0,-1],[-1,0],[-1,1],[0,1],[-1,0],[-1,0],[-1,0],[-1,0],[0,-1],[-1,-1],[0,-2],[0,-1],[0,-2],[0,-1],[-1,-3],[-3,-2],[-4,-4],[-1,-1],[-1,0],[-2,-1],[-2,0],[-1,0],[-1,-1],[-1,-2],[-5,1],[-1,0],[-1,-1],[-1,-1],[-1,0],[-2,1],[-4,3],[-1,1],[-1,2],[-2,8],[-1,4],[-1,9],[0,1],[0,2],[0,1],[1,0],[0,-1],[0,-1],[1,-1],[0,-1],[1,0]
Integration of Dataverse, DPE, geoservice and geocoder in 6 steps
1. Data API communicates with geocoder to find standardized codes for all locations in dataset
2. the same geocode with associated polygons is coming from geoservice3. data and geoservice matching in the frontend by any geospatial javascript library4. attributes like colors and scales filling the map polygons 5. legend with scales, values and colors coming from DPE to make map look complete6. notes, sources and other metadata extracting from dataverse API to provide clear
explanation of generated historical map
Live demo for Labor Conflicts in 100 years
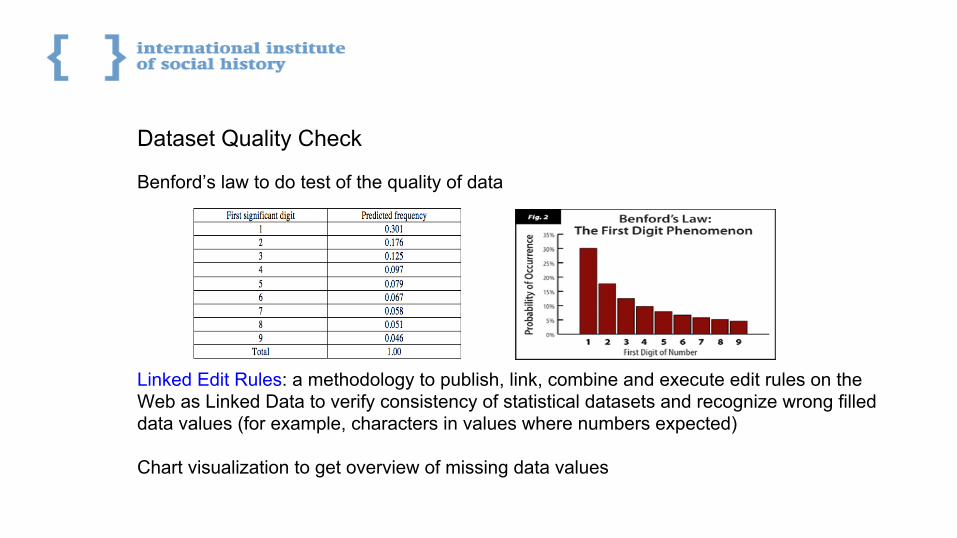
Dataset Quality Check
Benford’s law to do test of the quality of data
Linked Edit Rules: a methodology to publish, link, combine and execute edit rules on the Web as Linked Data to verify consistency of statistical datasets and recognize wrong filled data values (for example, characters in values where numbers expected)
Chart visualization to get overview of missing data values
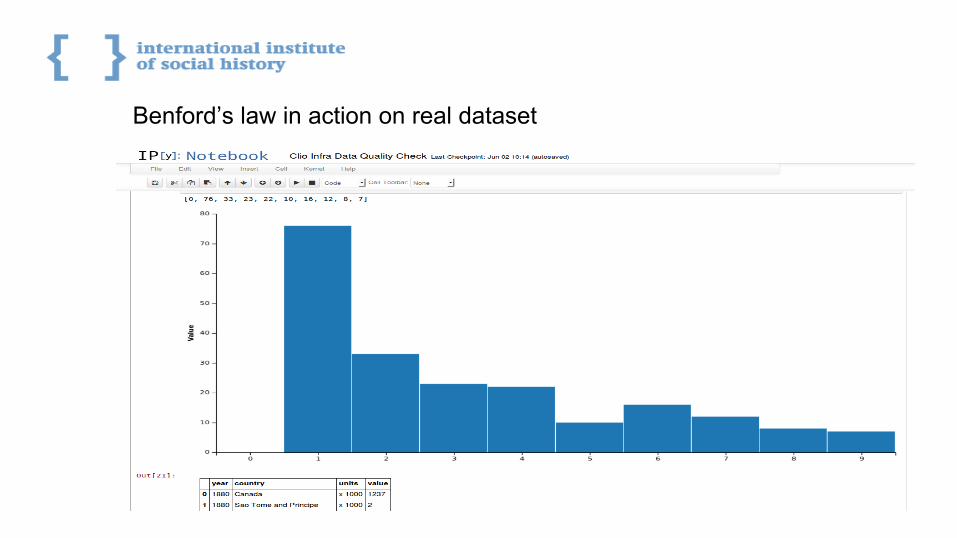
Benford’s law in action on real dataset
Datasets combining and aggregation in data exploration tools
● tools that can predict the same variables disambiguated in different datasets (Year and Jaar)
● geocoding services can standardize different regions (Netherlands → NL, Amsterdam → AMS)
● all possible relationship paths can be ranked from the “best” (100%) to the “worst” (0%), for example, value “05” for variable “Month” can be recognized as “May”
● standardized datasets can be used as “reference” data for other datasets from other researcher groups and depot services (CHIA, Harvard DataVerse Network, MIT, DANS)
Clio Infra Infrastructure is suitable for different kinds of datasets
Quantitative datasets that store quantity data values (numbers):- data measured (length, speed, height, age)- example: current clio-infra datasets
Qualitative datasets store quality observations (descriptions):- data can be observed (colors, textures, professions, groups)- example: HISCO, world strikes dataset
Data Visualization is different for different kinds of datasets:- quantity can be plotted on charts, graphs, historical maps- quality (hierarchy) can be visualized on treemaps and maps
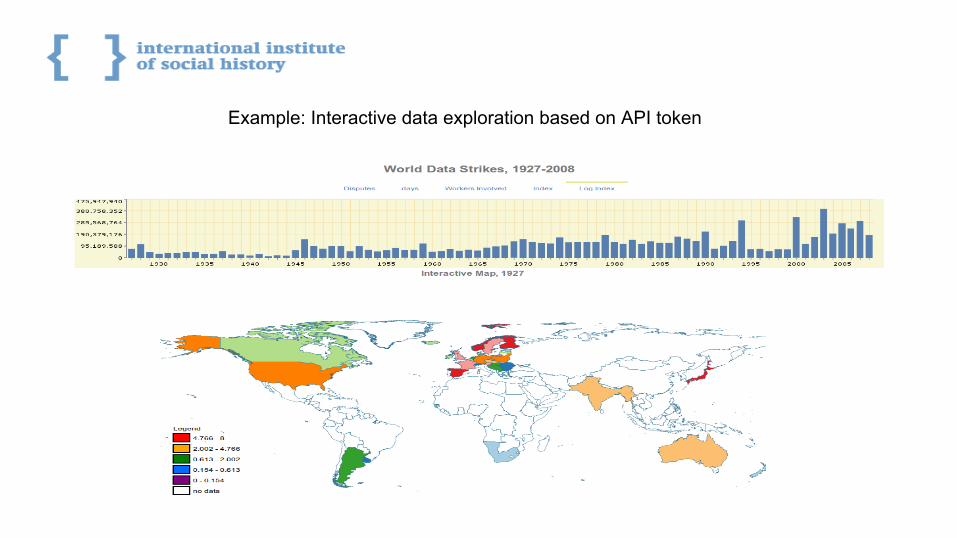
Example: Interactive data exploration based on API token
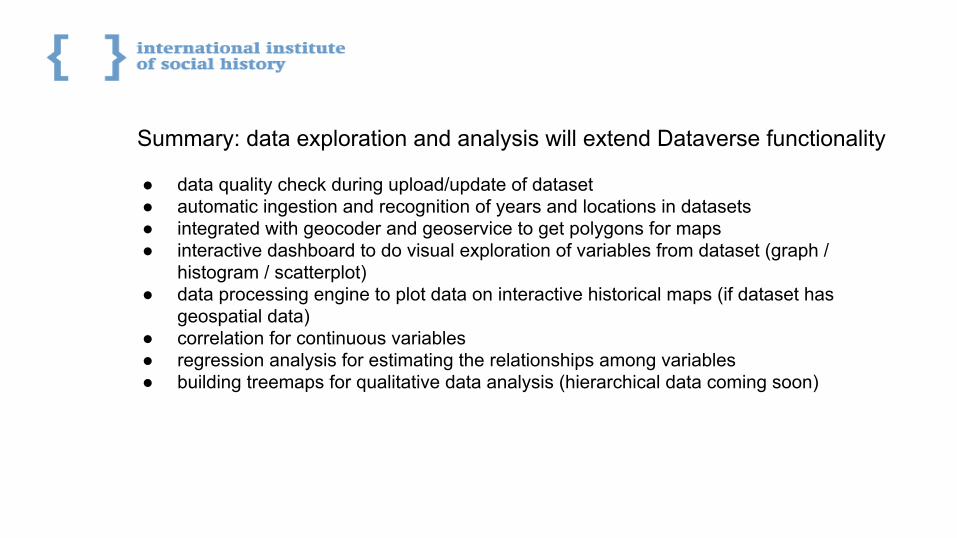
Summary: data exploration and analysis will extend Dataverse functionality
● data quality check during upload/update of dataset● automatic ingestion and recognition of years and locations in datasets● integrated with geocoder and geoservice to get polygons for maps● interactive dashboard to do visual exploration of variables from dataset (graph /
histogram / scatterplot)● data processing engine to plot data on interactive historical maps (if dataset has
geospatial data)● correlation for continuous variables● regression analysis for estimating the relationships among variables ● building treemaps for qualitative data analysis (hierarchical data coming soon)

Thank you!
Any suggestions?