data analysis of npas in different sectors
TRANSCRIPT

8/8/2019 Data Analysis of NPAs in Different Sectors
http://slidepdf.com/reader/full/data-analysis-of-npas-in-different-sectors 1/37
{1}Executive Summery
Financial sector reform in India has progressed rapidly on aspects like interest rate
deregulation, reduction in reserve requirements, barriers to entry, prudential norms andrisk-based supervision. But progress on the structural-institutional aspects has been muchslower and is a cause for concern. The sheltering of weak institutions while liberalizingoperational rules of the game is making implementation of operational changes difficultand ineffective. Changes required to tackle the NPA problem would have to span theentire gamut of judiciary, polity and the bureaucracy to be truly effective.
This Research deals with the experiences of other Asian countries in handling of NPAs.It further looks into the effect of the reforms on the level of NPAs and suggestsmechanisms to handle the problem by drawing on experiences from other countries.
The Indian banking system has withstood the pressure of global financial turmoil asreflected in the improvement in the Capital to Risk-Weighted Assets Ratio (CRAR). Theoverall CRAR of all SCBs improved to 13.2 per cent at end-March 2009 from 13.0 per cent at end-March 2008, thus, remaining significantly above the stipulated minimum of 9.0 per cent. Some slippage was observed in NPAs, as reflected in the marginal increaseof gross NPAs to gross advances ratio. This was however on expected lines given theslowdown of the economy. On the whole, however, the Indian banking system
performed reasonably well in this extraordinarily turbulent year.
The gross Non-Performing Assets (NPA) to gross advances ratio remained unchanged at2.3 percent as at end-March 2009 from its level as at end-March 2008. The Return onAssets (ROA) also remained unchanged at 1.0 per cent at end- March 2009 over its levelat end-March 2008 indicating no deterioration in efficiency with which banks deployedtheir assets. The Return on Equity (ROE) increased to 13.3 per cent as at end-March2009 from 12.5 per cent at end-March 2008, indicating increased efficiency with whichcapital was used by banks.
There has been a consistent decline in NPA ratios over the years. In the context of highGDP growth high as well as credit growth in the past five years, given the well knownleads and lags in the relation between credit growth and NPA trends, several analystsexpect the level of NPAs to increase, particularly in the context of restructuring of loans.
Page | 1

8/8/2019 Data Analysis of NPAs in Different Sectors
http://slidepdf.com/reader/full/data-analysis-of-npas-in-different-sectors 2/37
{2}Introduction
A strong banking sector is important for flourishing economy. The failure of the banking
sector may have an adverse impact on other sectors. Non-performing assets are one of the major concerns for banks in India.
NPAs reflect the performance of banks. A high level of NPAs suggests high probabilityof a large number of credit defaults that affect the profitability and net-worth of banksand also erodes the value of the asset. The NPA growth involves the necessity of
provisions, which reduces the overall profits and shareholders’ value. The issue of NonPerforming Assets has been discussed at length for financial system all over the world.The problem of NPAs is not only affecting the banks but also the whole economy. In facthigh level of NPAs in Indian banks is nothing but a reflection of the state of health of theindustry and trade. The paper deals with understanding the concept of NPAs, its
magnitude and major causes for an account becoming non-performing, projection of NPAs over next three years in Public sector banks and concluding remarks.After nationalization, the initial mandate that banks were given was to expand their
branch network, increase the savings rate and extend credit to the rural and SSIsectors. This mandate has been achieved admirably. Since the early 90’s the focushas shifted towards improving quality of assets and better risk management. The‘directed’ lending approach has given way to more market driven practices.
The Narasimhan Committee has recommended prudential norms on incomerecognition, asset classification and provisioning. In a change from the past, Incomerecognition is now not on an accrual basis but when it is actually received. Past
problems faced by banks were to a great extent attributable to this. Classification of what an NPA is has changed with tightening of prudential norms. Currently an assetis “non-performing” if interest or installments of principal due remain unpaid for morethan 180 days.
1-Definition--Non Performing Asset means an asset or account of borrower , which has been classified by a bank or financial institution as sub-standard, doubtful or loss asset,in accordance with the directions or guidelines relating to asset classification issued byThe Reserve Bank of India
A-Ninety days overdue:-
With a view to moving towards international best practices and to ensure greater transparency, it has been decided to adopt the '90 days overdue' norm for identificationof NPAs, form the year ending March 31, 2004. Accordingly, with effect from March 31,2004, a non-performing asset (NPA) shall be a loan or an advance where:
1. interest and /or installment of principal remain overdue for a period of more than90 days in respect of a Term Loan,
2. the account remains 'out of order' for a period of more than 90 days, inrespect of an overdraft/ cash Credit(OD/CC),
3. the bill remains overdue for a period of more than 90 days in the case of bills purchased and discounted,
Page | 2

8/8/2019 Data Analysis of NPAs in Different Sectors
http://slidepdf.com/reader/full/data-analysis-of-npas-in-different-sectors 3/37
4. interest and/ or installment of principal remains overdue for two harvest seasons but for a period not exceeding two half years in the case of an advance grantedfor agricultural purpose, and
B-Out of order:-
An account treated as 'out of order' if the outstanding balance remains continuously inexcess of the sanctioned limit/ drawing power. In case where the outstanding
balance in the principal operating account is less than the sanctioned limit/ drawing power, but there are no credits continuously for six months as on the date of balance sheet or credits are not enough to cover the interest debited during thesame period, these account should be treated as 'out of order.
2-Reasons:- Various studies have been conducted to analysis the reasons for NPA.
Whatever may be complete elimination of NPA is impossible. The reasons may be
widely classified in two:
1. Over hang component- due to the environment reasons, business cycle etc
2. Incremental component- be due to internal bank management, credit policy
3-Asset Classification:-
The RBI has issued guidelines to banks for classification of assets into four categories.
1) Standard assets:-These are loans which do not have any problem are less risk 2)
Substandard assets:-These are assets which come under the category of NPAfor a period of less than 12 months.
3) Doubtful assets: These are NPA exceeding 12 months4) Loss assets: These NPA which are identified as unreliable by internal inspector
of bank or auditors or by RBI. The classification of assets of scheduledcommercial bank.
4-Management of NPA:-
The table II&III shows that during initial sage the percentage of NPA was higher. Thiswas due to show ineffective recovery of bank credit, lacuna in credit recovery system,
inadequate legal provision etc. Various steps have been taken by the government torecover and reduce NPAs. Some of them are.
1) One time settlement / compromise scheme2) Lok adalats3) Debt Recovery Tribunals4) Securitization and reconstruction of financial assets and enforcement of Security
Interest Act 2002.5) Corporate Reconstruction Companies6) Credit information on defaulters and role of credit information bureaus
Page | 3

8/8/2019 Data Analysis of NPAs in Different Sectors
http://slidepdf.com/reader/full/data-analysis-of-npas-in-different-sectors 4/37
{3}Objectives of the study
1-To understand the meaning & nature of NPAs.
2-To examine the causes for NPAs in public sector banks.3-To project the NPAs in public sector and private sector banks over next five years
using Trend Analysis as a tool.
Methodology:-
In order to meet the Third objective, the method of Moving Averages is been used, fromwhich we arrive at a Trend Analysis. While the rationale behind selection of 'Three year Moving Average' method is because of the availability of the data. The data availablewas from the ten years and needless to say that for such a data a 'Six year Moving
average' or a 'Eight year Moving Average' will not work out.
Meaning of NPAs;-
An asset is classified as Non-performing Asset (NPA) if due in the form of principal andinterest are not paid by the borrower for a period of 180 days. However with effect fromMarch 2004, default status would be given to a borrower if dues are not paid for 90 days.If any advance or credit facilities granted by banks to a borrower becomes non-
performing, then the bank will have to treat all the advances/credit facilities granted tothat borrower as non-performing without having any regard to the fact that there maystill exist certain advances / credit facilities having performing status.
Though the term NPA connotes a financial asset of a commercial bank, which hasstopped earning an expected reasonable return, it is also a reflection of the productivityof the unit, firm, concern, industry and nation where that asset is idling. Viewed with this
perspective, the NPA is a result of an environment that prevents it from performing up toexpected levels. The definition of NPAs in Indian context is certainly more liberal withtwo quarters norm being applied for classification of such assets. The RBI is movingover to one-quarter norm from 2004 onwards
Magnitude of NPAs:-
In India, the NPAs that are considered to be at higher levels than those in other countrieshave of late, attracted the attention of public. The Indian banking system had acquired alarge quantum of NPAs, which can be termed as legacy NPAs. Dealing with NPAsinvolves two sets of policies
1. Relating to existing NPAs.2. To reduce fresh NPA generation.
As far as old NPAs are concerned, a bank can remove it on its own or sell the assets toAMCs to clean up its balance sheet. For preventing fresh NPAs, the bank itself shouldadopt proper policies.
Page | 4

8/8/2019 Data Analysis of NPAs in Different Sectors
http://slidepdf.com/reader/full/data-analysis-of-npas-in-different-sectors 5/37
{4}
Causes for Non Performing Assets
A strong banking sector is important for a flourishing economy. The failure of the
banking sector may have an adverse impact on other sectors. The Indian banking system,which was operating in a closed economy, now faces the challenges of an openeconomy.
On one hand a protected environment ensured that banks never needed to developsophisticated treasury operations and Asset Liability Management skills.On the other hand a combination of directed lending and social banking relegated
profitability and competitiveness to the background. The net result was unsustainable NPAs and consequently a higher effective cost of banking services.
One of the main causes of NPAs into banking sector is the directed loans system under which commercial banks are required a prescribed percentage of their credit (40%) to
priority sectors. As of today nearly 7 percent of Gross NPAs are locked up in 'hard-core'doubtful and loss assets, accumulated over the years.
The problem India Faces is not lack of strict prudential norms but
1) legal impediments and time consuming nature of asset disposal proposal.2) Postponement of problem in order to show higher earnings.3) Manipulation of debtors using political influence.
A-Macro Perspective Behind NPAs:-
A lot of practical problems have been found in Indian banks, especially in public sector banks. For Example, the government of India had given a massive wavier of Rs. 15,000Crs. under the Prime Minister ship of Mr. V.P. Singh, for rural debt during 1989-90. Thiswas not a unique incident in India and left a negative impression on the payer of the loan.
Poverty elevation programs like IRDP, RREP, SUME, SEPUP, JRY, PMRY etc., failedon various grounds in meeting their objectives. The huge amount of loan granted under these schemes were totally unrecoverable by banks due to political manipulation, misuseof funds and non-reliability of target audience of these sections. Loans given by banks
are their assets and as the repayment of several of the loans were poor, the quality of these assets were steadily deteriorating. Credit allocation became 'Lon Melas', loan
proposal evaluations were slack and as a result repayment were very poor.
There are several reasons for an account becoming NPA.
1. Internal factors
2. External factors
Page | 5

8/8/2019 Data Analysis of NPAs in Different Sectors
http://slidepdf.com/reader/full/data-analysis-of-npas-in-different-sectors 6/37
1-Internal factors:
1) Funds borrowed for a particular purpose but not use for the said purpose.
2) Project not completed in time.3) Poor recovery of receivables.4) Excess capacities created on non-economic costs.5) In-ability of the corporate to raise capital through the issue of equity or other
debt instrument from capital markets.6) Business failures.7) Diversion of funds for expansion\modernization\setting up new projects\ helping
or promoting sister concerns.8) Willful defaults, siphoning of funds, fraud, disputes, management disputes, mis
appropriation etc.,9) Deficiencies on the part of the banks viz. in credit appraisal, monitoring and
follow-ups, delay in settlement of payments\ subsidiaries by government bodiesetc.,
2-External factors:
1) Sluggish legal system - Long legal tangles Changes that had taken place inlabour laws Lack of sincere effort.
2) Scarcity of raw material, power and other resources.3) Industrial recession.4) Shortage of raw material, raw material\input price escalation, power shortage,
industrial recession, excess capacity, natural calamities like floods, accidents.5) Failures, nonpayment\ over dues in other countries, recession in other countries,
externalization problems, adverse exchange rates etc. Government policies likeexcise duty changes, Import duty changes etc.,
B-Causes for Non-Performing Assets in Public Sector Banks
Granting of credit for economic activities is the prime duty of banking. Apart fromraising resources through fresh deposits, borrowings and recycling of funds received
back from borrowers constitute a major part of funding credit dispensation activity.Lending is generally encouraged because it has the effect of funds being transferred from
the system to productive purposes, which results into economic growth. However lending also carries a risk called credit risk, which arises from the failure of borrower. Non-recovery of loans along with interest forms a major hurdle in the process of creditcycle. Thus, these loan losses affect the banks profitability on a large scale. Thoughcomplete elimination of such losses is not possible, but banks can always aim to keep thelosses at a low level.
Non-performing Asset (NPA) has emerged since over a decade as an alarming threat tothe banking industry in our country sending distressing signals on the sustainability andendurability of the affected banks. The positive results of the chain of measures affectedunder banking reforms by the Government of India and RBI in terms of the two
Narasimhan Committee Reports in this contemporary period have been neutralized bythe ill effects of this surging threat. Despite various correctional steps administered to
Page | 6

8/8/2019 Data Analysis of NPAs in Different Sectors
http://slidepdf.com/reader/full/data-analysis-of-npas-in-different-sectors 7/37
solve and end this problem, concrete results are eluding. It is a sweeping and all pervasive virus confronted universally on banking and financial institutions. The severityof the problem is however acutely suffered by Nationalized Banks, followed by the SBIgroup, and the all India Financial Institutions.
{5}Reserve Bank Guidelines on purchase / sale of Non
Performing Financial Assets
A-Scope:-
1) These guidelines would be applicable to banks, FIs and NBFCs purchasing/selling non performing financial assets, from/ to other banks/FIs/NBFCs(excluding securitization companies/ reconstruction companies).
2) A financial asset, including assets under multiple/consortium bankingarrangements, would be eligible for purchase/sale in terms of these guidelines if itis a non-performing asset/non performing investment in the books of the selling
bank.3) The reference to 'bank' in the guidelines would include financial institutions and
NBFCs.
B-Structure:-
4) The guidelines to be followed by banks purchasing/ selling non-performingfinancial assets from / to other banks are given below. The guidelines have been
grouped under the following headings:
i. Procedure for purchase/ sale of non performing financial assets by banks,including valuation and pricing aspects.
ii. Prudential norms, in the following areas, for banks for purchase/ sale of non performing financial assets:
a. Asset classification norms b. Provisioning normsc. Accounting of recoveriesd. Capital adequacy normse. Exposure norm
iii.Disclosure requirements
Page | 7

8/8/2019 Data Analysis of NPAs in Different Sectors
http://slidepdf.com/reader/full/data-analysis-of-npas-in-different-sectors 8/37
5) Procedure for purchase/ sale of non performing financial assets, includingvaluation and pricing aspects
i. A bank which is purchasing/ selling non-performing financial assets shouldensure that the purchase/ sale is conducted in accordance with a policy approved
by the Board. The Board shall lay down policies and guidelines covering, inter alia,
a. Non performing financial assets that may be purchased/ sold;b. Norms and procedure for purchase/ sale of such financial assets;c. Valuation procedure to be followed to ensure that the economic value of
financial assets is reasonably estimated based on the estimated cash flowsarising out of repayments and recovery prospects;
d. Delegation of powers of various functionaries for taking decision on the purchase/ sale of the financial assets; etc.
e. Accounting policy
ii. While laying down the policy, the Board shall satisfy itself that the bank hasadequate skills to purchase non performing financial assets and deal with them inan efficient manner which will result in value addition to the bank. The Boardshould also ensure that appropriate systems and procedures are in place toeffectively address the risks that a purchasing bank would assume while engagingin this activity.
iii) The estimated cash flows are normally expected to be realised within a periodof three years and not less than 5% of the estimated cash flows should be realizedin each half year.
iv) A bank may purchase/sell non-performing financial assets from/to other banksonly on 'without recourse' basis, i.e., the entire credit risk associated with the non-
performing financial assets should be transferred to the purchasing bank. Selling bank shall ensure that the effect of the sale of the financial assets should be suchthat the asset is taken off the books of the bank and after the sale there should not
be any known liability devolving on the selling bank.
v) Banks should ensure that subsequent to sale of the non performing financialassets to other banks, they do not have any involvement with reference to assets
sold and do not assume operational, legal or any other type of risks relating to thefinancial assets sold. Consequently, the specific financial asset should not enjoy thesupport of credit enhancements / liquidity facilities in any form or manner.
vi) Each bank will make its own assessment of the value offered by the purchasing bank for the financial asset and decide whether to accept or reject the offer.
vii) Under no circumstances can a sale to other banks be made at a contingent pricewhereby in the event of shortfall in the realization by the purchasing banks, theselling banks would have to bear a part of the shortfall.
Page | 8

8/8/2019 Data Analysis of NPAs in Different Sectors
http://slidepdf.com/reader/full/data-analysis-of-npas-in-different-sectors 9/37
viii) A non-performing asset in the books of a bank shall be eligible for sale toother banks only if it has remained a non-performing asset for at least two years inthe books of the selling bank.
ix) Banks shall sell non-performing financial assets to other banks only on cash
basis. The entire sale consideration should be received upfront and the asset can betaken out of the books of the selling bank only on receipt of the entire saleconsideration.
x) A non-performing financial asset should be held by the purchasing bank in its books at least for a period of 15 months before it is sold to other banks. Banksshould not sell such assets back to the bank, which had sold the NPFA.
(xi) Banks are also permitted to sell/buy homogeneous pool within retail non- performing financial assets, on a portfolio basis provided each of the non- performing financial assets of the pool has remained as non-performing financial
asset for at least 2 years in the books of the selling bank. The pool of assets would be treated as a single asset in the books of the purchasing bank.
xii) The selling bank shall pursue the staff accountability aspects as per the existinginstructions in respect of the non-performing assets sold to other banks.
6) Prudential norms for banks for the purchase/ sale transactions
(A) Asset classification norms
(i). The non-performing financial asset purchased, may be classified as 'standard'in the books of the purchasing bank for a period of 90 days from the date of
purchase. Thereafter, the asset classification status of the financial asset purchased, shall be determined by the record of recovery in the books of the purchasing bank with reference to cash flows estimated while purchasing theasset which should be in compliance with requirements in Para 5 (iii).
(ii). The asset classification status of an existing exposure (other than purchasedfinancial asset) to the same obligor in the books of the purchasing bank will
continue to be governed by the record of recovery of that exposure and hencemay be different.
(iii) Where the purchase/sale does not satisfy any of the prudential requirements prescribed in these guidelines the asset classification status of the financial assetin the books of the purchasing bank at the time of purchase shall be the same asin the books of the selling bank. Thereafter, the asset classification status willcontinue to be determined with reference to the date of NPA in the selling bank.
(iv) Any restructure/reschedule/rephrase of the repayment schedule or theestimated cash flow of the non-performing financial asset by the purchasing bank
shall render the account as a non-performing asset.
Page | 9

8/8/2019 Data Analysis of NPAs in Different Sectors
http://slidepdf.com/reader/full/data-analysis-of-npas-in-different-sectors 10/37
(B) Provisioning norms
I - Books of selling bank
i. When a bank sells its non-performing financial assets to other banks, the samewill be removed from its books on transfer.
ii. If the sale is at a price below the net book value (NBV) (i.e., book value less provisions held), the shortfall should be debited to the profit and loss account of that year.
iii. If the sale is for a value higher than the NBV, the excess provision shall not bereversed but will be utilised to meet the shortfall/ loss on account of sale of other non performing financial assets.
II- Books of purchasing bank
The asset shall attract provisioning requirement appropriate to its assetclassification status in the books of the purchasing bank.
(C) Accounting of recoveries
Any recovery in respect of a non-performing asset purchased from other banksshould first be adjusted against its acquisition cost. Recoveries in excess of the
acquisition cost can be recognized as profit.
(D) Capital Adequacy
For the purpose of capital adequacy, banks should assign 100% risk weights tothe non-performing financial assets purchased from other banks. In case the non-
performing asset purchased is an investment, then it would attract capital charge
for market risks also. For NBFCs the relevant instructions on capital adequacywould be applicable.
Page | 10

8/8/2019 Data Analysis of NPAs in Different Sectors
http://slidepdf.com/reader/full/data-analysis-of-npas-in-different-sectors 11/37

8/8/2019 Data Analysis of NPAs in Different Sectors
http://slidepdf.com/reader/full/data-analysis-of-npas-in-different-sectors 12/37
{6}Measures taken to deal with NPAs
Page | 12

8/8/2019 Data Analysis of NPAs in Different Sectors
http://slidepdf.com/reader/full/data-analysis-of-npas-in-different-sectors 13/37
{7}
Comparison with Asian Economies
Page | 13

8/8/2019 Data Analysis of NPAs in Different Sectors
http://slidepdf.com/reader/full/data-analysis-of-npas-in-different-sectors 14/37
{8}Solutions for NPAs
1-Don’t Eliminate – Manage! :-
Page | 14

8/8/2019 Data Analysis of NPAs in Different Sectors
http://slidepdf.com/reader/full/data-analysis-of-npas-in-different-sectors 15/37
Studies have shown that management of NPAs rather than elimination is prudent. India’sgrowth rate and bank spreads are higher than western nations. As a result we can supporta non-zero level of NPAs which balances the risk vis-à-vis return appropriate to theIndian context.
2-Effectiveness of ARCs:-
Concerns have been raised about their relevance to India. A significant percentage of the NPAs of the PSB’s are in the priority sector. Loans in rural areas are difficult to collectand banks by virtue of their sheer reach are better placed to recover these loans18. Lok Adalats and Debt Recovery Tribunals are other effective mechanism to handle this task.ARCs should focus on the larger borrowers. Further, there is a need for private sector and foreign participation in the ARC. Private parties will look to active resolution of the
problem and not merely regard it as a book transaction. Moving NPAs to an ARC doesn'tget rid of the problem. In China, potential investors are still worried about the risks of non enforcement of ownership rights of the assets they purchase from the ARCs. Actions
and measures have to be taken to build investor confidence.
3-Well Developed Capital Markets:-
Numerous papers have stressed the criticality of a well developed capital market in therestructuring process19. A capital market brings liquidity and a mechanism for write off of loans. Without this a bank may seek to postpone the NPA problem for fear of capitaladequacy problems and resort to tactics like evergreening. Monitoring by bondholders is
better as they have no motive to sustain uneconomic activity. Further, the banks canmanage credit risk better as it is easier to sell or securitize loans and negotiate creditderivatives.20 India debt market is relatively under developed and attention should befocused on building liquidity and volumes.
4-Contextual Decision making:-
Regulations must incorporate a contextual perspective (like temporary cash flow problems) and clients should be handled in a manner which reflects true value of their assets and future potential to pay. The top management should delegate authority and
back decisions of this kind taken by middle level managers.
5-Securitization;-
This has been used extensively in China, Japan and Korea and has attracted international participants due to lower liquidity risks. The Resolution Trust Corporation has helpeddevelop the securitization market in Asia and has taken over around $ 460 billion as badassets from over 750 failed banks. Its highly standardized product appeals to a broadinvestor base. Securitisation in India is still in a nascent stage but has potential in areaslike mortgage backed securitisation. ICRA estimates the current market size to be aroundRs 3000 Crores.
6-Effects of Capital Norm tightening:-
There is a fear that disposal through the provision of excessive reserves may result in adeflationary spiral. A thorough provision of reserves will have no negative impact on the
Page | 15

8/8/2019 Data Analysis of NPAs in Different Sectors
http://slidepdf.com/reader/full/data-analysis-of-npas-in-different-sectors 16/37
longterm dividends paid to shareholders22. Firstly, it helps restore credibility in thefinancial system. Further, an adjustment mechanism can be created by which the capitalgains and future profits that will result from the disposal of NPAs will pass back to thecreditors and taxpayers who incurred the losses today. The swift disposal of NPAsduring the Great Depression in the middle of a severe deflationary current helped restore
the credibility of the financial system.
7-Realignment of Performance metrics:-
Traditional performance measures like ROE and NPA Ratio are not really indicative of performance - A high volume of bad lending today will impact positively on ROE, assetgrowth and NPA Ratio and only show up 5 years later as NPAs. The complexity of the
balance sheet makes it impossible to disaggregate the impact of these actions even if stricter disclosure norms are put in place. Economic Value of Equity (EVE) (or marketvalue) and Economic Value of Equity at Risk (EVER) are useful mechanisms to handlethis problem. EVE is the value of the firm if its assets are instantaneously liquidated
(assuming the availability of liquid markets). Book Value vis-à-vis EVE comparisonsgive an idea of whether the ‘fair’ value is being reflected. EVER can be computed byusing ‘what if’ scenarios like downgrading the ratings of assets or changing interestrates. Now, at every stage banks can check if their actions are consistent with the goal of maximizing EVE, subject to an acceptable level of EVER.
8-Consistency of purpose!:-
Nachiket Mor has argued that the current organizational competencies, regulatoryframework, quality of disclosure and incentive structure produce an inconsistentframework, which leads to an unsustainable performance level for a Bank. Micro levelissues will have to be addressed in order to root out the problem. Processes at every stageof an assets life impact the overall quality of the intermediation process and so aconsistent set of procedures are necessary to handle the problem.
9-Legal Issues:-
There have been instances of banks extending credit to doubtful debtors (who willfullydefault on debt) and getting kickbacks for the same. Ineffective Legal mechanisms andinadequate internal control mechanisms have made this problem grow – quick action hasto be taken on both counts so that both the defaulters and the authorizing officer are
punished heavily. Without this, all the mechanisms suggested above may prove to beineffective.
{9}
Data Analysis of NPAs in Different Sectors
1-Sector-wise NPAs – Bank Group-wise:-
Page | 16

8/8/2019 Data Analysis of NPAs in Different Sectors
http://slidepdf.com/reader/full/data-analysis-of-npas-in-different-sectors 17/37
2- Financial Performance of Regional Rural Banks:-
3-Gross Non-Performing Assets of Urban Cooperative Banks:-
Page | 17

8/8/2019 Data Analysis of NPAs in Different Sectors
http://slidepdf.com/reader/full/data-analysis-of-npas-in-different-sectors 18/37
4-Gross and Net NPAs Ratio of Urban Commercial Bank:-
5-Financial Assessment of the UCB Sector by the CFSA;-
Page | 18

8/8/2019 Data Analysis of NPAs in Different Sectors
http://slidepdf.com/reader/full/data-analysis-of-npas-in-different-sectors 19/37
The Committee on Financial Sector Assessment (CFSA) undertook a comprehensiveself-assessment of the Indian financial system. Among other sectors, the CFSA assessedthe financial health of the UCB sector. Apart from discussing some of the major concerns related to the UCBs sector, such as duality of control and high levels of NPAs,the Committee also carried out stress tests on this sector, which highlighted the weak
financial health of this sector. On account of data limitations, the stress tests were carriedout on 52 scheduled UCBs accounting for 43 percent of the total assets at end-March2007 of all scheduled UCBs. The tests were restricted to the credit portfolio of these
banks. The credit portfolios of the UCBs were given shocks in the form of an increase inthe provisioning requirement and an increase of 25 per cent and 50 per cent in the non-
performing assets. The tests revealed that as at end-March 2007, 27 banks (accountingfor 38 per cent of scheduled UCBs’ assets) would not have been able to comply with the9 per cent CRAR norm with an increase in NPA levels by 25 percent. At the systemlevel, the CRAR declined from 11.4 per cent to 5.6 per cent at 25 per cent stress in
NPAS. Further, with an increase in NPA levels by 50 per cent, the number of banks thatwould not have been able to comply with the stipulated minimum increased to 31.
Moreover, at the system level, the CRAR dipped sharply to 2.8 per cent (Chart below).
\
6-Movements in Non-performing Assets - Bank Group-wise
Page | 19

8/8/2019 Data Analysis of NPAs in Different Sectors
http://slidepdf.com/reader/full/data-analysis-of-npas-in-different-sectors 20/37
7-Movement in CRAR and NPAs of Scheduled Commercial Banks:-
8-NPAs Recovered by SCBs through Various Channels:-
Page | 20

8/8/2019 Data Analysis of NPAs in Different Sectors
http://slidepdf.com/reader/full/data-analysis-of-npas-in-different-sectors 21/37
9-Movements in Provisions for Non-performing Assets - Bank Group-
wise:-
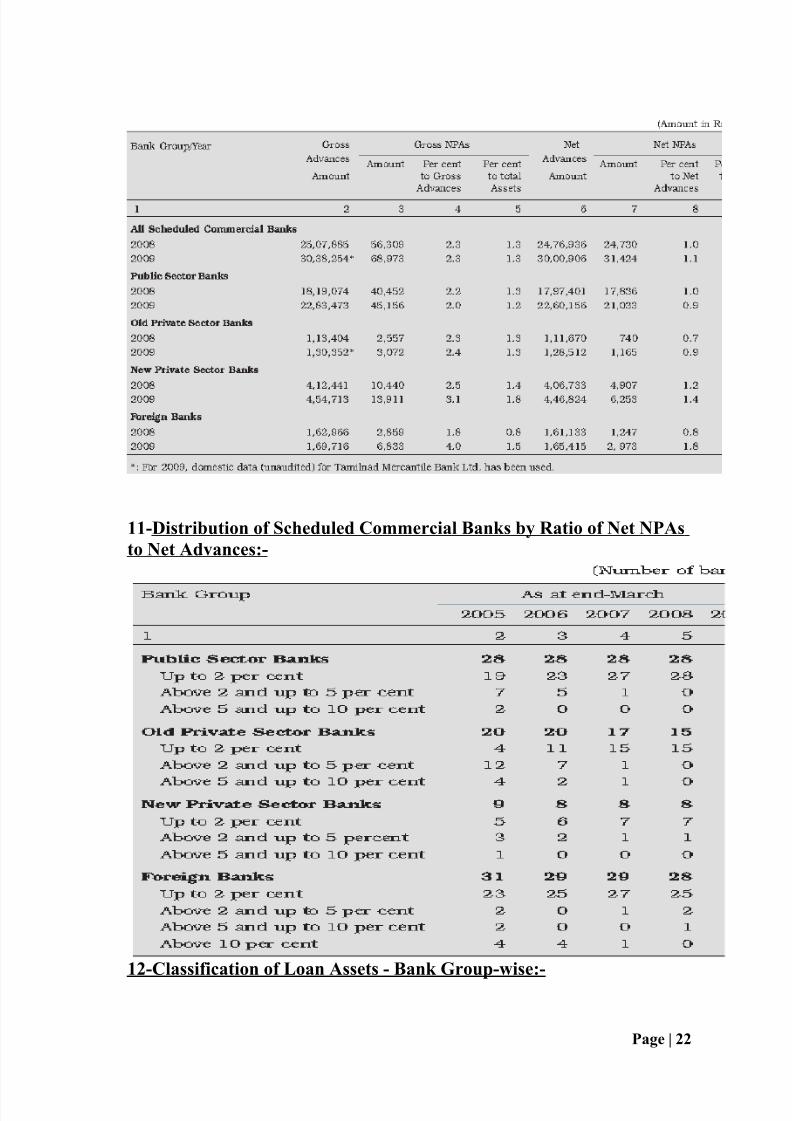
10-Gross and Net NPAs of Scheduled Commercial Banks – Bank Group-wise:-
Page | 21
8/8/2019 Data Analysis of NPAs in Different Sectors
http://slidepdf.com/reader/full/data-analysis-of-npas-in-different-sectors 22/37
11-Distribution of Scheduled Commercial Banks by Ratio of Net NPAs
to Net Advances:-
12-Classification of Loan Assets - Bank Group-wise:-
Page | 22

8/8/2019 Data Analysis of NPAs in Different Sectors
http://slidepdf.com/reader/full/data-analysis-of-npas-in-different-sectors 23/37
13-Sector-wise NPAs – Bank Group-wise:-
14-Financial Performance of Regional Rural Banks:-
Page | 23

8/8/2019 Data Analysis of NPAs in Different Sectors
http://slidepdf.com/reader/full/data-analysis-of-npas-in-different-sectors 24/37
15-Financial Performance of Non-Scheduled Urban Cooperative
Banks:-
16-Financial Performance of Scheduled Urban Cooperative Banks:-
Page | 24

8/8/2019 Data Analysis of NPAs in Different Sectors
http://slidepdf.com/reader/full/data-analysis-of-npas-in-different-sectors 25/37
17-Gross Non-Performing Assets of Urban Cooperative Banks:-
18-Financial Assessment of the UCB Sector by the CFSA:-
Page | 25

8/8/2019 Data Analysis of NPAs in Different Sectors
http://slidepdf.com/reader/full/data-analysis-of-npas-in-different-sectors 26/37
The Committee on Financial Sector Assessment (CFSA) undertook a comprehensiveself-assessment of the Indian financial system. Among other sectors, the CFSA assessedthe financial health of the UCB sector. Apart from discussing some of the major concerns related to the UCBs sector, such as duality of control and high levels of NPAs,
the Committee also carried out stress tests on this sector, which highlighted the weak financial health of this sector. On account of data limitations, the stress tests were carriedout on 52 scheduled UCBs accounting for 43 per cent of the total assets at end-March2007 of all scheduled UCBs. The tests were restricted to the credit portfolio of these
banks. The credit portfolios of the UCBs were given shocks in the form of an increase inthe provisioning requirement and an increase of 25 per cent and 50 per cent in the non-
performing assets. The tests revealed that as at end-March 2007, 27 banks (accountingfor 38 per cent of scheduled UCBs’ assets) would not have been able to comply with the9 per cent CRAR norm with an increase in NPA levels by 25 per cent. At the systemlevel, the CRAR declined from 11.4 per cent to 5.6 per cent at 25 per cent stress in
NPAS. Further, with an increase in NPA levels by 50 per cent, the number of banks that
would not have been able to comply with the stipulated minimum increased to 31.Moreover, at the system level, the CRAR dipped sharply to 2.8 per cent (Chart below).
19-Financial Performance of State Cooperative Banks:-
Page | 26

8/8/2019 Data Analysis of NPAs in Different Sectors
http://slidepdf.com/reader/full/data-analysis-of-npas-in-different-sectors 27/37
20-Asset Quality of State Cooperative Banks;-
21-Recent Trends in Asset Quality of StCBs and DCCBs:-
Page | 27

8/8/2019 Data Analysis of NPAs in Different Sectors
http://slidepdf.com/reader/full/data-analysis-of-npas-in-different-sectors 28/37
The application of prudential regulations in 1996-97 for StCBs and DCCBs introducedthe norms for income recognition, asset classification and provisioning. In a study,Sharma et al (2001) attempted to analyze the trends in asset quality of StCBs taking datafor two years (1996- 97 and 1997-98) after the prudential regulations were made
applicable to these institutions. During the short span of two years, they found asubstantial increase in absolute terms in NPA levels for StCBs and DCCBs. Taking thesame exercise forward for the years after 2000-01, it can be seen that there was a risingtrend in the NPA ratio for StCBs till 2002-03. Thereafter, there was a falling trend in thisratio (Table 1). The ratio has continued to be significantly higher than the correspondingratio for Scheduled Commercial Banks (SCBs). The amount of NPAs has grown at a
positive rate between 2000-01 and 2007-08, which has been lower than the rate of growth of total loans outstanding of these institutions over the corresponding period.However, there has been particularly high growth in assets classified as loss makingassets of StCBs over this period. The NPA ratio for DCCBs has shown a by and largeincreasing trend between 2000-01 and 2007-08 . The rate of growth of NPAs has been
relatively higher than the growth in total advances of DCCBs over this period. Thegrowth in ‘loss’ assets have also been comparatively higher than the other two assetcategories for DCCBs. In other words, there has been a considerable deterioration in theasset quality of DCCBs as compared to StCBs in the recent period.
A-Asset Quality of State Cooperative bank;-
B-Asset Quality of DCCBs (District Central Cooperative Banks):-
22-Percent Distribution of NPAs of State cooperative bank:-
Page | 28

8/8/2019 Data Analysis of NPAs in Different Sectors
http://slidepdf.com/reader/full/data-analysis-of-npas-in-different-sectors 29/37
23-Percent Distribution of NPAs of District Central Cooperative
Banks:-
Page | 29

8/8/2019 Data Analysis of NPAs in Different Sectors
http://slidepdf.com/reader/full/data-analysis-of-npas-in-different-sectors 30/37
24-Financial Performance of State Cooperative Agriculture and Rural
Development Banks:-
25-Asset Quality of State Cooperative Agriculture and Rural
Development Banks:-
Page | 30

8/8/2019 Data Analysis of NPAs in Different Sectors
http://slidepdf.com/reader/full/data-analysis-of-npas-in-different-sectors 31/37
26-Net NPA of Non-Banking Financial Companies:-
27-Asset Classification of Financial Institutions:-
Page | 31

8/8/2019 Data Analysis of NPAs in Different Sectors
http://slidepdf.com/reader/full/data-analysis-of-npas-in-different-sectors 32/37
28-Assets of NBFCs-D by Activity:-
29-Financial Performance of NBFCs-D:-
Page | 32

8/8/2019 Data Analysis of NPAs in Different Sectors
http://slidepdf.com/reader/full/data-analysis-of-npas-in-different-sectors 33/37
30-Financial Performance of NBFCs:-
31-NPA Ratios of NBFCs-D:-
Page | 33

8/8/2019 Data Analysis of NPAs in Different Sectors
http://slidepdf.com/reader/full/data-analysis-of-npas-in-different-sectors 34/37
32-NPAs of NBFCs-D by Classification of NBFCs:-
Page | 34

8/8/2019 Data Analysis of NPAs in Different Sectors
http://slidepdf.com/reader/full/data-analysis-of-npas-in-different-sectors 35/37
33-Stress Testing by CFSA, 2009:-
As is well-known, the resilience of the financial system can be tested by subjecting thesystem to stress scenarios. Such tests are generally carried out with reference to a suddenshock and its instantaneous impact; in practice, when such shocks take place, banks get
time to adapt and mitigate the impact. The CFSA, 2009 carried out single-factor stresstests for the commercial banking sector covering credit risk, market/interest rate risk andliquidity risk. They have revealed that the banking system can withstand significantshocks arising from large potential changes in credit quality, interest rate and liquidityconditions. These stress tests for credit, market and liquidity risk show that Indian banksare generally resilient.
Credit risk: Stress testing for credit risk was carried out by increasing both the NPA levels and provisioning requirements for standard, substandard and doubtfulassets. The analysis was carried out both at the aggregate level and individual
bank level for end-March 2008 under three scenarios. Given the recent globalfinancial developments and their likely impact on the Indian economy, the stresstests were further conducted for the end of September 2008. It may be noted thateven under the worst case scenario, CRAR remained comfortably above theregulatory minimum (Table 1). Although credit risk was assessed as low,continuous monitoring is required to avoid any unforeseen and significant assetquality deterioration over the medium term.
To test the banking system’s resilience to market risk, interest rate risk stress testswere undertaken using both earnings at risk (EaR), as also the economic value
perspective. In the EaR perspective, the focus of analysis is the impact of changes
in interest rates on accrual or reported earnings. Applying the EaR approach, itwas observed in March 2008 that for an increase in interest rates the net interestincome (NII) increases for 45 banks, comprising 64 per cent of the bankingassets. This is because, typically, the banks’ balance sheets are asset
sensitive, and an increase in interest rate raises the interest income relative tointerest expenses.
The banks have been actively managing their interest rate risk by reducing theduration of their portfolios. The duration of equity reduced from 14 years inMarch 2006 to around 8 years in March 2008 – a pointer to better interest raterisk management. Taking the impact based on the yield volatility estimated at 244
basis points (bps) for a one-year holding period showed, ceteris paribus, erosionof 19.5 per cent of capital and reserves. The CRAR would reduce from 13.0 per cent to 10.9 per cent for a 244 bps shock. The CRAR of 29 banks that account for 36 per cent of total assets would fall below the regulatory CRAR of 9 per cent.
These results remained broadly robust for different plausible stress scenarios andassumptions. Carrying out similar tests using the September data also had notshown any added vulnerability to the banking system.
Page | 35

8/8/2019 Data Analysis of NPAs in Different Sectors
http://slidepdf.com/reader/full/data-analysis-of-npas-in-different-sectors 36/37
{10}Conclusion
The study stresses the importance of a sound understanding of the macroeconomic
variables and systemic issues pertaining to banks and the economy for solving the NPA problem along with the criticality of a strong legal framework and legislative framework.Foreign experiences must be utilized along with a clear understanding of the localconditions to create a tailor made solution which is transparent and fair to allstakeholders.
Notwithstanding critical financial sector rescue programme, which has its relativesuccess as well as distortionary effects, the outlook on future global banking remainsdifficult being devoid of major structural growth drivers. Despite not being part of thefinancial sector problem, India has been affected by the crisis through the feedback loops
between external shocks and domestic vulnerabilities by way of the financial, real and
confidence channels. Impact on Indian banking, however, has been rather muted providing a relatively bright outlook way ahead if Indian banking can reap the structuraldrivers from within.
Page | 36

8/8/2019 Data Analysis of NPAs in Different Sectors
http://slidepdf.com/reader/full/data-analysis-of-npas-in-different-sectors 37/37
{12}Bibliography
www.rbi.org.in
www.wikipedia.com