data analysis with weka - merimeri.edu.in/meri/wp-content/uploads/2017/01/mooc-on-weka.pdf · data...
TRANSCRIPT

DATA ANALYSIS
WITH WEKA
Author:
Nagamani Mutteni
Asst.Professor
MERI

Topic: Data Analysis with Weka
Course Duration: 2 Months
Objective:
Everybody talks about Data Mining and Big Data nowadays. Weka is a
powerful, yet easy to use tool for machine learning and data mining. This course
provides a deeper account of data mining tools and techniques. The emphasis is
on principles and practical data mining using Weka, rather than mathematical
theory or advanced details of particular algorithms. Students will work with
multimillion-instance datasets, classify text, experiment with clustering,
association rules, etc.
Assessment criteria: After completion of program students are awarded
certificate after clearing a MCQ based examination.

TABLE OF CONTENTS
1. INTRODUCTION
1.1 Weka Introduction
1.2 KDD Process
1.3 Installation of Weka
2. LAUNCHING WEKA EXPLORER
2.1 Starting with Weka
2.2 Pre-processing
2.3 Loading the Data
2.4 Setting Filters
3. CLASSIFIER
3.1 Building classifiers
3.2 Setting Test Options
4. CLUSTERING
4.1 Clustering Data
4.2 Choosing Clustering Scheme
4.3 Setting Test Options
4.4 Visualization of Results
5. ASSOCIATIONS
5.1 Finding Associations
5.2 Setting Test Options
6. ATTRIBUTE SELECTION
6.1 Introduction
6.2 Selecting Options
7. DATA VISUALIZATION
7.1 Introduction

7.2 Changing the view
7.3 Selecting instances
8. CONCLUSION
9. REFERENCES

CHAPTER 1: INTRODUCTION TO WEKA
1.1 Introduction:
What is WEKA?
WEKA, formally called Waikato Environment for Knowledge Learning, is a computer
program that was developed at the University of Waikato in New Zealand for the purpose of
identifying information from raw data gathered from different domains.
WEKA supports many different standard data mining tasks such as data pre-processing,
classification, clustering, regression, visualization and feature selection. The basic premise of
the application is to utilize a computer application that can be trained to perform machine
learning capabilities and derive useful information in the form of trends and patterns.
WEKA is an open source application that is freely available under the GNU general public
license agreement. Originally written in C the WEKA application has been completely
rewritten in Java and is compatible with almost every computing platform. It is user friendly
with a graphical interface that allows for quick set up and operation.
WEKA operates on the predication that the user data is available as a flat file or relation, this
means that each data object is described by a fixed number of attributes that usually are of a
specific type, normal alpha-numeric or numeric values. The WEKA application allows
novice users a tool to identify hidden information from database and file systems with simple
to use options and visual interfaces.
1.2 KDD Process:
1.3 Installation of Weka:
The weka can be explored from the different sites, one of the sites is
http://www.cs.waikato.ac.nz/m1/weka/downloading.html

There are different options to launch weka depending the operating systems
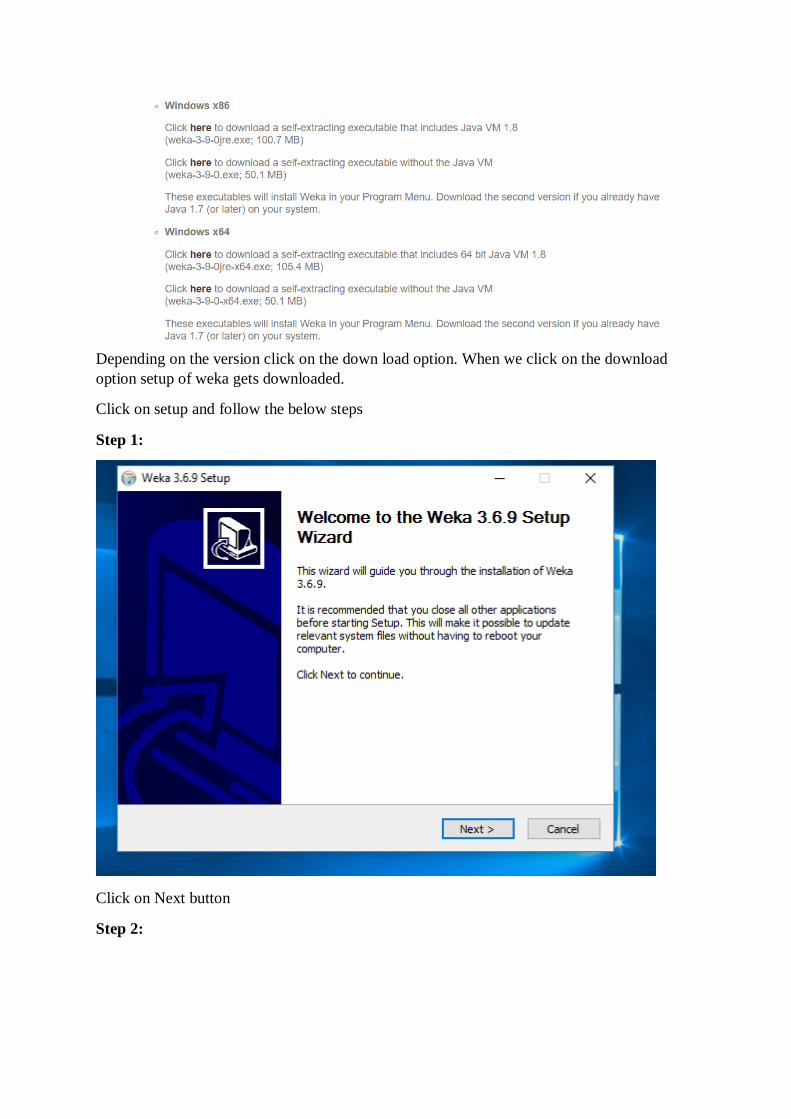
Depending on the version click on the down load option. When we click on the download
option setup of weka gets downloaded.
Click on setup and follow the below steps
Step 1:
Click on Next button
Step 2:

click on I Agree option
Step 3:

Click on Next Option
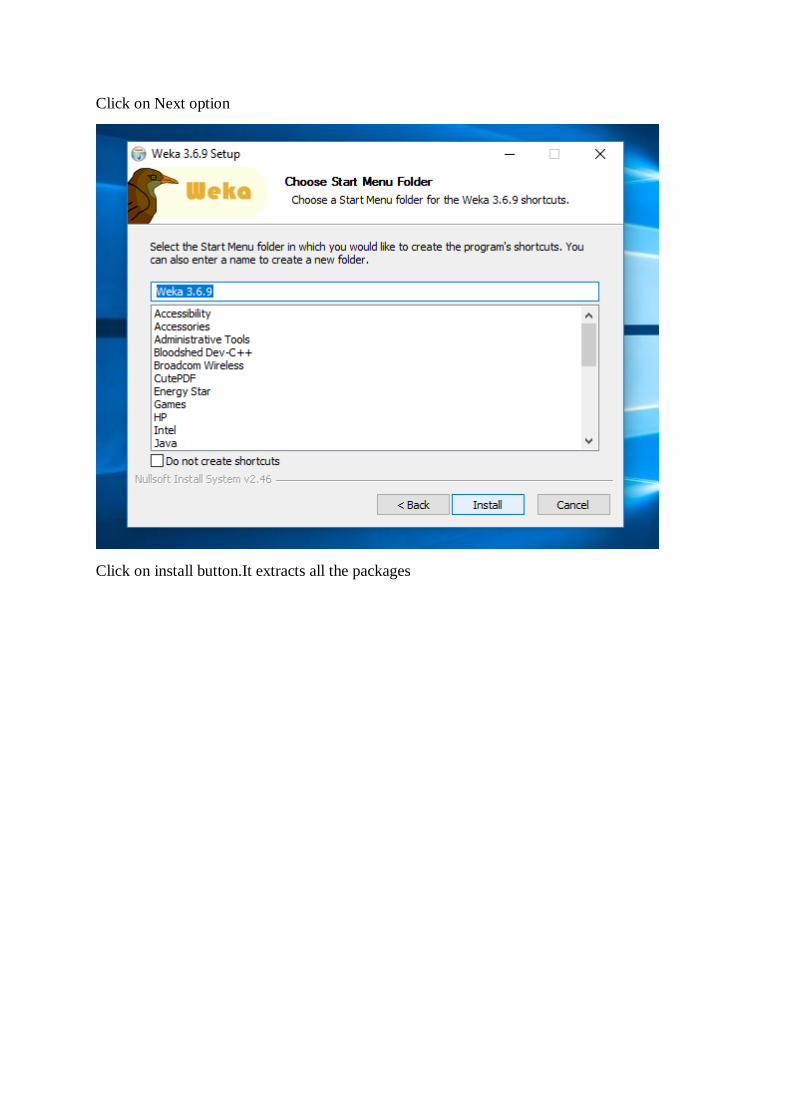
Click on Next option
Click on install button.It extracts all the packages

Click on next button
Click on finish button

CHAPTER 2: LAUNCHING WEKA EXPLORER
2.1 Starting with Weka
Once the program has been loaded on the user’s machine it is opened by navigating to the
programs start option and that will depend on the user’s operating system.
There are four options available on this initial screen.
1. Explorer- the graphical interface used to conduct experimentation on raw data
2. Simple CLI- provides users without a graphic interface option the ability to execute
commands from a terminal window.
3. Experimenter- this option allows users to conduct different experimental variations on
data sets and perform statistical manipulation
4. Knowledge Flow-basically the same functionality as Explorer with drag and drop
functionality. The advantage of this option is that it supports incremental learning from
previous results.
After selecting the Explorer option the program starts and provides the user with a separate
graphical interface.
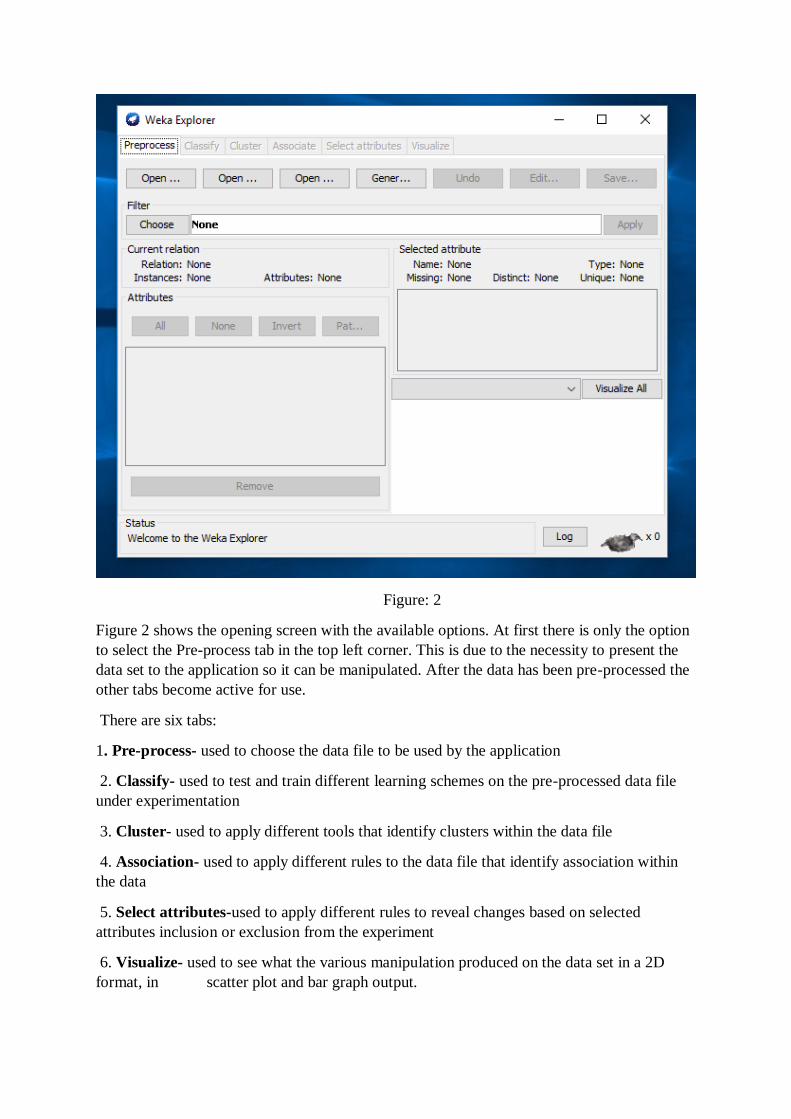
Figure: 2
Figure 2 shows the opening screen with the available options. At first there is only the option
to select the Pre-process tab in the top left corner. This is due to the necessity to present the
data set to the application so it can be manipulated. After the data has been pre-processed the
other tabs become active for use.
There are six tabs:
1. Pre-process- used to choose the data file to be used by the application
2. Classify- used to test and train different learning schemes on the pre-processed data file
under experimentation
3. Cluster- used to apply different tools that identify clusters within the data file
4. Association- used to apply different rules to the data file that identify association within
the data
5. Select attributes-used to apply different rules to reveal changes based on selected
attributes inclusion or exclusion from the experiment
6. Visualize- used to see what the various manipulation produced on the data set in a 2D
format, in scatter plot and bar graph output.

2.2 Pre-processing:
In order to experiment with the application the data set needs to be presented to WEKA in a
format that the program understands. There are rules for the type of data that WEKA will
accept. There are three options for presenting data into the program.
♦ Open File- allows for the user to select files residing on the local machine or recorded
medium.
♦ Open URL- provides a mechanism to locate a file or data source from a different location
specified by the user.
♦ Open Database- allows the user to retrieve files or data from a database source provided
by the user.
There are restrictions on the type of data that can be accepted into the program. Originally the
software was designed to import only ARFF files, other versions allow different file types
such as CSV, C4.5 and serialized instance formats. The extensions for these files include
.csv, .arff, .names, .bsi and .data.
At the bottom of the window there is ‘Status’ box. The ‘Status’ box displays messages that
keep you informed about what is going on. For example, when you first opened the
‘Explorer’, the message says, “Welcome to the Weka Explorer”. When you loading
“weather.arff” file, the ‘Status’ box displays the message “Reading from file…”. Once the
file is loaded, the message in the ‘Status’ box changes to say “OK”. Right-click anywhere in
‘Status box’, it brings up a menu with two options:
1. Available Memory that displays in the log and in ‘Status’ box the amount of memory
available to WEKA in bytes.

2. Run garbage collector that forces Java garbage collector to search for memory that is no
longer used, free this memory up and to allow this memory for new tasks.
To the right of ‘Status box’ there is a ‘Log’ button that opens up the log. The log records
every action in WEKA and keeps a record of what has happened. Each line of text in the log
contains time of entry. For example, if the file you tried to open is not loaded, the log will
have record of the problem that occurred during opening.
To the right of the ‘Log’ button there is an image of a bird. The bird is WEKA status icon.
The number next to ‘X’ symbol indicates a number of concurrently running processes. When
you loading a file, the bird sits down that means that there are no processes running. The
number of processes besides symbol ‘X’ is zero that means that the system is idle. Later, in
classification problem, when generating result look at the bird, it gets up and start moving
that indicates that a process started. The number next to ‘X’ becomes 1 that means that there
is one process running, in this case calculation.
2.3 Loading data:
The most common and easiest way of loading data into WEKA is from ARFF file, using
‘Open file…’ button . Click on ‘Open file…’ button and choose “project details ” file from
your local filesystem. Note, the data can be loaded from CSV file as well because some
databases have the ability to convert data only into CSV format.

Once the data is loaded, WEKA recognizes attributes that are shown in the ‘Attribute’
window. Left panel of ‘Preprocess’ window shows the list of recognized attributes:
No: is a number that identifies the order of the attribute as they are in data file.
Selection tick boxes: allow you to select the attributes for working relation.
Name: is a name of an attribute as it was declared in the data file.
The ‘Current relation’ box above ‘Attribute’ box displays the base relation (table) name and
the current working relation - “project details ”, the number of instances - 6 and the number
of attributes – 7.
During the scan of the data, WEKA computes some basic statistics on each attribute. The
following statistics are shown in ‘Selected attribute’ box on the right panel of ‘Preprocess’
window:
Name is the name of an attribute.
Type is most commonly Nominal or Numeric.
Missing is the number (percentage) of instances in the data for which this attribute is
unspecified.
Distinct is the number of different values that the data contains for this attribute.
Unique is the number (percentage) of instances in the data having a value for this attribute
that no other instances have.
Once the data is loaded into weka changes can be made to the attributes by clicking edit
button shown above.

To make the changes double click on the attribute value and update the details as user
required .
Different operations can be performed through edit are as follows:
1) delete the attribute
2) Replace the attribute value
3) Set all values
4) Set missing values etc.

After update of values the minimum ,maximum , mean and standard deviation values
gets changed.
Click on visualize all

Attribute selection:


2.4 Setting Filters
Pre-processing tools in WEKA are called “filters”. WEKA contains filters for
discretization, normalization, resampling, attribute selection, transformation and
combination of attributes .Some techniques, such as association rule mining, can only
be performed on categorical data. This requires performing discretization on numeric
or continuous attributes.
Using filters you can replace the discrete values to nominal values.

This will show pull-down menu with a list of available filters. Select Supervised Æ
Attribute Æ Discretize and click on ‘Apply’ button. The filter will convert Numeric
values into Nominal
When filter is chosen, the fields in the window changes to reflect available options.

As you can see, there is no change in the value Outlook. Select value Temperature,
look at the ‘Selected attribute’ box, the ‘Type’ field shows that the attribute type has
changed from Numeric to Nominal. The list has changed as well: instead of statistical
values there is count of instances.
CHAPTER 3: CLASSIFIERS
3.1 Building “Classifiers” :
Classifiers in WEKA are the models for predicting nominal or numeric quantities. The
learning schemes available in WEKA include decision trees and lists, instance-based
classifiers, support vector machines, multi-layer perceptrons, logistic regression, and bayes’
nets. “Meta”classifiers include bagging, boosting, stacking, error-correcting output codes,
and locally weighted learning.
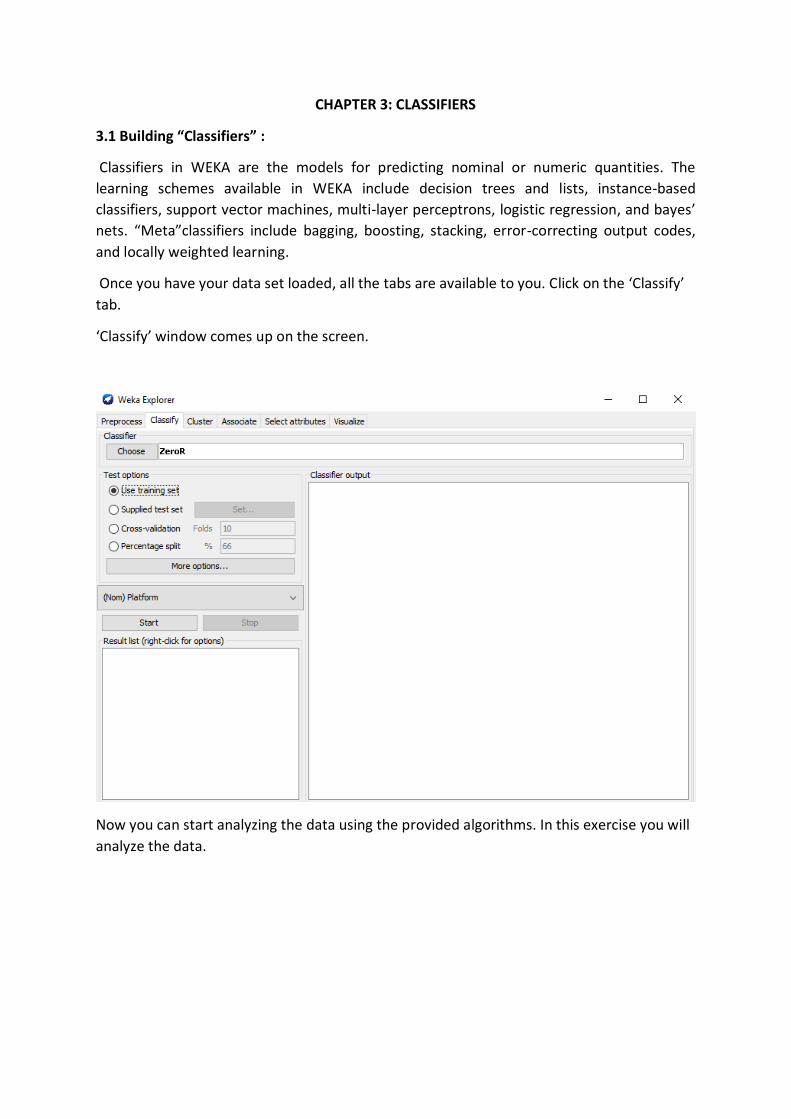
Once you have your data set loaded, all the tabs are available to you. Click on the ‘Classify’
tab.
‘Classify’ window comes up on the screen.
Now you can start analyzing the data using the provided algorithms. In this exercise you will
analyze the data.
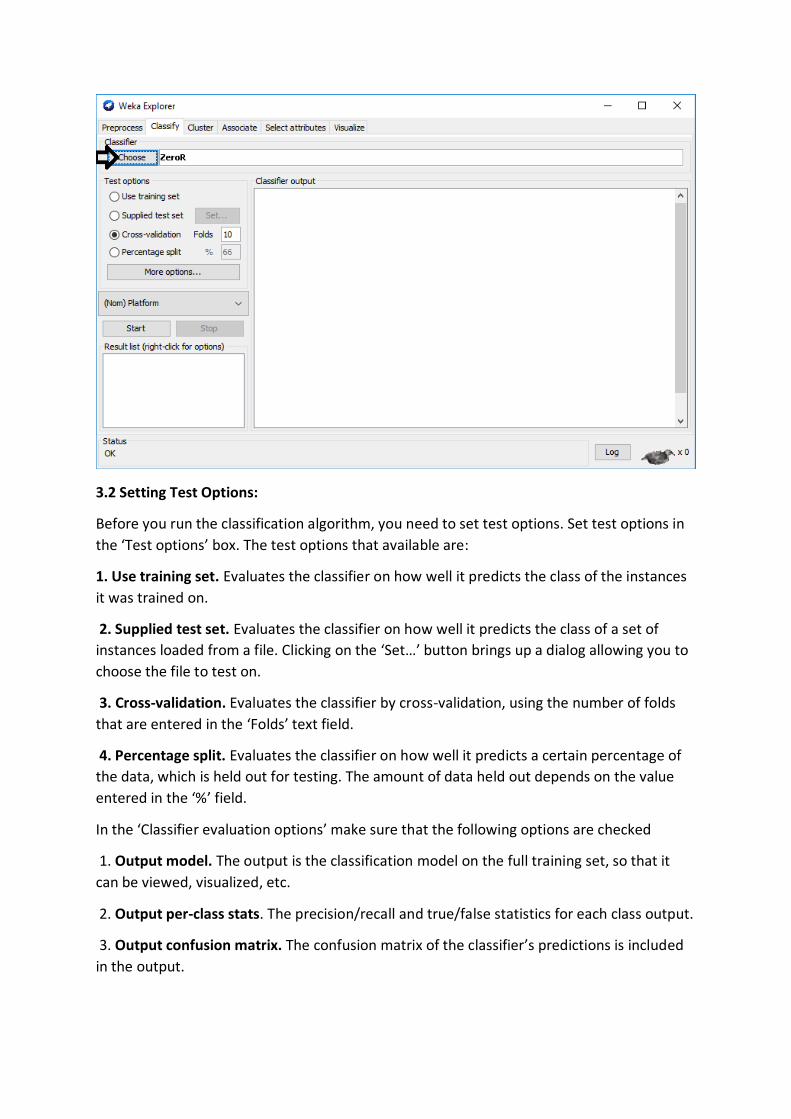
3.2 Setting Test Options:
Before you run the classification algorithm, you need to set test options. Set test options in
the ‘Test options’ box. The test options that available are:
1. Use training set. Evaluates the classifier on how well it predicts the class of the instances
it was trained on.
2. Supplied test set. Evaluates the classifier on how well it predicts the class of a set of
instances loaded from a file. Clicking on the ‘Set…’ button brings up a dialog allowing you to
choose the file to test on.
3. Cross-validation. Evaluates the classifier by cross-validation, using the number of folds
that are entered in the ‘Folds’ text field.
4. Percentage split. Evaluates the classifier on how well it predicts a certain percentage of
the data, which is held out for testing. The amount of data held out depends on the value
entered in the ‘%’ field.
In the ‘Classifier evaluation options’ make sure that the following options are checked
1. Output model. The output is the classification model on the full training set, so that it
can be viewed, visualized, etc.
2. Output per-class stats. The precision/recall and true/false statistics for each class output.
3. Output confusion matrix. The confusion matrix of the classifier’s predictions is included
in the output.

4. Store predictions for visualization. The classifier’s predictions are remembered so that
they can be visualized.
5. Set ‘Random seed for Xval / % Split’ to 1. This specifies the random seed used when
randomizing the data before it is divided up for evaluation purposes

Once the options have been specified, you can run the classification algorithm. Click on
‘Start’ button to start the learning process. You can stop learning process at any time by
clicking on ‘Stop’ button
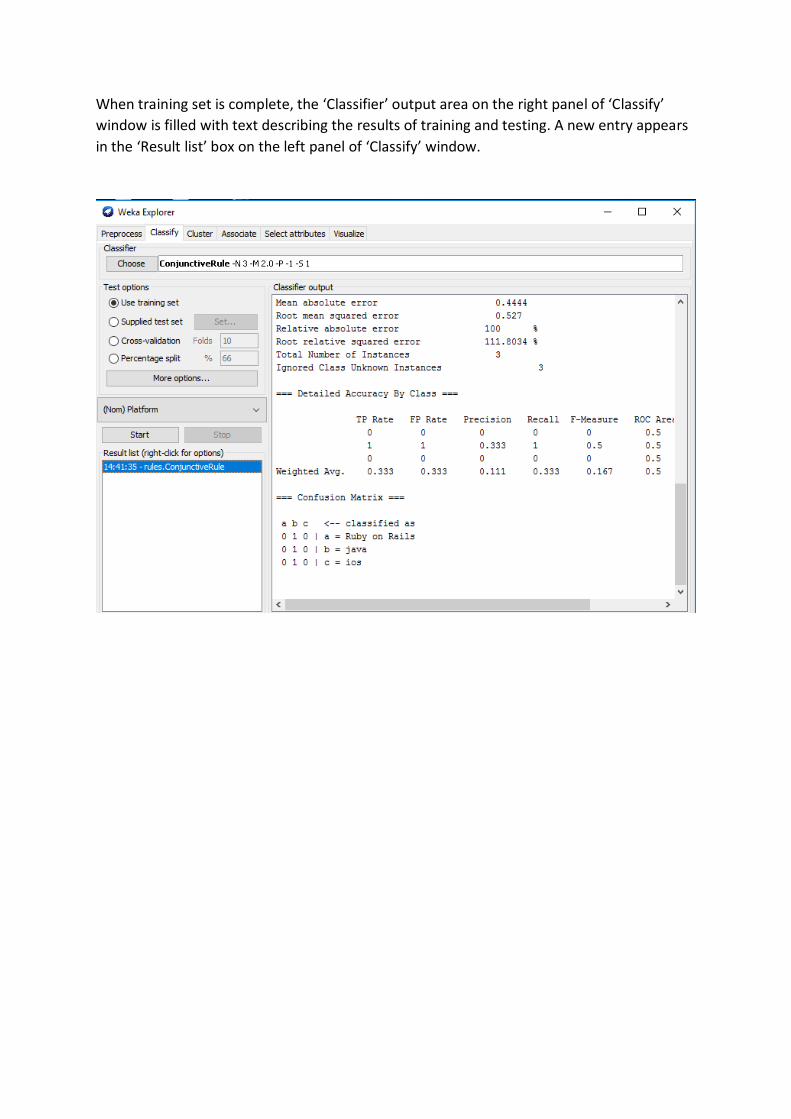
When training set is complete, the ‘Classifier’ output area on the right panel of ‘Classify’
window is filled with text describing the results of training and testing. A new entry appears
in the ‘Result list’ box on the left panel of ‘Classify’ window.


CHAPTER 4: CLUSTERING
4.1 Clustering Data:
WEKA contains “clusterers” for finding groups of similar instances in a dataset. The
clustering schemes available in WEKA are k-Means, EM, Cobweb, X-means, Farthest First.
Clusters can be visualized and compared to “true” clusters (if given). Evaluation is based on
log likelihood if clustering scheme produces a probability distribution.
An international online catalog company wishes to group its customers based on common
features. Company management does not have any predefined labels for these groups. Based
on the outcome of the grouping, they will target marketing and advertising campaigns to the
different groups. The information they have about the customers includes customer ID
,Customer Name , customer count,ProductSold, Sales Channel,Units Sold,Date Sold.
For our exercise we will use a part of the database for customers in US. Depending on the
type of products sold , not all attributes are important. For example, suppose the to know the
det
In ‘Preprocess’ window click on ‘Open file…’ button and select “customers.csv” file. Click
‘Cluster’ tab at the top of WEKA Explorer window.


4.2 Choosing Clustering Scheme:
In the ‘Clusterer’ box click on ‘Choose’ button. In pull-down menu select WEKA Æ
Clusterers, and select the cluster scheme ‘SimpleKMeans’. Some implementations of K-
means only allow numerical values for attributes; therefore, we do not need to use a filter.

Once the clustering algorithm is chosen, right-click on the algorithm,
“weak.gui.GenericObjectEditor” comes up to the screen. Set the value in “numClusters” box
to 5 (instead of default 2) because you have five clusters in your .arff file. Leave the value of
‘seed’ as is. The seed value is used in generating a random number, which is used for making
the initial assignment of instances to clusters. Note that, in general, K-means is quite sensitive
to how clusters are initially assigned. Thus, it is often necessary to try different values and
evaluate the results.

4.3 Setting Test Options:
Before you run the clustering algorithm, you need to choose ‘Cluster mode’. Click on
‘Classes to cluster evaluation’ radio-button in ‘Cluster mode’ box and select in the pull-down
box below.
Once the options have been specified, you can run the clustering algorithm. Click on the
‘Start’ button to execute the algorithm.


4.4 Visualization of Results
Another way of representation of results of clustering is through visualization. Right-click on
the entry in the ‘Result list’ and select ‘Visualize cluster assignments’ in the pull-down
window.
This brings up the ‘Weka Clusterer Visualize’ window.

On the ‘Weka Clusterer Visualize’ window, beneath the X-axis selector there is a dropdown
list, ‘Colour’, for choosing the color scheme. This allows you to choose the color of points
based on the attribute selected. Below the plot area, there is a legend that describes what
values the colors correspond to.

CHAPTER 5: ASSOCIATION
5.1 Finding Associations
WEKA contains an implementation of the Apriori algorithm for learning association rules.
This is the only currently available scheme for learning associations in WEKA. It works only
with discrete data and will identify statistical dependencies between groups of attributes.
Apriori can compute all rules that have a given minimum support and exceed a given
confidence.
For this exercise you will use sales data from the “sales-sample-data.csv” file.

5.2 Setting Test Options
Check the text field in the ‘Associator’ box at the top of the window. As you can see, there
are no other associators to choose and no extra options for testing the learning scheme
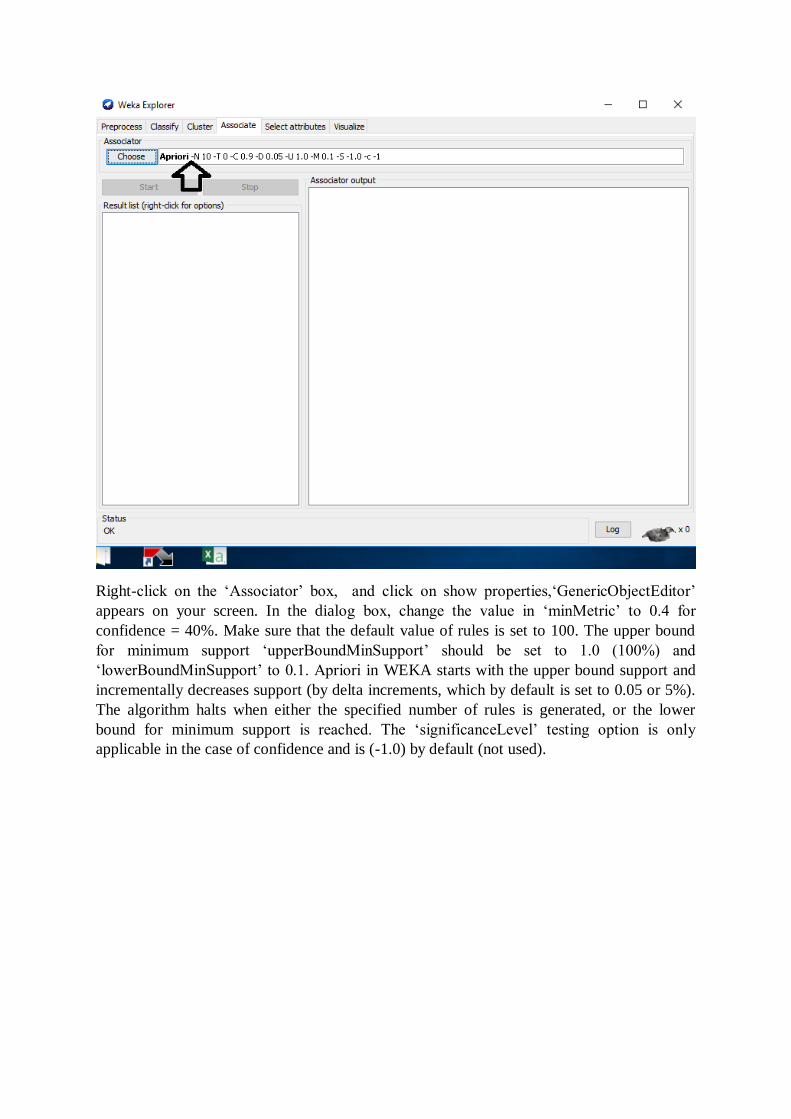
Right-click on the ‘Associator’ box, and click on show properties,‘GenericObjectEditor’
appears on your screen. In the dialog box, change the value in ‘minMetric’ to 0.4 for
confidence = 40%. Make sure that the default value of rules is set to 100. The upper bound
for minimum support ‘upperBoundMinSupport’ should be set to 1.0 (100%) and
‘lowerBoundMinSupport’ to 0.1. Apriori in WEKA starts with the upper bound support and
incrementally decreases support (by delta increments, which by default is set to 0.05 or 5%).
The algorithm halts when either the specified number of rules is generated, or the lower
bound for minimum support is reached. The ‘significanceLevel’ testing option is only
applicable in the case of confidence and is (-1.0) by default (not used).

Once the options have been specified, you can run Apriori algorithm. Click on the ‘Start’
button to execute the algorithm.


CHAPTER 6: ATTRIBUTE SELECTION
6.1 Introduction:
Attribute selection searches through all possible combinations of attributes in the data and
finds which subset of attributes works best for prediction. Attribute selection methods contain
two parts: a search method such as best-first, forward selection, random, exhaustive, genetic
algorithm, ranking, and an evaluation method such as correlation-based, wrapper, information
gain, chi-squared. Attribute selection mechanism is very flexible - WEKA allows (almost)
arbitrary combinations of the two methods.
To begin an attribute selection, click ‘Select attributes’ tab.
6.2 Selecting Options
To search through all possible combinations of attributes in the data and find which subset of
attributes works best for prediction, make sure that you set up attribute evaluator to
‘CfsSubsetEval’ and a search method to ‘BestFirst’. The evaluator will determine what
method to use to assign a worth to each subset of attributes. The search method will
determine what style of search to perform. The options that you can set for selection in the
‘Attribute Selection Mode’ box are :

1. Use full training set. The worth of the attribute subset is determined using the full set of
training data.
2. Cross-validation. The worth of the attribute subset is determined by a process of cross-
validation. The ‘Fold’ and ‘Seed’ fields set the number of folds to use and the random seed
used when shuffling the data.
Specify which attribute to treat as the class in the drop-down box below the test options.
Once all the test options are set, you can start the attribute selection process by clicking on
‘Start’ button.

CHAPTER 7: DATA VISUALIZATION
7.1 Introduction:
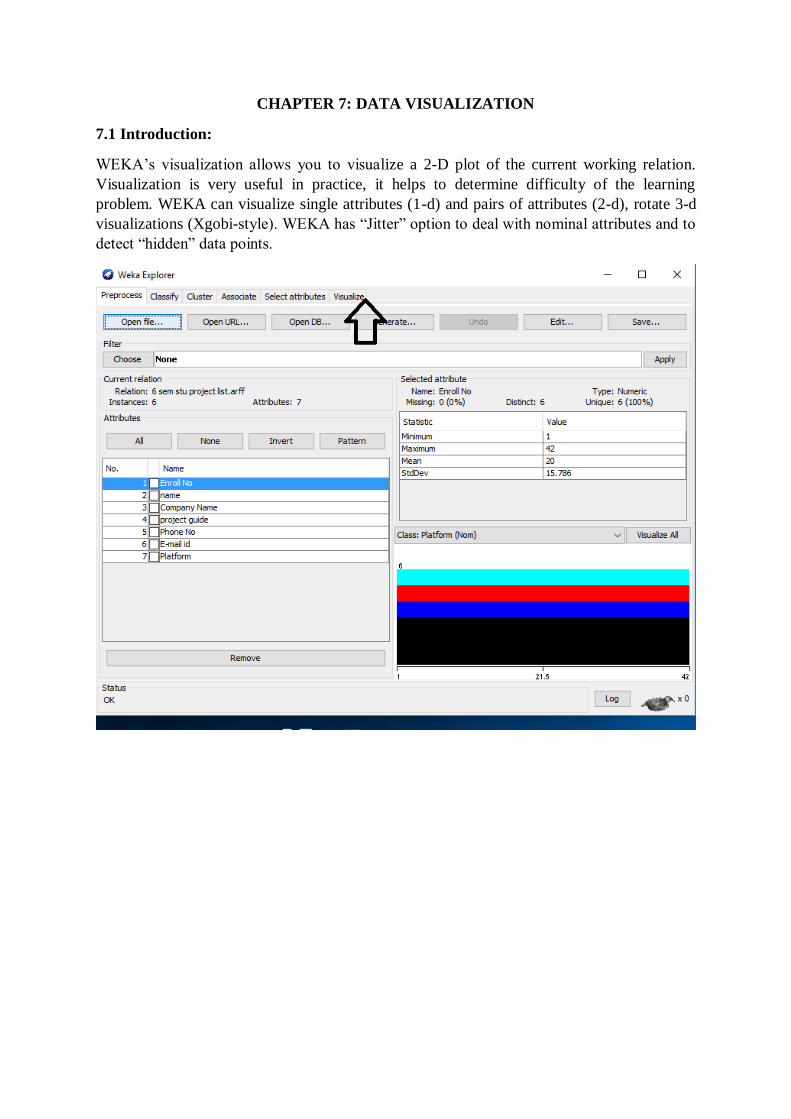
WEKA’s visualization allows you to visualize a 2-D plot of the current working relation.
Visualization is very useful in practice, it helps to determine difficulty of the learning
problem. WEKA can visualize single attributes (1-d) and pairs of attributes (2-d), rotate 3-d
visualizations (Xgobi-style). WEKA has “Jitter” option to deal with nominal attributes and to
detect “hidden” data points.

Select a square that corresponds to the attributes you would like to visualize. For example,
let’s choose ‘outlook’ for X – axis and ‘play’ for Y – axis. Click anywhere inside the square
that corresponds to ‘play on the left and ‘outlook’ at the top.
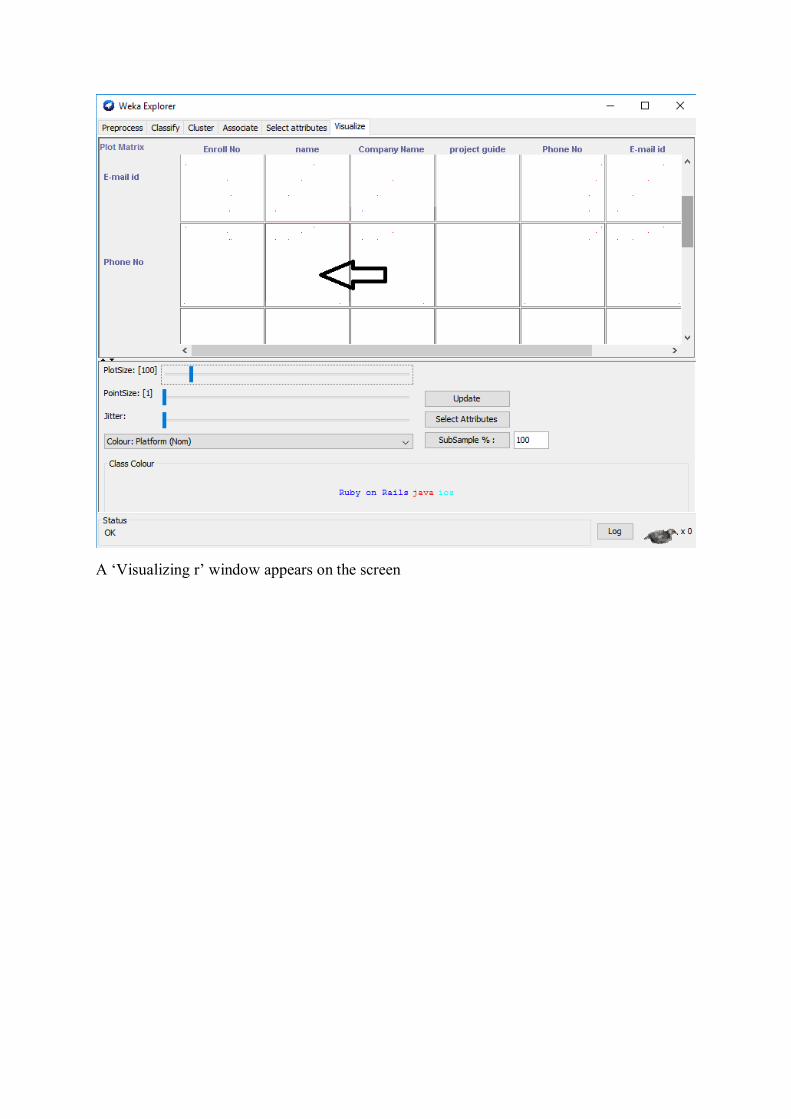
A ‘Visualizing r’ window appears on the screen

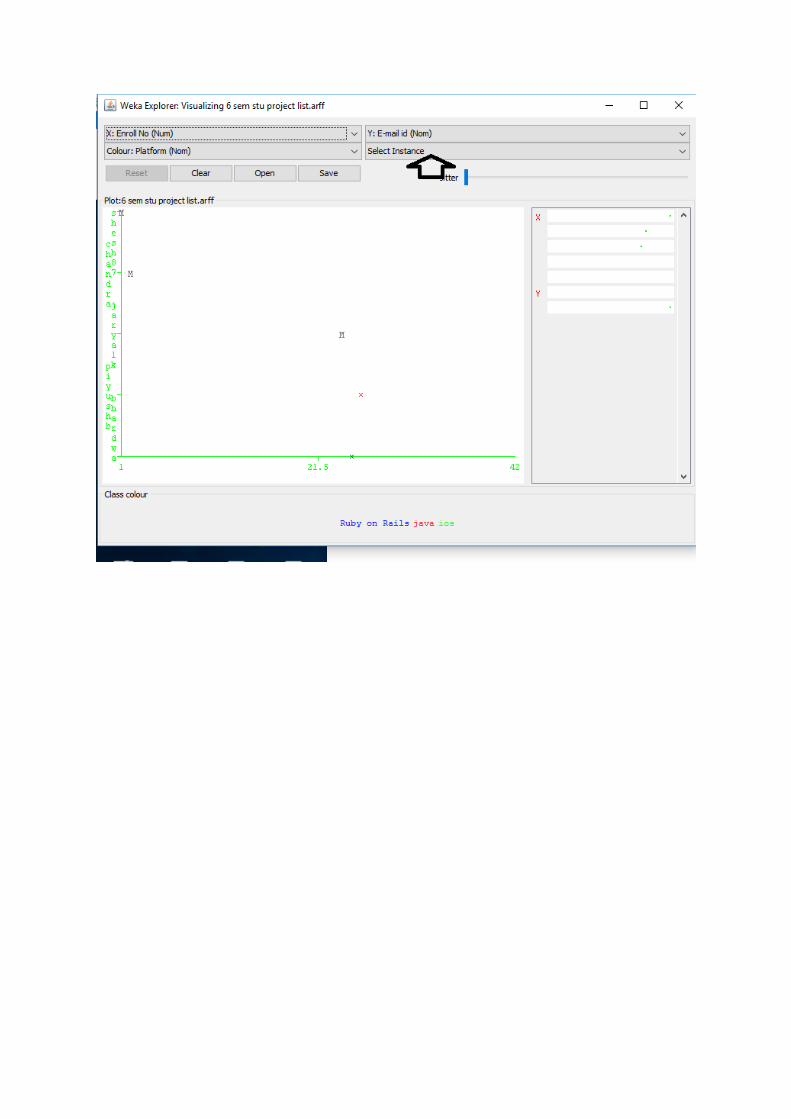
7.2 Changing the View
In the visualization window, beneath the X-axis selector there is a drop-down list, ‘Colour’,
for choosing the color scheme. This allows you to choose the color of points based on the
attribute selected.
Below the plot area, there is a legend that describes what values the colors correspond to. In
your example, red represents ‘no’, while blue represents ‘yes’. For better visibility you should
change the color of label ‘yes’. Left-click on ‘yes’ in the ‘Class colour’ box and select lighter
color from the color palette. To the right of the plot area there are series of horizontal strips.
Each strip represents an attribute, and the dots within it show the distribution values of the
attribute. You can choose what axes are used in the main graph by clicking on these strips
(left-click changes X-axis, rightclick changes Y-axis). The software sets X - axis to
‘Outlook’ attribute and Y - axis to ‘Play’. The instances are spread out in the plot area and
concentration points are not visible. Keep sliding ‘Jitter’, a random displacement given to all
points in the plot, to the right, until you can spot concentration points.


7.3 Selecting Instances:
Sometimes it is helpful to select a subset of the data using visualization tool. A special case
is the ‘User Classifier’, which lets you to build your own classifier by interactively selecting
instances. Below the Y – axis there is a drop-down list that allows you to choose a selection
method. A group of points on the graph can be selected in four ways.
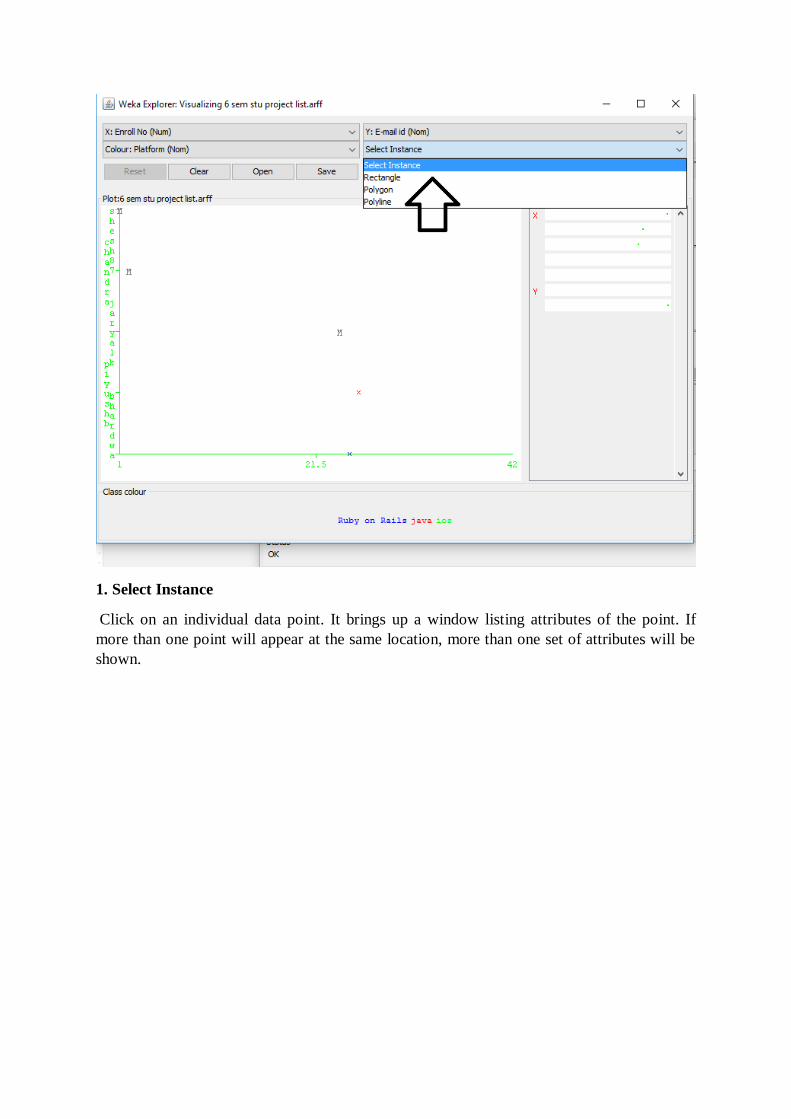
1. Select Instance
Click on an individual data point. It brings up a window listing attributes of the point. If
more than one point will appear at the same location, more than one set of attributes will be
shown.
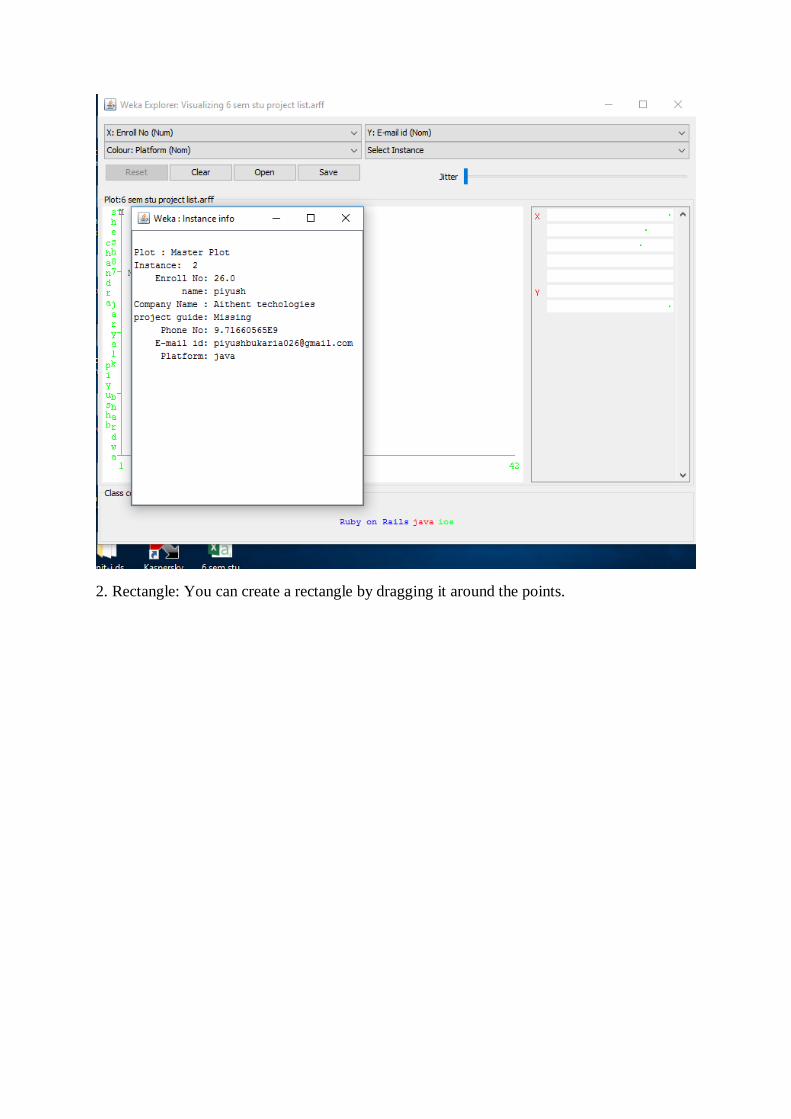
2. Rectangle: You can create a rectangle by dragging it around the points.


3. Polygon: You can select several points by building a free-form polygon. Left-click on the
graph to add vertices to the polygon and right-click to complete it.

4. Polyline: To distinguish the points on one side from the once on another, you can build a
polyline. Left-click on the graph to add vertices to the polyline and right-click to finish.

8. Conclusion:
This concludes WEKA Explorer Tutorial. You have covered a lot of material since the
Tutorial Introduction. There is a lot more to learn about WEKA than what you have covered
in these seven exercises. But you have already learned enough to be able to analyze your
data using preprocessing, classification, clustering, and association rule tools. You have
learned how to visualize the result and select attributes. This knowledge will prove invaluable
to you. If you plan to do any complicated data analysis, which require software flexibility.
9. References:
1. Witten, E. Frank, Data Mining, Practical Machine Learning Tools and
Techniques with Java Implementation, Morgan Kaufmann Publishers, 2000.
2. R. Kirkby, WEKA Explorer User Guide for version 3-3-4, University of Weikato,
2002. 3. Weka Machine Learning Project,
http://www.cs.waikato.ac.nz/~ml/index.html.
4. E.Frank, Machine Learning With WEKA, University of Waikato, New Zealand.
5. B. Mobasher, Data Preparation and Mining with WEKA,
http://maya.cs.depaul.edu/~classes/ect584/WEKA/association_rules.html, DePaul
University, 2003.
6. M. H. Dunham, Data Mining, Introductory and Advanced Topics, Prentice Hall,
2002.
7. WEKA Tutorial: • Machine Learning with WEKA
8. WEKA Data Mining Book: • Ian H. Witten and Eibe Frank, Data Mining:
Practical Machine Learning Tools and Techniques (Second Edition)
9 • WEKA Wiki: http://weka.sourceforge.net/wiki/index.php/Main_Page