data and analytics for business decision-making: adoption...
TRANSCRIPT
Advancing Financial Inclusion
Data and analytics for business decision-making: Adoption and maturity
November 2016
Author: Christiaan Loots
About insight2impact
Insight2impact | i2i is a resource centre that aims to catalyse the
provision and use of data by private and public sector actors to
improve financial inclusion through evidence-based, data-driven
policies and client-centric product design.
i2i is funded by the Bill & Melinda Gates Foundation
in partnership with The MasterCard Foundation.
For more information:
Visit our website at www.i2ifacility.org. Email Mari-Lise du Preez at [email protected]. Call us on +27 (0)21 913 9510.
Client insights scoping series: Note 1
Evolution of analytics for business decision-making
Methodology
This note is based on desktop research on the existing body of knowledge surrounding the use of data
and analytics for business decision-making. In addition, the study has been informed by participation
in various forums, conferences and lectures, as well as telephonic and in-person interviews with 46
financial service providers (FSPs), fintech start-ups, analytical providers, consultancy firms, design
organisations, and academic or research organisations. Industry consultations focused primarily on
the alternative application of data and analytics.
1
Contents
Table of contents
1. Introduction ................................................................................................................................... 2
2. Components and adoption of data and analytics for business decision-making .......................... 3
3. Data and analytics adoption and maturity .................................................................................... 3
4. Critical factors for data and analytics project implementation ...................................................... 8
5. Data and analytics leadership ..................................................................................................... 15
6. Conclusion .................................................................................................................................. 17
7. Bibliography ................................................................................................................................ 20
List of figures
Figure 1: Data and analytics maturity framework .................................................................................. 8
Terminology
Throughout this note, we will be referencing a number of terms by their acronyms. This key provides
context to the following terms:
CAO:
CDO:
CIO:
FSP:
ICT:
IT:
MIS:
TAM:
Chief analytics officer
Chief data officer
Chief information officer
Financial service provider
Information and communication technology
Information technology
Management information system
Technology acceptance model
2
1. Introduction
Context: Over the last two decades, globalisation, an increase in market-based economies, and a
decrease in protectionism, has all led to a more level playing field for organisations to compete at an
international level. This means that organisations within developing countries are facing more
competition and disruption than ever before. When it comes to the use of data and analytics for
business decision-making, many international organisations have matured to the degree where they
have turned this business process into an asset, and therefore as a means of competitive advantage.
However, data and analytics is not utilised to the same degree across countries, industries and
between organisations.
With an increasingly connected, sophisticated, smarter and user-friendly global information technology
(IT) environment, organisations in developing countries are just as exposed to the creative destruction
pressures faced by organisations in developed markets. New entrants increasingly leverage
information and communications technologies (ICT), coupled with better use of data and analytics, to
displace incumbents and reach global audiences of consumers quicker, at greater scale, and offering
greater value. The availability of smarter software and methodologies that can be leveraged (or
facilitated over the cloud) increases the potential for disruption, including within financial services, and
ultimately offers new opportunities for financial inclusion. Some existing organisations are therefore
exploring how to catch up. Whether through new start-ups or large existing institutions, data and
analytics offer opportunities to reach new clients, enhance customer experience, and serve clients’
needs better.
Large established providers have existing client bases, revenue streams and infrastructure that have
the potential to reach new clients quicker and at scale. When trying to understand the opportunities
that data and analytics offer for financial inclusion, it is therefore also important to understand the
internal dynamics within such existing institutions that could lead to greater adoption and utilisation of
data and analytics.
Purpose: This note forms part of a series that covers components of the use of data and analytics by
financial service providers (FSPs) to better understand and serve their clients. The objective of this
note (contributing to the overall scoping series objectives) is to explore the drivers and barriers to the
introduction, use and development over time, of data and analytics for business decision-making. It
also constructs a framework for the evaluation of the level of maturity of organisations utilising data
and analytics for decision-making. The latter can be used to inform interactions with these
organisations and to pinpoint specific requirements that these institutions may have, based on their
level of development.
Structure: The remainder of this note is structured as follows:
• Section 2 introduces the components and typical adoption of data and analytics for business decision-making.
• Section 3 explains the pre-existing characteristics which could explain variances in the degree to which organisations adopt and utilise data and analytics for business decision-making, as well as the exhibited characteristics of organisations with more mature levels of utilisation.
• Section 4 examines the key factors that are required for the successful implementation of a new data or analytics project within an organisation and explains variances.
• Section 5 explores the concept of data and analytics leadership further and explains how this field has evolved over recent years.
• Section 6 describes a number of hypotheses which can be used by development partners and the supporting services industry to inform engagements with providers wishing to enhance their use of data and analytics.
3
2. Components and adoption of data and analytics for business decision-making
Components of the use of data and analytics for business decision-making. The use of data and
analytics for business decision-making can be broken down into several components. The first three
are separate but closely related: the data itself, the analytics utilised to manipulate the data, and the
underlying technology (or computing power). The availability, capability and functionality of these
three components have evolved closely together (at exponential rates) ever since the invention of
electronic computers in the mid-20th century. However, in order to utilise data and analytics for
business decisions, two additional components are required – interpretation and communication.
Interpretation requires that data is manipulated for a purpose and within a specific context of
understanding (either of a situation, the business requirements, or an understanding of the domain
knowledge) (Mortenson, et al., 2013). Otherwise, the analysis may not be relevant or useful for
decision-makers. Communication is crucial to ensure implementation of insights. Data in its raw form
is rarely actionable, and the same goes for analytical outputs that are not easily understandable or
accessible. Visualisation and communication are therefore an essential component of transforming
data into actionable insights for business decision-making.
Decentralised adoption of data and analytical functions. Data and analytics is usually not a primary
business function, but rather supports other primary business functions (like sales, or accounting).
Technological platforms to capture, store and analyse data for departmental level or ad hoc
requirements are therefore often adopted separately within individual business units and functions
(silos), as the need for data in those functions arise. However, on a business level – and over time –
this can result in an accumulation of isolated departmental systems producing inconsistent and
sometimes contradictory data. Whilst these systems add value in terms of the specific business
functions they were designed for, it can create a lot of issues for the enterprise as a whole, as these
silos of information may not easily integrate with other sources of data, making utilisation of data at an
organisational level difficult (Hazejager, 2012). Siloed data and analytical processes also create issues
of replication and redundancy. Each process caters for specific users, but may rely on similar or
overlapping data sources, in which case the administrators of each system have to gather, clean and
integrate data from these sources into their own system, resulting in duplication of efforts.
Demonstrating the value of data at an organisational level is difficult. At an organisational level,
it is difficult to translate the value of good data management and utilisation in terms of the impact that
it has on the company’s overall bottom line, and its competitive advantage. Various components of the
business may generate and use data in different ways. The cost involved in setting up and maintaining
the various systems and processes for effective data usage may be clearly tied to particular revenue
streams. But how do businesses justify the cost of making multiple different systems integrate better
so that data can be managed and used outside of particular components of the business? Historically,
data has rarely been seen as a business differentiator or recognised as a basis for competitive
advantage (Leaper, 2014). However, this is changing. The focus of the next section is to explore the
factors that contribute to the variances in the degree to which organisations utilise data and analytics
for business decision-making.
3. Data and analytics adoption and maturity
Variances in adoption across countries and organisations. The adoption of data and analytics for
business purposes over time have not played out equally across countries, markets, industries and
individual organisations. Certain organisations – even in developed markets – use data and analytics
far less, or less effectively, than others in the same country or in the same industry. But there are also
significant variances across countries. The use of data and analytics in Zambia is certainly not at the
4
same level as it is in the UK. In fact, most developing countries have a relatively under-developed IT
industry and culture. Developing markets, and especially Africa, remain a small part of the global
economy for IT services. In 2016, Latin America will account for less than 5% of the market for IT
services (Sudan, et al., 2010), whilst the Middle East and Africa together will account for less than 3%
(Statista, 2016). In addition, the top three business intelligence and analytics software vendors in
Middle East and North Africa (SAP, Oracle and SAS Institute hold 50% of the market share in this
region), only generated 2% of their worldwide revenue from this region1 (Meulen & Rivera, 2014)
(Shetty, 2015). Although there may be individual organisations (and sectors) that are more mature,
the overall IT industries in these countries are still relatively underdeveloped. However, it is important
to note that even though there may be broad developmental differences across markets, it does not
mean that organisations in different markets may not experience issues or exhibit behaviour which are
also very similar. Or conversely, that organisations within the same country or market will utilise data
and analytics to the same degree.
Existing information on data and analytics maturity. There are two main sources of information
that explore the degree to which organisations adopt and utilise data and analytics for business
decision-making:
• The first is academic statistical research on the adoption of information systems in
developing countries. Little research exists on the topic, although it has seen an increase over
the last 10 years. This research, to a large extent, identifies similar factors that can impact
adoption. However, they do not include standardised sets of factors and vary in terms of the
findings (the factors that influence adoption). Many of these studies focus on factors that are
not particularly unique to developing country contexts. However, there are some that
specifically highlight cultural (Walsham, et al., 2007) and societal differences which can impact
on adoption of information systems, particularly in countries (for instance Sri Lanka) that are
underdeveloped (Huang & Palvia, 2006), or have not had significant international cultural
exposure and integration (Polselli, 2012).
• In addition to academic studies, there are numerous classifications of organisations based on
their use of and/or adoption of data and analytics for business decision-making. These could
include or be based on broad industry surveys, commercial consulting or research
frameworks. The segmentation and classification of groups of organisations based on their
use of data and analytics is more subjective, although informed by descriptive analysis,
industry experience and consultation. These frameworks, to a large extent, also touch on the
factors that influence data or analytics project failure (discussed later). They also include a
broad range of industries and the findings for sub-categories of industries may be substantially
different.
Proposed framework for data and analytics adoption and maturity. At this stage, it is hard to find
conclusive evidence or agreement on the evolution of analytical capabilities within organisations over
time (i.e. maturity). However, many existing maturity frameworks include similar characteristics in
terms of progression, which can be used to construct a framework for the maturity pathway of
organisations, industries and countries in terms of their adoption of data and analytics to support
business decision-making. These characteristics can be broadly grouped into four categories. The
first three are required characteristics for progression to more mature utilisation of data and analytics
1 Based on author’s calculation using data from (Meulen & Rivera, 2014) & (Shetty, 2015). SAP, Oracle and SAS had combined revenue in 2013 for their Middle East and North Africa operations of USD 134 million, or 53% of all BI and analytics software revenue in the region (Shetty, 2015). The global revenue for the three providers were USD 6.7 billion in 2013 (Meulen & Rivera, 2014).
5
(preconditions), whilst the fourth category is indicative of the level of maturity reached (exhibited
characteristics):
1. Country context. There are certain factors on a country level which could impact on the level
of adoption and maturity in the use of data and analytics by organisations in that country. For
instance, economic and industry growth, industry maturity and market competition can impact
on investment decisions and the investment cycles of decision makers within organisations.
The quality of basic and IT infrastructure (power supply, connectivity etc.), the cost of skilled
labour, availability of employable skills, and the degree to which skills development is
supported by the market and academic institutions can also play a role. Government support
for the IT industry (promotional, institutional and educational), ICT policy stability and
conducive ITC regulations and legislation (including data protection, privacy and security) can
also facilitate greater adoption. In addition, IT Vendor efforts like support for skills
development, agent training and knowledge of products can impact adoption.
2. Organisational readiness. Organisational-level enabling environment factors include the
following:
• Past experience and existing capacity. This includes:
o The organisational size, absorptive capacity and existing IT resources and
experience, including the size of IT and analytics staff pool or department.
o Past experience in realising analytical objectives and derived benefits from past
data and analytics initiatives.
o The level of transformation of the organisation, past organisational experience and
tolerance of transformational management2.
o The degree to which the organisational data environment is conducive and
governance procedures are in place, although one empirical study found that poor
data quality may actually be a driver of adoption, particularly of data warehouses
(Ramamurthy, et al., 2008).
• Organisational buy-in, support and leadership. The degree to which:
o Data and analytics receive executive and managerial recognition and support, and
there is clear data and analytics leadership and responsibility at a senior level in
the organisation.
o Broad organisational commitment to data and analytics have been established, a
strategic vision and strategy to leverage analytics capabilities is in place, and
aligned between IT and the enterprise.
o Data and analytics initiatives receive financial support and investment, and is
recognised as an essential corporate asset.
o The organisation has determined a starting point for data and analytics
transformation, and developed and validated a business case.
• Organisational and management culture. The degree to which:
2 There are five stages of transformation: local automation of existing procedures, internal integration of existing business processes, business process reengineering, business network redesign and redefinition of company boundaries through the creation of inter-organisational relationships (Musyimi, N. & Okelo-Odongo, W. 2015)
6
o Managers and executives rely on data and analytics to support decision-making,
including tactical and strategic decisions, as opposed to relying on judgement and
intuition.
o An organisational culture of data and analytics for decision support has been
established.
o The management culture is in line with and allows for the capabilities of data and
analytics. Management decision-making is not centralised, labour intensive, and
individualistic, and there is a low reliance on manual authorisation and intuition for
decision-making. Uniform business norms and practices are commonplace.
• Organisational staff characteristics. Organisational staff characteristics that could
impact on adoption include:
o Computing culture. The degree to which staff has a history of computing usage,
positive attitudes towards computing, and dependence on computers.
o Awareness of new technology. The degree to which staff and decision-makers are
aware of the options and features of new technologies, products or services. For
instance, one study found that age (youth) and education contributed to awareness
(Kester & Preko, 2015).
o Embracing change. The degree to which a culture of innovation and openness to
change has been fostered.
o Attitude towards and experience with new technology. The degree of staff optimism
about new IT products and systems, positive past experiences and training
received.
o Other. In addition, job tenure, education, language and cultural exposure (to foreign
concepts, work ethics and technology) can have an impact on the openness
towards new technologies, products or systems. (Nzuki & Okelo-Odongo, 2015)
3. Current utilisation. The degree to which organisations adopt or utilise data and analytics for
decision-making are a function of the precondition factors described above, and consisting of
external factors (country context) and internal factors (organisational readiness). However, as
organisations mature, the degree to which they exhibit characteristics of maturity, or their
current utilisation, may also be preconditions to continue maturing, i.e. utilise data or analytics
even more, or adopt or utilise more advanced data and analytics. The degree of current
utilisation is characterised by:
• Sophistication. As organisations derive more value from data and analytics for
decision-making, the structure, complexity and proactivity with which they use data and
analytics increase, as outlined below:
o Structure pertains to the degree to which data and analytics functions within the
organisation has been formalised, centralised or elevated (centres of excellence).
o Complexity is the degree to which multiple data sources, including external and
unstructured data, is captured and utilised, and the degree to which statistical
predictive analytics and modelling is used.
o Analytics proactivity reflects the degree the organisation has moved beyond
reactive historical, operational and compliance reporting (using historical data), to
7
include proactive analysis of trends and benchmarks, including predictive and
prescriptive analytics.
• Integration. The degree to which:
o Data and analytics have been integrated, and is accessible and used across
business functions, through the implementation and use of a data warehouse.
o Data and analytics are utilised at an enterprise level to create an enterprise view.
o Inconsistencies, siloed uses (including siloed dashboards) and duplication of effort
are noticed and have been eliminated.
o Cooperation between departments has been established.
• Democratisation. The degree to which data and analytics support decision-making has
been extended across different levels of seniority in the organisation, and customisable
reporting tools and self-service dashboards have been developed.
• Automation and optimisation. The degree to which focus on analytics have shifted
from efficiency, existing process automation, and cost reductions, to pursue growth
objectives, automation of recurring analytics, and optimisation of resources and
processes.
• Innovation. The degree to which the organisation develops and uses business
hypotheses to inform and focus data and analytics initiatives, and experiment with, test
and improve their data and analytics capabilities. Also, the degree to which analytics
innovation occur to meet business priorities.
• Differentiation. The degree to which analytics capabilities is used to differentiate from
competitors, based on capabilities and business processes.
4. Features of proposed data or analytical solution. Lastly, there are certain aspects related
to the proposed data or analytics solution or product that may impact adoption, regardless of
the level of readiness or current utilisation:
• Affordability. The degree to which the proposed IT or analytics product or service is
affordable.
• Perceived benefit, relative advantage or usefulness. The degree to which the new
product or service is perceived to add value or an advantage to the operation and
decision-making of an organisation.
• Perceived complexity. The degree to which the product or service is seen as complex
or difficult to implement, integrate, understand or use.
• System efficiency. The degree to which the new product or service aligns with existing
or future system capabilities.
• Compatibility. Compatibility with current systems, products and services.
• Trialability. The degree to which a product can be tested and scaled.
8
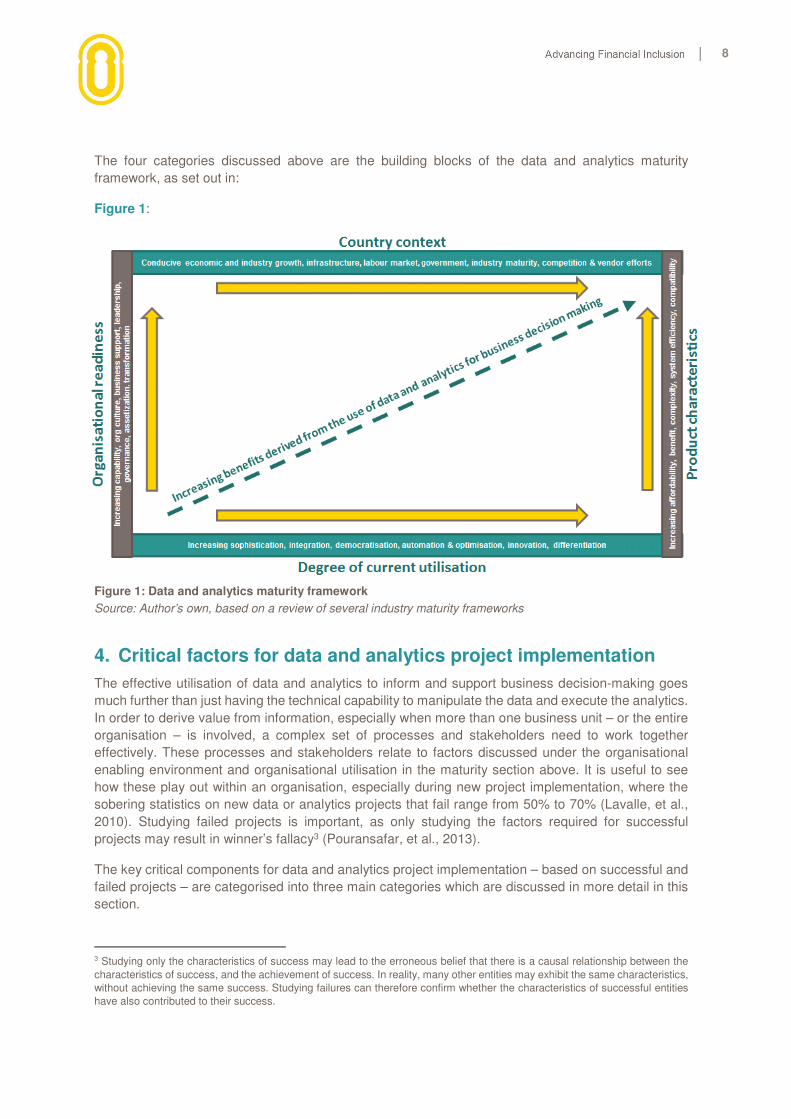
The four categories discussed above are the building blocks of the data and analytics maturity
framework, as set out in:
Figure 1:
Figure 1: Data and analytics maturity framework
Source: Author’s own, based on a review of several industry maturity frameworks
4. Critical factors for data and analytics project implementation
The effective utilisation of data and analytics to inform and support business decision-making goes
much further than just having the technical capability to manipulate the data and execute the analytics.
In order to derive value from information, especially when more than one business unit – or the entire
organisation – is involved, a complex set of processes and stakeholders need to work together
effectively. These processes and stakeholders relate to factors discussed under the organisational
enabling environment and organisational utilisation in the maturity section above. It is useful to see
how these play out within an organisation, especially during new project implementation, where the
sobering statistics on new data or analytics projects that fail range from 50% to 70% (Lavalle, et al.,
2010). Studying failed projects is important, as only studying the factors required for successful
projects may result in winner’s fallacy3 (Pouransafar, et al., 2013).
The key critical components for data and analytics project implementation – based on successful and
failed projects – are categorised into three main categories which are discussed in more detail in this
section.
3 Studying only the characteristics of success may lead to the erroneous belief that there is a causal relationship between the characteristics of success, and the achievement of success. In reality, many other entities may exhibit the same characteristics, without achieving the same success. Studying failures can therefore confirm whether the characteristics of successful entities have also contributed to their success.
9
Organisational factors
Before any other considerations, there are several organisational factors which can undermine the
implementation of a new data or analytics project, or keep it from taking off in the first place. These
factors, as well as the reasons for them, are:
• Business support and strategy. The first key success factor for a new data or analytics
project is recognition of the need for the project across different business functions within the
organisation. Due to the complexity, long timelines – easily ranging up to two years – high
risks, as well as the many stakeholders required for development and implementation, broad
buy-in and recognition for the new data or analytics initiative is required. More than one
department may be required to sponsor (i.e. pay for and oversee) the project, but it is also
likely to require ongoing involvement and support from these departments (Koeppel, 2013). In
addition, executive-level decision-makers may have entirely bought in, but if lower level
stakeholders are not similarly on board, the project may lack the required support throughout
various stages of implementation. If the project fails to secure sufficient (or any) business
sponsorship (Koeppel, 2013), it may end before it started. There are several reasons why a
project may not receive sufficient buy-in or a new initiative or methodology is not embraced:
o This can be because of organisational inertia, office politics, competing priorities
between different decision-makers and departments, or a misconception about
analytics (either scepticism or unrealistic expectations – see expectation management,
below) (Deloitte, 2012). For instance, if stakeholders largely comprise of different
departments, they can be focused on departmental objectives, rather than thinking
about the broader organisational implications (departmental thinking). Stakeholders
could also view the project as a once off implementation, rather than take a longer term
view and locate the project within the larger, evolving organisational data and analytics
ecosystem (Demikran & Dal, 2014). In addition, if the new data or analytics initiative is
drastically different from what was used before, more work may be needed upfront to
cultivate an understanding and appreciation of the need for the new initiative or to
market the project internally and sell its success before buy-in can be secured. This may
be especially true for big data projects (Demirkan & Dal, 2014). If there is a lack of
agreement on the objectives of the new initiative and the benefits that will be derived
from it, implementation will be more difficult (Koeppel, 2013), and may lack direction.
Developing a vision and strategy for the new initiative and getting agreement on this
from the different stakeholders involved could assist successful implementation
(Demikran & Dal, 2014).
• Ownership. The second organisational factor that is essential to a project’s success is
ownership. Data or analytics projects are often sponsored by various business units, and
progress better if they have a champion within the business that pushes for the development
and completion of the project. However, projects have long timelines, and key people
sometimes move on during the project lifetime. This can cause the project to lose momentum.
Specific people or specific departments could also have unique motivations for sponsoring or
championing a project. Ownership is especially important when projects start experiencing
issues or delays. Individuals do not want to be associated with a failed project, so may be
quick to shift focus. If one department sees a project as wasteful, they may be quicker to
question the project when there are delays (Roberts, 2015).
• Project management. A third aspect required for successful implementation is project
management. Because of the complexities explained above and below, data and analytics
projects are often big in scope, have multi-year timelines, and can suffer from scope shift or
10
expanding scope of deliverables over the project lifetime. The scope of the project can also be
influenced by the complexity of the project, which could be exacerbated if clear questions and
parameters are not agreed upon upfront (King, 2016). Proper upfront planning is, therefore,
critical, and failure to assign clear project oversight (and to a person or department which is
not sufficiently incentivised to be the champion for the project) may also result in
implementation issues and delays, and expand the scope and complexity of the project
(Demikran & Dal, 2014). Some also advise that it is better to start small but allow for the ability
to scale up once a project has gained momentum or the parameters and complexities are
known to a sufficient degree (Polyvista, 2016).
• Expectation management. Expectations about what the project will deliver is also a key
success factor, as this determines whether a project will ultimately be seen as a success, if it
delivers what was promised. But it can also lead to a project not taking off. In addition, it
impacts on the scope, sponsorship, buy-in, project planning, and focus throughout the project.
As human decision-makers are involved in the approval or adoption of a new project, as well
as its implementation, expectations management is therefore required to ensure successful
implementation. There are two ways in which expectations about the capabilities of new
initiatives can affect project implementation – either scepticism or inflated expectations:
o Scepticism. At one extreme, decision-makers can be sceptical of the capability of new
software, systems or processes to deliver meaningful insights that suit the business
context. For instance, how can off-the-shelf software be used within a business context
which it was not designed for? Or can it really “predict the future”? (Deloitte, 2012).
Sources of information that lead to inflated expectations (see below), can also contribute
to scepticism if it is seen as unrealistic or implausible, which it often is. Scepticism is
sometimes particularly a problem with high-level executives, as they have years of
business experience and developed sophisticated business acumen, and can have
difficulty believing that highly contextual business problems could be solved through
mathematical or statistical models. Their seniority in the business (combined with their
scepticism) could, therefore, impose a significant barrier to data and analytics projects,
especially if these overpromise capabilities (Guszcza, 2012).
o Inflated expectations. Industry hype, marketing hype (King, 2016), third party
providers, and a range of other sources of externally available information can also
contribute to unrealistic expectations about the capabilities of data or analytics solutions,
and the ease of implementation and integration. Decision-makers can therefore
erroneously believe that the new software, system or process will be a panacea, or will
be able to deliver absolute truths on which the business can act decisively. However,
marketing hype (or other sources of external information) is not the only reason for
expectations that is not in line with reality. Project implementers or champions could
also be overly enthusiastic – or cautious – about the capabilities of new initiatives. As
broad and high-level support is required for such initiatives, the individuals or
departments involved in cultivating buy-in may over-promise in order to get agreement.
In addition, technical staff involved with implementation from the start may simply be
over enthusiastic as they are excited about the theoretical capabilities of a new
technology, without properly considering the business implications.
• Defined business question. A big obstacle to data and analytics projects is starting with a
clearly defined, and properly contextualised and prioritised business problem (Petti & Williams,
2015). Failing to do so can result in massive inefficiencies in terms of time, resources and
budget, and given the other complications with project implementation, can contribute to
project failure as a result. Think of this as travelling. If you are not sure which route you are

11
going, or you do not have a destination to begin with, you may spend much more time and
resources to get there (taking random routes, using the wrong form of transport, or the wrong
type of fuel), or you may not arrive there at all (taking a random route is no guarantee of arriving
at your destination, and using the wrong fuel will likely result in going nowhere). Getting this
component wrong can also lead to improper planning, incorrect or poor focus, and incorrect
expectations (affecting resourcing, where efforts are directed, and ultimately the outcomes
and deliverables for the project) (Polyvista, 2016). Organisations, therefore, have to thoroughly
think a project through at the start and consider the outcome that they want to achieve,
including how insights will be applied to the business. The reasons organisations struggle
with defining business questions can be varied:
o Acting in haste. Hype and competitive pressure can cause projects to be initiated
simply for the sake of not falling behind. Organisations then sometimes start by
collecting data or switching to new software, without having a defined business problem
or objective to start with.
o Questions without hypotheses. Even when a defined business problem is the starting
point, projects can be inefficient, take longer than expected or fail if they take an
exploratory approach. For instance, analysing all data that is available, in the hopes of
finding an answer. This approach can fail to produce answers, or delay the process of
generating an answer. Starting off with a set of hypotheses could help to narrow down
the scope of the project and the data that is relevant or required for the analysis, and
focus data management and analytical efforts. However, a hypothesis in itself also does
not guarantee success, it could be weak, misdirecting or irrelevant, which could divert
or dilute focus. This is another reason why it is crucial to get buy-in and engagement
from all relevant stakeholders up front, as active engagement with the relevant business
stakeholders can help to ensure that hypotheses are relevant (Jain, 2015).
o Passing the buck. Another reason relates to where responsibility lies for defining the
business problem (Brea, 2015). In order to be effective, the business question should
locate the initiative within the relevant business context. For instance, the particular
business or departmental context within which the insights will be applied should shape
the questions being asked. Executive-level and departmental decision-makers would
also have a sense of priorities, risks, potential benefits, and unknowns relating to the
business and its operations. They may also know upfront what would be possible in
terms of actions suggested by insights, as there is no need to produce analytics if it
can’t be acted upon. The definition of the business problem and the maintenance of
focus should, therefore, be the responsibility of an organisational executive or senior
departmental stakeholder who has all of this context. However, as explained above,
there are often multiple stakeholders involved, which can also impact on defining the
business question. For instance, if everyone is not on the same page, and cannot
identify the highest business priority, or cannot develop joint hypotheses that speak to
different stakeholders’ objectives, the stakeholders can fail to define the business
question, or can produce a weak, unclear or inappropriate question (Brea, 2015). These
questions are then passed onto the project implementers, who are technically-focused
and not necessarily concerned with whether it is the right question to be asking. For
instance, analysts may focus on demonstrating analytical depth and excellence, rather
than locating the question within a business framework and asking whether it makes
business sense to be doing the analysis.
12
Technical considerations
Once business buy-in is secured, expectations managed, ownership and oversight established and
the business question and project scope agreed upon, there are still technicalities related to the project
implementation that could add to or hamper the success of a new data or analytics project. These
include:
• Consider the data. The first technical consideration is the data itself. Before setting out, it is
important to understand and identify the data implications and requirements for the project, as
these can undermine the implementation or success of a project. Projects can still proceed if
the organisation has the correct skillsets to structure and clean the data and to find
opportunities for sourcing appropriate data for the project. However, it is important to think
through the required data architecture before setting out (Demikran & Dal, 2014). Data
governance and oversight is another critical factor required (Deloitte, 2012), and needs to be
clearly defined and updated to accommodate the new project. Common issues relating to data
that can hamper project implementation fit into two broad categories:
o They are not ready. Important questions to ask before setting out include whether the
organisation has access to the required data or whether new data will be needed
(Cordoba, n.d.). Some organisations may have messy data infrastructure, or there may
have a perceived lack of data (Polyvista, 2016). These issues can sometimes
discourage the project from going forward i.e. waiting until they have the data, or until
the new, clean data warehouse is implemented (Deloitte, 2012).
o Data is difficult. Data for new projects will likely come from new or external sources,
from siloed business lines or geographies, or from legacy systems which could be
inconsistent with new systems. It is, therefore, important to establish how the different
data sources required will relate to each other (Cordoba, n.d.). Various data sources will
likely have to be validated, converted, integrated, or migrated to new systems.
Sometimes it is difficult to understand data inconsistencies between sources, and they
could be impossible to resolve (Koeppel, 2013). Migration can result in unplanned and
additional work, and can cause problems even once the newly merged system is
already running (Cordoba, n.d.). These issues can also undermine implementation or
success.
• Technological considerations. Even if all the organisational and data elements for a project
are in place, a data or analytics project can fail – or fail to add value – if the technological
requirements (software and hardware), as well as supplemental requirements related to the
technology, such as skills required, are not thoroughly considered and investigated.
Sometimes organisations or project teams will choose to take the path of least resistance, but
fail to properly consider the implications of the proposed technologies to be used (Demikran &
Dal, 2014). A proper investigation of the software and hardware requirements, as well as the
properties of the products from vendors that are considered for the project, is therefore
required, including functions, features and capabilities (Cordoba, n.d.). However, due to its
complexity, delegating the task of unlocking the potential of new analytics software should be
the task of the analysts who will utilise it, and not the IT department (Polyvista, 2016). Common
pitfalls in terms of technological considerations can be grouped into two categories:
o Software and hardware requirements. The software could be inadequate given the
analytics requirements, not of the expected quality, or do not allow for the functionalities
required to achieve the analytics objectives of the project, either at the time of
implementation or in future, when the project has escalated in size. Additionally, the
13
underlying hardware or software for a new system may not integrate easily with existing
systems, or it may not be installed or configured correctly (Cordoba, n.d.). The project
implementers should keep possible additional requirements and complexities for the
future in mind, such as bigger volumes, greater variety of data and data sources etc.
(Demikran & Dal, 2014). They should also consider the implications of possible larger
scales and longer time periods, but start off small.
o Skills and experience requirements. The software, hardware or new system may be
perfectly adequate and easily and correctly integrated, but yield poor results if the
organisation does not have internal experience with the new system or software, or the
skillsets to adequately utilise, adjust or manipulate the new system and its functionalities
(Polyvista, 2016). There may also just be internal resistance to certain new or existing
technologies, or new technology could be unfamiliar (Cordoba, n.d.). An initial learning
curve for users, as well as lower productivity at the start, may, therefore, have to be
factored in (Cordoba, n.d.). Additionally, the organisation may have to establish a formal
training program to get users familiar and up-to-speed with the new technology to be
used. External expertise, who are more familiar with the new software, may also be
used, with the trade-off being they may lack the business understanding to properly
contextualise the analysis (Polyvista, 2016).
Interpretation and dissemination
Lastly, in addition to the organisational and technical considerations, there are some factors that relate
to the analytics process itself (interpretation), as well as the dissemination of findings that could
undermine the success of a data and analytics project. These, as well as possible solutions, include:
• Characteristics of analysts, and the analytical process. In addition to familiarising or
properly training analysts to utilise the new technology, the characteristics of analysts and the
analytics process itself can undermine a data or analytics project. Analysts are often
technically oriented and motivated and could lack the proper business experience and
understanding to properly design and interpret the analysis. They could, therefore, fail to ask
the proper questions which will allow for the most valuable insights for the business (Polyvista,
2016). They could also simply forget to take the business context into account if they get lost
in the technicalities of the statistical modelling process, for instance, focusing on developing
theoretically ideal statistical models, or pursuing impractical degrees of accuracy, confidence
levels or statistical significance (Deloitte, 2012). This could be because they are passionate
about statistical purity, have been trained this way, want to exercise their statistical skills, or
simply because they feel they need to prove their credibility or live up to their resumes.
Ultimately, this additional, and sometimes unnecessary effort may lead to higher project costs,
longer timelines, and diminishing marginal returns for the project. In addition, analysts may
feel that their role ceases once the analysis has been delivered, and therefore they are not
involved in the execution of their insights. If so, they may not consider whether their
recommendations are practical from a business perspective, or ensure that their insights are
validated through testing, which may require the collection of new data during implementation
(Brea, 2015). The business stakeholders to the project should, therefore, be involved enough
in the analytics phase of the project to ensure that these issues are properly considered and
managed. This requires frequent, ongoing two-way communication between business
decision-makers and analysts (Deloitte, 2012). It also helps to proceed iteratively. Take the
business hypothesis into account at the outset, and limit the scope if business decision-makers
feel that a sufficient, if not perfect, answer or solution can be derived (Brea, 2015).
14
• User adoption. If the project results in a new system that will be utilised on an ongoing basis
by end-users in various parts of the organisation, user adoption is also a key factor for success.
For instance, overly complicated IT solutions that don’t meet user needs may result in poor
operational performance (Koeppel, 2013). Factors to consider in terms of user adoption
include timely data (the data used is new enough that it is relevant for the analysis); fast
performance and insight delivery (how quick can you get to the insights); trustworthiness (in
the system or data, and to avoid fact checking); tailored and actionable dashboards; the ability
to modify and customise the output (dashboards, reports etc.); and mobility (can the system
be accessed from anywhere, or only from a desktop workstation) (King, 2016). Change
management could also be required to facilitate adoption, but is also applicable during the
implementation of other facets of the new system, (data collection, integrating and maintaining
the new system, getting people to react to and action the insights etc.).
• Communication, visualisation and presentation of results. Lastly, even if all the
components of a data or analytics project are in place, proper communication and presentation
of results in an intuitive way is the last mile for any analytics initiative, and is often the point
where many projects fail (Polyvista, 2016). This is partly due to the way that humans absorb,
process and recall information. We are not good at performing calculations but are much better
at recognising patterns (Haight, 2015), and absorbing information through storytelling
(Polyvista, 2016). We also learn through visualised information and recall information
significantly better when it is tied to visual imagery (Haight, 2015). There are two layers in the
analytics process that therefore detract from the human capability to absorb, process and
recall information. It is difficult for humans to derive meaning simply by looking at the
underlying data. But the analytics layer itself can also complicate the steps in the logical
reasoning process, more so when highly advanced or complex analytical methodologies are
used (Polyvista, 2016). If these two factors are combined, and the results of the analysis
contradict previously held beliefs of senior decision-makers, it is much more difficult to get
them to buy-in to the insight, and they may resort to rationalisation, or questioning the data
quality, rather than accept the insight.
• Enhancing insight adoption. The adoption of insights into business decision-making can,
therefore, be greatly enhanced and made more actionable by packaging the results in a visual
format and creating a simple, intuitive and clear narrative for the audience to convey the
insights and explain how it was derived. Creative, accurate, detailed and relevant
visualisations enhance analytics and decision-making in at least four ways:
o Firstly, it enhances the process of absorbing, processing and interpreting information.
This allows analysts and decision-makers to comprehend information more effectively
and efficiently, to grasp difficult concepts more easily, and to identify relationships,
patterns and trends better (Cordoba, n.d.).
o In addition, interactive visualisations can facilitate exploration by allowing users to drill
down to investigate insights and uncover evidence. Interactivity also allows users to
change the underlying variables or assumptions and quickly see the impact of these
changes on the overall output (Polyvista, 2016).
o Thirdly, detailed and creative visualisations can make decision-makers more
comfortable with the underlying data and analytics process, which assist in creating trust
in the results.
o Lastly, visualisations enhance the communication and storytelling process, and can,
therefore, facilitate the acceptance and actionability of insights within the organisation
(Kini, 2016).
15
• Additional areas of expertise required for insight adoption. Communication and adoption
of insights remain a large obstacle to the effective use of data and analytics for decision-
making. Many analysts complain that they struggle with this, and as a result, senior
management does not adopt their insights. In more advanced markets, new roles like data
journalists (Anthony, 2016) are emerging to bridge this gap. But a call for additional areas of
expertise is also emerging. For instance, some organisations are advocating for the need for
decision science and decision scientists, decision psychology, and question science as
additional requirements in the insight generation and adoption process. These are yet
undeveloped areas, but may likely rise in prominence in the next few years (Pohlmann, 2015).
Behavioural economics could also likely contribute to this field.
5. Data and analytics leadership
The previous sections emphasise the need for organisational change management and executive level
buy-in and leadership in the use of data and analytics, if an organisation is to succeed in deriving more
value from data and analytics for business decision-making. Data and analytics leadership at the
executive level have risen in prominence alongside the rise in recognition of the value that can be
derived from greater use of data and analytics. Data leadership at the executive level allows for a
greater focus and ability within the organisation to manage all the various processes, including change
management, required. It also allows for better identification, quantification and justification of the
opportunities and value of good data management and analytics utilisation in terms of the impact that
it has on the company’s overall bottom line, the use of data and analytics at an organisational level
(outside of any particular business function), and the ability to leverage data and analytics as a
competitive advantage. The existing and new executive-level positions related to the use of data and
analytics within an organisation are therefore discussed in more detail below.
The chief information officer (CIO). The main executive leadership position related to the use of data
and analytics has been the CIO, a position which usually grows out of the IT department. However,
this was not always the case4. The emergence of the CIO position (starting in the late 1980s) only
received broad recognition and prominence from the 2000s onwards (Gartner, 2016) . Today, CIOs
are mainly responsible for strategic decisions and management of the infrastructure, systems and
resources required to store, maintain and communicate data in an organisation, including capacitating
the business in terms of resourcing and training for IT purposes. However, CIOs have traditionally also
focused on aspects such as data management, data governance, data architecture and analytics (and
still do in many positions). Nevertheless, two new executive roles have been rising in prominence over
the last 8 years.
The chief data officer (CDO). The first was the CDO, emerging as a direct consequence of more
onerous regulatory and compliance demands following the financial crisis in 2008. Particularly in the
financial sector, where regulation required increased oversight of the quality, accuracy, transparency
and privacy of data, and data used for reporting, and penalties for failure became more consequential.
CDOs, therefore, play a defensive role, ensuring data quality, managing regulators and ensuring that
4 Historically, IT was seen as a back-end support function, initially tied to particular business functions. The management of this support function was therefore not represented at an executive level, but delegated to a managerial level. This remained true even when the use of data became more decentralised within organisations, and the concept of end-users became more popular. Introduced around the late 1980s, initially very few companies had CIOs and they were rarely seen as more than IT managers (Connolly, 2013). In addition, data ownership in itself was not securely defined, and was seen as a grey area, with shared responsibility between IT and operations departments (Leaper, 2014) to ensure smooth integration of data between different departments.
16
the supporting environment for financial reporting is sufficient (Bean, 2016). The role has subsequently
risen further in prominence, and more organisations now have CDOs. The role also progressed to deal
with data-related needs and issues arising from big data e.g. how to cope with more data. A 2016
survey of 44 Fortune 1000 companies found that 54% now have a CDO5, up from only 12% in 2012.
In addition, 20% of these firms report that the CDO has primary ownership and responsibility at the
executive level for ‘big data’ initiatives for the firm (Bean, 2016). Furthermore, Gartner estimates that
by 2019, 90% of companies will have CDOs (Meulen & Rivera, 2014). The rise of the CDO is, therefore,
a response to the increasing need for organisations to get a handle on their data, and the movement
is already at an advanced stage. This has also played out in developing markets to some degree.
Conversations with banks in South Africa confirmed that they have been focusing on sorting out data-
related issues for the past 10 to 15 years (CAOForum, 2016). However, as they now have a better
handle on their data, the focus is starting to shift to analytics.
Responsibilities of a CDO. The rise of the CDO role revolves around the greater opportunities and
risks that are tied to data as a strategic asset for the business and a potential competitive advantage,
and therefore the increasing value that businesses are attaching to data as an asset. These risks and
opportunities are increasing the pace of change and innovation in the IT landscape (big data, cloud
computing, the Internet of Things, cognitive computing etc.). Although the role to some degree remains
contentious (Woods, 2014) in relation to that of the CIO, industry agreement on the roles and
responsibilities of the CDO are gaining momentum. The CDO’s overall responsibility is data
management, but the underlying objective is to create value and manage risks associated with the use
of data by the business, with a much stronger focus on innovation, rather than only cost management
(Elliott, 2015). As this a relatively new role, there are many hurdles for CDOs to overcome, especially
if they are pioneering this role in their company (PWC, 2015)6.
The chief analytics officer (CAO). The CAO position is the newest role of the three and is yet to be
fully defined. However, the emergence of this role is reflective of the underlying components of the use
of data and analytics for business insights, coupled with the added complexity that current
developments, like increased volumes of data and more connectivity, is contributing. Where the CDO
plays a more defensive role (ensuring that data is managed as an asset in itself), the CAO’s role is
offensive, focusing on increasing revenue, decreasing cost, or increasing client experience through
the innovative and broader use of analytics by the organisation. The CAO also aims to use data and
analytics as a competitive differentiator in the market (Vorster, 2016) (O'Regan, 2014). As such, the
CAO’s purpose is to ensure that analytics is strategically deployed throughout the organisation so that
insights can be readily accessible and actionable by business decision-makers (Bien, 2014). They
therefore need to overcome boundaries between departments and silos, and foster a culture of
analytics adoption and informed decision-making in the organisation (Rajaram, 2013). Ultimately, they
need to understand the flow of information across the organisation, as well as the context of the data
and the decision-makers across various areas of the business, with a focus on the end-user (Foo,
2013).
With the creation of the CDO and CAO positions to complement the CIO role, the leadership in
companies can each focus more exclusively on one of the three components of data and analytics;
the technology and computer aspect (the infrastructure and systems required to capture, process and
utilise data – the CIO), the data as an asset in itself (the CDO), and the use of analytics to generate
5 The proportion of appointments in non-Fortune 1000 companies may be lower.
6 These include continuing to establish the legitimacy and need for the position, ensuring funding for the role by demonstrating value, securing the necessary human resources to execute the function and defining the scope (and clarifying overlap) with other business functions.
17
actionable insights (the CAO). However, the adoption of these roles remains limited in less developed
markets, where data and analytics are not yet utilised to the extent that it is in developed markets.
6. Conclusion
Although the degree of adoption and sophistication of the use of data and analytics for business
decision-making differs across markets, overall it has increased over the last two decades, and the
market for data and analytics has similarly expanded in developing countries. At this stage, it is difficult
to find conclusive evidence or agreement on the evolution of analytical capabilities within organisations
over time. However, existing literature can be used to identify certain hypotheses based on the data
and analytics maturity of organisations that can be helpful to understand and guide interactions with
market players in developing markets:
• Hypothesis 1: Predictable maturity progression pathway. There is a predictable pathway (or
pathways) to the adoption of data and analytics across countries, within markets and industries and
within organisations. These pathways depend on the nature of the combination of characteristics
and enabling factors that these organisations are faced with. Where organisations are positioned
on the maturity curve will determine the overall strategy and next steps they need to take in order
to progress their maturity. Although there are cases of leapfrogging (particularly when start-ups
enter at the top-end of the maturity curve), the most effective progression for large established
organisations will be a step-wise and gradual approach.
• Hypothesis 2: Interventions should be based on level of maturity. One can pitch development
efforts focusing on the use of data and analytics by organisations at a specific level based on the
degree to which these characteristics are present in a particular country, industry and organisation,
and the identification of the most critical and likely factors they need to focus on in order to progress
to the next level.
• Hypothesis 3: Likely maturity of organisations in sub-Saharan Africa. Although many smaller
start-ups operate in sub-Saharan Africa, most organisations with sizeable footprints (client bases)
are large established organisations with established decision-making structures. They will therefore
not be in the first stage of maturity, where there is extensive reliance only on intuition.
Correspondingly, the majority of these organisations will also not be at the opposite end of the
spectrum (using very advanced analytics and big data). These organisations will rather be located
somewhere in the middle, where companies use new methodologies and sources, but struggle to
unlock the value from their data, or not using it as efficiently or effectively as possible. There are
some known cases of larger institutions in some of these markets that are starting to experiment
with new data and methodologies, but such experimentation still places them somewhere in the
upper middle of the maturity curve.
• Hypothesis 4: Level of maturity should influence partnership selection. Based on the
identification of the above, certain partners would provide greater opportunities (and potential for
impact) for enhancing the use and value of data and analytics for business purposes. Development
organisations engaging with such institutions should, therefore, locate an organisation in the
spectrum at the outset, as this would inform the assistance and interactions with these
organisations. For instance, it would be more difficult for organisations to switch from the lower end
of the spectrum to the higher end immediately. Interventions, and an organisation’s attempts at
enhancing their data and analytical capabilities should rather follow a step-wise approach (assisting
an organisation to take incremental steps, based on their current state of maturity).
• Hypothesis 5: Advanced data and analytics use only suitable for some organisations. For
the demonstration of the successful and sustainable adoption of advanced data and analytical
18
methodologies, organisations which are already at an advanced level of maturity would be more
suitable and offer a greater chance of lasting impact. Organisations which are not at an advanced
stage, but wish to get there, should take either an experimental approach, or partner with an
external provider. Partners can provide components of the advanced data and analytics services
which an organisation wishes to adopt, as long as the organisation’s expectations are in line with
the expected time and resource requirement, in addition to the likely outcomes from such an
initiative. In other words, the progression pathway for these scenarios is longer and more difficult,
and results will be limited at first. There are of course exceptions to this, particularly for smaller and
younger organisations in this space, which is allowed for within the maturity framework.
• Hypothesis 6: Data and analytics project failure. The way that organisations view and define
failed data and analytical projects is important to keep in mind when developing interventions or
assistance partnerships with organisations. The definition of project failures will differ depending
on the position of the person you ask and their orientation towards the project. An executive may
see the project as a failure if it is not delivered on time or does not live up to expectations. Whilst
an analyst who is more closely involved, and will utilise the resulting product, either during the
project lifetime or afterwards, may tell you that they think the project added a lot of value. Failed
projects, therefore, do not necessarily mean they are not implemented, it may simply have taken
longer to implement. However, some projects do fail if they are discarded and never completed. A
failed project also does not mean that the organisation derives no value from the project. Even if it
delivers far less than expected, if it adds value by supporting a certain decision-making process, it
could still be worthwhile for the organisation. Sometimes it also just takes longer than expected for
staff to go through a learning curve in order to utilise a new system, process, data or methodology.
So timelines and expected results can play a large role, and successful implementation of a new
system may still be seen as an unsuccessful project if it fails to deliver actionable insights. This
should be taken into account when designing data and analytics initiatives.
• Hypothesis 7: Country and enabling environment influence. When developing initiatives
across countries, the relative country-level and enablement factors for each country could be
established to some degree upfront. This may inform cross-country strategies and focus, as certain
countries may be more challenging, or may provide more potential for impact. The links and
causality between country-level and enabling factors could be further explored in follow-up
research. For instance, does growth drive internal investment, which in turn drives competition,
which in turn drives greater infrastructure investment (once it becomes constrained)? At what point
does regulation impact the industry, or do regulators become aware of new potential risks?
Exploring the links between these can be used to identify the best entry point and focus for
interventions at this level. Industry development may also be driven by factors like industry focus,
ease of implementation or adoption of new technologies, and the greatest need or focus of
organisations in a market (driving which technologies are adopted or developed to solve existing
issues). If the development of IT industries within countries is relatively equally distributed between
organisations in the same market, development could be a function of country or enabling
environment factors. Technological advancement (what is possible at any specific time), and
opportunity identification (Thieullent, et al., 2016), when new research or a market player identifies
a new market opportunity, could possibly also play a role.
• Hypothesis 8: Country-level, contextualised, and detailed or granular case studies or use
cases. Use cases and case studies on the use of data and analytics for business purposes seem
to be easily available and accessible. To what degree do businesses in our markets rely on these
to inform strategy and approach? Either they are not actively seeking these out, or they are aware
of them but do not find them useful or relevant. Are they are aware of them and find them relevant,
but do not know how to implement them? We need to understand the degree to which senior
19
decision-makers have access to and understand information on the use of data and analytics for
specific purposes. There may be a case for developing use cases or case studies that are more
relevant for the local context, or for the level of maturity in the local markets. For instance, how did
an organisation switch from excel dashboards to a management information system (MIS), and
what were the benefits?
Research topics that have not been included in this report, but may prove useful to understand the
level and pathway of development of the market for data and analytics include:
• Theories on the diffusion of innovation, innovation and disruption, and creative destruction.
• Research on business process management, change management and business process maturity.
• Research on technology acceptance models (TAMs).
• Literature on information systems development and lifecycles.

20
7. Bibliography
Anthony, M., 2016. Global Qlik. [Online] Available at: http://global.qlik.com/nl/blog/posts/michael-anthony/data-journalism [Accessed 7 October 2016].
Bean, R., 2016. Forbes. [Online] Available at: http://www.forbes.com/sites/ciocentral/2016/08/08/big-data-and-the-emergence-of-the-chief-data-officer/#35e123e06bb9 [Accessed 07 October 2016].
Bean, R., 2016. New Vantage. [Online] Available at: http://newvantage.com/wp-content/uploads/2016/01/Big-Data-Executive-Survey-2016-Findings-FINAL.pdf [Accessed 7 October 2016].
Bien, F., 2014. Fast Company. [Online] Available at: https://www.fastcompany.com/3033590/the-future-of-work/its-time-to-welcome-the-chief-analytics-officer-to-the-c-suite [Accessed 30 August 2016].
Brea, C., 2015. CMO. [Online] Available at: http://www.cmo.com/opinion/articles/2015/5/21/three-reasons-analytics-projects-failand-what-to-do-about-them.html#gs.OFgSQ30 [Accessed 18 September 2016].
CAOForum, 2016. CAO Forum Africa. [Online] Available at: http://www.caoforumafrica.com/ [Accessed 07 October 2016].
Connolly, B., 2013. CIO. [Online] Available at: http://www.cio.com.au/article/451627/how_cio_came_history_chief_information_officers/ [Accessed 29 August 2016].
Cordoba, A., n.d. SAS. [Online] Available at: http://www.sas.com/en_us/insights/articles/analytics/three-reasons-reporting-and-analytics-projects-fail-and-how-to-avoid-the-pitfalls.html [Accessed 17 September 2016].
DataInnovation, 2016. Data Innovation. [Online] Available at: https://www.datainnovation.org [Accessed 20 September 2016].
Deloitte, 2012. Wall Street Journal. [Online] Available at: http://deloitte.wsj.com/cio/2012/06/06/5-reasons-analytics-projects-can-fail/ [Accessed 16 September 2016].
Demikran, H. & Dal, B., 2014. Analytics Magazine. [Online] Available at: http://analytics-magazine.org/the-data-economy-why-do-so-many-analytics-projects-fail/ [Accessed 16 September 2016].
Demirkan, H. & Dal, B., 2014. Why Do So Many Analytics Projects Still Fail? Key considerations for deep analytics on big. INFORM Analytics, pp. 44-52.
Elliott, T., 2015. Business Analytics & Digital Business. [Online] Available at: http://timoelliott.com/blog/2015/12/move-over-cio-the-cdo-is-coming.html [Accessed 29 August 2016].
Foo, A., 2013. IBM Big Data & Analytics Hub. [Online] Available at: http://www.ibmbigdatahub.com/blog/emerging-role-chief-analytics-officer [Accessed 30 August 2016].

21
Gartner, 2016. Gartner. [Online] Available at: http://www.gartner.com/it-glossary/descriptive-analytics/ [Accessed 07 September 2016].
Guszcza, J., 2012. Wall Street Journal. [Online] Available at: http://deloitte.wsj.com/cio/2012/06/05/403/ [Accessed 16 September 2016].
Haight, J., 2015. IBM Analytics Communities. [Online] Available at: https://community.watsonanalytics.com/wp-content/uploads/2015/01/Infographic_Visual_Story_Telling__Watson_Analytics.pdf [Accessed 18 September 2016].
Hazejager, W., 2012. Evolving from Data Management to Master Data Management. Heidelberg, SAS Global Forum.
Huang, Z. & Palvia, P., 2006. ERP implementation issues in advanced and developing countries. Business Process Management Journal, VII(3), pp. 276-284.
Jain, P., 2015. Forbes. [Online] Available at: http://www.forbes.com/sites/piyankajain/2015/12/12/5-reasons-why-analytics-projects-fail/#5c4aba7551b4 [Accessed 16 September 2016].
Kester, Q.-A. & Preko, M., 2015. Business Intelligence Adoption in Developing. International Journal of Computer Applications, 127(1).
King, T., 2016. Solutions Review. [Online] Available at: http://solutionsreview.com/business-intelligence/why-do-business-intelligence-projects-fail/ [Accessed 16 September 2016].
Kini, P., 2016. Tech. [Online] Available at: http://tech.firstpost.com/news-analysis/7-reasons-big-data-analytics-initiatives-fail-301424.html [Accessed 18 September 2016].
Koeppel, H. R., 2013. Tech Target: Search CIO. [Online] Available at: http://searchcio.techtarget.com/opinion/The-history-of-business-intelligence-and-analytics-and-what-comes-next [Accessed 16 September 2016].
Lavalle, S. et al., 2010. Analytics: The New Path to Value, California: MIT Sloan Management Review.
Leaper, B., 2014. Wired. [Online] Available at: http://www.wired.com/insights/2014/07/rise-chief-data-officer/ [Accessed 29 August 2016].
Meulen, R. v. d. & Rivera, J., 2014. Gartner. [Online] Available at: http://www.gartner.com/newsroom/id/2723717 [Accessed 20 September 2016].
Mortenson, M., Doherty, N. F. & Robinson, S., 2013. Operational Research and Anaytics Training, Education and Research. [Online] Available at: http://www.whatisanalytics.co.uk/jm/index.php/articles/definitions-analytics/99-what-is-business-analytics [Accessed 17 September 2016].
Nzuki, D. M. & Okelo-Odongo, W., 2015. Adoption of Enterprise Resource Planning Systems in Kenya: A Case of Selected. International Journal of Business, Humanities and Technology, 5(2), pp. 24-32.
O'Regan, R., 2014. Computer World. [Online] Available at: http://www.computerworld.com/article/2688352/chief-analytics-officer-the-ultimate-big-data-job.html#difference [Accessed 30 August 2016].

22
Petti, B. & Williams, S., 2015. Gallup. [Online] Available at: http://www.gallup.com/opinion/gallup/181130/reasons-why-company-analytics-program-failing.aspx [Accessed 16 September 2016].
Pohlmann, T., 2015. Medium. [Online] Available at: https://medium.com/@MuSigmaPohlmann/forget-data-science-here-s-why-decision-scientists-will-be-the-most-sought-after-career-in-the-61675cf4ecef#.aajpywtko [Accessed 7 October 2016].
Polselli, N., 2012. Ivedix. [Online] Available at: http://www.ivedix.com/blog/blog/2012/08/30/can-bi-thrive-in-developing-countries/ [Accessed 19 September 2016].
Polyvista, 2016. Polyvista. [Online] Available at: http://www.polyvista.com/blog/why-so-many-data-analytics-projects-fail-and-how-to-avoid-the-pitfalls [Accessed 16 September 2016].
Pouransafar, M., Cheperli, M. & Tabrizi, M., 2013. Failure Factors of ERP Projects in an Iranian Context. IOSR Journal of Business and Management , 9(4), pp. 83-87.
Rajaram, D., 2013. Forbes. [Online] Available at: http://www.forbes.com/sites/ciocentral/2013/08/08/does-your-company-need-a-chief-analytics-officer/#16bf04dc6068 [Accessed 30 August 2016].
Ramamurthy, K., Sen, A. & Sinha, A., 2008. An empirical investigation of the key determinants. Decision Support Systems, Issue 44, pp. 817-841.
Roberts, P., 2015. Big Data Page. [Online] Available at: http://bigdatapage.com/four-reasons-why-big-data-analytics-projects-fail-or-do-they/ [Accessed 16 September 2016].
Shetty, S., 2015. Gartner. [Online] Available at: http://www.gartner.com/newsroom/id/3109217 [Accessed 20 September 2016].
Statista, 2016. Statista: The Statistics Portal. [Online] Available at: https://www.statista.com/statistics/503519/share-of-it-services-spending-by-region/ [Accessed 20 September 2016].
Sudan, R. et al., 2010. The Global Opportunity in IT-Based Services: Assessing and Enhancing Country Competitiveness. 1st ed. Washington DC: The World Bank.
Thieullent, A.-L.et al., 2016. Capgemini Consulting. [Online] Available at: https://www.capgemini-consulting.com/resource-file-access/resource/pdf/operations_analytics.pdf [Accessed 20 September 2016].
Vorster, P., 2016. CAO Forum Africa. [Online] Available at: http://www.caoforumafrica.com/speaker/pieter-vorster/ [Accessed 7 October 2016].
Walsham, G., Robey, D. & Sahay, S., 2007. FOREWORD: SPECIAL ISSUE ON INFORMATION. MIS Quarterly, June, pp. 317-326.
Woods, D., 2014. Forbes. [Online] Available at: http://www.forbes.com/sites/danwoods/2014/08/30/why-the-rise-of-the-cdo-role-represents-a-power-grab/#fcc69f664d9f [Accessed 29 August 2016].
How to find us
Get involved. Contact us.
Mari-Lise du Preez
T: +27(0)21 913 9510
Celina Lee
T: +27(0)21 913 9510
i2ifacility.org
@i2ifacility
/insight2impact
/insight2impact
/i2ifacility