data are illustrative only and should not be used for ... · data are illustrative only and should...
TRANSCRIPT

Data are illustrative only and should not be used for planning purposes
High High
classes classes
(Kachi - 5) (6 - 8) (9 - 10) (Kachi - 5) (6 - 8) (9 - 10)
Boys Schools Boys Schools
# Pupils 53,601 15,075 7,618 # Pupils 48,860 14,157 7,168
# Teachers 1,476 820 346 # Teachers 1,345 770 326
PTR 36.3 18.4 22.0 PTR 36.3 18.4 22.0
Payroll (Rs. Millions) 166 106 72 Payroll (Rs. Millions) 152 100 68
Girls Schools Girls Schools
# Pupils 19,799 7,062 2,980 # Pupils 18,735 7,208 3,331
# Teachers 795 331 104 # Teachers 752 338 116
PTR 24.9 21.3 28.7 PTR 24.9 21.3 28.7
Payroll (Rs. Millions) 90 43 22 Payroll (Rs. Millions) 85 44 24
(EMIS Data)
Karak 2014 - 2015
Middle
classes
Middle
classes
Primary
classes
(Projected Data)
Karak 2009 - 2010
Primary
classes
Assessment of teacher distribution and need. 2009-2010 through 2014-2015.
Karak

Data are illustrative only and should not be used for planning purposes
PreferredPTR Range
1
35
31222
1
150 100 50 0 50 100 150
0-4
5-9
10-14
15-19
20-24
25-29
30-34
35-39
40-44
45-49
50-54
55-59
60-64
65-69
70-74
75-79
80-84
85-89
90-94
95-99
100 +
Boys SchoolsGirls Schools
Number of Schools
Urban Primary Schools
PreferredPTR Range
3
6
19
25
33
37
71
122
55
23
18
6
6
1
4
2
1
1
2
8
34
54
55
52
24
29
27
15
9
6
3
2
1
1
150 100 50 0 50 100 150
0-45-9
10-1415-1920-2425-2930-3435-3940-4445-4950-5455-5960-6465-6970-7475-7980-8485-8990-9495-99
100 +
Boys SchoolsGirls Schools
Pu
pil
Teac
her
Rai
o
Number of Schools
Distribution of Primary Schools by PTR within Karak
Assessment of Primary School Pupil-Teacher Ratios in Karak
Distribution of Primary Schools by PTR in Karak as compared to other districts
0 10 20 30 40 50 60 70 80 90 100
DIR BALABUNNER
DIR PAYANPESHAWAR
MARDANSWAT
SHANGLASWABI
MALAKANDNOWSHERA
KOHISTANKOHAT
BATTAGRAMHANGU
Khyber-PakhtunkhwaCHARSADDAMANSEHRA
KARAKCHITRAL
TANKLAKKI
ABBOTTABADHARIPUR
BANNUD.I.KHAN Middle 80% of PTR's (excluding top
10% and bottom 10%)Median
36192433376811755231866142
11
2
83454525122272515
863211
150 100 50 0 50 100 150
Boys SchoolsGirls Schools
Number of Schools
Rural Primary Schools
Pu
pil
Teac
her
Rai
o

Data are illustrative only and should not be used for planning purposes
Assessment of Primary School Pupil-Teacher Ratios in Karak
This page is reserved for Department of Education analysis and commentary regarding the contents of the adjacent page.
Data are illustrative only and should not be used for planning purposes
2011
2012
2013
2014
2015
2010
2011
2012
2013
2014
2015
2010
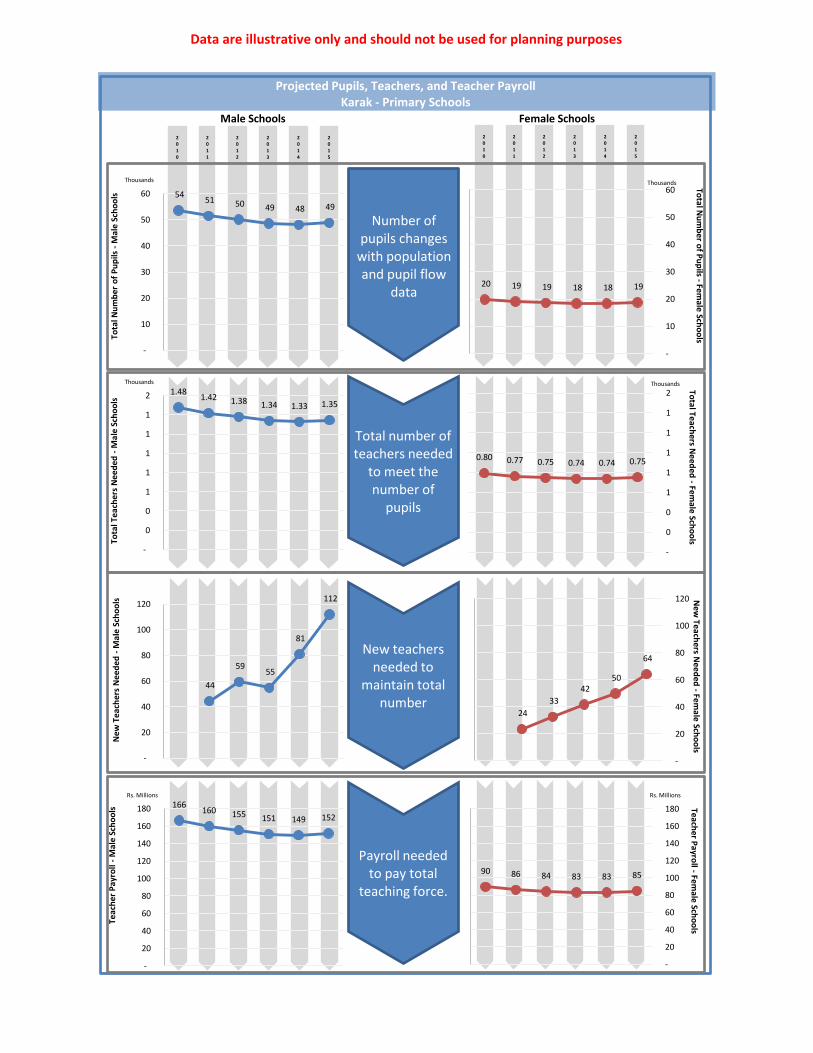
54 51 50 49 48 49
-
10
20
30
40
50
60
Thousands
1.481.42 1.38 1.34 1.33 1.35
-
0
0
1
1
1
1
1
2
Thousands
166160 155 151 149 152
-
20
40
60
80
100
120
140
160
180
Rs. Millions
44
59 55
81
112
-
20
40
60
80
100
120
20 19 19 18 18 19
-
10
20
30
40
50
60 Thousands
0.80 0.77 0.75 0.74 0.74 0.75
-
0
0
1
1
1
1
1
2 Thousands
90 86 84 83 83 85
-
20
40
60
80
100
120
140
160
180
Rs. Millions
24
33
42 50
64
-
20
40
60
80
100
120
Projected Pupils, Teachers, and Teacher PayrollKarak - Primary Schools
Female SchoolsMale Schools
Number of pupils changes
with population and pupil flow
data
Total number of teachers needed
to meet the number of
pupils
New teachers needed to
maintain total number
Payroll needed to pay total
teaching force.
Tota
l Nu
mb
er o
f P
up
ils -
Mal
e Sc
ho
ols
Tota
l Tea
cher
s N
eed
ed -
Mal
e Sc
ho
ols
Total Teach
ers Need
ed -
Female Sch
oo
lsN
ew
Te
ach
ers
Nee
ded
-M
ale
Sch
oo
ls New
Teachers N
eeded
-Fe
male Sch
oo
lsTe
ach
er P
ayr
oll
-M
ale
Sch
oo
ls Teacher P
ayro
ll -Fem
ale Scho
ols
Total N
um
ber o
f Pu
pils -
Female Sch
oo
ls

Data are illustrative only and should not be used for planning purposes
Projected Pupils, Teachers, and Teacher PayrollKarak - Primary Schools
This page is reserved for Department of Education analysis and commentary regarding the contents of the adjacent page.
Projections shown on the adjacent page are based on the default constant-rate scenario. They do not reflect any educated adjustments to the model, and they are not endorsed by the
Department of Education.
Data are illustrative only and should not be used for planning purposes
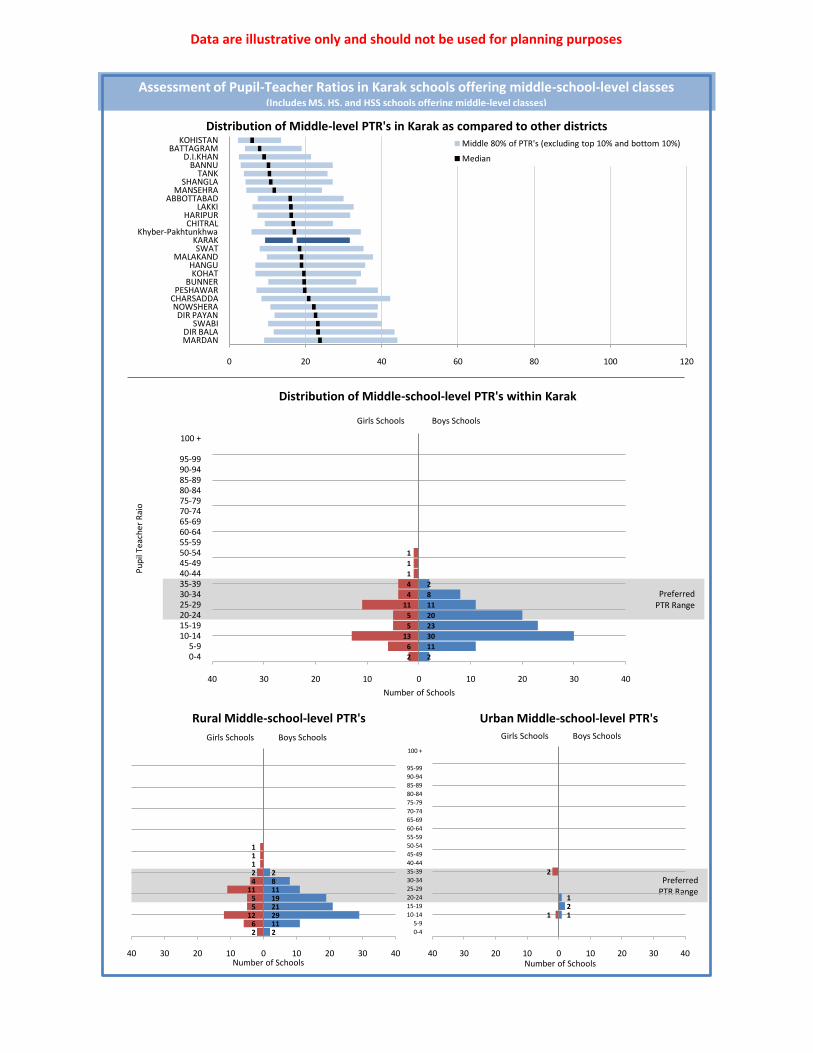
PreferredPTR Range
Assessment of Pupil-Teacher Ratios in Karak schools offering middle-school-level classes
Distribution of Middle-level PTR's in Karak as compared to other districts
0 20 40 60 80 100 120
MARDANDIR BALA
SWABIDIR PAYAN
NOWSHERACHARSADDAPESHAWAR
BUNNERKOHAT
HANGUMALAKAND
SWATKARAK
Khyber-PakhtunkhwaCHITRAL
HARIPURLAKKI
ABBOTTABADMANSEHRA
SHANGLATANK
BANNUD.I.KHAN
BATTAGRAMKOHISTAN Middle 80% of PTR's (excluding top 10% and bottom 10%)
Median
(Includes MS, HS, and HSS schools offering middle-level classes)
2112921191182
26
1255
1142111
40 30 20 10 0 10 20 30 40
Boys SchoolsGirls Schools
Number of Schools
Rural Middle-school-level PTR's
PreferredPTR Range
2
11
30
23
20
11
8
2
2
6
13
5
5
11
4
4
1
1
1
40 30 20 10 0 10 20 30 40
0-45-9
10-1415-1920-2425-2930-3435-3940-4445-4950-5455-5960-6465-6970-7475-7980-8485-8990-9495-99
100 +
Boys SchoolsGirls Schools
Pu
pil
Teac
her
Rai
o
Number of Schools
Distribution of Middle-school-level PTR's within Karak
121
1
2
40 30 20 10 0 10 20 30 40
0-4
5-9
10-14
15-19
20-24
25-29
30-34
35-39
40-44
45-49
50-54
55-59
60-64
65-69
70-74
75-79
80-84
85-89
90-94
95-99
100 +
Boys SchoolsGirls Schools
Number of Schools
Urban Middle-school-level PTR's

Data are illustrative only and should not be used for planning purposes
Assessment of Pupil-Teacher Ratios in Karak schools offering middle-school-level classes(Includes MS, HS, and HSS schools offering middle-level classes)
This page is reserved for Department of Education analysis and commentary regarding the contents of the adjacent page.
Data are illustrative only and should not be used for planning purposes
2011
2012
2013
2014
2015
2010
2011
2012
2013
2014
2015
2010
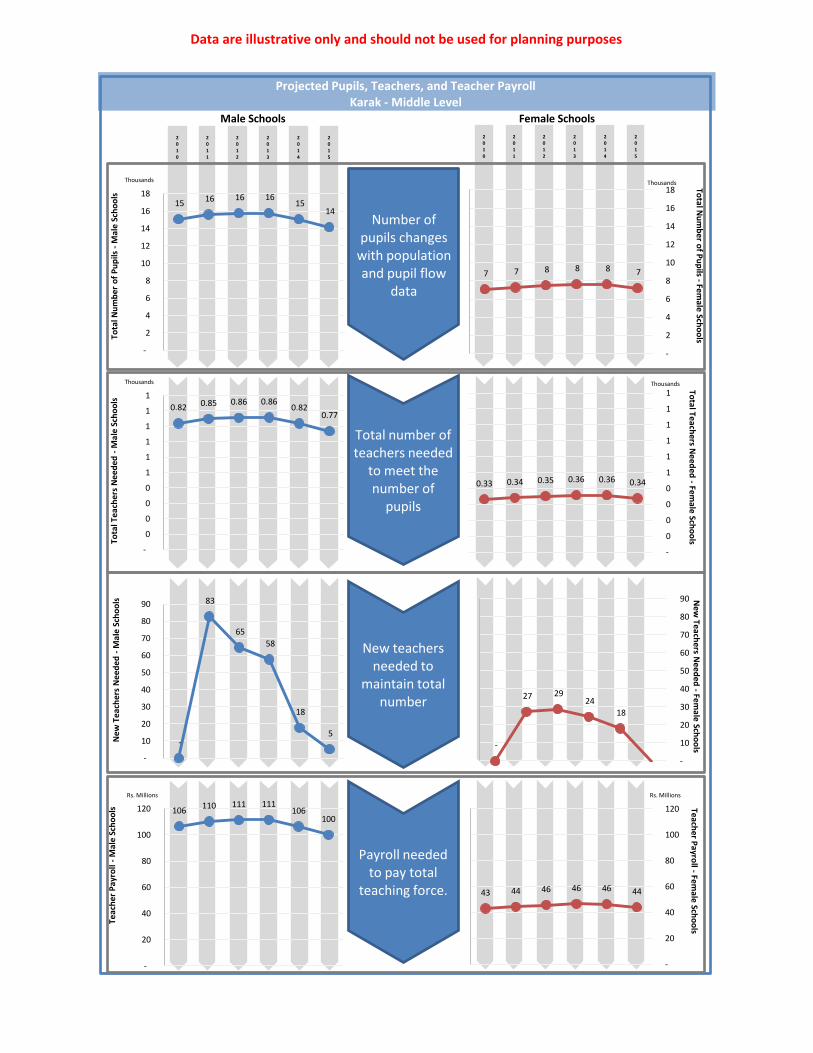
15 16 16 16 15
14
-
2
4
6
8
10
12
14
16
18
Thousands
0.82 0.85 0.86 0.860.82
0.77
-
0
0
0
0
1
1
1
1
1
1
Thousands
106110 111 111
106100
-
20
40
60
80
100
120
Rs. Millions
-
83
65
58
18
5
-
10
20
30
40
50
60
70
80
90
7 7 8 8 8 7
-
2
4
6
8
10
12
14
16
18 Thousands
0.33 0.34 0.35 0.36 0.36 0.34
-
0
0
0
0
1
1
1
1
1
1 Thousands
43 44 46 46 46 44
-
20
40
60
80
100
120
Rs. Millions
-
27 29 24
18
-
10
20
30
40
50
60
70
80
90
Projected Pupils, Teachers, and Teacher PayrollKarak - Middle Level
Female SchoolsMale SchoolsTo
tal N
um
ber
of
Pu
pils
-M
ale
Sch
oo
lsTo
tal T
each
ers
Nee
ded
-M
ale
Sch
oo
lsTo
tal Teachers N
eeded
-Fem
ale Scho
ols
Ne
w T
eac
her
s N
eed
ed -
Mal
e Sc
ho
ols N
ew Teach
ers Need
ed -
Fem
ale Scho
ols
Teac
her
Pa
yro
ll -
Mal
e S
cho
ols Teach
er Pa
yroll -
Female Sch
oo
lsTo
tal Nu
mb
er of P
up
ils -Fem
ale Scho
ols
Number of pupils changes
with population and pupil flow
data
Total number of teachers needed
to meet the number of
pupils
New teachers needed to
maintain total number
Payroll needed to pay total
teaching force.
Data are illustrative only and should not be used for planning purposes
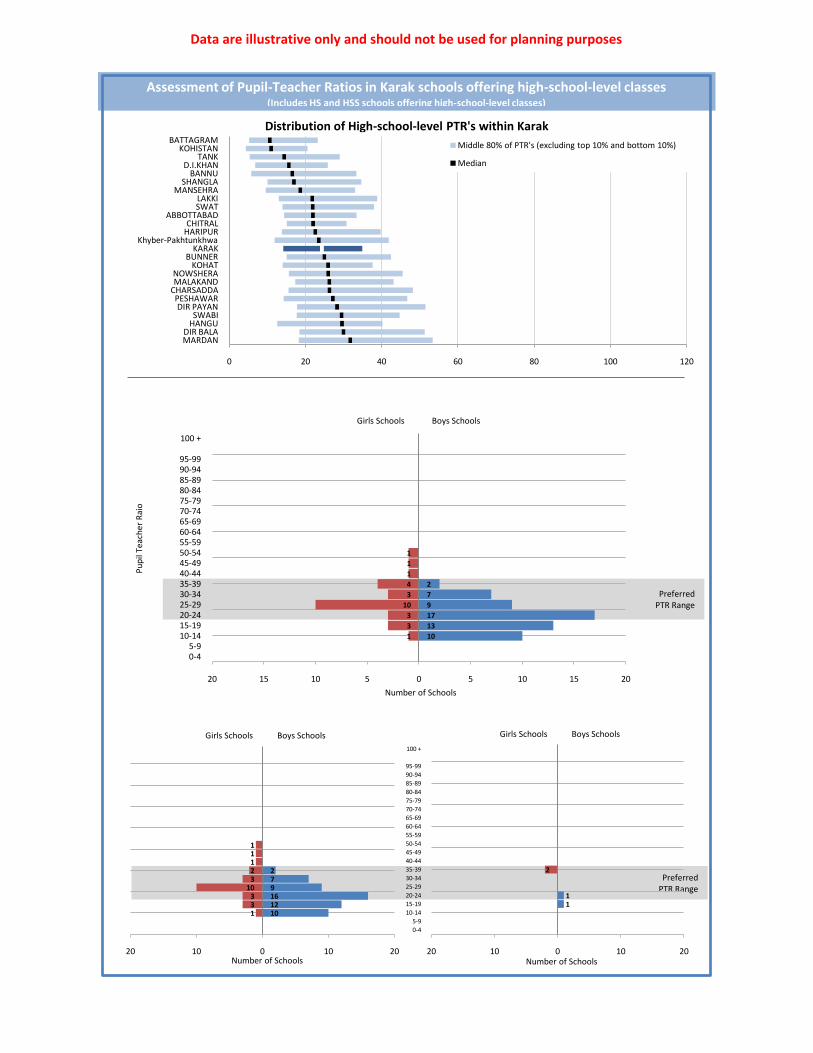
Assessment of Pupil-Teacher Ratios in Karak schools offering high-school-level classes
Projected Pupils, Teachers, and Teacher PayrollKarak - Middle Level
This page is reserved for Department of Education analysis and commentary regarding the contents of the adjacent page.
Projections shown on the adjacent page are based on the default constant-rate scenario. They do not reflect any educated adjustments to the model, and they are not endorsed by the
Department of Education.
Data are illustrative only and should not be used for planning purposes
PreferredPTR Range
Assessment of Pupil-Teacher Ratios in Karak schools offering high-school-level classes
Distribution of High-school-level PTR's within Karak
0 20 40 60 80 100 120
MARDANDIR BALA
HANGUSWABI
DIR PAYANPESHAWAR
CHARSADDAMALAKANDNOWSHERA
KOHATBUNNER
KARAKKhyber-Pakhtunkhwa
HARIPURCHITRAL
ABBOTTABADSWATLAKKI
MANSEHRASHANGLA
BANNUD.I.KHAN
TANKKOHISTAN
BATTAGRAMMiddle 80% of PTR's (excluding top 10% and bottom 10%)
Median
(Includes HS and HSS schools offering high-school-level classes)
11
2
20 10 0 10 20
0-4
5-9
10-14
15-19
20-24
25-29
30-34
35-39
40-44
45-49
50-54
55-59
60-64
65-69
70-74
75-79
80-84
85-89
90-94
95-99
100 +
Boys SchoolsGirls Schools
Number of Schools
101216972
133
1032111
20 10 0 10 20
Boys SchoolsGirls Schools
Number of Schools
PreferredPTR Range
10
13
17
9
7
2
1
3
3
10
3
4
1
1
1
20 15 10 5 0 5 10 15 20
0-45-9
10-1415-1920-2425-2930-3435-3940-4445-4950-5455-5960-6465-6970-7475-7980-8485-8990-9495-99
100 +
Boys SchoolsGirls Schools
Pu
pil
Teac
her
Rai
o
Number of Schools

Data are illustrative only and should not be used for planning purposes
Assessment of Pupil-Teacher Ratios in Karak schools offering high-school-level classes(Includes HS and HSS schools offering high-school-level classes)
This page is reserved for Department of Education analysis and commentary regarding the contents of the adjacent page.
Data are illustrative only and should not be used for planning purposes
2011
2012
2013
2014
2015
2010
2011
2012
2013
2014
2015
2010
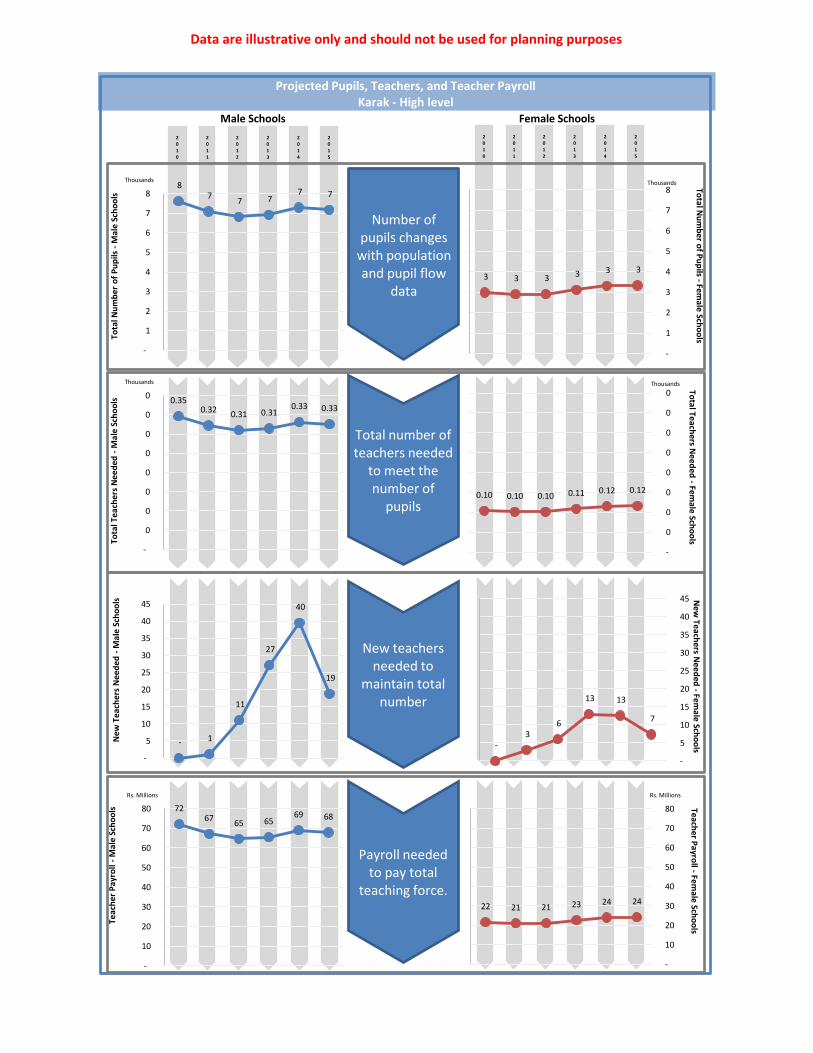
8 7
7 7 7 7
-
1
2
3
4
5
6
7
8
Thousands
0.350.32
0.31 0.310.33 0.33
-
0
0
0
0
0
0
0
0
Thousands
7267
65 6569 68
-
10
20
30
40
50
60
70
80
Rs. Millions
- 1
11
27
40
19
-
5
10
15
20
25
30
35
40
45
3 3 3 3 3 3
-
1
2
3
4
5
6
7
8 Thousands
0.10 0.10 0.10 0.11 0.12 0.12
-
0
0
0
0
0
0
0
0 Thousands
22 21 21 23 24 24
-
10
20
30
40
50
60
70
80
Rs. Millions
-3
6
13 13
7
-
5
10
15
20
25
30
35
40
45
Projected Pupils, Teachers, and Teacher PayrollKarak - High level
Female SchoolsMale SchoolsTo
tal N
um
ber
of
Pu
pils
-M
ale
Sch
oo
lsTo
tal T
each
ers
Nee
ded
-M
ale
Sch
oo
lsTo
tal Teachers N
eeded
-Fem
ale Scho
ols
Ne
w T
eac
her
s N
eed
ed -
Mal
e Sc
ho
ols N
ew Teach
ers Need
ed -
Fem
ale Scho
ols
Teac
her
Pa
yro
ll -
Mal
e S
cho
ols Teach
er Pa
yroll -
Female Sch
oo
lsTo
tal Nu
mb
er of P
up
ils -Fem
ale Scho
ols
Number of pupils changes
with population and pupil flow
data
Total number of teachers needed
to meet the number of
pupils
New teachers needed to
maintain total number
Payroll needed to pay total
teaching force.
Data are illustrative only and should not be used for planning purposes
Projected Pupils, Teachers, and Teacher PayrollKarak - High level
This page is reserved for Department of Education analysis and commentary regarding the contents of the adjacent page.
Projections shown on the adjacent page are based on the default constant-rate scenario. They do not reflect any educated adjustments to the model, and they are not endorsed by the
Department of Education.