data availability on rban transport and data … data availability... · of time may be calculated...
TRANSCRIPT

DATA AVAILABILITY ON URBAN TRANSPORT AND DATA COLLECTION
OPPORTUNITY
Jl. Merdeka Timur No. 5
Jakarta 10110
Telp : (+6221) 34833061, 34833065
Fax : (+6221) 34833061, 34833065
Email : [email protected]
http :// www.libangdanpustaka-dephub.go.id
Regional Meeting on Sustainable Urban Transportation Index
Jakarta, March 2nd, 2017
Presented by : Umiyatun Hayati Triastuti
DIRECTOR GENERAL of RESEARCH and DEVELOPMENT

Outline : A. Data Availability On Urban Transport
1. Sustainable Development and Sustainable Urban Transport
2. Key Challenges of Sustainable Development
3. Roadmap To Sustainable Urban Transport
4. Sustainable Approach for Urban Transport
5. The Challenge of Data Availability (1) : Transportation Planning Levels
6. The Challenge of Data Availability (2) : Decision Making Based On Data Availability For Sustainable Transport Development Plans and Management
7. The Challenge of Data Availability (3) : Barriers to Effective Urban Transport Planning & Management
8. The Challenge of Data Availability (4): Key for Successful Urban Transport Planning & Management
B. Data Collection Opportunity
1. Data and Transport Planning
2. Example : Data Collection and Transport Planning : OD Matric (1)
3. Example : Data Collection and Transport Planning : OD Matric (2)
4. The Problems of Data Collection with Traditional Approach
5. New Approach : Some Opportunities Of Data Collection : Phone Call Records as basis for O-D Matrices Data
6. Potential Data Resources in Indonesia (1): Cellular phone usage is Phenomenal
7. Potential Data Resources in Indonesia (2): Telephone Cellular Usage in Indonesia
8. The Opportunity Using Cellular for Data Collection
9. Case Study : Cellular Data Record For OD Survey In Indonesia - The opportunity using Cellular Data (1)
10. Case Study : Data Record For OD Survey In Indonesia - The opportunity using Cellular Data (2)
11. The Opportunity Using Cellular Data (1)
12. The Opportunity Using Cellular Data (2)

Sustainable development is to fulfill the people curent needs without destroying The next generation needs.
Sustainable developmnet focuses on three main goals :
1. Economically viable; 2. Socially-politically acceptable and
culturally sensitive; 3. Environmental friendly.
The sustainable development concept is formulazied to avoid urban sprawl (city/region expansions without proper formulation), that creates ineffisiency in daily life.
Sustainable Urban Transportation System:
1. Promoting people’s basic access needs safely and consistenly related to people health, environment, and ecosystem;
2. Avordable, efficiently running to provide modal transportation choices, and to support economic growth;
3. Limiting emition and waste, minimizing unrenewable resources consumption, recycling used goods, and minimizing land use as well as pollutions.
Sustainable Development and Sustainable Urban Transport
Environmental Social;
1 Economic;
2 Impact of Transport
3
Three Sustainable Urban Transportation Development Dimensions

Key Challenges of Sustainable Development
Increasing Urban Population vs public transportation need;
Growing Congestion;
Rising Energy consumption;
Increasing Air Pollution & CO2 emissions;
Adverse Health Effect;
Declining Road Safety.
Urbanisation and population growth;
City models;
Land use / people activity;
Policy of Planology Deconsentration and Regional Autonomy;
Economic Growth.
Key Challenges of Sustainable
Urban Development : Key Challenges of Sustainable
Urban Transport Development :

Roadmap To Sustainable Urban Transport
TECHNOLOGY REGULATION &
STANDARDS
TRAVELER
BEHAVIOR
PUBLIC
EDUCATION
MORE EFFICIENT
TRANSPORT
OPERATION
ALTERNATIVE
TRANSPORT
CHOICES
USE OF
ENVIRONMENT-
FRIENDLY ENERGY
BETTER PUBLIC
PERCEPTION &
PARTICIPATION
• HOV;
• Raiways;
• ITS;
• PT Priority;
• Traffic Rest.;
• TOD;
• Etc.
• Time of Travel;
• Mode;
• Route;
• Destination;
• Etc.
• Non-Motorized;
• Magnetic;
• Electric;
• Gas;
• Solar;
• Fuel cell;
• Etc.
• PT usage;
• Less car Travels;
• Car pool;
• Teleworking;
• Etc.
SUSTAINABLE TRANSPORTATION SYSTEM
Fulfilling Social, Economic, and Objectives
TOP DOWN BOTTOM UP
Po
licy
Str
ate
gy
Tech
niq
ue
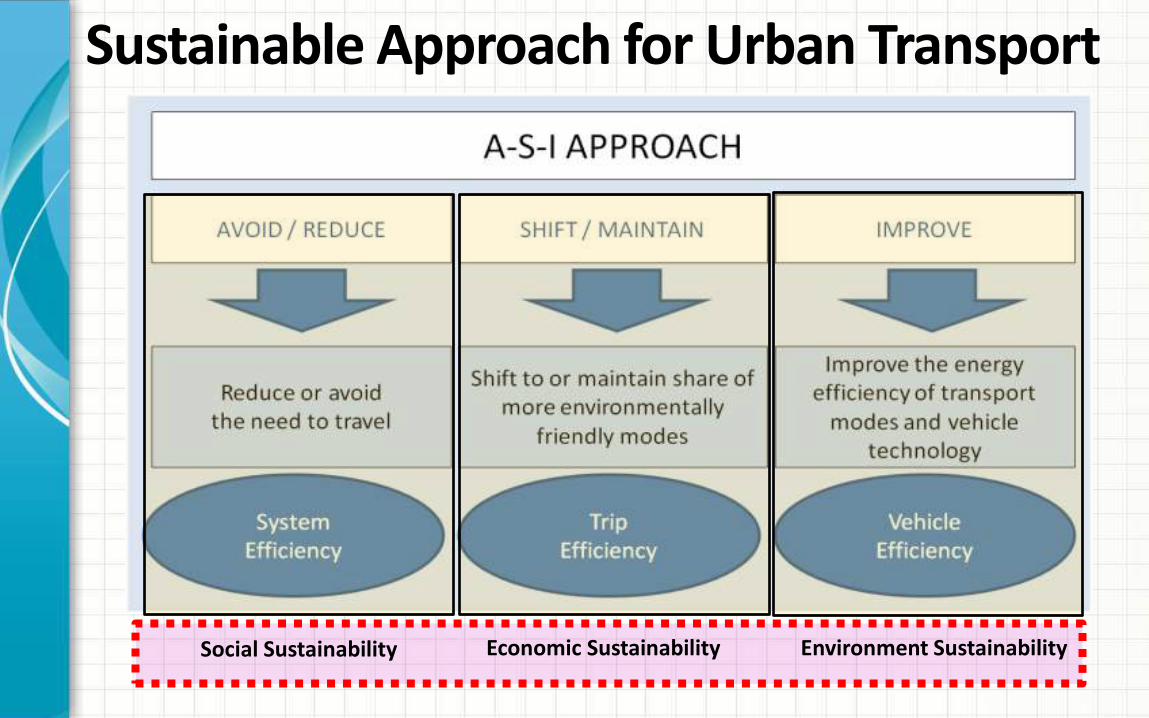
Sustainable Approach for Urban Transport
Social Sustainability Economic Sustainability Environment Sustainability

The Challenge of Data Availability (1) : Transportation Planning Levels
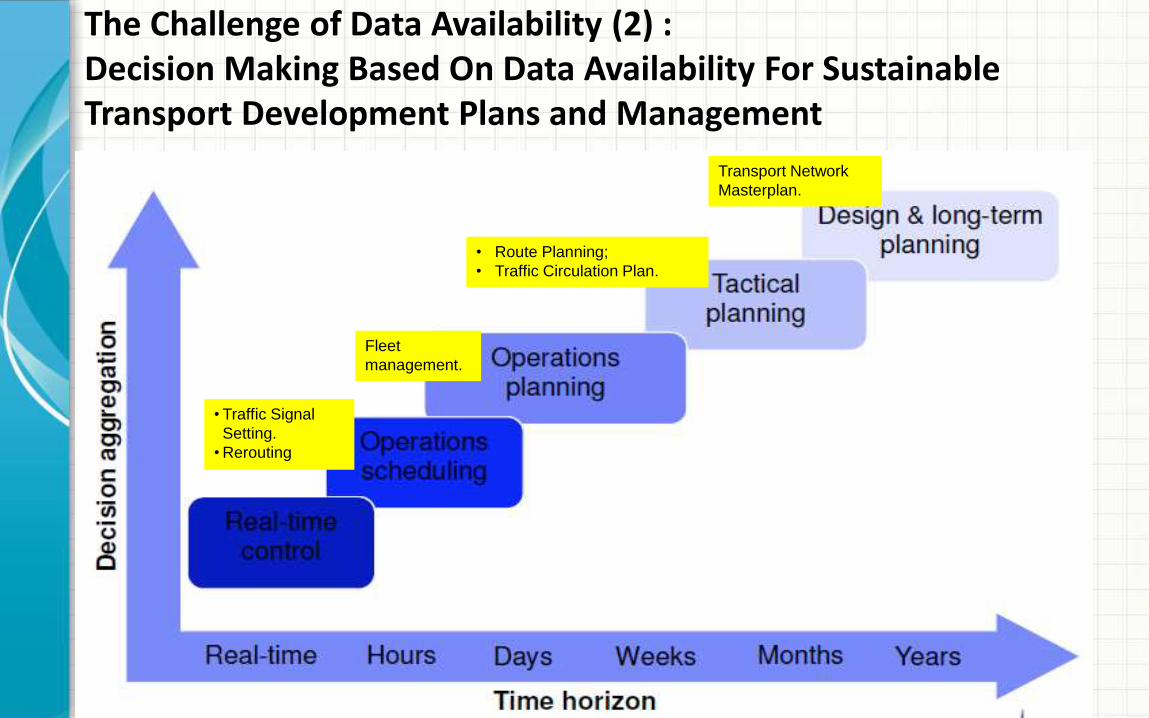
The Challenge of Data Availability (2) : Decision Making Based On Data Availability For Sustainable Transport Development Plans and Management
• Traffic Signal
Setting.
•Rerouting
Fleet
management.
• Route Planning;
• Traffic Circulation Plan.
Transport Network
Masterplan.

The Challenge of Data Availability (3) : Barriers to Effective Urban Transport Planning & Management
• Infrastructure investments on comprehensive requirement is still in ego sectoral approaches;
• The different condition : low hour-peak hour, real time-long term;
• Lack of capacity and coordination on adopting, implementing and developing comprehensive programs;
Lack of good data of transport demand, due to dynamic change on various dimension and external aspects.

The Challenge of Data Availability (4): Key for Successful Urban Transport Planning & Management
• A good and comprehensive transportation data Data on supply side and data on demand side.
• Full commitment from all stakeholders;
• A good Institutional Framework;
• A sufficient allocation of resources;

Data and Transport Planning
• The classical four-step system model for urban transportation planning and forecasting consists of trip generation, trip distribution, modal split, as well as traffic assignment (route choice);
Note :
• Basically, the construction of the O-D matrix represents the first step of the classical road traffic forecasting, i.e. trip generation and trip distribution. O-D flow estimation can be static or dynamic (Cremer, 1991; Willumsen, 1992) representing offline and online applications respectively;
• Nevertheless, in case of suitable quality and availability of historical observations, static O-D matrices can also properly characterize the typical daily variation of the traffic, i.e. by using time-sliced O-D matrices;

Example : Data Collection and Transport Planning : OD Matric (1)
• Data on origin–destination (OD) mobility represent one of the most sought after sources of information with a view to strategic planning and management of urban transport networks;
Note :
• On the basis of this information, organized in the form of OD matrices, an estimate of the number of people moving between different points of a given network over a given period of time may be calculated and a ‘mobility map’ drawn up;
• A precise calculation of such mobility matrices for mechanized transport is an essential tool to enable administrative authorities to optimize the use of their transportation networks, not only for the benefit of users on their daily journeys but also with a view to the investment required to adapt these infrastructures to envisaged future needs.

Example : Data Collection and Transport Planning :
OD Matric (2)
• O-D estimation can be done in a classical way : Household travel interviews, census survey data, or traffic counts represent traditional tools to estimate O-D flows;
• Interviews and surveys, however, are costly and conducted rarely;
• Automatic traffic count (e.g. loop detector, camera) is less expensive, however the count data alone are usually not sufficient to estimate reliable O-D matrix;
• The last element of the classical forecasting model is the route assignment which means the distribution of traffic among all related origin and destination zones or nodes.

The Problems of Data Collection with Traditional Approach
Traditional approaches of developing OD matrices rely on roadside and household
surveys, and/or traffic counts:
• Limited sample sizes;
• Prone to sampling biases and reporting errors;
• Lower update frequencies;
• High data collection cost.

New Approach : Some Opportunities Of Data Collection : Phone Call Records as basis for O-D Matrices Data
Using mobile phone call records offer a smart alternative;
Users leave footprints of their approximate locations when they make a call or send an SMS;
High penetration rate in developing as well as developed countries;
Very economic source of getting travel patterns.

Potential Data Resources in Indonesia (1):
Cellular phone usage is Phenomenal

Potential Data Resources in Indonesia (2): Telephone Cellular Usage in Indonesia

The Opportunity Using Cellular for Data Collection
More uptodate information of 'base
year' matrices;
Flexible survey schedule;
Less cost ;

Case Study : Cellular Data Record For OD Survey In Indonesia - The opportunity using Cellular Data (1)
1. In 2016 Badan Litbang Perhubungan in cooperation with Telkomsel initiated a project called ‘Selluler Data for Transportation‘;
2. It would also be possible to consider 'base year' matrices being updated on a more frequent basis than currently might be the case;
3. It provided a GSM dataset based on network positioning data originating from calls and SMS exchanges between millions of Telkomsel's customers in Indonesia;
4. This data set, which had been made anonymous, comprised more than 10 billion data records and to use this data to develop Origin Destination (O-D) Matrices;
5. Rising to this challenge, a consortium comprising Badan Litbang and BPTJ is formed to build 'the best possible' transport model of the Jabodetabek area using O-D Matrices data produced from CDR supplied by Telkomsel. An objective of the project was to develop a transport management system;
6. Furthermore, by using the origins and destinations from CDR produced by Telkomsel and traffic count dara it is possible to build average 0-D matrices for the morning and evening peaks, and all-day (24 hour) periods;
7. These matrices were assigned to the network using a traditional static assignment;

8. Using GSM data, the anonymous records from more than five million phones with on average a hundred contact moments per phone are processed. The data is aggregated into hourly origin-destination matrices and linked to traffic count data. In this way an estimate of the total population of O-D matrices is calculated;
9. The 'model' will be validated with some parameters related to the socio-economic characteristics of population or land use, so that the outputs do provide an insight into travel patterns across Jabodetabek area, and this gives us the potential to provide a modelling tool to test the effects of infrastructural changes in the relatively short term;
10. For transport modelling new data sources will become very important. Not just for validating O-D matrices estimated in a traditional way, but for a new way of transport modelling all together;
11. The project shows that, in Indonesia where the `conventional' data required for transport planning is virtually non-existent, new sources of data can be exploited to provide insight into travel behaviour that it would otherwise have been impossible to achieve;
12. The Jabodetabek project provided us with valuable experience for a new urban transport planning and management.
Case Study : Data Record For OD Survey In Indonesia - The opportunity using Cellular Data (2)

The Opportunity Using Cellular Data (1)
• Using GSM data, the anonymous records from more than five million phones with on average a hundred contact moments per phone are processed.
• The data is aggregated into hourly origin-destination (OD) matrices and linked to traffic count data. In this way an estimate of the total population of O-D matrices is calculated.
• The ‘model’ will be validated with some parameters related to the socio-economic characteristic of population or land use, so that the outputs do provide a modeling tool to test the effects of infrastructural changes in the relatively short term.

The Opportunity Using Cellular Data (2)
• For transport modeling new data sources will become very important. Not just for validating O-D matrices estimated in a traditional way, but for a new way of transport modeling all together.
• The project shows that, in Indonesia where the ‘conventional’ data required for transport planning is virtually non-existent, new sources of data can be exploited to provide insight into travel behavior, that it would otherwise have been impossible to achieve.
• The case study of The Jabodetabek project provided us with valuable experience for a new urban transport planning and management. In the future can be developed for covering the whole regions in Indonesia.
Thank you

Appendix

Origin-Destination (O-D) Matrices
Zone 1 Zone 2
Zone 3 Zone 4

O-D Matrices and Transportation Networks
Zona 1 Zona 2
Zona 4 Zona 3
1. O-D Matrices are
assigned to the
transport network;
2. The final results are
traffic volume on
the networks.
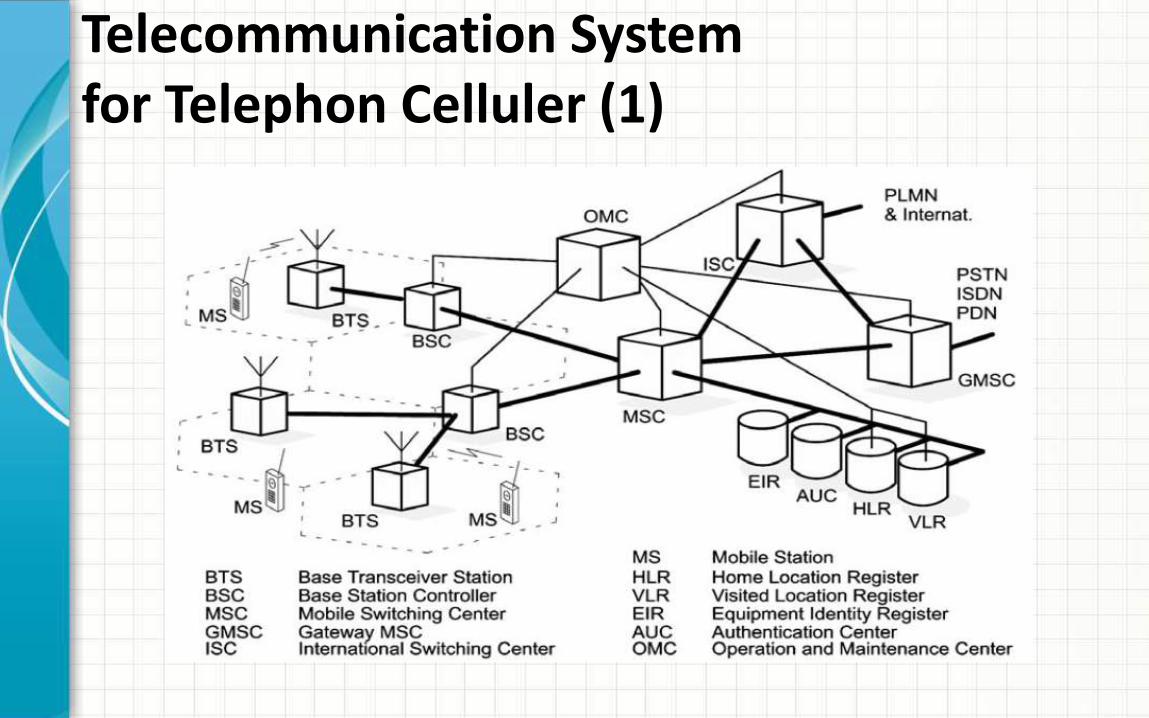
Telecommunication System for Telephon Celluler (1)

Telecommunication System for Telephon Celluler (2) 1. Each mobile phone is at all moments connected to a certain GSM cell site antenna (BTS);
2. The basic version only knows that a particular mobile phone is present, the more advanced cells know from what direction (angle) the phone is connecting to the cell antenna. This results in fairly accurate positioning of a phone;
3. When the phone moves, for example during a car ride, the mobile phone switches over from one cell to another cell;
4. Monitoring the movement of an anonymised mobile phone through the provider's network gives the desired data on mobility;
5. With such data, telecom providers can locate every cell-phone in their network and utilising this 'big data' in some relevant way;
6. There is the potential to extract some very useful information relating to the movements that people are making, so that an Origin-Destination (0-D) matrices can be extracted;
7. As a results, the cost of data collection would decrease and the accuracy of data and their validation would improve.

Zone 1
Zone 2
Zone 3
Zone Boundary
Zone Boundary
Trayektori line of movement
Position captured by CDR
Telecommunication System for Telephon Celluler (3)