data centre energy efficiency metrics - bcs.org · data centre energy efficiency metrics data...
TRANSCRIPT
Data centre energy efficiency metricsExisting and proposed metrics to provide effective understanding and
reporting of data centre energy
Liam Newcombe Data Centre Specialist Group
Data centre energy efficiency metrics http://dcsg.bcs.org
Data centre energy efficiency metrics 1
1 Introduction ........................................................................................................................ 2 2 Summary ........................................................................................................................... 6 3 Overview of metrics ......................................................................................................... 12 4 Data centre energy efficiency .......................................................................................... 15 5 Estimation of fixed and proportional overheads .............................................................. 31 6 Metrics when selecting data centres and equipment ...................................................... 37 7 Monitoring and measurement.......................................................................................... 40 8 Impact of external temperature on data centre efficiency ............................................... 44 9 Glossary........................................................................................................................... 50 10 Acknowledgements ......................................................................................................... 52 11 References ...................................................................................................................... 53
Data centre energy efficiency metrics http://dcsg.bcs.org
Data centre energy efficiency metrics 2
1 Introduction Whilst there is considerable coverage of IT energy use, despite the work of the European and other government agencies there is still little hard information on the total size, power consumption or efficiency of the data centre market. In the absence of this information it is difficult to defend the data centre industry, predict growth or set effective metrics and targets. To deal with these issues, properly understand the scale of the problem and deliver improvements it is essential that an initial set of measurements and metrics is agreed upon and data collection commenced on a large scale.
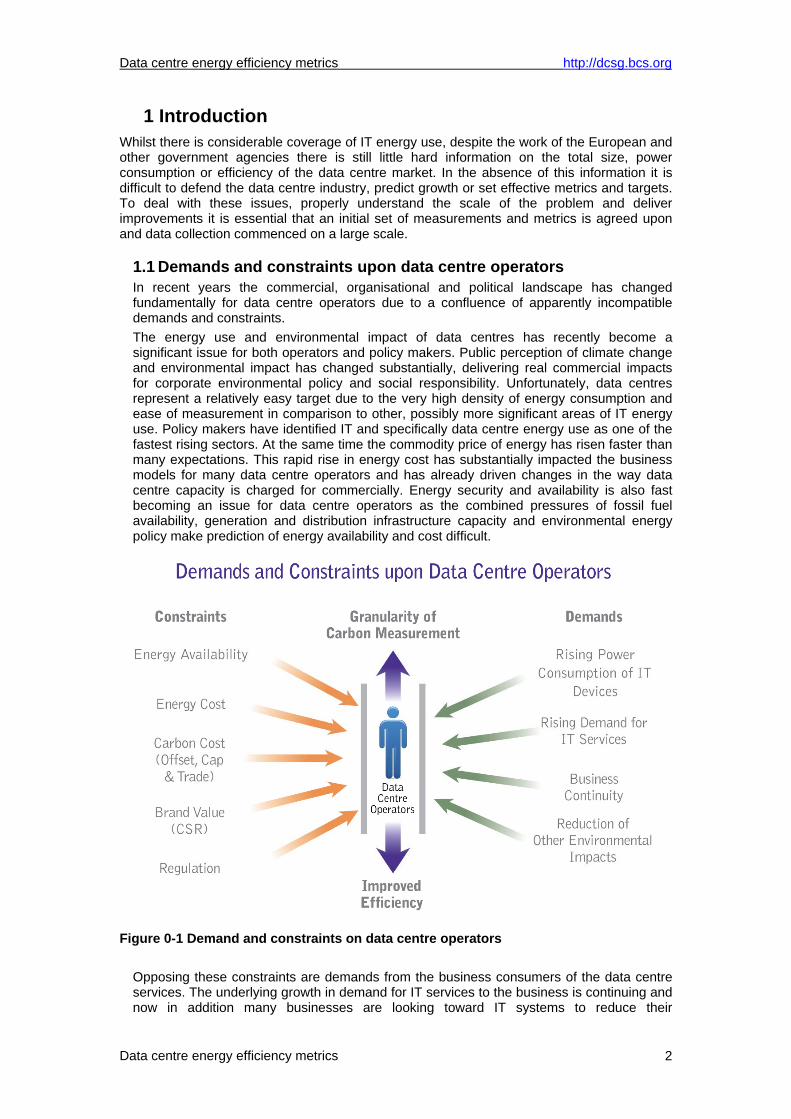
1.1 Demands and constraints upon data centre operators In recent years the commercial, organisational and political landscape has changed fundamentally for data centre operators due to a confluence of apparently incompatible demands and constraints. The energy use and environmental impact of data centres has recently become a significant issue for both operators and policy makers. Public perception of climate change and environmental impact has changed substantially, delivering real commercial impacts for corporate environmental policy and social responsibility. Unfortunately, data centres represent a relatively easy target due to the very high density of energy consumption and ease of measurement in comparison to other, possibly more significant areas of IT energy use. Policy makers have identified IT and specifically data centre energy use as one of the fastest rising sectors. At the same time the commodity price of energy has risen faster than many expectations. This rapid rise in energy cost has substantially impacted the business models for many data centre operators and has already driven changes in the way data centre capacity is charged for commercially. Energy security and availability is also fast becoming an issue for data centre operators as the combined pressures of fossil fuel availability, generation and distribution infrastructure capacity and environmental energy policy make prediction of energy availability and cost difficult.
Figure 0-1 Demand and constraints on data centre operators
Opposing these constraints are demands from the business consumers of the data centre services. The underlying growth in demand for IT services to the business is continuing and now in addition many businesses are looking toward IT systems to reduce their
Data centre energy efficiency metrics http://dcsg.bcs.org
Data centre energy efficiency metrics 3
environmental impact in other areas, e.g. logistics systems for a road transport or tele-commuting. As businesses have become more dependent upon IT services the requirements for availability and continuity of services have increased, multiplying the equipment requirements. This is a particular issue in sectors where regulators cover IT systems. A failure to understand the relationship between the falling capital cost of IT equipment and the rising costs of housing and powering it in the data centre is also creating capacity and financial problems for many operators1.
1.2 Metrics In this context of rising energy cost, energy security concerns, environmental pressure and business demand data centre operators will soon be targeted, measured, grouped or labelled by the efficiency of their facility. Many streams are currently underway both in the European Union and worldwide to develop and apply efficiency metrics; specifically this paper investigates the metrics suggested for the EU Data Centre Code of Conduct. The scope of the metrics discussed in this paper is restricted to the data centre mechanical and electrical infrastructure. These metrics do not reflect the efficiency with which IT services, the end product, are delivered to users. This is a clear end goal for a metrics development work streams and the capability to form part of a holistic set of system metrics is a core consideration.
1.2.1 Methodology The DCSG believes that for the industry to make real progress any data centre efficiency metric will need to be part of a measurement methodology designed to calculate a reasonable and fair approximation of the total environmental and financial cost of the service provision from the data centre.
1.2.2 Reporting measures and metrics Many parties have identified the need for measures or metrics to describe how efficiently a data centre transfers power from the source to the IT equipment and define what constitutes an IT load versus what is overhead. For example, the Green Grid have defined the PUE (Power Usage Effectiveness) and DCiE (Data Centre infrastructure Efficiency) metrics which have been useful in promoting both the understanding that there is an issue and enabling further discussion of what effective metrics would need to describe.
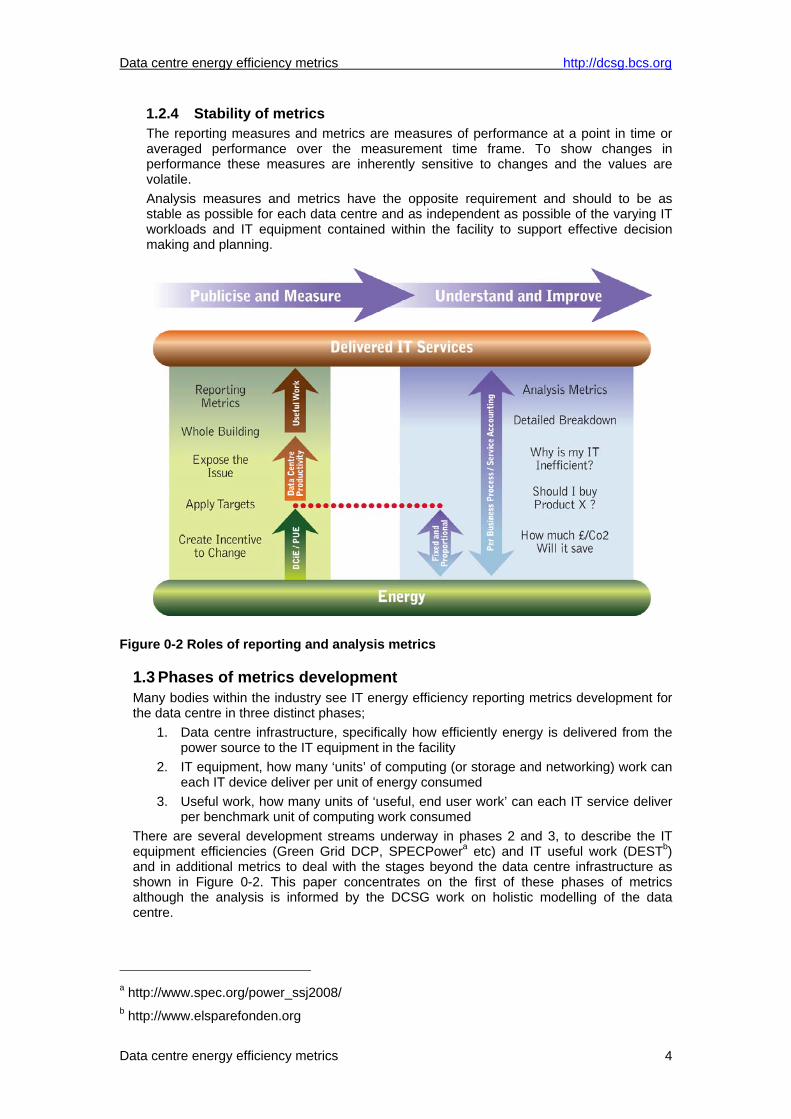
1.2.3 Analysis and diagnostic measures and metrics Whilst the DCiE metric approach is effective in providing initial recognition of a problem and helps justify the need to implement energy saving changes this is only half of the solution. Once the issues are recognised there is a requirement for analysis metrics and tools to determine why the efficiency is poor and to assist operators in selecting and making effective financial and environmental improvements. This relationship between reporting and analysis metrics is shown in Figure 0-2. The BCS Data Centre Specialist Group has investigated these issues, specifically in a European context and from the perspective of how the IT hardware interacts with the data centre (building) infrastructure. In this paper the DCSG will discuss more detailed proposed analysis metrics for operators that support detailed analysis and prediction of the impacts of changes, specifically we will present a breakdown analysis of DCiE as;
• Facility fixed overhead multiplier • Facility proportional overhead multiplier
These fixed and proportional metrics for the data centre are directly analogous to the finance concepts of fixed and variable cost and we will use them in a similar way to understand the real energy and cost behaviour of the data centre and how that impacts the cost and energy use of operating IT equipment within the data centre.
Data centre energy efficiency metrics http://dcsg.bcs.org
Data centre energy efficiency metrics 4
1.2.4 Stability of metrics The reporting measures and metrics are measures of performance at a point in time or averaged performance over the measurement time frame. To show changes in performance these measures are inherently sensitive to changes and the values are volatile. Analysis measures and metrics have the opposite requirement and should to be as stable as possible for each data centre and as independent as possible of the varying IT workloads and IT equipment contained within the facility to support effective decision making and planning.
Figure 0-2 Roles of reporting and analysis metrics
1.3 Phases of metrics development Many bodies within the industry see IT energy efficiency reporting metrics development for the data centre in three distinct phases;
1. Data centre infrastructure, specifically how efficiently energy is delivered from the power source to the IT equipment in the facility
2. IT equipment, how many ‘units’ of computing (or storage and networking) work can each IT device deliver per unit of energy consumed
3. Useful work, how many units of ‘useful, end user work’ can each IT service deliver per benchmark unit of computing work consumed
There are several development streams underway in phases 2 and 3, to describe the IT equipment efficiencies (Green Grid DCP, SPECPowera etc) and IT useful work (DESTb) and in additional metrics to deal with the stages beyond the data centre infrastructure as shown in Figure 0-2. This paper concentrates on the first of these phases of metrics although the analysis is informed by the DCSG work on holistic modelling of the data centre.
a http://www.spec.org/power_ssj2008/ b http://www.elsparefonden.org
Data centre energy efficiency metrics http://dcsg.bcs.org
Data centre energy efficiency metrics 5
1.4 Driving behavioural change through per service accounting To significantly reduce the environmental impact and inefficiency of current data centres and housed IT services the BCS DCSG believes that it is necessary to enable and drive change at the demand as well as the supply side of IT. The data centre only exists to house the IT equipment whose purpose is to deliver IT services to support the business processes of users or customers; it is not an end in itself. The BCS has been promoting the use of per service accounting since November 2007.
1.4.1 Relating IT or useful work to business value Even once metrics have been developed and the information required to calculate them captured there will still be an issue relating these to business value or using them for effective comparison of operators. How would we compare the value of a supercomputer modelling protein synthesis with an online auction site or sales of insurance policies?
1.4.2 Targeting demand Often facilities and IT departments have little control over the nature of the IT estate and facility that they manage. This is because most of the services delivered and supported and frequently the associated IT equipment are dictated by the business units they support. Finance systems for finance department, HR systems for HR department, etc. There have been a number of calls recently from pressure groups to make the IT department pay the power bill for the data centre with the view that this would solve the IT energy use problem. Unfortunately, applying targets, carbon taxes, incentives or regulations to the IT departments increases the pressure on the IT department but this will not necessarily translate effectively to changes in business policy as the IT department will have to individually ‘sell’ green solutions and change to each business unit. To effectively reduce the carbon footprint of IT we should apply the cost and therefore incentives to those who control or are responsible for the business processes and creating the IT demand. If we are to transfer the power or carbon bill it needs to go all the way to the consumer of the service to apply the behavioural change pressure at the most effective point.
1.4.3 Per service financial and environmental costs Many of the current approaches and metrics under development are intended to answer the question ‘what do I get out of my data centre for each unit of energy I put in?’. The DCSG proposes that the industry works instead towards metrics and models that can answer the question ‘what is the financial and environmental cost of each IT service that my data centre delivers to support a business process?’. Approaching the issue in this way allows businesses to account effectively for the rising overall cost of IT services (financial and environmental), rather than the coarse IT budget cost allocation formulas frequently used. The per-service cost accounting approach allows direct comparison of each IT service cost with its business benefit. A common example of why the business unit or owner should be targeted is the issue of retention of legacy systems, when an IT department requests permission to decommission an existing service the business owner frequently objects and the service is maintained. Where an external service provider is used the business unit will frequently bear the cost of this service directly, thus it is more likely to be decommissioned, virtualised, or archived to be made available if and when required. This issue will become more significant with the implementation of business carbon accounting where IT departments will have to justify their carbon budget alongside their financial budget. If internal IT departments can be assisted to achieve per-service cost and energy accounting the carbon and financial costs of each service can be effectively allocated to the business units responsible for them using an internal market model. This trend is already underway in the increased proportion of IT departments receiving their power bill and working to pass this on through internal accounting processes2.
Data centre energy efficiency metrics http://dcsg.bcs.org
Data centre energy efficiency metrics 6
2 Summary There has been considerable progress in the market in a relatively short time in identifying data centre efficiency reporting metrics. There is a general consensus developing that the devices directly involved in delivering the ‘useful work’ of the facility, that is the IT equipment, servers, storage, networking and appliances are the energy ‘targets’ and that any other consumption of energy such as power conditioning and distribution or cooling is overhead.
2.1 Recommendation to operators The DCSG recommends to facility operators that energy measurements be taken for their facility and a combination of the Green Grid DCiE and DCSG fixed and proportional overheads be used to report on and understand the efficiency of the facility. Operators who wish to achieve significant cost and carbon reduction should consider extending their capability to full simulation modelling using an open, independent tool such as that being developed by the BCS in partnership with the Carbon Trust3 as soon as possible.
2.1.1 DCiE reporting A time averaged (energy reading) DCiE can be used to report to senior management the current efficiency of a data centre in a form that can easily be understood “Our DCiE is 0.5, which means that only 50 percent of the power we paid for actually went to IT equipment”. This is the primary utility of the DCiE measure. The DCiE metric is not a fixed value for each data centre; it varies depending upon the IT electrical load, which is a variable and site specific function of the IT software, architecture, hardware, load and efficiency. Due to this variability the DCiE is not best suited to predicting the impact of changes to the data centre or IT and DCiE should be reported in the context of this caveat. DCiE is not a measure on which decisions or plans should be based.
2.1.2 Fixed and proportional overhead Whilst the DCiE provides a useful representation of the achieved efficiency of a data centre, operators also need a set of analysis metrics that can be used to understand the behaviour of the facility, its response to changes in M&E or IT equipment and the utility power used to operate the IT equipment it supports. To provide operators with an intuitive understanding of energy use the DCSG has found it useful to represent the energy use of a data centre in two parts, the fixed and proportional energy use as described in Section 4.6. The fixed energy use of a facility is the power that would still be drawn from the utility feed if all of the IT equipment were turned off (without reconfiguring the M&E equipment) whilst the proportional energy use is the power drawn in response to IT equipment electrical load. These metrics can be effectively used to determine the impact and ROI of changes such as consolidation and virtualisation programs as well as select or compare data centre facilities. The DCSG fixed and proportional overheads are reversible metrics and as stated in the introduction, part of a measurement methodology that extends beyond the data centre infrastructure which is designed to deliver per service cost and environmental accounting.
2.1.3 Estimating fixed and proportional losses The measurements required to determine fixed and proportional losses are the same as those to determine the time averaged DCiE, the utility power input and the IT power of the facility at a number of time points. The simple spreadsheet supplied with this paper can then estimate the fixed and proportional loss values for the facility as well as analysing and forecasting the DCiE.
2.1.4 Implement energy measurement tools now Due to the combined pressures of rising IT energy use, rising energy costs and rising impact of environmental considerations all operators should develop a program of energy

Data centre energy efficiency metrics http://dcsg.bcs.org
Data centre energy efficiency metrics 7
measurement for their facilities. This should, at the very minimum be independent metering of the utility power to the facility. There are many sources of variability to the energy use and efficiency of a data centre including the IT workload and external temperature. These can create quite significant differences in the measured efficiency of the facility at different times of day or year. For this reason it is important to measure the total energy used by the data centre and the total energy delivered to the IT equipment as a long term average as well as recording the individual data points to obtain useful information4.
2.1.5 Measurement frequency The two parameters of DCiE, utility electrical energy use and IT electrical energy use should be measured and logged on an hourly basis, even if this is only with temporary equipment for a few days each quarter. This provides the basic information necessary to understand the characteristics of the facility, both to determine the fixed overheads as described in Section 5 Estimation of fixed and proportional overheads.
2.1.6 IT electrical load and workload Information from the IT monitoring system should be used to compare hourly readings of IT electrical load with IT workload as described in Section 7.3. How effectively the IT electrical load tracks the applied workload provides useful information on the effectiveness of any power management capabilities, technologies or processes in use in the data centre. Many operators find that although equipment has power management capability this is not activated or working correctly and that reconfiguration can yield substantial benefits. This comparison is particularly relevant when old equipment is replaced to determine how well the new equipment delivers on power management promises.
2.1.7 Develop an energy measurement plan and approach A phased approach to energy measurement, leading to integrated IT and energy monitoring is described in section 7 Monitoring and .
2.1.8 Provision to the peak power of IT devices Operators should avoid the legacy approach of provisioning power and cooling to the nameplate power of IT devices. At a minimum, operators should move to provisioning for the as configured peak power of each IT device if not statistical or dynamic provisioning approaches.
2.2 Using metrics to understand marginal energy and cost With the increasing commercial focus on the energy cost component of IT services there is demand from IT management and business units to forecast the marginal energy cost of a change to IT systems. This may be a cost reduction in the case of a decommissioning or virtualisation program or a cost increase in the case of a new service.
2.2.1 DCiE As DCiE does not contain any data to separate fixed and variable costs it cannot give any useful information about the marginal energy or cost of new or reduced IT electrical load. As a combined, point measure the DCiE of the data centre will change under any significant change in load.
2.2.2 Fixed and proportional The proportional overhead measure gives a direct understanding of the marginal energy or cost of new or reduced IT electrical load.
Data centre energy efficiency metrics http://dcsg.bcs.org
Data centre energy efficiency metrics 8
2.3 Are the proposed metrics effective? To determine whether the proposed metrics are effective we will assess them both against their goals and under a range of common use cases to determine where they are effective in terms of reporting, targets, education, analysis and decision support.
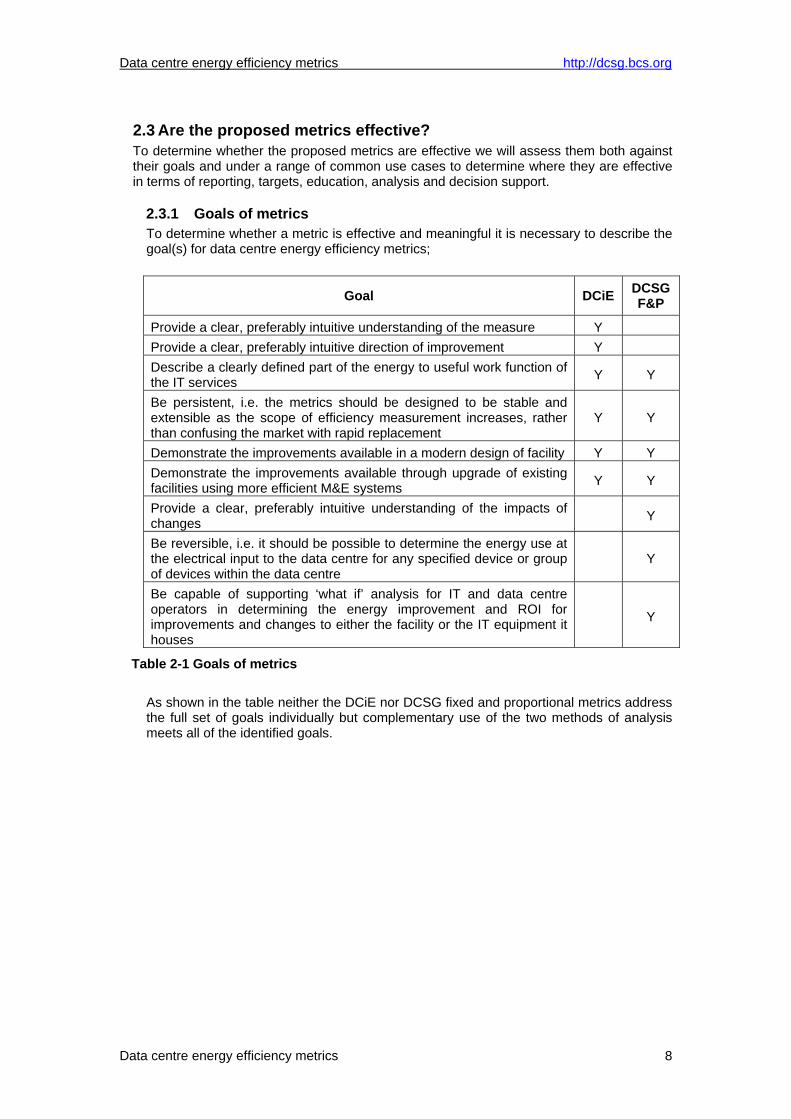
2.3.1 Goals of metrics To determine whether a metric is effective and meaningful it is necessary to describe the goal(s) for data centre energy efficiency metrics;
Goal DCiE DCSG F&P
Provide a clear, preferably intuitive understanding of the measure Y Provide a clear, preferably intuitive direction of improvement Y Describe a clearly defined part of the energy to useful work function of the IT services Y Y
Be persistent, i.e. the metrics should be designed to be stable and extensible as the scope of efficiency measurement increases, rather than confusing the market with rapid replacement
Y Y
Demonstrate the improvements available in a modern design of facility Y Y Demonstrate the improvements available through upgrade of existing facilities using more efficient M&E systems Y Y
Provide a clear, preferably intuitive understanding of the impacts of changes Y
Be reversible, i.e. it should be possible to determine the energy use at the electrical input to the data centre for any specified device or group of devices within the data centre
Y
Be capable of supporting ‘what if’ analysis for IT and data centre operators in determining the energy improvement and ROI for improvements and changes to either the facility or the IT equipment it houses
Y
Table 2-1 Goals of metrics As shown in the table neither the DCiE nor DCSG fixed and proportional metrics address the full set of goals individually but complementary use of the two methods of analysis meets all of the identified goals.
Data centre energy efficiency metrics http://dcsg.bcs.org
Data centre energy efficiency metrics 9
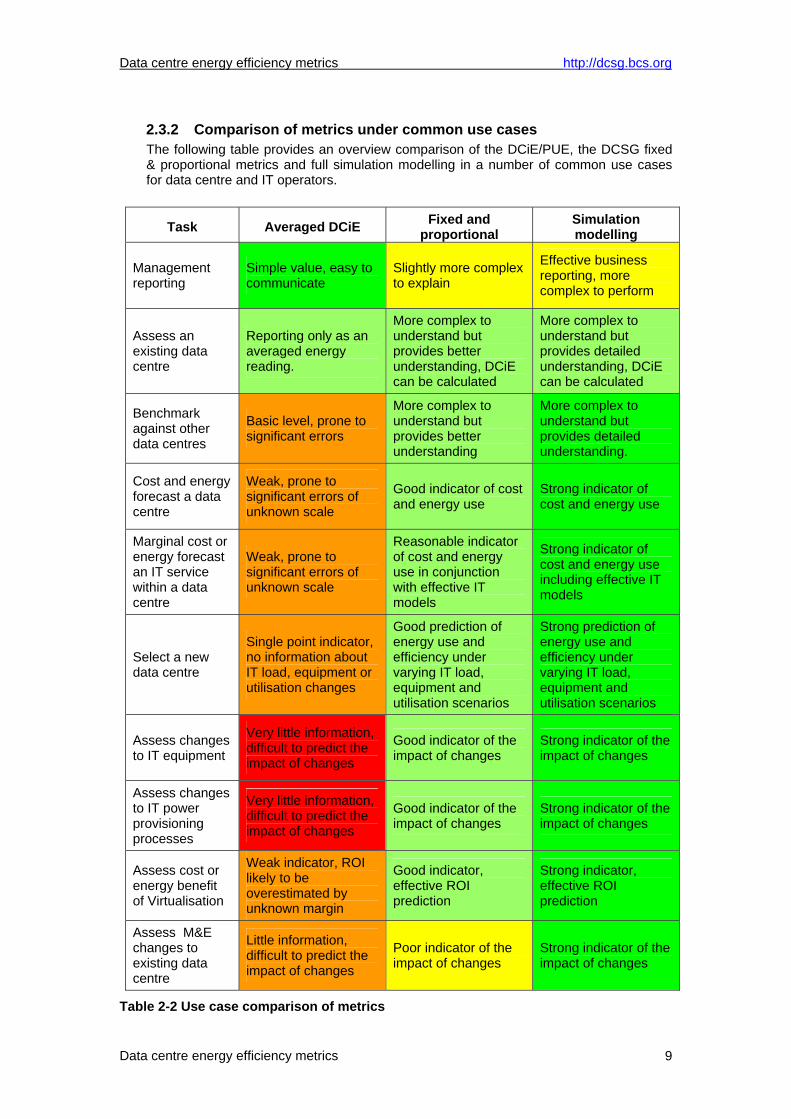
2.3.2 Comparison of metrics under common use cases The following table provides an overview comparison of the DCiE/PUE, the DCSG fixed & proportional metrics and full simulation modelling in a number of common use cases for data centre and IT operators.
Task Averaged DCiE Fixed and proportional
Simulation modelling
Management reporting
Simple value, easy to communicate
Slightly more complex to explain
Effective business reporting, more complex to perform
Assess an existing data centre
Reporting only as an averaged energy reading.
More complex to understand but provides better understanding, DCiE can be calculated
More complex to understand but provides detailed understanding, DCiE can be calculated
Benchmark against other data centres
Basic level, prone to significant errors
More complex to understand but provides better understanding
More complex to understand but provides detailed understanding.
Cost and energy forecast a data centre
Weak, prone to significant errors of unknown scale
Good indicator of cost and energy use
Strong indicator of cost and energy use
Marginal cost or energy forecast an IT service within a data centre
Weak, prone to significant errors of unknown scale
Reasonable indicator of cost and energy use in conjunction with effective IT models
Strong indicator of cost and energy use including effective IT models
Select a new data centre
Single point indicator, no information about IT load, equipment or utilisation changes
Good prediction of energy use and efficiency under varying IT load, equipment and utilisation scenarios
Strong prediction of energy use and efficiency under varying IT load, equipment and utilisation scenarios
Assess changes to IT equipment
Very little information, difficult to predict the impact of changes
Good indicator of the impact of changes
Strong indicator of the impact of changes
Assess changes to IT power provisioning processes
Very little information, difficult to predict the impact of changes
Good indicator of the impact of changes
Strong indicator of the impact of changes
Assess cost or energy benefit of Virtualisation
Weak indicator, ROI likely to be overestimated by unknown margin
Good indicator, effective ROI prediction
Strong indicator, effective ROI prediction
Assess M&E changes to existing data centre
Little information, difficult to predict the impact of changes
Poor indicator of the impact of changes
Strong indicator of the impact of changes
Table 2-2 Use case comparison of metrics
Data centre energy efficiency metrics http://dcsg.bcs.org
Data centre energy efficiency metrics 10
As before this table shows that a combination of metrics and methods is required to effectively support operators and improve the efficiency with which IT services are delivered.
2.4 Efficiency targets for data centres There have been a number of groups who have suggested that data centres or operators should be ranked, grouped or targeted using a metric of data centre efficiency. The DCSG has raised concerns regarding the use of DCiE targets for data centre operators as this presents the risk of mixed incentives, specifically, the installation of more efficient IT hardware is likely to reduce the measured DCiE efficiency.
2.4.1 Green Grid proposed DCiE ranking system The Green Grid recently proposed a ranking system for data centres based on their DCiE metric5, this ranged from recognised at a DCiE of 0.4 (PUE of 2.5) up to platinum for data centres achieving a DCiE of between 0.8 and 0.9 (PUE 1.25 – 1.11). This is a reasonable set of targets, not only differentiating between facilities on the basis of achieved efficiency but also providing some high targets to differentiate the best performing facilities.
2.4.2 Mixed incentives and weighting systems One issue with the DCiE is that, as the metric is not stable, it presents the risk of mixed incentives. Specifically, an operator carrying out an energy efficiency program and reducing their total IT electrical load will probably find their DCiE getting worse due to the impact of the fixed overheads of their facility. Some proposals contain a mechanism of weighted bonuses against the DCiE type measurement for operators who are impacted by this when reducing their IT electrical load. The DCSG argues that these mixed incentives are simply an aspect of the ranking system and that ranges of weightings will reduce the value of the rankings.
2.4.3 Resilience and ‘compensation’ factors Operators running higher resilience facilities of older design can suffer from higher fixed overheads and therefore lower efficiency. There have been suggestions that higher resilience facilities should have some ‘fudge factor’ applied to improve their efficiency score. There are many issues with this proposal;
• This weighting is unfair to operators who have taken the decision to build at lower resilience levels to improve their energy efficiency.
• We would not subsidise the capital cost of an operator choosing higher resilience, this is a cost versus requirements decision. Equally the efficiency penalty should remain as an incentive to only use effective and appropriate designs justified by the business requirements
• The combination of lower fixed losses in modern M&E equipment and modular deployment substantially reduces the efficiency penalty of 2N+ resilience
The DCSG rejects the proposal of weightings based on resilience level as it would substantially devalue any ranking system at the same time as creating greater mixed incentives than those described above.

Data centre energy efficiency metrics http://dcsg.bcs.org
Data centre energy efficiency metrics 11
2.4.4 Age of the facility The major differentiator in efficiency between facilities is the age of the facility and the M&E equipment installed. As there is a substantial embedded manufacturing and disposal energy cost in both the physical building and the infrastructure, ranking systems that reward building a new facility when the overall environmental impact is negative would be counterproductive. To mitigate these issues, if targets are to be set for operators then separate targets for existing and new build facilities should be set. These targets should then be progressively tightened based on reporting data from the market. This also creates an incentive for M&E component vendors and data centre builders to determine the embedded energy costs of their products to justify the replacement of old facilities on effective environmental grounds.
2.4.5 Geographic weighting During the review period for this paper the DCSG received a significant number of comments on the matter of Geographic weighting. The external ambient temperature and humidity can substantially affect the available efficiency of a data centre. Some operators who are already monitoring their energy efficiency have been able to show significant seasonal variations in their efficiency due to external temperature. See Figure 1 in “Enabling the Energy-Efficient Data Center”6 for an example of this. The fresh air and economised cooling technologies are particularly impacted as they require the external temperature to be lower than the set cooling plant temperature to operate in their high efficiency modes. Whilst some operators have flexibility in the location of their data centres this is not a general case, a Telecom operator for example has very little choice. Due to this issue there is considerable discussion over whether to apply external climate weighting factors to data centre infrastructure efficiency targets. The concern is that un weighted targets would unfairly penalise data centres in warmer climates This is essentially a policy rather than a technical matter, therefore the DCSG makes no recommendation.
2.4.6 DCSG recommendation The DCSG recommends that the DCiE metric be understood as a partial metric representing only the data centre infrastructure and that any ranking or targeting program be provisional until effective, holistic systems of metrics or models have been implemented. Weighting factors for level of resilience or improvement in overall IT electrical load are unnecessary and will weaken any target or ranking system. Operators should also separately report their total IT and Utility energy use, the components of the DCiE to show any changes in their IT and overall energy use.
Data centre energy efficiency metrics http://dcsg.bcs.org
Data centre energy efficiency metrics 12
3 Overview of metrics There is considerable opportunity for improvements in ICT and specifically data centre energy efficiency, in order to realise these potential improvements it is important to provide not only reporting measurements or targets but also analysis metrics and tools that assist operators in understanding their facility and the impacts of their choices.
In this section we discuss the scope of current metrics, the development path to holistic metrics and some of the issues with the DCiE metric, specifically why it is a reporting metric and should not be used to make decisions about a data centre or to build a business case for any data centre or IT changes.
3.1 Limited scope of metrics in this paper The metrics described in this document focus on the data centre building and the mechanical and electrical equipment housed within it. These efficiency measures and metrics are therefore not intended to be an effective description of the efficiency with which IT services are delivered from the facility and should not be mistaken for holistic metrics.
3.1.1 Comparing operators on data centre infrastructure metrics It is not possible to compare the ‘delivery efficiency’ of two operators based solely on their data centre infrastructure measurement. This is only one component of the delivery chain and does not reflect the efficiency achieved by the IT equipment, software or systems architecture.
3.1.2 Metrics considered In this paper we consider the current Green Grid metric, the data centre infrastructure Efficiency (DCiE) along with the proposed DCSG analysis metrics, the data centre fixed and proportional overheads.
3.2 Holistic IT efficiency metrics There is a clear goal for IT efficiency metrics to be able to report and predict the energy and financial costs of delivering IT services to the user base as described in the introduction. Both business cost modelling and internal or external carbon markets will require this level of capability to deliver effective management information about IT services. This goal requires data centre infrastructure analysis metrics that are reversible and independent of the IT equipment to determine the total energy use of an IT device or devices within the measured data centre.
3.2.1 Chained component level metrics There have been a number of chains of individual, single value, measures and metrics proposed to indicate the efficiencies of the various layers of the IT delivery, software efficiency, IT hardware utilisation, IT hardware efficiency and data centre efficiency. Some of these have proposed that the product of the component metrics is descriptive of the overall efficiency. The DCSG argues that this is a flawed approach and should be avoided by operators as the results are at best misleading. These metrics are particularly weak in any form of economic analysis and should not be used to try and determine marginal cost. The BCS DCSG has demonstrated by holistic system modelling that these ‘layers’ interact in a more complex way than is captured in these single value layered metrics.
3.3 Why we need analysis metrics in addition to reporting metrics Effective sets of metrics should educate and inform the data centre operator and provide enough information to predict the cost and energy impacts of equipment, load or process
Data centre energy efficiency metrics http://dcsg.bcs.org
Data centre energy efficiency metrics 13
changes. Once reporting metrics such as DCiE have identified an efficiency issue we require metrics with analysis capabilities to enable operators to make the practical decisions required in selecting a new, or improving the efficiency of an existing, data centre.
3.3.1 Why fixed and proportional overhead metrics? Fixed overhead drives an understanding of the committed power to a facility. High fixed overhead facilities should be upgraded, partially decommissioned or filled as close to capacity as possible to minimise the impact of the fixed losses. Proportional overhead provides the understanding of how the utility energy use will vary with the IT equipment energy use, specifically what reductions can be expected if the IT electrical load is reduced. Fixed and proportional overhead scalars provide a more intuitive understanding of the facility efficiency to operators, particularly where modular provisioning is used and these scalars change incrementally as infrastructure is installed or enabled.
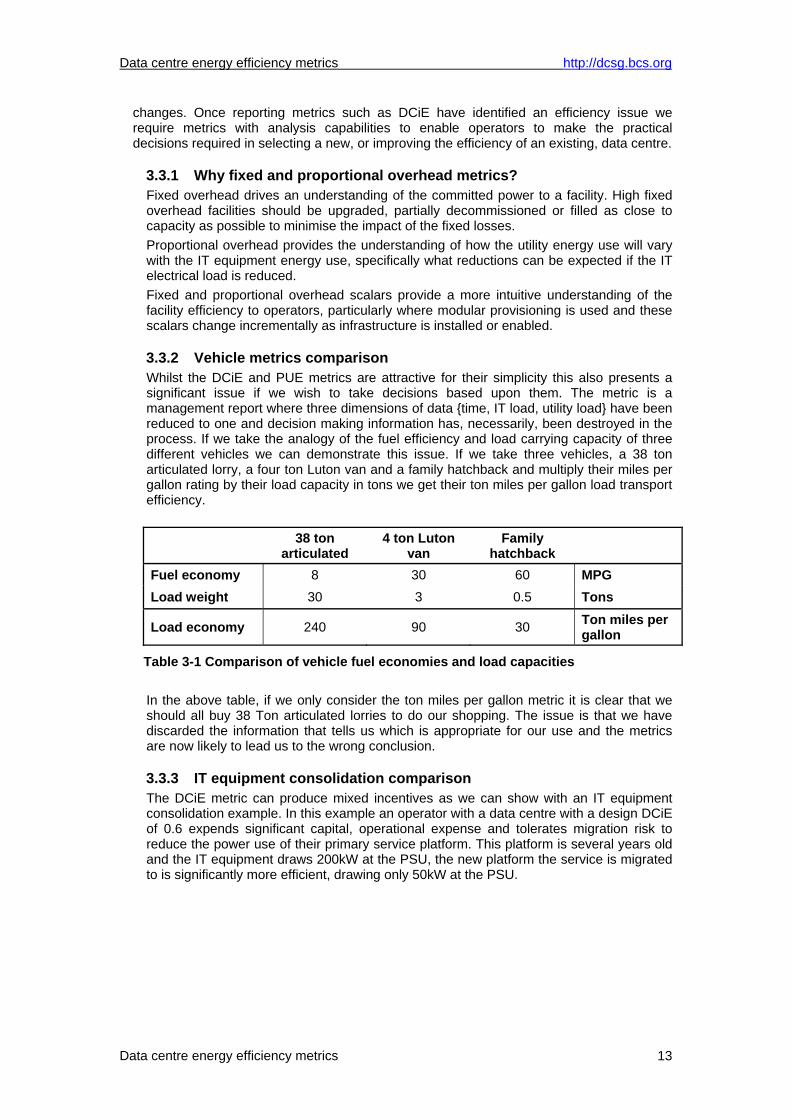
3.3.2 Vehicle metrics comparison Whilst the DCiE and PUE metrics are attractive for their simplicity this also presents a significant issue if we wish to take decisions based upon them. The metric is a management report where three dimensions of data {time, IT load, utility load} have been reduced to one and decision making information has, necessarily, been destroyed in the process. If we take the analogy of the fuel efficiency and load carrying capacity of three different vehicles we can demonstrate this issue. If we take three vehicles, a 38 ton articulated lorry, a four ton Luton van and a family hatchback and multiply their miles per gallon rating by their load capacity in tons we get their ton miles per gallon load transport efficiency.
38 ton articulated
4 ton Luton van
Family hatchback
Fuel economy 8 30 60 MPG Load weight 30 3 0.5 Tons
Load economy 240 90 30 Ton miles per gallon
Table 3-1 Comparison of vehicle fuel economies and load capacities In the above table, if we only consider the ton miles per gallon metric it is clear that we should all buy 38 Ton articulated lorries to do our shopping. The issue is that we have discarded the information that tells us which is appropriate for our use and the metrics are now likely to lead us to the wrong conclusion.
3.3.3 IT equipment consolidation comparison The DCiE metric can produce mixed incentives as we can show with an IT equipment consolidation example. In this example an operator with a data centre with a design DCiE of 0.6 expends significant capital, operational expense and tolerates migration risk to reduce the power use of their primary service platform. This platform is several years old and the IT equipment draws 200kW at the PSU, the new platform the service is migrated to is significantly more efficient, drawing only 50kW at the PSU.
Data centre energy efficiency metrics http://dcsg.bcs.org
Data centre energy efficiency metrics 14
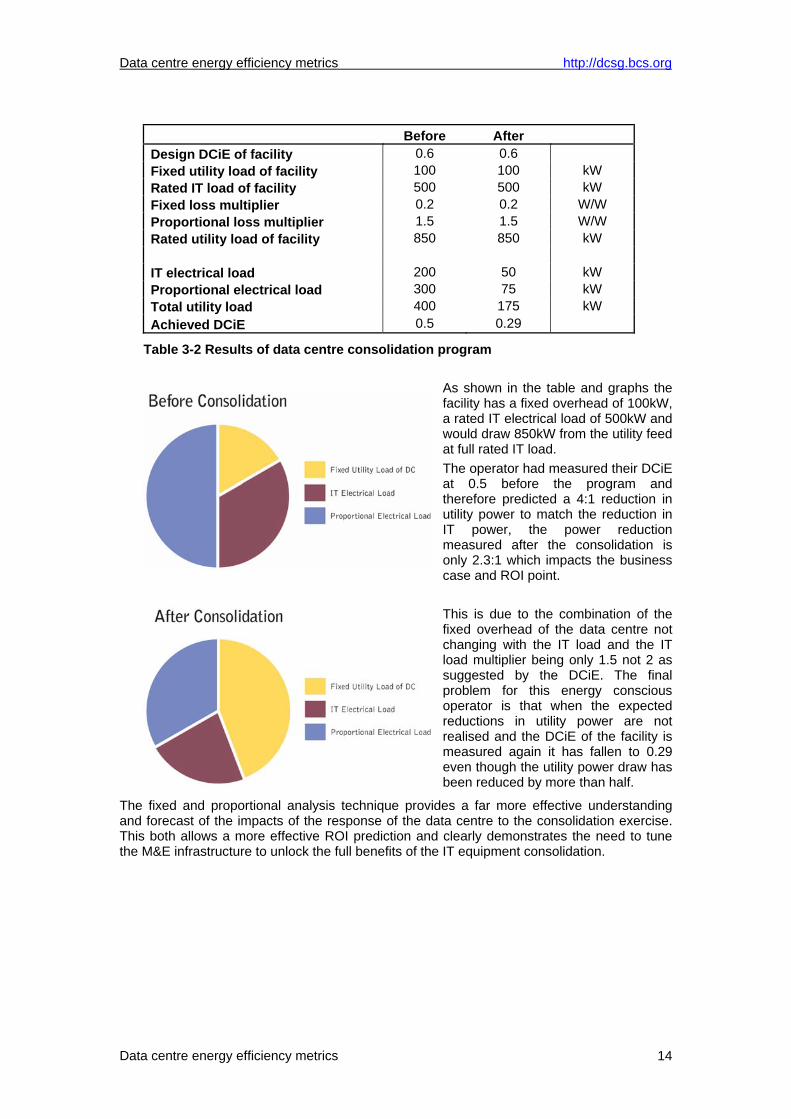
Before After Design DCiE of facility 0.6 0.6 Fixed utility load of facility 100 100 kW Rated IT load of facility 500 500 kW Fixed loss multiplier 0.2 0.2 W/W Proportional loss multiplier 1.5 1.5 W/W Rated utility load of facility 850 850 kW IT electrical load 200 50 kW Proportional electrical load 300 75 kW Total utility load 400 175 kW Achieved DCiE 0.5 0.29
Table 3-2 Results of data centre consolidation program
As shown in the table and graphs the facility has a fixed overhead of 100kW, a rated IT electrical load of 500kW and would draw 850kW from the utility feed at full rated IT load. The operator had measured their DCiE at 0.5 before the program and therefore predicted a 4:1 reduction in utility power to match the reduction in IT power, the power reduction measured after the consolidation is only 2.3:1 which impacts the business case and ROI point.
This is due to the combination of the fixed overhead of the data centre not changing with the IT load and the IT load multiplier being only 1.5 not 2 as suggested by the DCiE. The final problem for this energy conscious operator is that when the expected reductions in utility power are not realised and the DCiE of the facility is measured again it has fallen to 0.29 even though the utility power draw has been reduced by more than half.
The fixed and proportional analysis technique provides a far more effective understanding and forecast of the impacts of the response of the data centre to the consolidation exercise. This both allows a more effective ROI prediction and clearly demonstrates the need to tune the M&E infrastructure to unlock the full benefits of the IT equipment consolidation.
Data centre energy efficiency metrics http://dcsg.bcs.org
Data centre energy efficiency metrics 15
4 Data centre energy efficiency A key part of national Market Transformation Programs and the EU Code of Conduct for Data Centres is to create effective incentives and reporting measures for the efficient use of energy in IT. It has been identified that a measure of data centre to IT equipment energy transfer efficiency is key to driving understanding of the energy and cost inefficiencies in current data centres and thus key to changing the behaviour of IT operators.
4.1 Power use in the data centre The data centre is a complex environment that is designed to house IT equipment. Utility power entering the data centre has to pass through a number of stages of voltage transformation, distribution and cleaning before finally being delivered to the IT equipment. Most of the power used within the facility is converted to heat, requiring significant cooling system capacity which draws an additional load in a traditional, recirculating air data centre. There are also a number of ancillary support systems in the data centre such as lighting, generator pre-heaters, fire suppression systems as well as human occupied areas which also require electrical power.
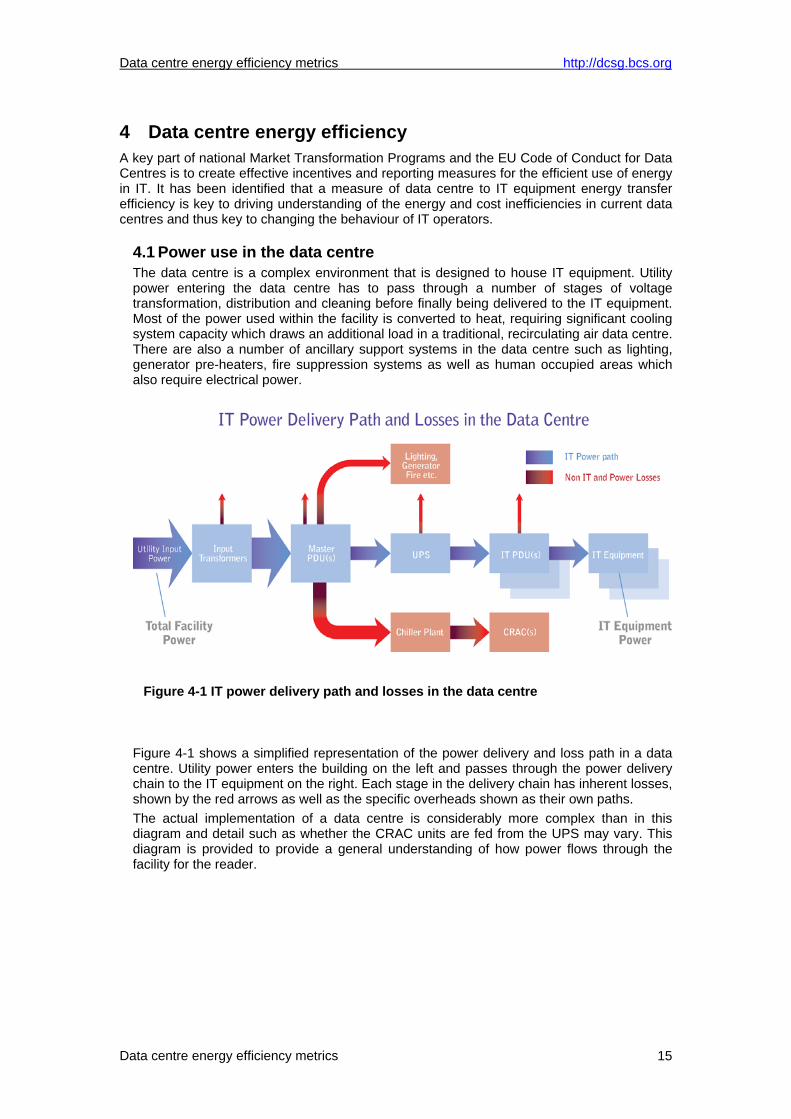
Figure 4-1 IT power delivery path and losses in the data centre
Figure 4-1 shows a simplified representation of the power delivery and loss path in a data centre. Utility power enters the building on the left and passes through the power delivery chain to the IT equipment on the right. Each stage in the delivery chain has inherent losses, shown by the red arrows as well as the specific overheads shown as their own paths. The actual implementation of a data centre is considerably more complex than in this diagram and detail such as whether the CRAC units are fed from the UPS may vary. This diagram is provided to provide a general understanding of how power flows through the facility for the reader.
Data centre energy efficiency metrics http://dcsg.bcs.org
Data centre energy efficiency metrics 16
4.2 Green Grid data center infrastructure efficiency metric The metric that is currently used in the working draft of the EU CoC is a version of the data center infrastructure efficiency (DCiE) metric originally recommended by the Green Grid. This metric has been selected as it does not consider the IT equipment or software efficiency for which we do not yet have metrics or units and as such offers the possibility of comparing the data centre buildings. This metric concentrates on the proportion of the utility electrical load presented by the data centre that is delivered to the IT equipment housed by that facility. In the EU Code of Conduct the measurements are of energy consumed per month rather than instantaneous power readings.
4.2.1 DCiE definition The Data Center infrastructure efficiency metric is defined as the fraction of the IT equipment power divided by the total facility power;
PowerFacility TotalPowerEquipment IT
=DCiE
The total facility power is defined as the power measured at the incoming utility meter. The IT equipment power is defined as the power consumed by the IT equipment supported by the data centre as opposed to the power delivery and cooling components and other miscellaneous loads. For a full description of DCiE see the Green Grid paper on DCiE and PUE7. There is a view that devices such as KVM switches and monitors represent overhead and not “devices directly involved in delivering the useful work output of the facility”. The DCSG supports this view in principle and agrees that such devices should, when reporting granularity allows, be excluded from the IT equipment power part of the calculation.
4.2.2 Power usage effectiveness The PUE metric is simply the reciprocal of the DCE metric;
PowerEquipment ITPowerFacility Total1
==DCE
PUE
Data centre energy efficiency metrics http://dcsg.bcs.org
Data centre energy efficiency metrics 17
4.3 Data centre IT power to utility power relationship As described above, in order to understand, measure or model the overall energy efficiency of a data centre it is necessary to understand the relationship between electrical load of the housed equipment and the utility power the facility draws to power and cool the housed equipment. The power used by the IT equipment in a data centre is delivered through a series of power conditioning and distribution devices, each of these exhibits inefficiency and thus a certain amount of power is lost. As this equipment is typically housed within the data centre these losses, converted to heat, add to the heat output from the IT equipment. This total thermal output must then be handled by the HVAC systems. The graph in Figure 4-2 shows a power transfer function for a 2N+1 resilient (Tier 4) data centre with a rated 1MW IT load. The power drawn by the data centre from the Utility feed is determined by taking the IT power draw and then applying sequence the losses of each component within the mechanical and electrical infrastructure. In this relatively simple model the inefficiency loss of each component is composed of three factors;
• Fixed losses, devices such as the CRACs and UPS have a fixed load component as soon as they are turned on, before any IT equipment is supported. For example in a UPS there is the battery charge maintenance power.
• Proportional losses, these losses are proportional to the load drawn through the device. In a chiller this would be the compressor pumps that switch on and off dependent upon the cooling load.
• Square law losses, these are frequently RI 2 electrical losses which are proportional to the square of the current carried. This type of loss occurs, for instance, in transformers and cabling.
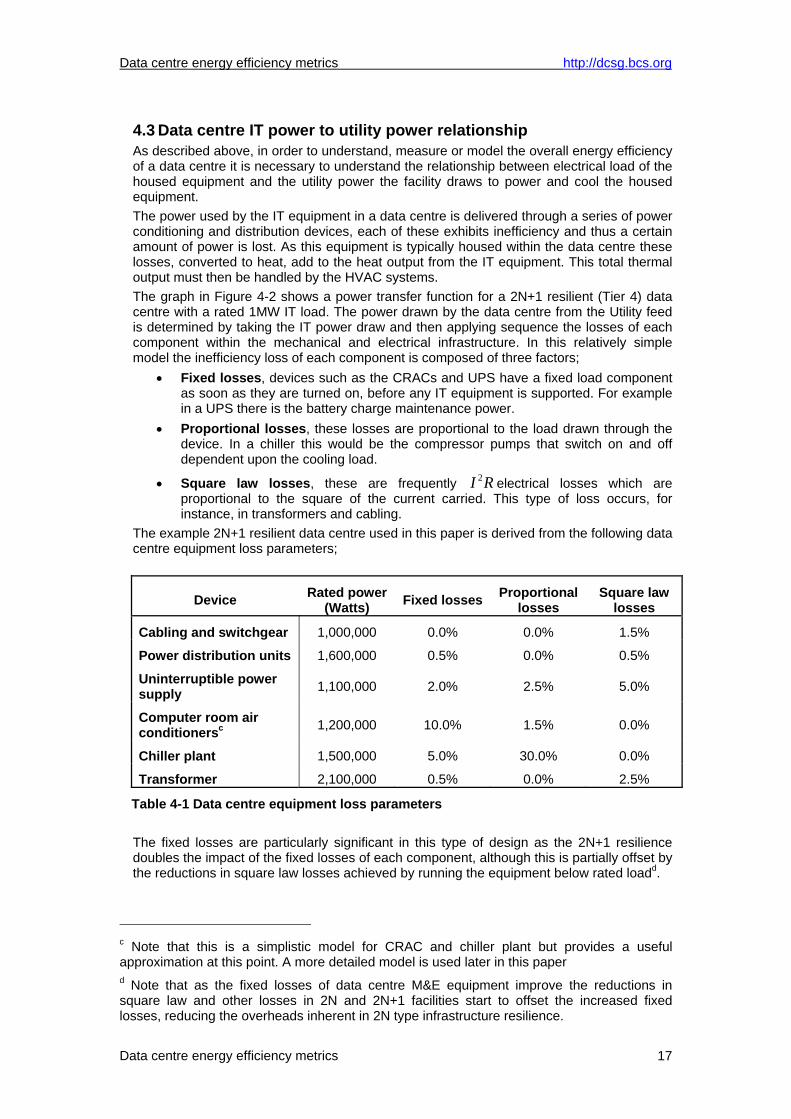
The example 2N+1 resilient data centre used in this paper is derived from the following data centre equipment loss parameters;
Device Rated power (Watts) Fixed losses Proportional
losses Square law
losses
Cabling and switchgear 1,000,000 0.0% 0.0% 1.5%
Power distribution units 1,600,000 0.5% 0.0% 0.5%
Uninterruptible power supply 1,100,000 2.0% 2.5% 5.0%
Computer room air conditionersc 1,200,000 10.0% 1.5% 0.0%
Chiller plant 1,500,000 5.0% 30.0% 0.0%
Transformer 2,100,000 0.5% 0.0% 2.5%
Table 4-1 Data centre equipment loss parameters The fixed losses are particularly significant in this type of design as the 2N+1 resilience doubles the impact of the fixed losses of each component, although this is partially offset by the reductions in square law losses achieved by running the equipment below rated loadd.
c Note that this is a simplistic model for CRAC and chiller plant but provides a useful approximation at this point. A more detailed model is used later in this paper d Note that as the fixed losses of data centre M&E equipment improve the reductions in square law and other losses in 2N and 2N+1 facilities start to offset the increased fixed losses, reducing the overheads inherent in 2N type infrastructure resilience.

Data centre energy efficiency metrics http://dcsg.bcs.org
Data centre energy efficiency metrics 18
Figure 4-2 Data centre overall power transfer function
The graph shows the increasing power requirements at each stage of the delivery chain, note that due to the fixed loads in the delivery chain such as UPS battery maintenance power and CRAC fan power the data centre would draw a significant proportion of its peak power even if all of the IT equipment were turned off. For instance, the figure above shows that at zero IT electrical load the data centre would draw around 670kW.
4.3.1 Fixed overheads drive proportional overheads It is not only the fixed load overheads that impact the fixed load power draw at zero IT electrical load. The fixed load overheads of devices in the power and cooling chains, such as the UPS create an electrical load upon their parent devices as well as heat and therefore drive further proportional and square law losses in the power and cooling systems, increasing the zero load fixed overhead beyond that of the individual fixed losses.
4.3.2 Chiller efficiency and external temperature Most data centre HVAC systems are impacted by both the internal and external air temperatures. The efficiency of the chiller pumps typically improves as the external temperature falls. This is particularly significant where air or water side economisers or fresh air cooling systems are used to reduce cooling energy use. The analysis presented in this section uses an averaged external temperature for simplicity. Section 8 examines the impacts of external temperature in more detail.
4.3.3 Reductions in fixed overhead through operator actions The graph in Figure 4-2 does not represent the reductions in fixed overhead that can be achieved in a data centre that is only partially filled where CRAC units or other M&E infrastructure components may be turned off in unoccupied areas. However, it does provide a reasonable representation for the purposes of evaluating the impact of lower power or variable power equipment replacement programs within an existing facility. There are very substantial efficiency gains possible in a partially occupied data centre from such measures as well as modular UPS and chiller systems that are scaled as IT equipment is installed. These measures are investigated later in this paper. See “Electrical Efficiency Modelling of Data Centers”8 for a more detailed analysis and description of these loss functions.

Data centre energy efficiency metrics http://dcsg.bcs.org
Data centre energy efficiency metrics 19
4.4 DCiE & PUE metrics The data centre modelled in 4.3 would achieve a DCiE of 0.5 or a PUE of 2.0 at the full 1MW rated IT load. This, of course is unlikely to ever be achieved as this would require that the facility IT electrical load be 100 percent of the rated IT electrical load. This would require that the facility be fully provisioned at the IT equipment peak power rating, not nameplate power ratings and that all IT equipment be at full power draw simultaneously which would normally be recognised as a failure in capacity planning.
IT electrical load DCiE PUE
0% 0.00 5996226.8 5% 0.07 13.4 10% 0.14 7.4 15% 0.19 5.4 20% 0.23 4.4 25% 0.27 3.8 30% 0.30 3.4 35% 0.32 3.1 40% 0.35 2.9 45% 0.37 2.7 50% 0.39 2.6 55% 0.40 2.5 60% 0.42 2.4 65% 0.43 2.3 70% 0.44 2.3 75% 0.45 2.2 80% 0.46 2.2 85% 0.47 2.1 90% 0.48 2.1 95% 0.49 2.0
100% 0.50 2.0
Table 4-2 Data centre DCiE and PUE by IT electrical load As shown in the table above and the graphs below, both the DCiE (Figure 4-3) and the PUE (Figure 4-4) are non linear functions and are significantly influenced by the IT electrical load in the data centre.
Figure 4-3 Data centre infrastructure efficiency by IT electrical load
Data centre energy efficiency metrics http://dcsg.bcs.org
Data centre energy efficiency metrics 20
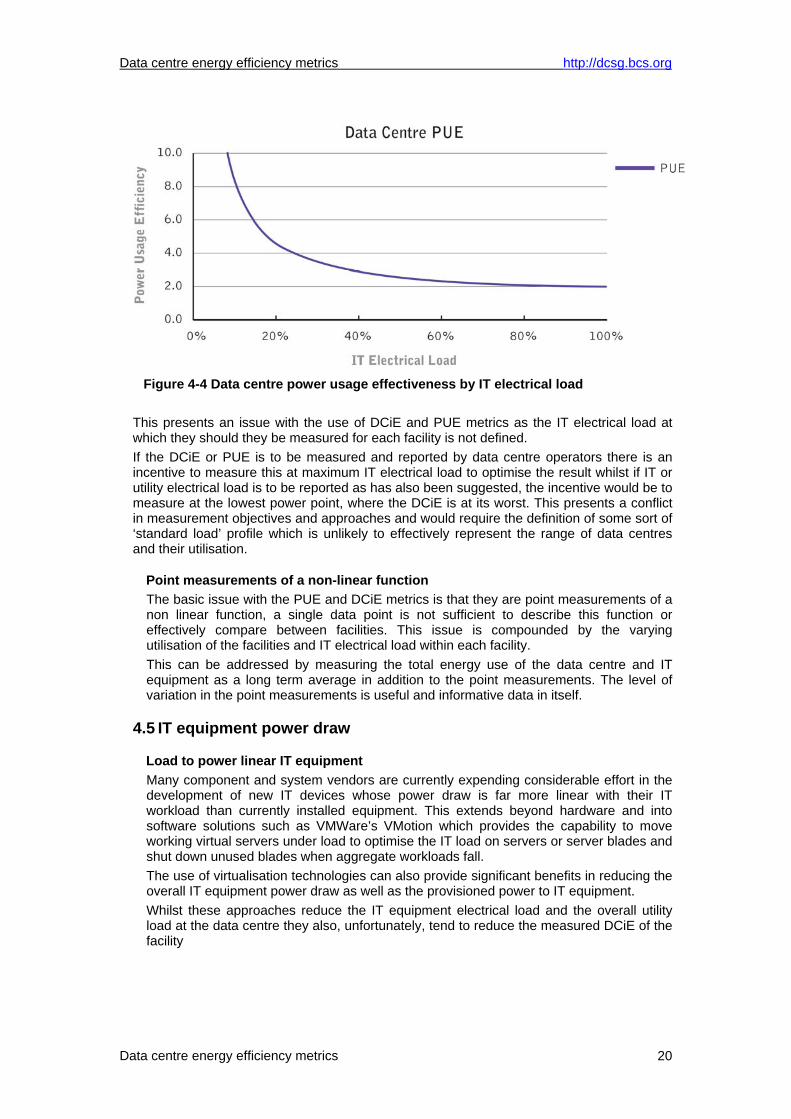
Figure 4-4 Data centre power usage effectiveness by IT electrical load
This presents an issue with the use of DCiE and PUE metrics as the IT electrical load at which they should they be measured for each facility is not defined. If the DCiE or PUE is to be measured and reported by data centre operators there is an incentive to measure this at maximum IT electrical load to optimise the result whilst if IT or utility electrical load is to be reported as has also been suggested, the incentive would be to measure at the lowest power point, where the DCiE is at its worst. This presents a conflict in measurement objectives and approaches and would require the definition of some sort of ‘standard load’ profile which is unlikely to effectively represent the range of data centres and their utilisation.
Point measurements of a non-linear function The basic issue with the PUE and DCiE metrics is that they are point measurements of a non linear function, a single data point is not sufficient to describe this function or effectively compare between facilities. This issue is compounded by the varying utilisation of the facilities and IT electrical load within each facility. This can be addressed by measuring the total energy use of the data centre and IT equipment as a long term average in addition to the point measurements. The level of variation in the point measurements is useful and informative data in itself.
4.5 IT equipment power draw
Load to power linear IT equipment Many component and system vendors are currently expending considerable effort in the development of new IT devices whose power draw is far more linear with their IT workload than currently installed equipment. This extends beyond hardware and into software solutions such as VMWare’s VMotion which provides the capability to move working virtual servers under load to optimise the IT load on servers or server blades and shut down unused blades when aggregate workloads fall. The use of virtualisation technologies can also provide significant benefits in reducing the overall IT equipment power draw as well as the provisioned power to IT equipment. Whilst these approaches reduce the IT equipment electrical load and the overall utility load at the data centre they also, unfortunately, tend to reduce the measured DCiE of the facility
Data centre energy efficiency metrics http://dcsg.bcs.org
Data centre energy efficiency metrics 21
Variable IT electrical load As these new generation devices are installed by data centre operators the IT electrical load will become more variable, spanning a larger minimum and maximum power consumption range and exacerbating the problem of measuring overall data centre performance with a single point measure such as DCiE.
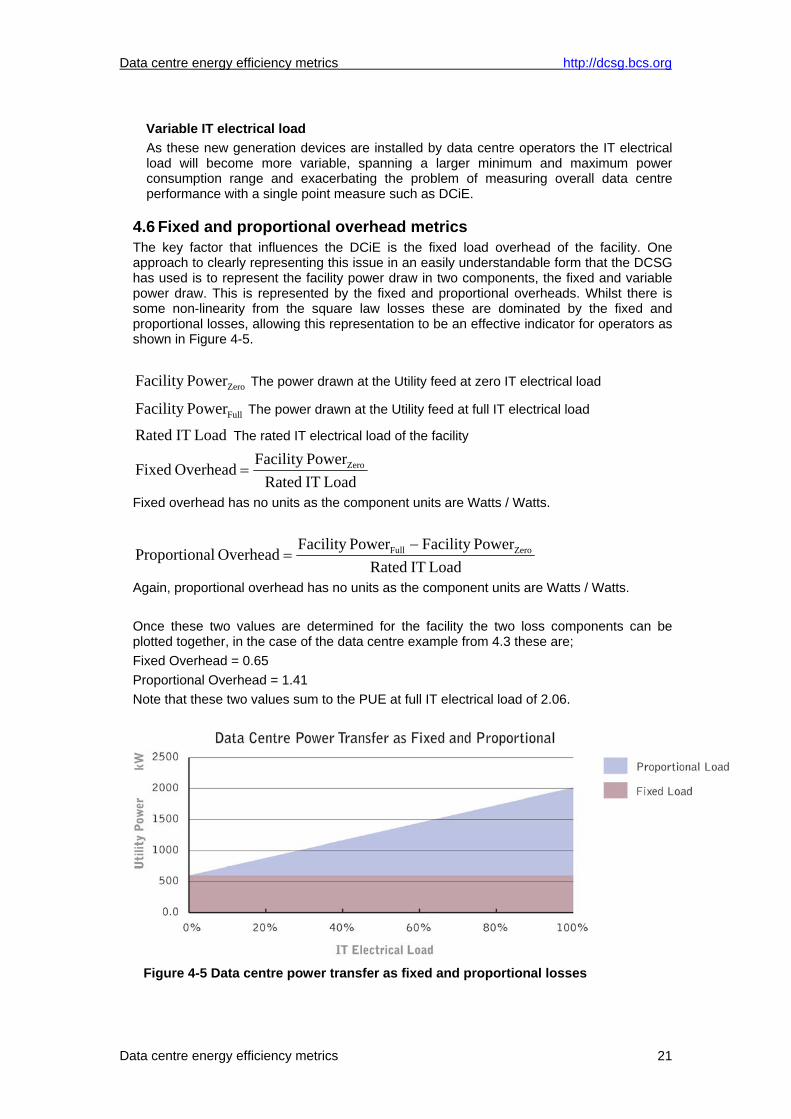
4.6 Fixed and proportional overhead metrics The key factor that influences the DCiE is the fixed load overhead of the facility. One approach to clearly representing this issue in an easily understandable form that the DCSG has used is to represent the facility power draw in two components, the fixed and variable power draw. This is represented by the fixed and proportional overheads. Whilst there is some non-linearity from the square law losses these are dominated by the fixed and proportional losses, allowing this representation to be an effective indicator for operators as shown in Figure 4-5.
ZeroPowerFacility The power drawn at the Utility feed at zero IT electrical load
FullPowerFacility The power drawn at the Utility feed at full IT electrical load
Load IT Rated The rated IT electrical load of the facility
Load IT RatedPowerFacility
Overhead Fixed Zero=
Fixed overhead has no units as the component units are Watts / Watts.
LoadITRatedPowerFacility PowerFacility
Overhead alProportion ZeroFull −=
Again, proportional overhead has no units as the component units are Watts / Watts. Once these two values are determined for the facility the two loss components can be plotted together, in the case of the data centre example from 4.3 these are; Fixed Overhead = 0.65 Proportional Overhead = 1.41 Note that these two values sum to the PUE at full IT electrical load of 2.06.
Figure 4-5 Data centre power transfer as fixed and proportional losses

Data centre energy efficiency metrics http://dcsg.bcs.org
Data centre energy efficiency metrics 22
Slope and intercept measurement of the power transfer function By considering the data centre overheads to be formed of a fixed and proportional component we are able to approximate the power draw of the facility in terms of the IT power draw with the two values of fixed overhead (intercept) and proportional overhead (slope). Whilst there are non-linear elements in the proportional power function these are dominated by the linear elements. The linear proportional overhead is a useful estimator to the true variable overhead as it provides an effective first-cut analysis and prediction of the data centre behaviour. If additional accuracy is required then a full simulation model such as that being developed by the BCS3 should be used.
4.7 IT equipment provisioned power and facility fixed overhead When IT equipment is installed into a data centre power and cooling are provisioned or set aside for that equipment. This is typically for the nameplate, or power supply maximum of the equipment although this practice is being superseded by provisioning to the peak power draw of the device in its installed configuration. As each facility has a maximum total IT electrical load capacity, the power and cooling provisioned to each device represents a proportion of this facility capacity and therefore can be considered to represent a proportion of the facility fixed overhead. Our analysis shows that in many existing facilities the fixed power overhead allocated to a server exceeds its peak PSU power draw and can become the dominant factor in the server energy use and cost.
Fixed overhead as a motivator to change provisioning processes Representing this allocation of the fixed overheads in terms of the provisioned power to the device is also an effective motivator to operators who are still nameplate power provisioning to change their processes as there is a direct cost and energy benefit from doing so as well as being able to fully utilise the rated IT electrical capacity of the facility.
4.8 IT device power under data centre overheads The second significant use for data centre efficiency metrics is to allow operators to understand the utility electrical load that an IT device such as a server is responsible for. This will be of particular significance in the EU once carbon accounting and carbon cap and trade mechanisms come into force as both IT departments and service providers will be pushed toward carbon and cost accounting of the IT services they deliver.
IT Device power characteristics For this example we will choose a commodity x86 1U rack server representative of those from major manufacturers. This is a typical corporate server for a single application deployment with two x86 processors and 2 local hard disks, although the power characteristics are unsurprisingly similar to a dual processor blade.
Server power data Server provisioned power (nameplate) 700 Watts Server zero IT workload power 200 Watts Server peak power 350 Watts
Table 4-3 Server power data This server exhibits a fairly high minimum power though there are many significant and useful efforts already underway within the industry to reduce this and produce devices that exhibit a far more linear relationship between IT workload and PSU power draw as described in 4.5.
Data centre energy efficiency metrics http://dcsg.bcs.org
Data centre energy efficiency metrics 23
4.8.1 IT device utility electrical load The PSU power draw value is not sufficient to determine the overall energy used by an IT device in delivering a service, for either device comparison or carbon accounting purposes. What is necessary is to be able to determine the utility electrical load the device is responsible for within the data centre housing it. This can be approximated by breaking the device power into two components, the fixed and proportional power draws at the utility feed.
PowerDrawn PSU Overhead alProportion Draw Utility alProportionPower dProvisione Overhead Fixed Draw Utility Fixed×=
×=
These two values can then be summed for any workload value to determine the utility electrical load required to power and cool the server in the data centre.
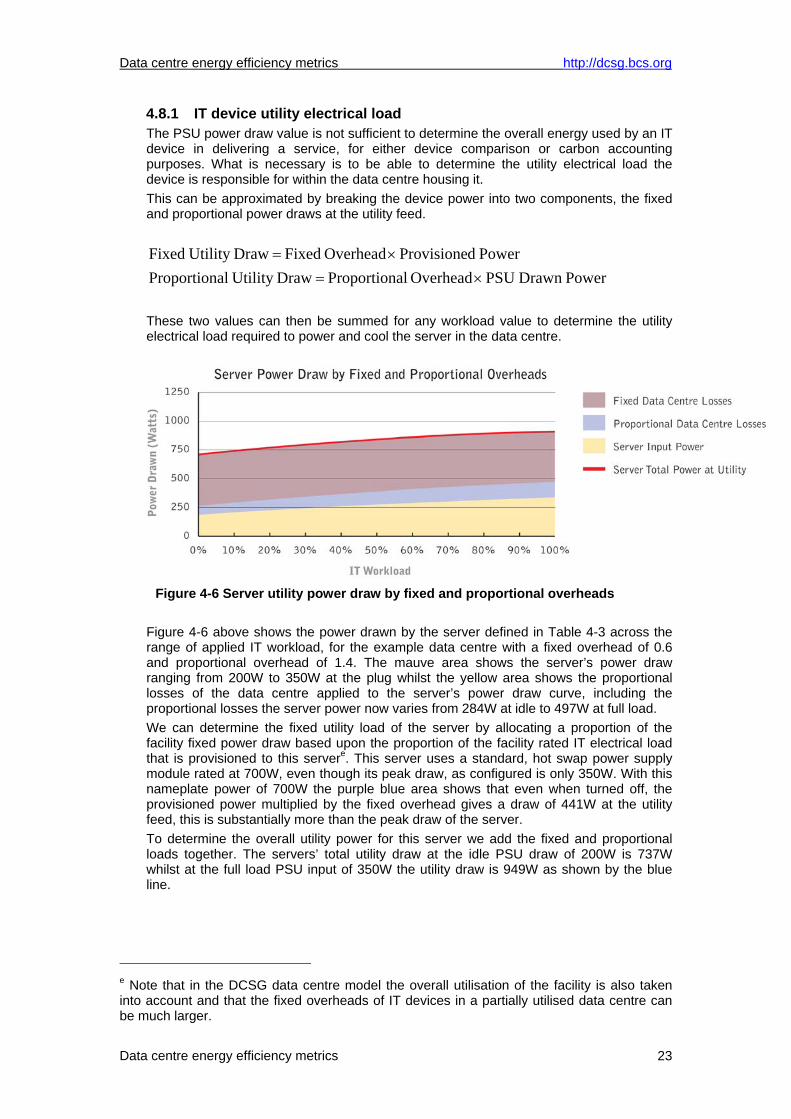
Figure 4-6 Server utility power draw by fixed and proportional overheads
Figure 4-6 above shows the power drawn by the server defined in Table 4-3 across the range of applied IT workload, for the example data centre with a fixed overhead of 0.6 and proportional overhead of 1.4. The mauve area shows the server’s power draw ranging from 200W to 350W at the plug whilst the yellow area shows the proportional losses of the data centre applied to the server’s power draw curve, including the proportional losses the server power now varies from 284W at idle to 497W at full load. We can determine the fixed utility load of the server by allocating a proportion of the facility fixed power draw based upon the proportion of the facility rated IT electrical load that is provisioned to this servere. This server uses a standard, hot swap power supply module rated at 700W, even though its peak draw, as configured is only 350W. With this nameplate power of 700W the purple blue area shows that even when turned off, the provisioned power multiplied by the fixed overhead gives a draw of 441W at the utility feed, this is substantially more than the peak draw of the server. To determine the overall utility power for this server we add the fixed and proportional loads together. The servers’ total utility draw at the idle PSU draw of 200W is 737W whilst at the full load PSU input of 350W the utility draw is 949W as shown by the blue line.
e Note that in the DCSG data centre model the overall utilisation of the facility is also taken into account and that the fixed overheads of IT devices in a partially utilised data centre can be much larger.
Data centre energy efficiency metrics http://dcsg.bcs.org
Data centre energy efficiency metrics 24
4.8.2 Prediction of IT device power savings Another key use for any data centre power transfer efficiency metric is to assist in forecasting the energy use and cost of operating an IT device as well as the savings available from new, lower power or power linear equipment.
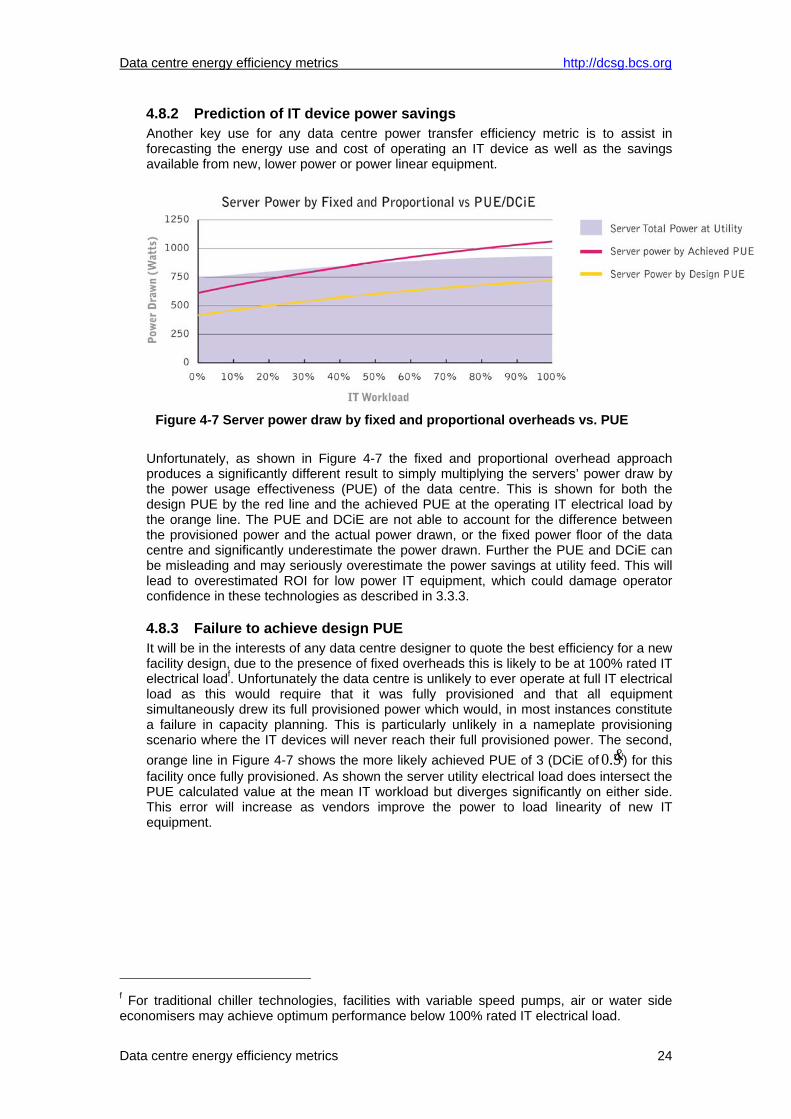
Figure 4-7 Server power draw by fixed and proportional overheads vs. PUE
Unfortunately, as shown in Figure 4-7 the fixed and proportional overhead approach produces a significantly different result to simply multiplying the servers’ power draw by the power usage effectiveness (PUE) of the data centre. This is shown for both the design PUE by the red line and the achieved PUE at the operating IT electrical load by the orange line. The PUE and DCiE are not able to account for the difference between the provisioned power and the actual power drawn, or the fixed power floor of the data centre and significantly underestimate the power drawn. Further the PUE and DCiE can be misleading and may seriously overestimate the power savings at utility feed. This will lead to overestimated ROI for low power IT equipment, which could damage operator confidence in these technologies as described in 3.3.3.
4.8.3 Failure to achieve design PUE It will be in the interests of any data centre designer to quote the best efficiency for a new facility design, due to the presence of fixed overheads this is likely to be at 100% rated IT electrical loadf. Unfortunately the data centre is unlikely to ever operate at full IT electrical load as this would require that it was fully provisioned and that all equipment simultaneously drew its full provisioned power which would, in most instances constitute a failure in capacity planning. This is particularly unlikely in a nameplate provisioning scenario where the IT devices will never reach their full provisioned power. The second, orange line in Figure 4-7 shows the more likely achieved PUE of 3 (DCiE of 3.0 &) for this facility once fully provisioned. As shown the server utility electrical load does intersect the PUE calculated value at the mean IT workload but diverges significantly on either side. This error will increase as vendors improve the power to load linearity of new IT equipment.
f For traditional chiller technologies, facilities with variable speed pumps, air or water side economisers may achieve optimum performance below 100% rated IT electrical load.
Data centre energy efficiency metrics http://dcsg.bcs.org
Data centre energy efficiency metrics 25
4.9 Data centres run below capacity When a new data centre is provisioned one of the defining measures is the total rated IT
equipment load, although this is also frequently expressed as 2mWatts . It is not
uncommon to build a data centre with sufficient capacity to meet several years’ worth of expansion, resulting in the facility operating at a fraction of its rated IT electrical load for considerable part of its operating life. Much of the large infrastructure of a data centre such as the air conditioning and UPS only achieves optimum efficiency at close to 100 percent load. If the load presented reduces then the facility overhead increases. This issue is exacerbated by the high levels of redundancy in a typical data centre with 2N or 2N+1 resilience, components such as UPS are frequently operating at less than 30 percent of their rated load which substantially increases the impact of the fixed loss overheads, see section 6.1.1 for an example of this issue.
Allocation of fixed load overheads The fixed load overhead of the data centre does not change with the IT equipment load. To understand the energy use and cost for IT equipment in the data centre both the fixed and proportional overheads must be considered in the same way that fixed and variable costs would be treated elsewhere in business finance. There are two basic approaches to the allocation of fixed load, one is the proportion of the rated IT electrical capacity that is provisioned to the device and separate accounting for the overheads of the unused capacity, the second is the proportion of the total provisioned capacity that is allocated to the deviceg. Either of these approaches drives an understanding of the energy and cost implications of a partially utilised facility with high fixed load overheads, thus driving behavioural changes in operators.
Installed estate vs. efficient new M&E equipment Whilst many M&E equipment vendors are now producing equipment with very substantially improved fixed and proportional losses, these still have overheads and will not replace the installed estate of equipment in working data centres for several years.
Failure to realise the benefits of load to power linear IT equipment Another issue for both vendors and operators is to develop the operator understanding that it is necessary to address the data centre fixed overheads in order to realise the full benefits of the power savings offered by the new IT equipment they are installing.
4.9.1 Modular data centre infrastructure Many M&E equipment vendors and data centre design and build specialists are now producing modern, modular designs for data centres. These designs allow the operator to scale their M&E infrastructure in a more linear fashion to meet the IT load and utilisation of their facility. This represents a significant improvement in both the cost profile and efficiency of these facilities as the equipment will be running closer to rated load, thus minimizing the fixed loss overheads. An important secondary benefit of this approach is that the M&E infrastructure is more likely to be of the same technology generation as the IT equipment it supports and therefore more likely to deliver efficient and effective service. The graphs below, in Figure 4-8 and Figure 4-9 both show the same data centre, measured with both DCiE and fixed & proportional overheads.
g The DCSG data centre simulator provides both methods of cost allocation.
Data centre energy efficiency metrics http://dcsg.bcs.org
Data centre energy efficiency metrics 26
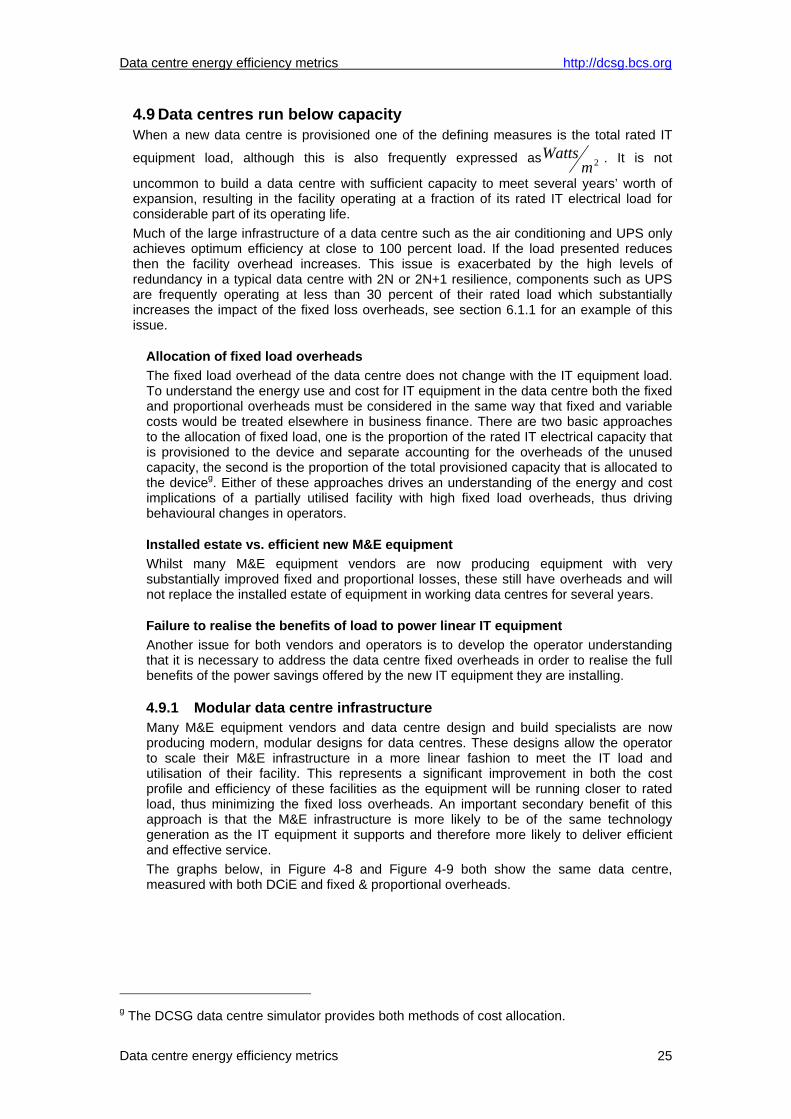
Figure 4-8 Data centre fixed and proportional losses under modular provisioning The graph in Figure 4-8 shows the data centre from section 4.3 with the same inefficient M&E equipment but this time the M&E equipment provider uses modular provisioning of the PDU, UPS, CRAC and chiller systems in 200kWh steps for rated IT electrical load. This provides substantial efficiency improvements in the early years of the facility operation where the facility is at low utilisation as well as reducing initial capital costs and improving flexibility. Whilst more complex than just the two values of fixed and proportional, this graph is easy to visualise from an understanding that the fixed overheads will increase in steps as the M&E infrastructure is provisioned.
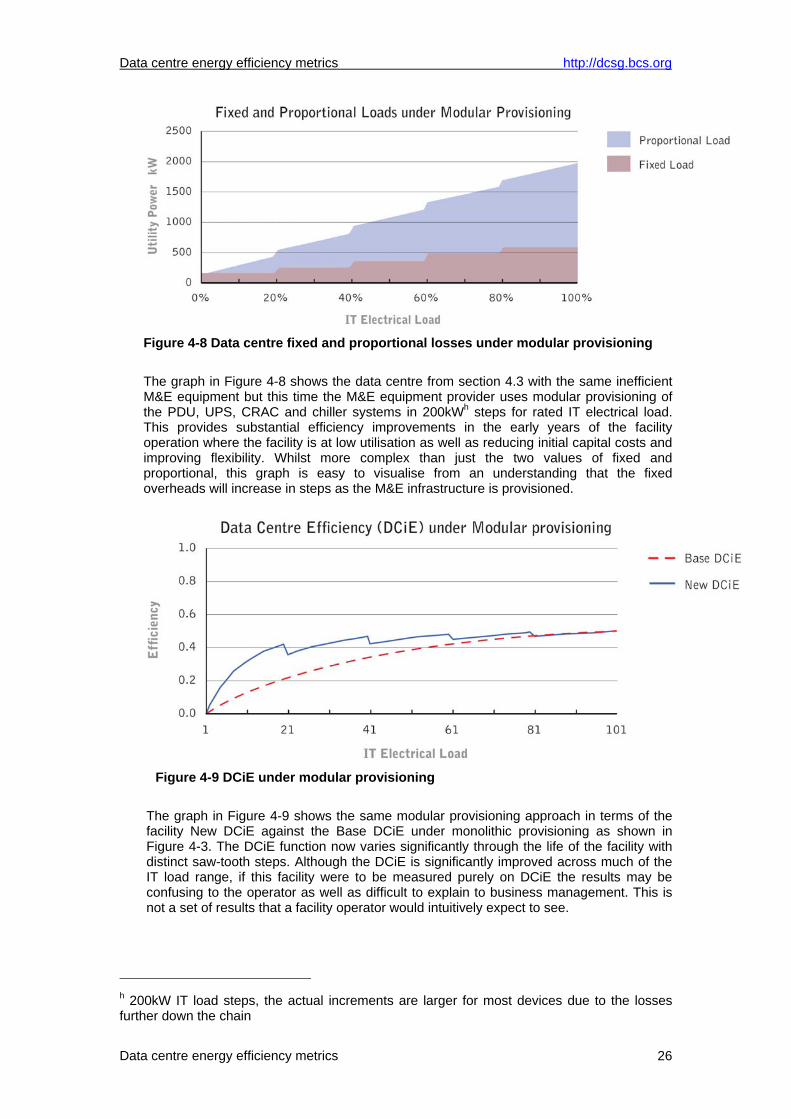
Figure 4-9 DCiE under modular provisioning
The graph in Figure 4-9 shows the same modular provisioning approach in terms of the facility New DCiE against the Base DCiE under monolithic provisioning as shown in Figure 4-3. The DCiE function now varies significantly through the life of the facility with distinct saw-tooth steps. Although the DCiE is significantly improved across much of the IT load range, if this facility were to be measured purely on DCiE the results may be confusing to the operator as well as difficult to explain to business management. This is not a set of results that a facility operator would intuitively expect to see.
h 200kW IT load steps, the actual increments are larger for most devices due to the losses further down the chain
Data centre energy efficiency metrics http://dcsg.bcs.org
Data centre energy efficiency metrics 27
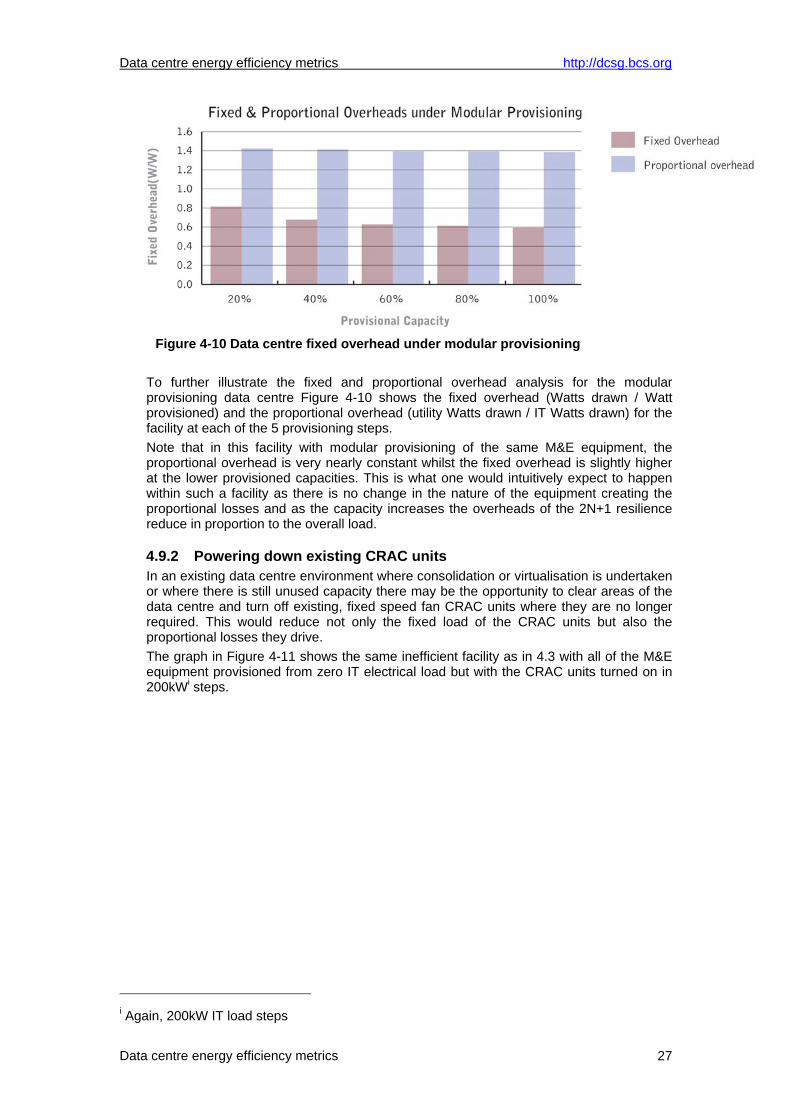
Figure 4-10 Data centre fixed overhead under modular provisioning
To further illustrate the fixed and proportional overhead analysis for the modular provisioning data centre Figure 4-10 shows the fixed overhead (Watts drawn / Watt provisioned) and the proportional overhead (utility Watts drawn / IT Watts drawn) for the facility at each of the 5 provisioning steps. Note that in this facility with modular provisioning of the same M&E equipment, the proportional overhead is very nearly constant whilst the fixed overhead is slightly higher at the lower provisioned capacities. This is what one would intuitively expect to happen within such a facility as there is no change in the nature of the equipment creating the proportional losses and as the capacity increases the overheads of the 2N+1 resilience reduce in proportion to the overall load.
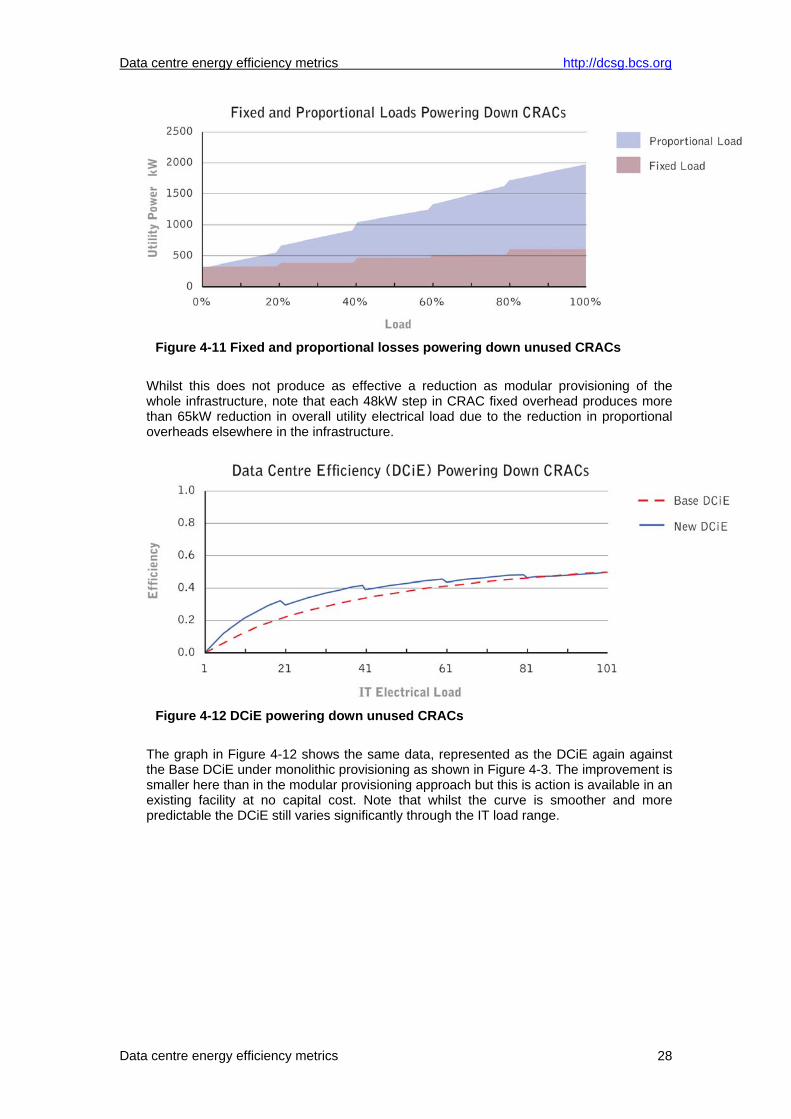
4.9.2 Powering down existing CRAC units In an existing data centre environment where consolidation or virtualisation is undertaken or where there is still unused capacity there may be the opportunity to clear areas of the data centre and turn off existing, fixed speed fan CRAC units where they are no longer required. This would reduce not only the fixed load of the CRAC units but also the proportional losses they drive. The graph in Figure 4-11 shows the same inefficient facility as in 4.3 with all of the M&E equipment provisioned from zero IT electrical load but with the CRAC units turned on in 200kWi steps.
i Again, 200kW IT load steps
Data centre energy efficiency metrics http://dcsg.bcs.org
Data centre energy efficiency metrics 28
Figure 4-11 Fixed and proportional losses powering down unused CRACs
Whilst this does not produce as effective a reduction as modular provisioning of the whole infrastructure, note that each 48kW step in CRAC fixed overhead produces more than 65kW reduction in overall utility electrical load due to the reduction in proportional overheads elsewhere in the infrastructure.
Figure 4-12 DCiE powering down unused CRACs
The graph in Figure 4-12 shows the same data, represented as the DCiE again against the Base DCiE under monolithic provisioning as shown in Figure 4-3. The improvement is smaller here than in the modular provisioning approach but this is action is available in an existing facility at no capital cost. Note that whilst the curve is smoother and more predictable the DCiE still varies significantly through the IT load range.
Data centre energy efficiency metrics http://dcsg.bcs.org
Data centre energy efficiency metrics 29
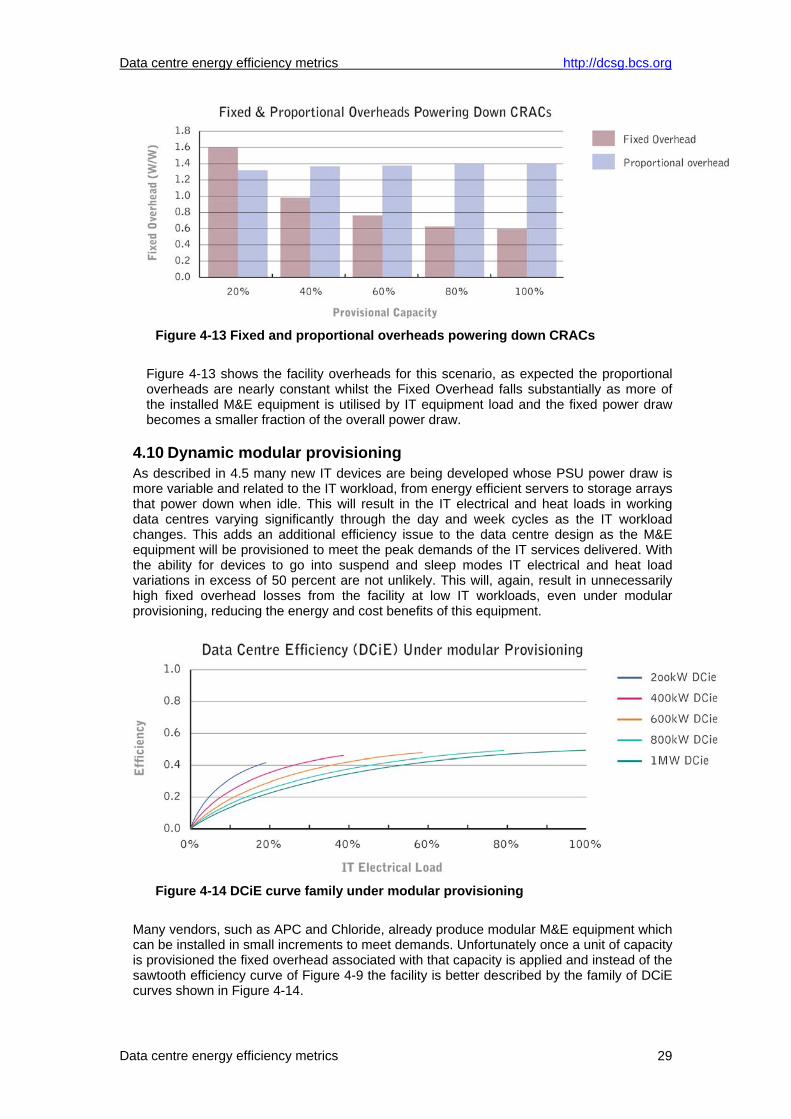
Figure 4-13 Fixed and proportional overheads powering down CRACs
Figure 4-13 shows the facility overheads for this scenario, as expected the proportional overheads are nearly constant whilst the Fixed Overhead falls substantially as more of the installed M&E equipment is utilised by IT equipment load and the fixed power draw becomes a smaller fraction of the overall power draw.
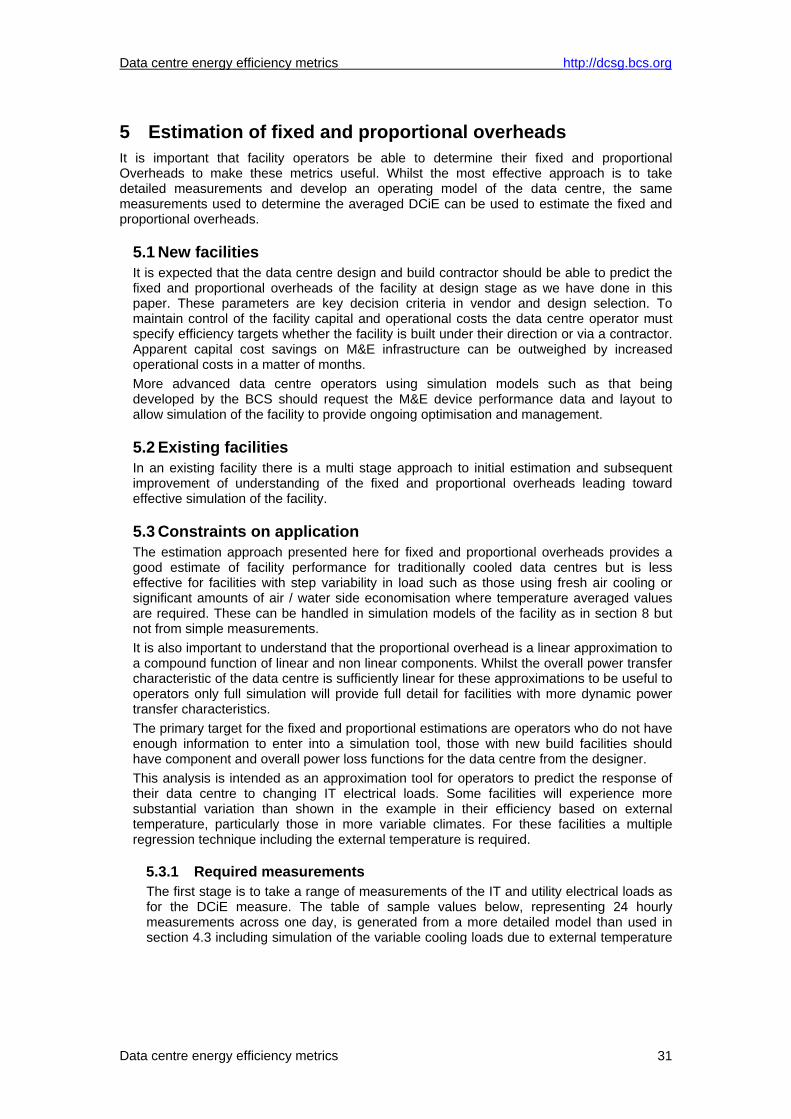
4.10 Dynamic modular provisioning As described in 4.5 many new IT devices are being developed whose PSU power draw is more variable and related to the IT workload, from energy efficient servers to storage arrays that power down when idle. This will result in the IT electrical and heat loads in working data centres varying significantly through the day and week cycles as the IT workload changes. This adds an additional efficiency issue to the data centre design as the M&E equipment will be provisioned to meet the peak demands of the IT services delivered. With the ability for devices to go into suspend and sleep modes IT electrical and heat load variations in excess of 50 percent are not unlikely. This will, again, result in unnecessarily high fixed overhead losses from the facility at low IT workloads, even under modular provisioning, reducing the energy and cost benefits of this equipment.
Figure 4-14 DCiE curve family under modular provisioning
Many vendors, such as APC and Chloride, already produce modular M&E equipment which can be installed in small increments to meet demands. Unfortunately once a unit of capacity is provisioned the fixed overhead associated with that capacity is applied and instead of the sawtooth efficiency curve of Figure 4-9 the facility is better described by the family of DCiE curves shown in Figure 4-14.

Data centre energy efficiency metrics http://dcsg.bcs.org
Data centre energy efficiency metrics 30
We suggest that a natural extension of modular M&E equipment be equipment that ‘self tunes’ to the current electrical and thermal loads by turning off modular components when the IT load drops. This would also allow for more flexible installation and more effective management of modular provisioned solutions as additional modules could be installed ahead of requirement and automatically provision themselves when the load breaks the set threshold. As for the previous examples fixed and proportional overheads will highlight these issues more effectively and in a more intuitive manner that drives understanding of the issues and the available mitigation strategies.
4.11 Ratio of fixed to proportional overhead The curved shape of the DCiE graphs is due to the mixture of fixed and proportional overhead. If the overheads of the data centre were purely proportional it would exhibit constant efficiency with IT electrical load and the DCiE graph would be a flat, straight line. The inclusion of a fixed overhead causes the DCiE to be zero at zero IT electrical load. This requires that the DCiE increase from zero to the design DCiE of the facility at full IT electrical load. The curvature of this line and how quickly the DCiE approaches the design DCiE depends upon the ratio of fixed to proportional overhead.
Fixed 0 Fixed 0.1 Fixed 0.5 Fixed 0.9
Design PUE 2 2 2 2
Design DCiE 0.5 0.5 0.5 0.5
Fixed 0 0.1 0.4 0.9
Proportional 2 1.9 1.6 1.1
Table 4-4 Fixed, proportional and DCiE This is illustrated in Figure 4-15 for the set of facilities, all with the same design DCiE of 0.5 described in Table 4-4.
Figure 4-15 DCiE curves by fixed overhead
Data centre energy efficiency metrics http://dcsg.bcs.org
Data centre energy efficiency metrics 31
5 Estimation of fixed and proportional overheads It is important that facility operators be able to determine their fixed and proportional Overheads to make these metrics useful. Whilst the most effective approach is to take detailed measurements and develop an operating model of the data centre, the same measurements used to determine the averaged DCiE can be used to estimate the fixed and proportional overheads.
5.1 New facilities It is expected that the data centre design and build contractor should be able to predict the fixed and proportional overheads of the facility at design stage as we have done in this paper. These parameters are key decision criteria in vendor and design selection. To maintain control of the facility capital and operational costs the data centre operator must specify efficiency targets whether the facility is built under their direction or via a contractor. Apparent capital cost savings on M&E infrastructure can be outweighed by increased operational costs in a matter of months. More advanced data centre operators using simulation models such as that being developed by the BCS should request the M&E device performance data and layout to allow simulation of the facility to provide ongoing optimisation and management.
5.2 Existing facilities In an existing facility there is a multi stage approach to initial estimation and subsequent improvement of understanding of the fixed and proportional overheads leading toward effective simulation of the facility.
5.3 Constraints on application The estimation approach presented here for fixed and proportional overheads provides a good estimate of facility performance for traditionally cooled data centres but is less effective for facilities with step variability in load such as those using fresh air cooling or significant amounts of air / water side economisation where temperature averaged values are required. These can be handled in simulation models of the facility as in section 8 but not from simple measurements. It is also important to understand that the proportional overhead is a linear approximation to a compound function of linear and non linear components. Whilst the overall power transfer characteristic of the data centre is sufficiently linear for these approximations to be useful to operators only full simulation will provide full detail for facilities with more dynamic power transfer characteristics. The primary target for the fixed and proportional estimations are operators who do not have enough information to enter into a simulation tool, those with new build facilities should have component and overall power loss functions for the data centre from the designer. This analysis is intended as an approximation tool for operators to predict the response of their data centre to changing IT electrical loads. Some facilities will experience more substantial variation than shown in the example in their efficiency based on external temperature, particularly those in more variable climates. For these facilities a multiple regression technique including the external temperature is required.
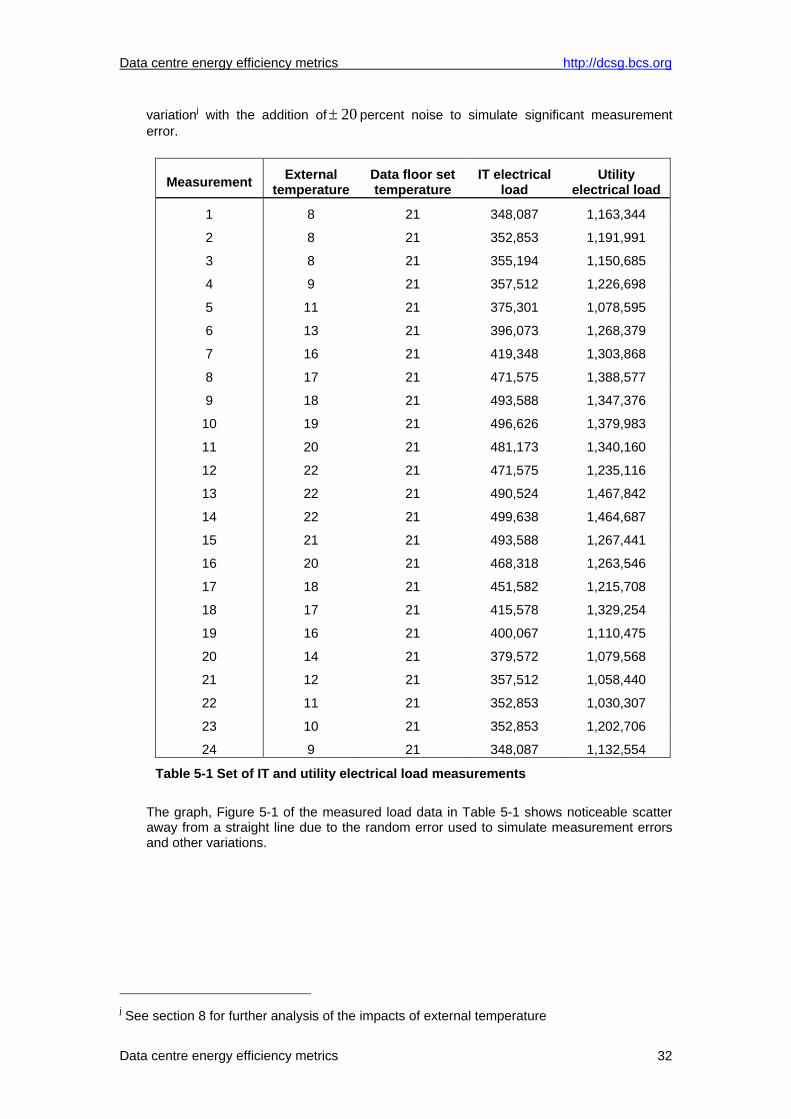
5.3.1 Required measurements The first stage is to take a range of measurements of the IT and utility electrical loads as for the DCiE measure. The table of sample values below, representing 24 hourly measurements across one day, is generated from a more detailed model than used in section 4.3 including simulation of the variable cooling loads due to external temperature
Data centre energy efficiency metrics http://dcsg.bcs.org
Data centre energy efficiency metrics 32
variationj with the addition of 20± percent noise to simulate significant measurement error.
Measurement External temperature
Data floor set temperature
IT electrical load
Utility electrical load
1 8 21 348,087 1,163,344
2 8 21 352,853 1,191,991
3 8 21 355,194 1,150,685
4 9 21 357,512 1,226,698
5 11 21 375,301 1,078,595
6 13 21 396,073 1,268,379
7 16 21 419,348 1,303,868
8 17 21 471,575 1,388,577
9 18 21 493,588 1,347,376
10 19 21 496,626 1,379,983
11 20 21 481,173 1,340,160
12 22 21 471,575 1,235,116
13 22 21 490,524 1,467,842
14 22 21 499,638 1,464,687
15 21 21 493,588 1,267,441
16 20 21 468,318 1,263,546
17 18 21 451,582 1,215,708
18 17 21 415,578 1,329,254
19 16 21 400,067 1,110,475
20 14 21 379,572 1,079,568
21 12 21 357,512 1,058,440
22 11 21 352,853 1,030,307
23 10 21 352,853 1,202,706
24 9 21 348,087 1,132,554
Table 5-1 Set of IT and utility electrical load measurements The graph, Figure 5-1 of the measured load data in Table 5-1 shows noticeable scatter away from a straight line due to the random error used to simulate measurement errors and other variations.
j See section 8 for further analysis of the impacts of external temperature
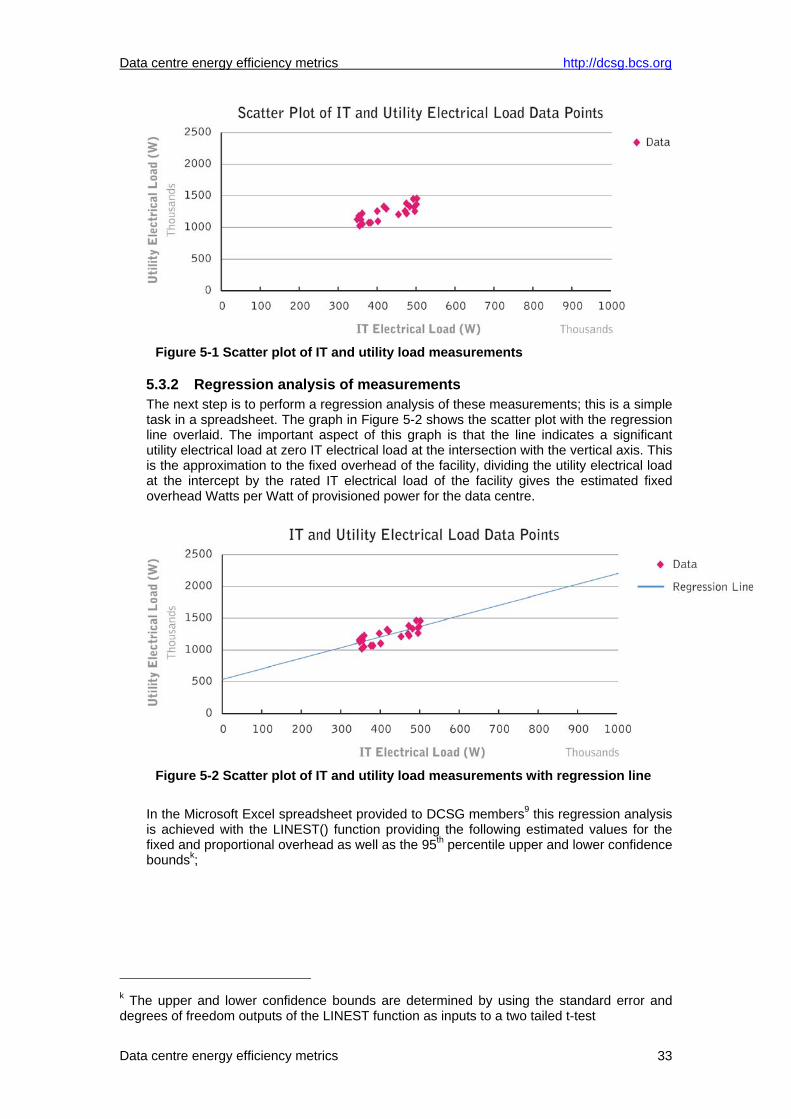
Data centre energy efficiency metrics http://dcsg.bcs.org
Data centre energy efficiency metrics 33
Figure 5-1 Scatter plot of IT and utility load measurements
5.3.2 Regression analysis of measurements The next step is to perform a regression analysis of these measurements; this is a simple task in a spreadsheet. The graph in Figure 5-2 shows the scatter plot with the regression line overlaid. The important aspect of this graph is that the line indicates a significant utility electrical load at zero IT electrical load at the intersection with the vertical axis. This is the approximation to the fixed overhead of the facility, dividing the utility electrical load at the intercept by the rated IT electrical load of the facility gives the estimated fixed overhead Watts per Watt of provisioned power for the data centre.
Figure 5-2 Scatter plot of IT and utility load measurements with regression line
In the Microsoft Excel spreadsheet provided to DCSG members9 this regression analysis is achieved with the LINEST() function providing the following estimated values for the fixed and proportional overhead as well as the 95th percentile upper and lower confidence boundsk;
k The upper and lower confidence bounds are determined by using the standard error and degrees of freedom outputs of the LINEST function as inputs to a two tailed t-test
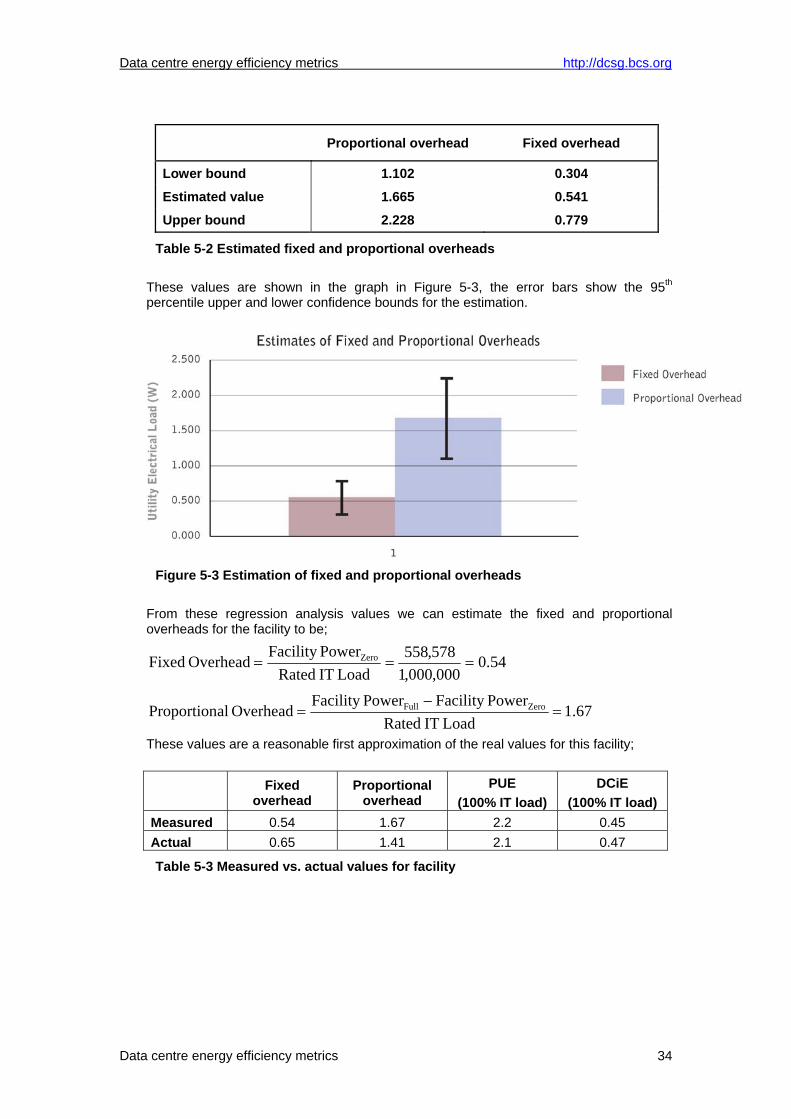
Data centre energy efficiency metrics http://dcsg.bcs.org
Data centre energy efficiency metrics 34
Proportional overhead Fixed overhead
Lower bound 1.102 0.304
Estimated value 1.665 0.541
Upper bound 2.228 0.779
Table 5-2 Estimated fixed and proportional overheads These values are shown in the graph in Figure 5-3, the error bars show the 95th percentile upper and lower confidence bounds for the estimation.
Figure 5-3 Estimation of fixed and proportional overheads
From these regression analysis values we can estimate the fixed and proportional overheads for the facility to be;
54.0000,000,1
578,558Load IT Rated
PowerFacility Overhead Fixed Zero ===
67.1LoadITRated
PowerFacility PowerFacility Overhead alProportion ZeroFull =
−=
These values are a reasonable first approximation of the real values for this facility; Fixed
overhead Proportional
overhead PUE
(100% IT load) DCiE
(100% IT load) Measured 0.54 1.67 2.2 0.45 Actual 0.65 1.41 2.1 0.47
Table 5-3 Measured vs. actual values for facility
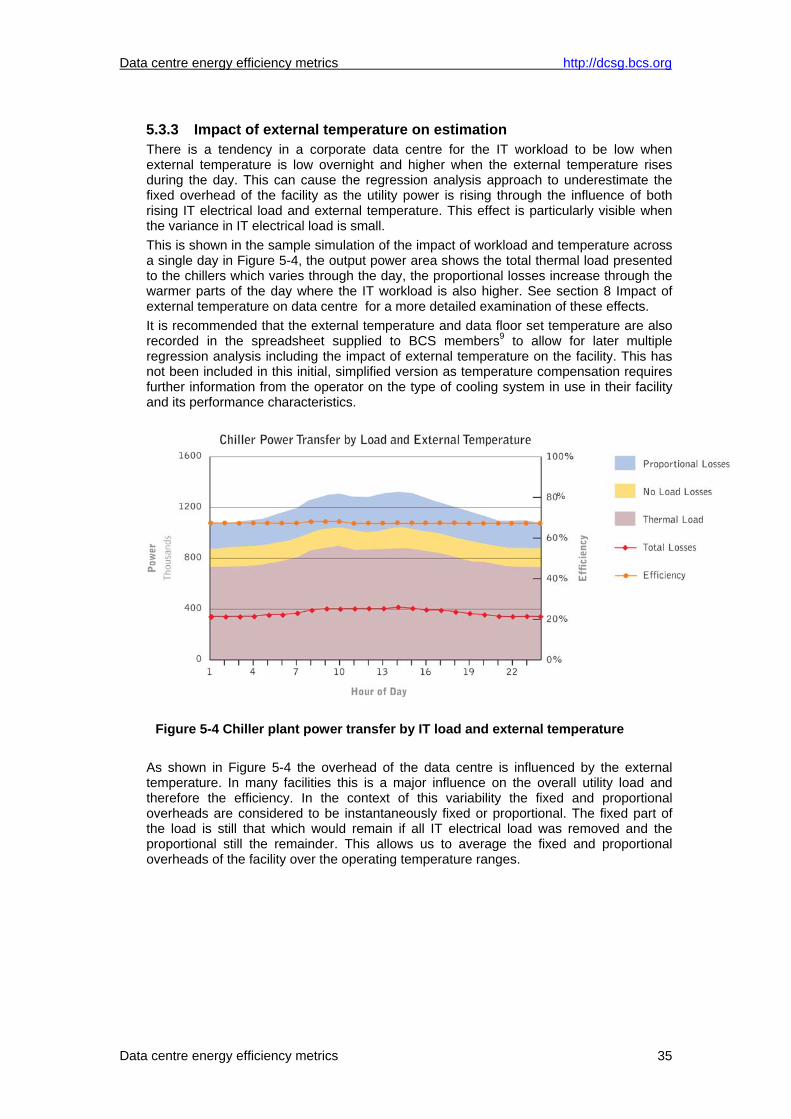
Data centre energy efficiency metrics http://dcsg.bcs.org
Data centre energy efficiency metrics 35
5.3.3 Impact of external temperature on estimation There is a tendency in a corporate data centre for the IT workload to be low when external temperature is low overnight and higher when the external temperature rises during the day. This can cause the regression analysis approach to underestimate the fixed overhead of the facility as the utility power is rising through the influence of both rising IT electrical load and external temperature. This effect is particularly visible when the variance in IT electrical load is small. This is shown in the sample simulation of the impact of workload and temperature across a single day in Figure 5-4, the output power area shows the total thermal load presented to the chillers which varies through the day, the proportional losses increase through the warmer parts of the day where the IT workload is also higher. See section 8 Impact of external temperature on data centre for a more detailed examination of these effects. It is recommended that the external temperature and data floor set temperature are also recorded in the spreadsheet supplied to BCS members9 to allow for later multiple regression analysis including the impact of external temperature on the facility. This has not been included in this initial, simplified version as temperature compensation requires further information from the operator on the type of cooling system in use in their facility and its performance characteristics.
Figure 5-4 Chiller plant power transfer by IT load and external temperature As shown in Figure 5-4 the overhead of the data centre is influenced by the external temperature. In many facilities this is a major influence on the overall utility load and therefore the efficiency. In the context of this variability the fixed and proportional overheads are considered to be instantaneously fixed or proportional. The fixed part of the load is still that which would remain if all IT electrical load was removed and the proportional still the remainder. This allows us to average the fixed and proportional overheads of the facility over the operating temperature ranges.
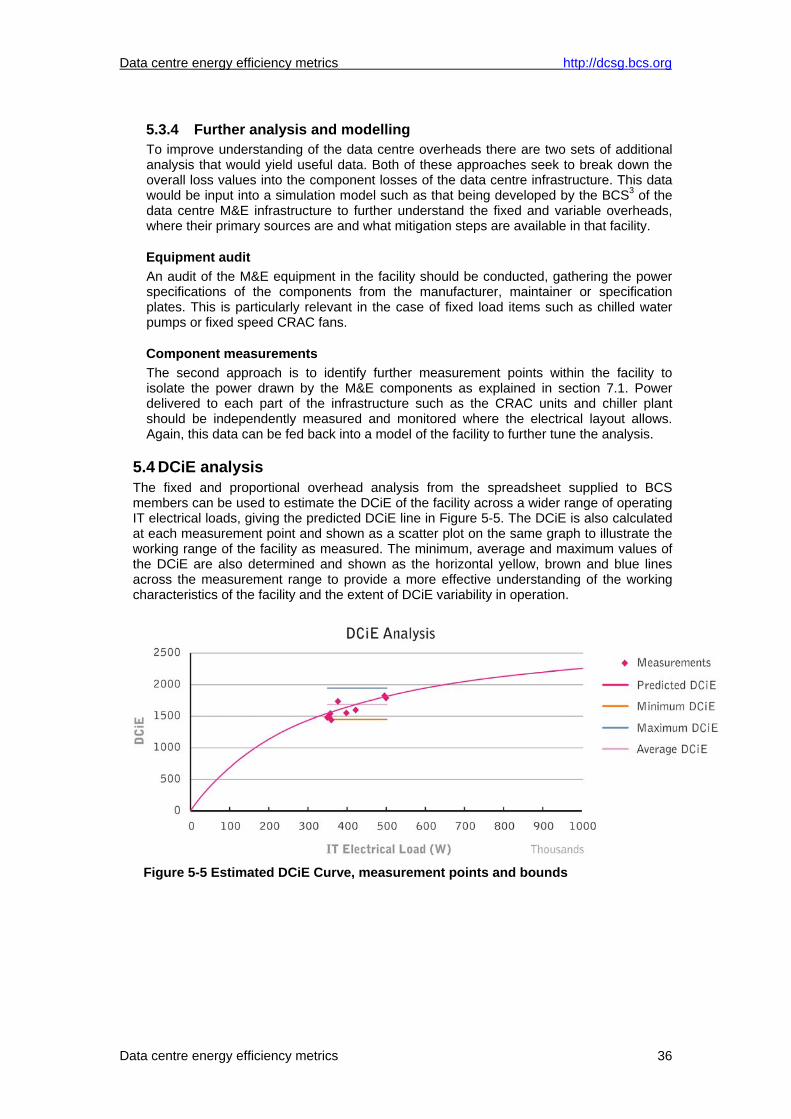
Data centre energy efficiency metrics http://dcsg.bcs.org
Data centre energy efficiency metrics 36
5.3.4 Further analysis and modelling To improve understanding of the data centre overheads there are two sets of additional analysis that would yield useful data. Both of these approaches seek to break down the overall loss values into the component losses of the data centre infrastructure. This data would be input into a simulation model such as that being developed by the BCS3 of the data centre M&E infrastructure to further understand the fixed and variable overheads, where their primary sources are and what mitigation steps are available in that facility.
Equipment audit An audit of the M&E equipment in the facility should be conducted, gathering the power specifications of the components from the manufacturer, maintainer or specification plates. This is particularly relevant in the case of fixed load items such as chilled water pumps or fixed speed CRAC fans.
Component measurements The second approach is to identify further measurement points within the facility to isolate the power drawn by the M&E components as explained in section 7.1. Power delivered to each part of the infrastructure such as the CRAC units and chiller plant should be independently measured and monitored where the electrical layout allows. Again, this data can be fed back into a model of the facility to further tune the analysis.
5.4 DCiE analysis The fixed and proportional overhead analysis from the spreadsheet supplied to BCS members can be used to estimate the DCiE of the facility across a wider range of operating IT electrical loads, giving the predicted DCiE line in Figure 5-5. The DCiE is also calculated at each measurement point and shown as a scatter plot on the same graph to illustrate the working range of the facility as measured. The minimum, average and maximum values of the DCiE are also determined and shown as the horizontal yellow, brown and blue lines across the measurement range to provide a more effective understanding of the working characteristics of the facility and the extent of DCiE variability in operation.
Figure 5-5 Estimated DCiE Curve, measurement points and bounds
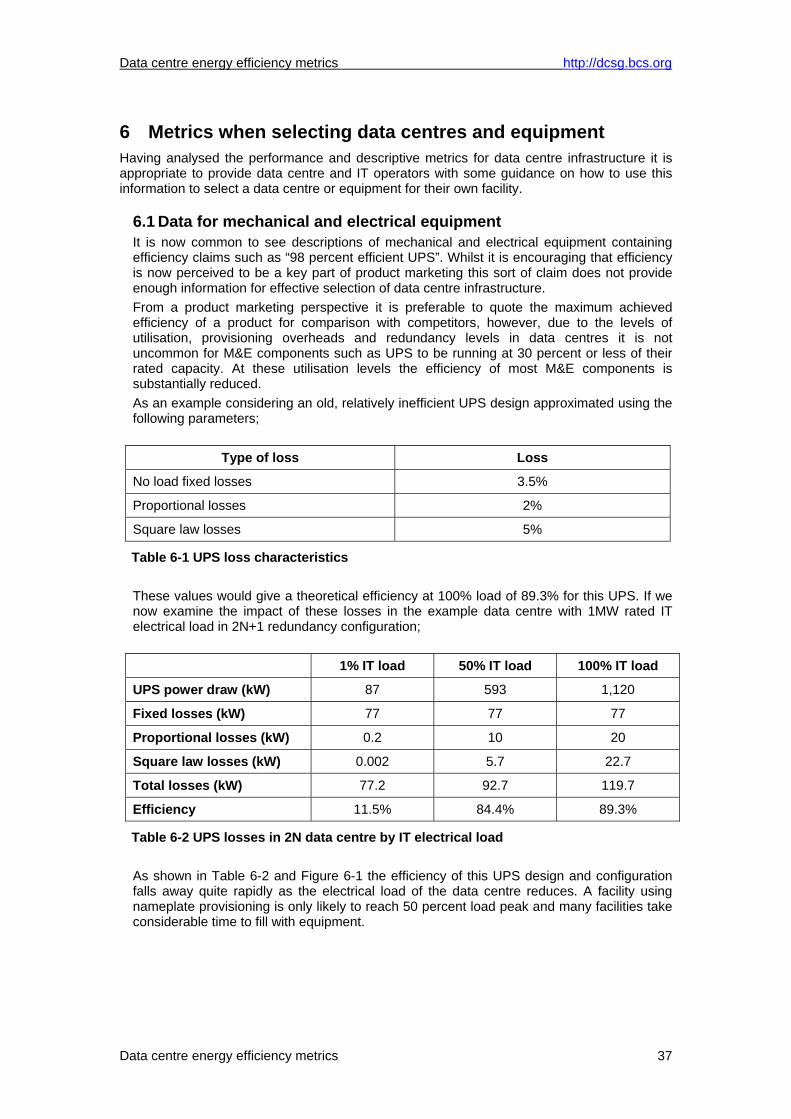
Data centre energy efficiency metrics http://dcsg.bcs.org
Data centre energy efficiency metrics 37
6 Metrics when selecting data centres and equipment Having analysed the performance and descriptive metrics for data centre infrastructure it is appropriate to provide data centre and IT operators with some guidance on how to use this information to select a data centre or equipment for their own facility.
6.1 Data for mechanical and electrical equipment It is now common to see descriptions of mechanical and electrical equipment containing efficiency claims such as “98 percent efficient UPS”. Whilst it is encouraging that efficiency is now perceived to be a key part of product marketing this sort of claim does not provide enough information for effective selection of data centre infrastructure. From a product marketing perspective it is preferable to quote the maximum achieved efficiency of a product for comparison with competitors, however, due to the levels of utilisation, provisioning overheads and redundancy levels in data centres it is not uncommon for M&E components such as UPS to be running at 30 percent or less of their rated capacity. At these utilisation levels the efficiency of most M&E components is substantially reduced. As an example considering an old, relatively inefficient UPS design approximated using the following parameters;
Type of loss Loss
No load fixed losses 3.5%
Proportional losses 2%
Square law losses 5%
Table 6-1 UPS loss characteristics These values would give a theoretical efficiency at 100% load of 89.3% for this UPS. If we now examine the impact of these losses in the example data centre with 1MW rated IT electrical load in 2N+1 redundancy configuration;
1% IT load 50% IT load 100% IT load
UPS power draw (kW) 87 593 1,120
Fixed losses (kW) 77 77 77
Proportional losses (kW) 0.2 10 20
Square law losses (kW) 0.002 5.7 22.7
Total losses (kW) 77.2 92.7 119.7
Efficiency 11.5% 84.4% 89.3%
Table 6-2 UPS losses in 2N data centre by IT electrical load As shown in Table 6-2 and Figure 6-1 the efficiency of this UPS design and configuration falls away quite rapidly as the electrical load of the data centre reduces. A facility using nameplate provisioning is only likely to reach 50 percent load peak and many facilities take considerable time to fill with equipment.
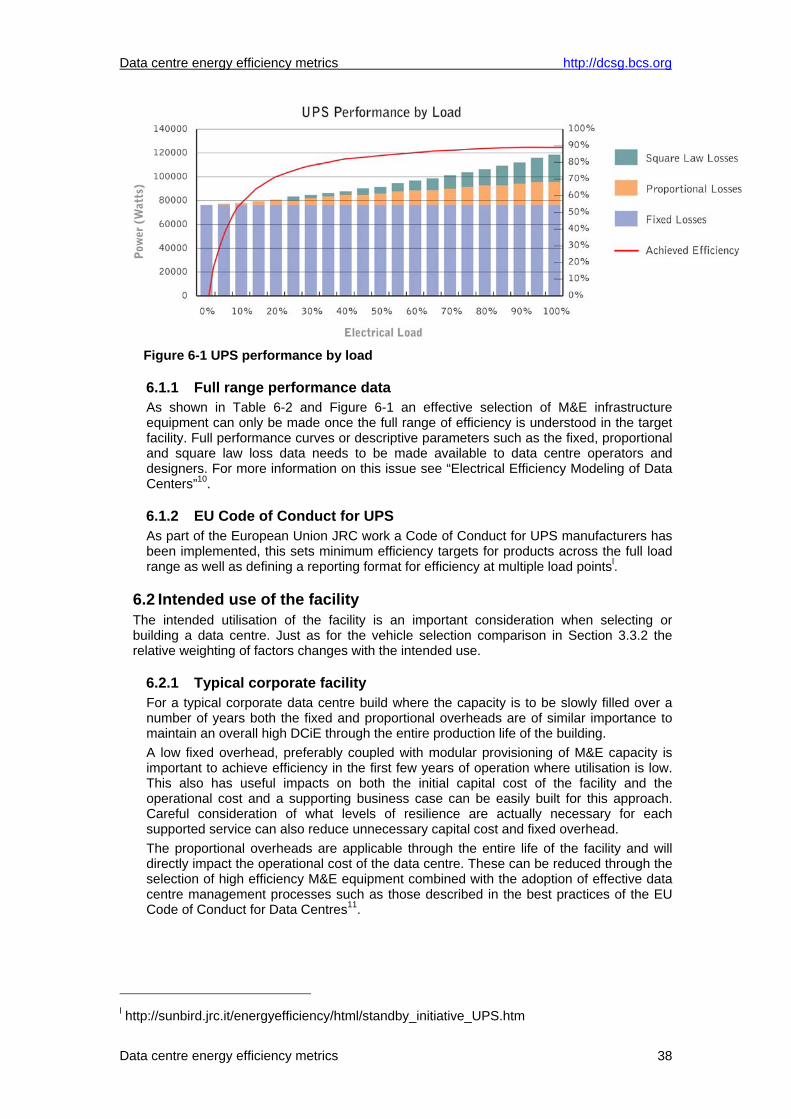
Data centre energy efficiency metrics http://dcsg.bcs.org
Data centre energy efficiency metrics 38
Figure 6-1 UPS performance by load
6.1.1 Full range performance data As shown in Table 6-2 and Figure 6-1 an effective selection of M&E infrastructure equipment can only be made once the full range of efficiency is understood in the target facility. Full performance curves or descriptive parameters such as the fixed, proportional and square law loss data needs to be made available to data centre operators and designers. For more information on this issue see “Electrical Efficiency Modeling of Data Centers”10.
6.1.2 EU Code of Conduct for UPS As part of the European Union JRC work a Code of Conduct for UPS manufacturers has been implemented, this sets minimum efficiency targets for products across the full load range as well as defining a reporting format for efficiency at multiple load pointsl.
6.2 Intended use of the facility The intended utilisation of the facility is an important consideration when selecting or building a data centre. Just as for the vehicle selection comparison in Section 3.3.2 the relative weighting of factors changes with the intended use.
6.2.1 Typical corporate facility For a typical corporate data centre build where the capacity is to be slowly filled over a number of years both the fixed and proportional overheads are of similar importance to maintain an overall high DCiE through the entire production life of the building. A low fixed overhead, preferably coupled with modular provisioning of M&E capacity is important to achieve efficiency in the first few years of operation where utilisation is low. This also has useful impacts on both the initial capital cost of the facility and the operational cost and a supporting business case can be easily built for this approach. Careful consideration of what levels of resilience are actually necessary for each supported service can also reduce unnecessary capital cost and fixed overhead. The proportional overheads are applicable through the entire life of the facility and will directly impact the operational cost of the data centre. These can be reduced through the selection of high efficiency M&E equipment combined with the adoption of effective data centre management processes such as those described in the best practices of the EU Code of Conduct for Data Centres11.
l http://sunbird.jrc.it/energyefficiency/html/standby_initiative_UPS.htm
Data centre energy efficiency metrics http://dcsg.bcs.org
Data centre energy efficiency metrics 39
6.2.2 Business continuity facility The requirements for a business continuity facility can be substantially different. Many BC facilities are idle for the vast majority of their lifetime with only some storage and networking devices active and operating to maintain state with their prime site. Much of the IT equipment is actually turned off in some BC sites. Low fixed overheads are the dominant requirement in this scenario as the IT electrical loads will be low for most of the operating lifetime. As before modular provisioning, appropriate selection of resilience levels (it is already a backup facility) and low fixed overhead equipment are key to achieving this. Proportional overheads are of significantly lower importance in this type of facility where the operating time will be a small fraction of the overall lifetime and can be safely compromised in favour of cost or reducing fixed overheads.
6.2.3 Co-location or managed services facility A co-location or managed services facility shares the requirements of the corporate facility but the cost impacts of high fixed overhead are of more direct significance to the operator’s business model. Low fixed overheads and modular M&E provisioning capability would allow the co-location operator to achieve much lower operating costs through the fill out phase of the facility. This moves both the cash flow and overall break even points significantly closer to the build date of the facility and substantially reduces the levels of up front investment and financial risk involved. The mitigation option for a co-location operator with a monolithic facility is to substantially increase the power and provisioning costs to represent the high M&E amortised cost and operating electrical costs of the design. The time during which the facility is partially occupied is particularly significant to these overheads.
6.2.4 Immediately filled facility In the instance of a facility that will be filled to rated capacity almost immediately then the proportional overheads are of greater significance than the fixed overheads as the facility will be operating close to it’s peak DCiE from early in the life cycle.

Data centre energy efficiency metrics http://dcsg.bcs.org
Data centre energy efficiency metrics 40
7 Monitoring and measurement It is recommended that facility operators have a power surveym carried out or install energy monitoring and reporting equipment to record the energy use within the data centre. The data recorded should include the utility feed power utilisation, the IT electrical load and the major M&E infrastructure components at the level of granularity the facility electrical design allows.
7.1 Facility measurement
Figure 7-1 Power measurements in the data centre Figure 7-1 shows, at a high leveln, the points where energy use can be measured in the data centre to assist in understanding the efficiency, losses and impacts of changes and improvements. These are represented in three groups;
1. Simple measurements, these are the most basic level of measurement, required to deliver a PUE/DCiE metric of the ratio of utility power to IT power for the facility. These can be initially informative to the operator and are easy to perform with portable equipment. It is important that the external and data floor set temperatures are recorded along with the electrical measurements
2. Detailed measurements, these are the next level of measurement where we specifically measure each of the points where power is lost in the delivery chain or diverted to non IT loads. This provides more effective information on how to improve the facility and can directly change relevant behaviour. This level may be necessary dependent upon the electrical configuration, for example if the CRAC units are fed from the UPS then CRAC power is a required measurement.
m Some data centre consultancies such as Keysource, http://www.keysource.co.uk/index.asp?ID=242 now offer free efficiency audits n The details of the electrical design will vary between facilities, as such the power delivery path and measurement point(s) for each of the loads identified will vary. Expert advice should be sought to determine the measurement points within each specific facility

Data centre energy efficiency metrics http://dcsg.bcs.org
Data centre energy efficiency metrics 41
3. IT measurements, there is some limited utility in measurement of IT device power draw in situations where a physical device is dedicated to a specific task. This utility disappears in a virtualised or grid infrastructure or where resources such as network or storage are shared.
These three levels of measurement can be carried out at a number of frequencies dependent upon the accuracy and granularity of measurement the operator requires;
1. Once, typically for a one off survey, though this is of limited value as a snapshot measurement
2. Hourly for one week, again typically a one off survey, this provides a more effective view of how the data centre responds to varying IT loads
3. Hourly for one week every three months, possibly a recurring survey delivered by an M&E maintenance partner, this provides snapshots of how the data centre responds to IT loads, climate and changes to equipment and processes
4. Continuous, this is a permanently installed monitoring and reporting system providing a very effective view of the impacts of changes in IT load, equipment, operating process, infrastructure and climate.
Development stage
Measurement points Recording Frequency Output
Simple survey Simple Manual - Temporary Once Report
Extended simple survey Simple Automated -
Temporary Hourly for one
week Report
Repeated survey Simple Automated - Temporary
Hourly for one week every 3
months Report
Advanced survey Simple & Detailed
Manual - Temporary Once Report
Extended advanced survey
Simple & Detailed
Automated - Temporary
Hourly for one week Report
Repeated advanced survey
Simple & Detailed
Automated - Temporary
Hourly for one week every 3
months Report
Simple facility monitoring Simple Automatic -
Permanent 5 Minutes M&E
monitoring screen(s)
Advanced facility monitoring
Simple & Detailed
Automatic -Permanent 5 Minutes
M&E monitoring screen(s)
Holistic monitoring Simple, Detailed & IT
Automatic - Permanent 5 Minutes
IT monitoring screen(s)
Table 7-1 Stages of energy monitoring

Data centre energy efficiency metrics http://dcsg.bcs.org
Data centre energy efficiency metrics 42
The recording equipment can be either temporary or permanently installed. Many M&E maintenance vendors have portable equipment that can be used to carry out a survey. There is also a growing range of power reporting modules to be fitted to PDUs, UPS and rack level power strips. Of significant impact to the effectiveness of the power metering is how it is viewed by the facility operator;
1. Report, the results of a survey will be delivered as a report, this provides a one time view, or reminder every reporting period if recurring under contract
2. M&E monitoring screen, where permanent power metering is in place the outputs can be sent live to a monitoring screen for M&E staff to view or extract reports, this suggests an organisational separation of the IT and M&E teams
3. IT monitoring screen, the most integrated and effective choice is to send the power metering to the same monitoring screens as the IT monitoring data for an integrated IT and M&E team response.
7.2 Granularity of measurement It would be ideal to be able to include in the IT equipment power measurement only those devices which are directly involved in the delivery of the ‘useful work’ from the data centre and exclude systems such as KVM switches and monitors. There are two significant issues with this goal. Firstly much of this equipment is plugged into the same rack power strips and therefore PDUs as the ‘useful work’ equipment it supports and therefore the complexity and expense of the metering infrastructure would be considerable in an existing facility, although it would be possible to design new facilities with ‘grey power’ for such devices distributed separately. The second issue is that it will become difficult to agree on a boundary of what is ‘directly involved in the delivery’, for example a backup platform is not involved in the delivery, until it is required to restore data.
7.3 Reasons to measure variance of IT electrical load One issue that is frequently not considered by M&E personnel is that of IT electrical load variance. As described in section 4.5 rapid improvements in IT equipment are driving significant variation in the applied electrical load in the data centre, as this trend continues electrical load will track IT workload more effectively. This can create issues in thermal management of the facility which need to be understood by M&E staff.
7.3.1 How effectively does the IT electrical load track the IT workload? It is quite common during installation of IT equipment for engineers to either not enable or actively disable all of the power management features of the servers and storage they are installing. In a few instances this is for a valid operational reason but it is inappropriate in many cases. Measurement of the IT electrical load at varying times of day and analysis of the variance will reveal how effectively the IT electrical load tracks the IT workload and whether it is necessary to audit the power management configuration of the IT devices. The correlation between IT workload and IT electrical load should also improve as the IT equipment is replaced during normal end of life upgrade as new IT equipment exhibits substantially better load to power linearity. This correlation is a key measure of the IT platform and should be monitored.
7.3.2 Can you measure the variance in utility electrical load? One issue reported by a number of data centre operators is the ability to measure variance in the IT electrical power whilst experiencing difficulty detecting the corresponding variance in utility power draw of the facility. This suggests that the facility is dominated by the fixed overhead, masking the variance in IT electrical load and proportional overhead. A facility with this issue will not be able to extract the full benefit of IT changes such as virtualisation. Remedial actions to reduce the fixed overhead should be undertaken immediately to reduce the power costs and energy use.
Data centre energy efficiency metrics http://dcsg.bcs.org
Data centre energy efficiency metrics 43
7.3.3 IT devices that report PSU power A number of IT equipment vendors have started to produce chassis that are able to report the PSU drawn power via IT monitoring. Unfortunately there is not yet standardisation of this and simple measures such as an agreed SNMP MIB to be probed are not available which fundamentally compromises the value of these capabilities. Another issue with the power reporting from the enabled servers is that the report is generally a gauge reporting instantaneous power rather than a counter reporting energy use since last query which would be easy to achieve in hardware. The current gauge approach would require the monitoring platform to integrate the snapshot power measurement values retrieved by polling to estimate energy use and cost in software which is likely to be inaccurate. This counter approach would provide a more useful output, directly reporting energy use whilst still allowing a power measurement to be taken by subtracting the previously reported value. A common example of this approach is traffic monitoring on network switch ports.
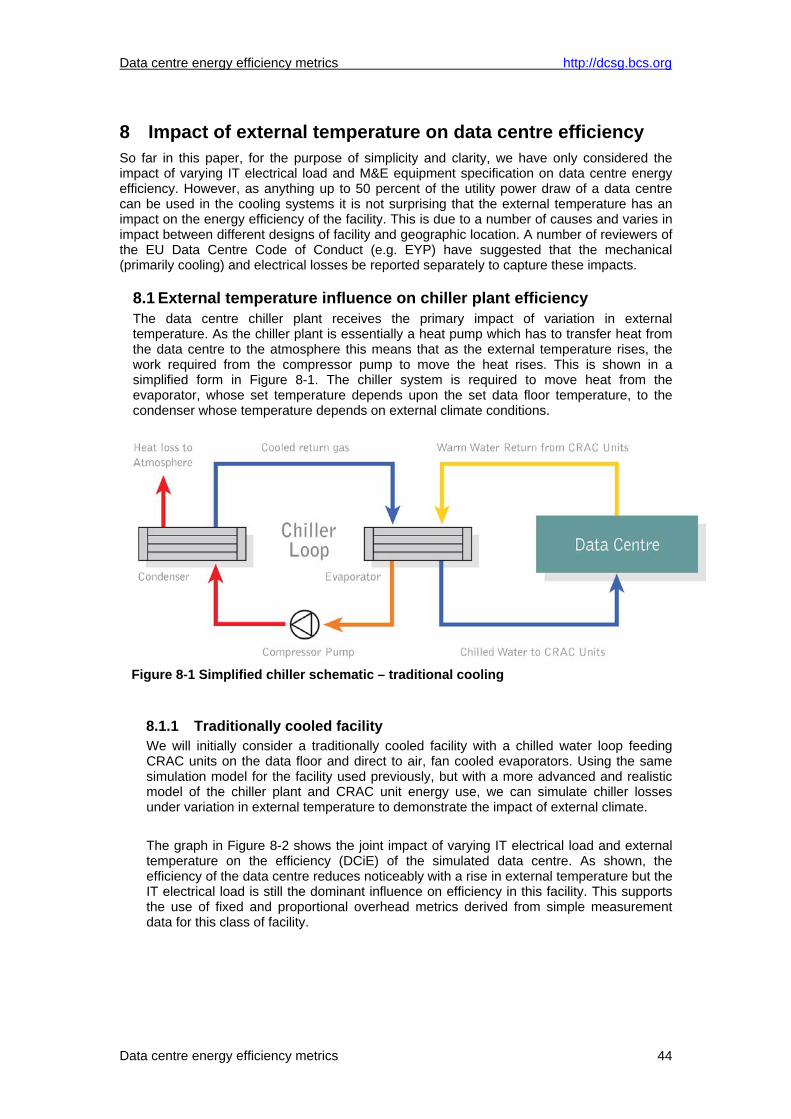
Data centre energy efficiency metrics http://dcsg.bcs.org
Data centre energy efficiency metrics 44
8 Impact of external temperature on data centre efficiency So far in this paper, for the purpose of simplicity and clarity, we have only considered the impact of varying IT electrical load and M&E equipment specification on data centre energy efficiency. However, as anything up to 50 percent of the utility power draw of a data centre can be used in the cooling systems it is not surprising that the external temperature has an impact on the energy efficiency of the facility. This is due to a number of causes and varies in impact between different designs of facility and geographic location. A number of reviewers of the EU Data Centre Code of Conduct (e.g. EYP) have suggested that the mechanical (primarily cooling) and electrical losses be reported separately to capture these impacts.
8.1 External temperature influence on chiller plant efficiency The data centre chiller plant receives the primary impact of variation in external temperature. As the chiller plant is essentially a heat pump which has to transfer heat from the data centre to the atmosphere this means that as the external temperature rises, the work required from the compressor pump to move the heat rises. This is shown in a simplified form in Figure 8-1. The chiller system is required to move heat from the evaporator, whose set temperature depends upon the set data floor temperature, to the condenser whose temperature depends on external climate conditions.
Figure 8-1 Simplified chiller schematic – traditional cooling
8.1.1 Traditionally cooled facility We will initially consider a traditionally cooled facility with a chilled water loop feeding CRAC units on the data floor and direct to air, fan cooled evaporators. Using the same simulation model for the facility used previously, but with a more advanced and realistic model of the chiller plant and CRAC unit energy use, we can simulate chiller losses under variation in external temperature to demonstrate the impact of external climate. The graph in Figure 8-2 shows the joint impact of varying IT electrical load and external temperature on the efficiency (DCiE) of the simulated data centre. As shown, the efficiency of the data centre reduces noticeably with a rise in external temperature but the IT electrical load is still the dominant influence on efficiency in this facility. This supports the use of fixed and proportional overhead metrics derived from simple measurement data for this class of facility.
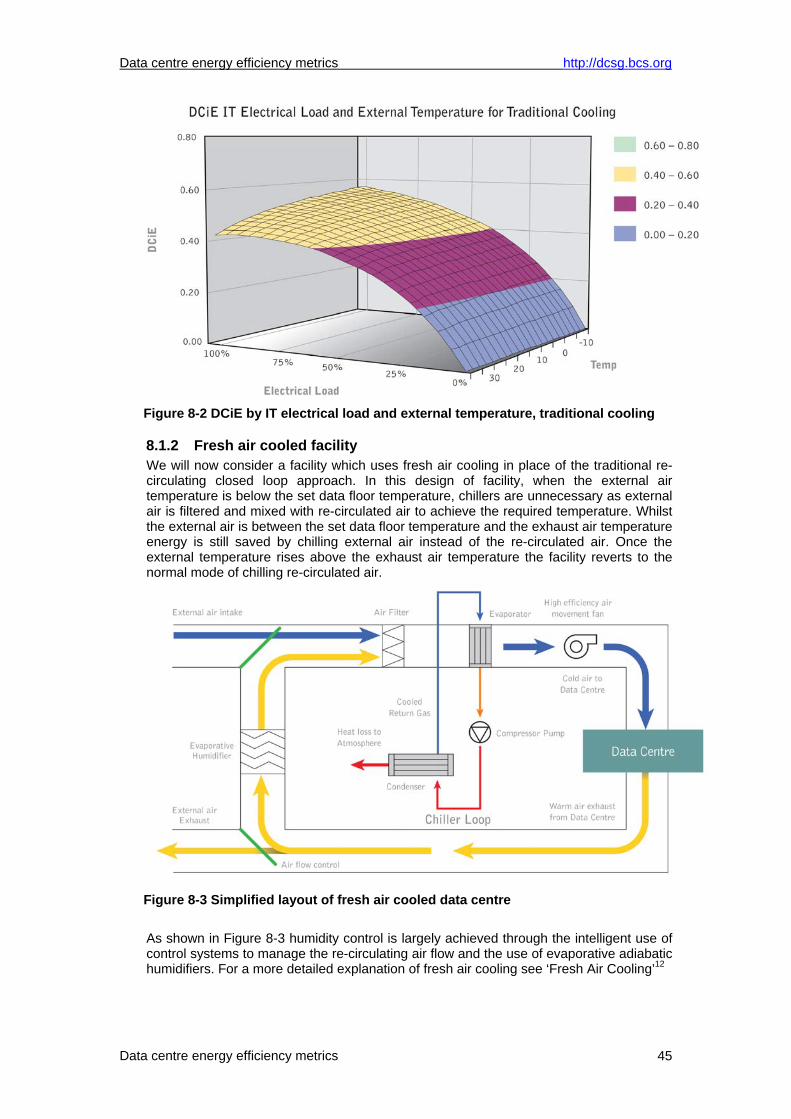
Data centre energy efficiency metrics http://dcsg.bcs.org
Data centre energy efficiency metrics 45
Figure 8-2 DCiE by IT electrical load and external temperature, traditional cooling
8.1.2 Fresh air cooled facility We will now consider a facility which uses fresh air cooling in place of the traditional re-circulating closed loop approach. In this design of facility, when the external air temperature is below the set data floor temperature, chillers are unnecessary as external air is filtered and mixed with re-circulated air to achieve the required temperature. Whilst the external air is between the set data floor temperature and the exhaust air temperature energy is still saved by chilling external air instead of the re-circulated air. Once the external temperature rises above the exhaust air temperature the facility reverts to the normal mode of chilling re-circulated air.
Figure 8-3 Simplified layout of fresh air cooled data centre As shown in Figure 8-3 humidity control is largely achieved through the intelligent use of control systems to manage the re-circulating air flow and the use of evaporative adiabatic humidifiers. For a more detailed explanation of fresh air cooling see ‘Fresh Air Cooling’12
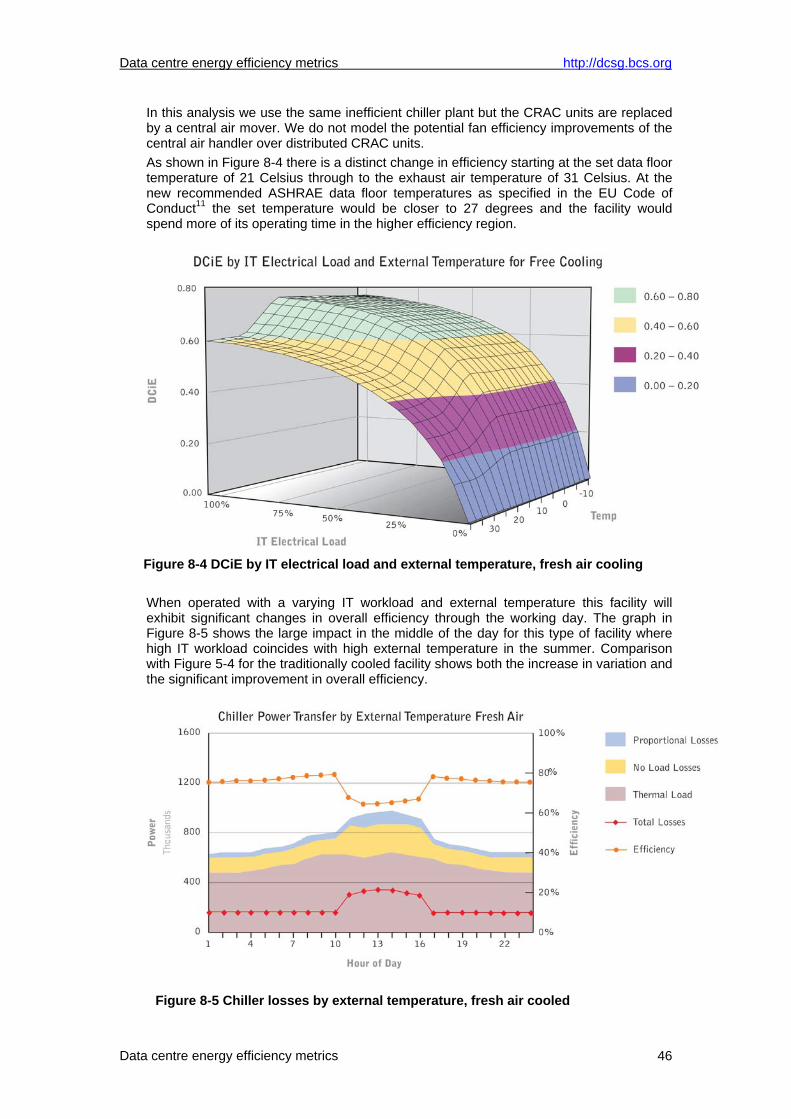
Data centre energy efficiency metrics http://dcsg.bcs.org
Data centre energy efficiency metrics 46
In this analysis we use the same inefficient chiller plant but the CRAC units are replaced by a central air mover. We do not model the potential fan efficiency improvements of the central air handler over distributed CRAC units. As shown in Figure 8-4 there is a distinct change in efficiency starting at the set data floor temperature of 21 Celsius through to the exhaust air temperature of 31 Celsius. At the new recommended ASHRAE data floor temperatures as specified in the EU Code of Conduct11 the set temperature would be closer to 27 degrees and the facility would spend more of its operating time in the higher efficiency region.
Figure 8-4 DCiE by IT electrical load and external temperature, fresh air cooling When operated with a varying IT workload and external temperature this facility will exhibit significant changes in overall efficiency through the working day. The graph in Figure 8-5 shows the large impact in the middle of the day for this type of facility where high IT workload coincides with high external temperature in the summer. Comparison with Figure 5-4 for the traditionally cooled facility shows both the increase in variation and the significant improvement in overall efficiency.
Figure 8-5 Chiller losses by external temperature, fresh air cooled
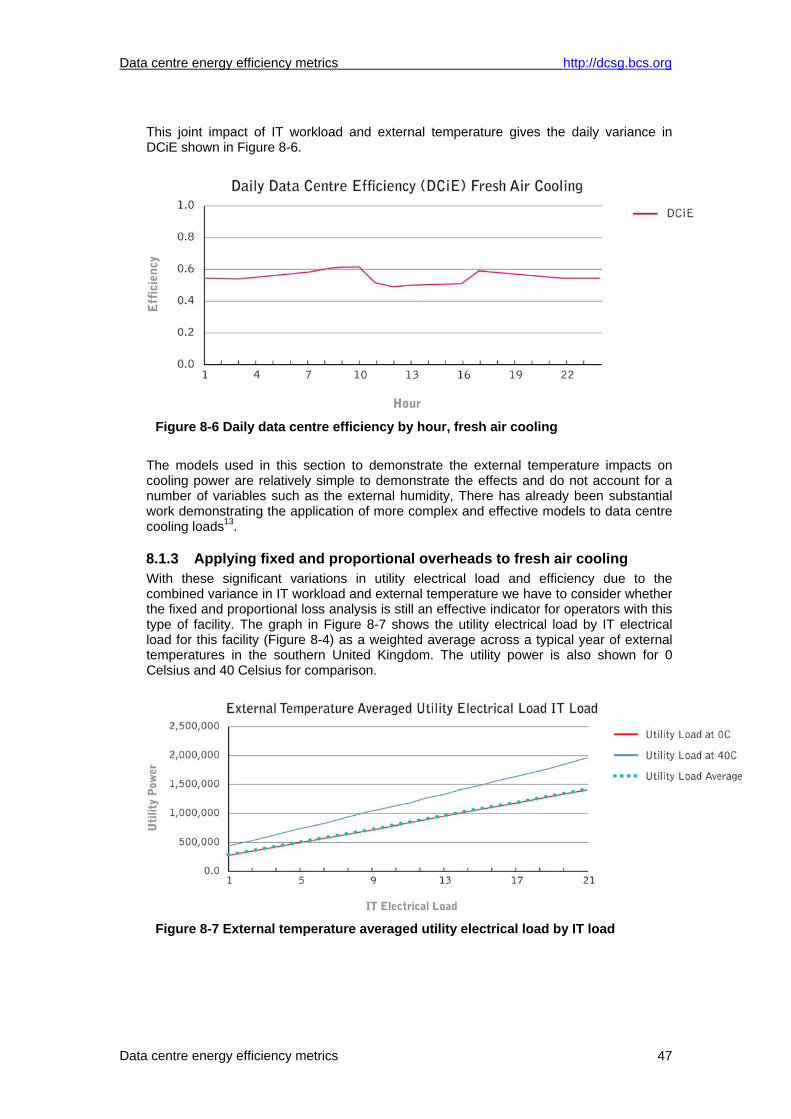
Data centre energy efficiency metrics http://dcsg.bcs.org
Data centre energy efficiency metrics 47
This joint impact of IT workload and external temperature gives the daily variance in DCiE shown in Figure 8-6.
Figure 8-6 Daily data centre efficiency by hour, fresh air cooling
The models used in this section to demonstrate the external temperature impacts on cooling power are relatively simple to demonstrate the effects and do not account for a number of variables such as the external humidity, There has already been substantial work demonstrating the application of more complex and effective models to data centre cooling loads13.
8.1.3 Applying fixed and proportional overheads to fresh air cooling With these significant variations in utility electrical load and efficiency due to the combined variance in IT workload and external temperature we have to consider whether the fixed and proportional loss analysis is still an effective indicator for operators with this type of facility. The graph in Figure 8-7 shows the utility electrical load by IT electrical load for this facility (Figure 8-4) as a weighted average across a typical year of external temperatures in the southern United Kingdom. The utility power is also shown for 0 Celsius and 40 Celsius for comparison.
Figure 8-7 External temperature averaged utility electrical load by IT load
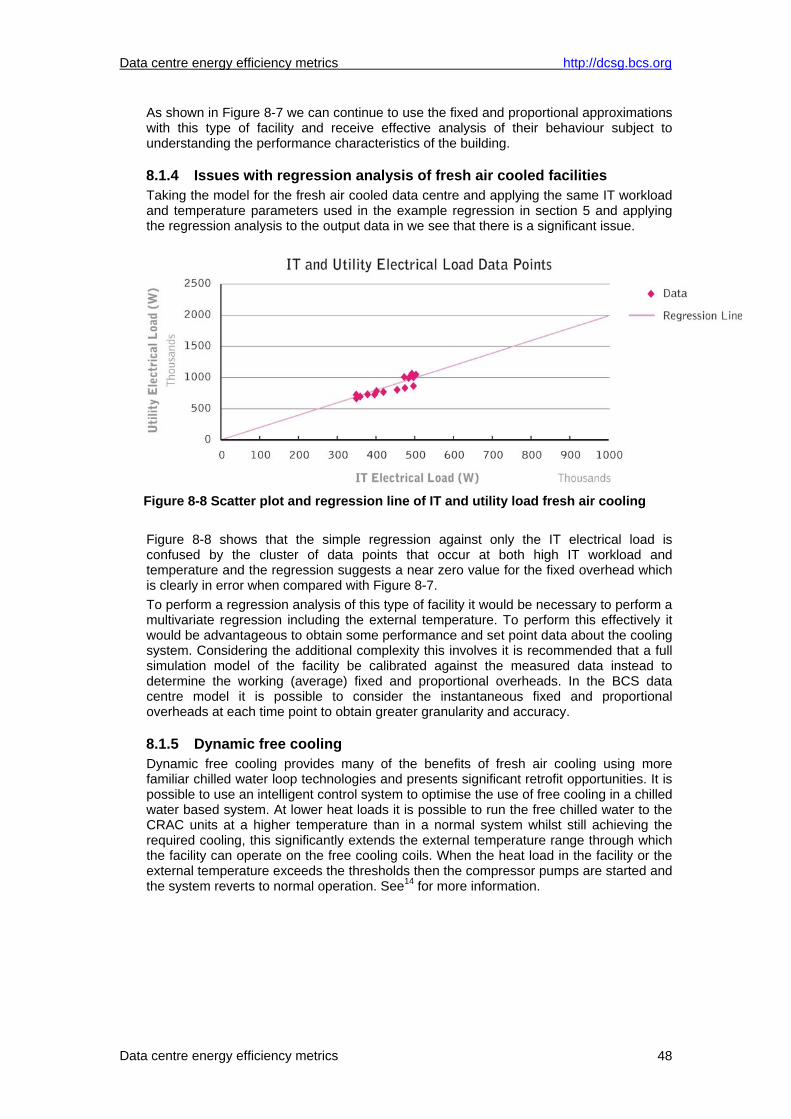
Data centre energy efficiency metrics http://dcsg.bcs.org
Data centre energy efficiency metrics 48
As shown in Figure 8-7 we can continue to use the fixed and proportional approximations with this type of facility and receive effective analysis of their behaviour subject to understanding the performance characteristics of the building.
8.1.4 Issues with regression analysis of fresh air cooled facilities Taking the model for the fresh air cooled data centre and applying the same IT workload and temperature parameters used in the example regression in section 5 and applying the regression analysis to the output data in we see that there is a significant issue.
Figure 8-8 Scatter plot and regression line of IT and utility load fresh air cooling Figure 8-8 shows that the simple regression against only the IT electrical load is confused by the cluster of data points that occur at both high IT workload and temperature and the regression suggests a near zero value for the fixed overhead which is clearly in error when compared with Figure 8-7. To perform a regression analysis of this type of facility it would be necessary to perform a multivariate regression including the external temperature. To perform this effectively it would be advantageous to obtain some performance and set point data about the cooling system. Considering the additional complexity this involves it is recommended that a full simulation model of the facility be calibrated against the measured data instead to determine the working (average) fixed and proportional overheads. In the BCS data centre model it is possible to consider the instantaneous fixed and proportional overheads at each time point to obtain greater granularity and accuracy.
8.1.5 Dynamic free cooling Dynamic free cooling provides many of the benefits of fresh air cooling using more familiar chilled water loop technologies and presents significant retrofit opportunities. It is possible to use an intelligent control system to optimise the use of free cooling in a chilled water based system. At lower heat loads it is possible to run the free chilled water to the CRAC units at a higher temperature than in a normal system whilst still achieving the required cooling, this significantly extends the external temperature range through which the facility can operate on the free cooling coils. When the heat load in the facility or the external temperature exceeds the thresholds then the compressor pumps are started and the system reverts to normal operation. See14 for more information.
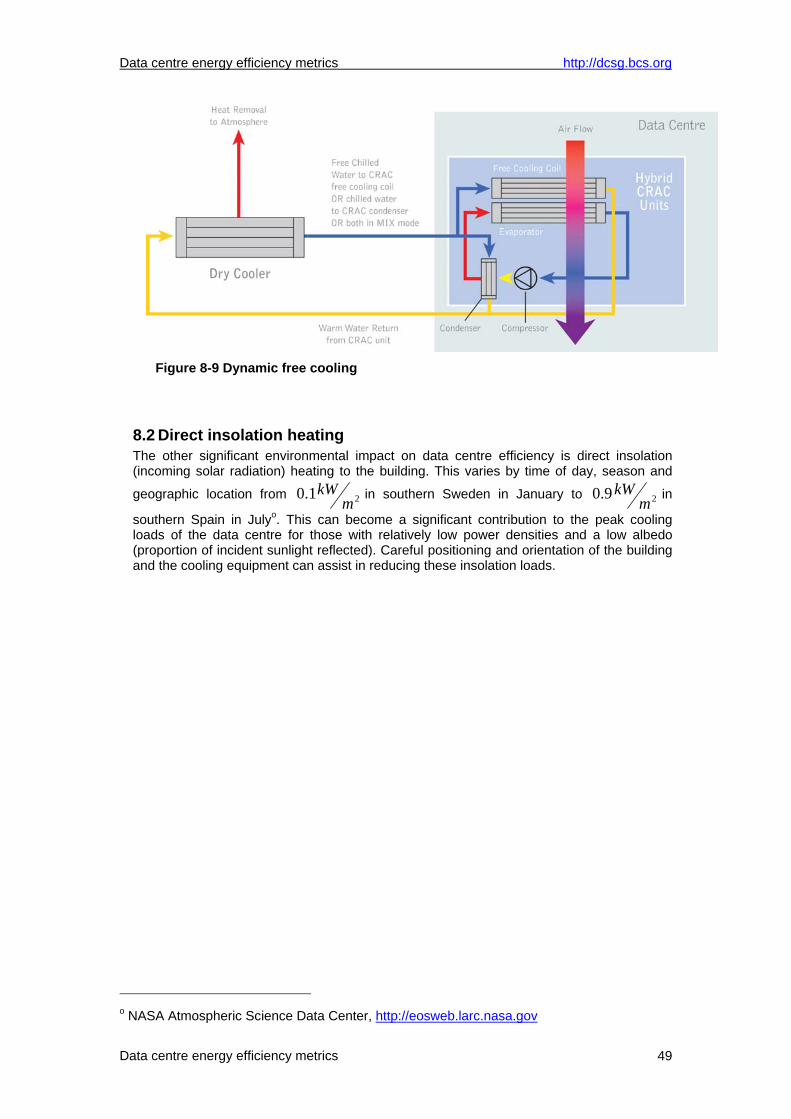
Data centre energy efficiency metrics http://dcsg.bcs.org
Data centre energy efficiency metrics 49
Figure 8-9 Dynamic free cooling
8.2 Direct insolation heating The other significant environmental impact on data centre efficiency is direct insolation (incoming solar radiation) heating to the building. This varies by time of day, season and
geographic location from 21.0 mkW in southern Sweden in January to 29.0 m
kW in
southern Spain in Julyo. This can become a significant contribution to the peak cooling loads of the data centre for those with relatively low power densities and a low albedo (proportion of incident sunlight reflected). Careful positioning and orientation of the building and the cooling equipment can assist in reducing these insolation loads.
o NASA Atmospheric Science Data Center, http://eosweb.larc.nasa.gov
Data centre energy efficiency metrics http://dcsg.bcs.org
Data centre energy efficiency metrics 50
9 Glossary
9.1 Power provisioning terms The following terms are used in BCS Data Centre Specialist Group documents to refer to the power and cooling capacity allocated to IT equipment within the data centre at the time of provisioning.
Nameplate power The Nameplate power of an IT device is defined as the rated power of the power supply (or supplies where more than one is required to operate the device), this is frequently substantially larger then the maximum power the equipment draws.
Peak power The peak power is the maximum power that could be drawn at the power supply of the IT equipment. This is determined by adding up the peak power requirement of each component within the device plus overheads. For a server this would involve adding up the power of the processor(s), memory, IO cards, main board, chassis and disks and then factoring the losses of the voltage converters and power supplies.
Statistical provisioning The statistical approach is frequently used in large Internet data centres where there are large numbers of the same class of hardware under the same workloads. This allows the operator to measure the peak power used by a rack of their standard servers and then provision to this value15. This presents possible reliability issues and requires some safety headroom as each server, rack or group could suffer a surge in workload, such as under a DOS attack and draw substantially more power than is provisioned.
Smart or dynamic provisioning An emerging approach to power provisioning is to install equipment that is capable of responding to external requests to reduce its power consumption and then use an active power management system. This allows an operator to fully utilise their data centre by filling it with equipment and then protecting the facility by ‘clamping’ the performance and therefore power draw of individual or groups of systems when power and cooling capacity is reached16. There are clear and significant reliability risks inherent to this approach, particularly as the fault containment boundaries of the M&E infrastructure are crossed by this approach generating the risk of a cascade or positive feedback failure of the part or all of the facility.
9.2 Efficiency metrics and measures The following terms for efficiency metrics are used in this paper;
PUE This is the power usage effectiveness metric as defined by the Green Grid, the utility electrical load of the data centre divided by the IT electrical load.
DCiE This is the data center infrastructure efficiency metric as defined by the Green Grid, the IT electrical load divided by the utility electrical load of the data centre.
Design DCiE/PUE This is the DCiE or PUE measured at the IT electrical load (usually peak) that maximises the metric by minimising the impact of the fixed load overheads.

Data centre energy efficiency metrics http://dcsg.bcs.org
Data centre energy efficiency metrics 51
Achieved DCiE/PUE This is the DCiE or PUE measured when the facility is operating under the actual production IT electrical load. This is a variable value and therefore represents a moving target.
Fixed overhead This is the BCS DCSG proposed metric to describe the utility electrical load of the data centre that is present irrespective of IT equipment electrical load.
Proportional overhead This is the BCS DCSG proposed approximating metric to describe the additional utility electrical load of the data centre above the fixed overhead that is proportional to the IT electrical load.
9.3 Power draw terms There are a number of points at which it is useful to refer to the electrical power draw within the data centre;
IT electrical load This is the power drawn at the power supply input of the IT equipment housed within the data centre. This is also referred to as the IT equipment power.
Utility electrical load This is the power drawn at the electric utility or onsite power generation input to the data centre, including the IT electrical load, fixed and proportional overheads. This is also referred to as the total facility power.

Data centre energy efficiency metrics http://dcsg.bcs.org
Data centre energy efficiency metrics 52
10 Acknowledgements The DCSG would like to thank the following people for their input, review and comment on this paper during the review phases;
The DCSG committee and membership
Paul Elliott, Future Tech
Ian Bitterlin, Chloride
Bernard Aebischer, ETH
Benjamin Petschke, Stulz
Victor Smith, Dell

Data centre energy efficiency metrics http://dcsg.bcs.org
Data centre energy efficiency metrics 53
11 References
1 Kenneth G Brill, The Invisible Crisis in the Data Center: The Economic Meltdown of Moore’s Law 2 Going Green? The Reader Perspective, Dale Vile, Freeform Dynamics 3 Carbon Trust joins up with British Computer Society to cut carbon from data centres, http://www.bcs.org/server.php?show=ConWebDoc.19925 4 Quoi de neuf dans le domaine de l’efficacité énergétique des data centres?, Centre for Energy Policy and Economics (CEPE), ETH Zürich, September 10, 2007, Aebischer, Bernard 5http://www.thegreengrid.org/events/technical_forum/Day_1.Track_1._Rating_Systems_for_Data_Centers_P.pdf 6 Enabling the Energy-Efficient Data Center, C Belady, J Pflueger, Green Grid http://www.dell.com/downloads/global/power/ps1q08-20080199-GreenGrid.pdf 7 THE GREEN GRID DATA CENTER POWER EFFICIENCY METRICS: PUE AND DCiE, http://www.thegreengrid.org/gg_content/TGG_Data_Center_Power_Efficiency_Metrics_PUE_and_DCiE.pdf 8 APC, Electrical Efficiency Modeling of Data Centers, Rasmussen, Neil, http://www.apcmedia.com/salestools/NRAN-66CK3D_R1_EN.pdf 9 Analysis spreadsheet for data centre efficiency metrics white paper, DCSG members repository, http://dcsg.bcs.org//component/option,com_docman/task,cat_view/gid,22/Itemid,50/ 10 APC, Electrical Efficiency Modeling of Data Centers, Rasmussen, Neil, http://www.apcmedia.com/salestools/NRAN-66CK3D_R1_EN.pdf 11 EU Code of Conduct for Data Centres, http://sunbird.jrc.it/energyefficiency/html/standby_initiative_data%20centers.htm 12 Fresh Air Cooling, Paul Elliott, Future Tech, http://dcsg.bcs.org//component/option,com_docman/task,cat_view/gid,17/Itemid,50/ 13 Model-Based Approach for Optimizing a Data Center Centralized
Cooling System, Beitelmal, Patel, http://www.hpl.hp.com/techreports/2006/HPL-2006-67.pdf 14 State of the Art Energy Efficient Data Centre Air Conditioning, Benjamin Petschke, Stulz
http://www.stulz.de/en/downloads/general-information/ 15 Power Provisioning for a Warehouse-sized Computer, Fan, Weber, Barroso, http://research.google.com/archive/power_provisioning.pdf 16 Dynamic Power Management has Significant Values, Intel, http://communities.intel.com/openport/blogs/server/2008/04/11/dynamic-power-management-has-significant-values-a-baidu-case-study