data centre risk index report 2016 web
TRANSCRIPT
DATA CENTRE RISK INDEX
2016
INFORMING GLOBAL LOCATION STRATEGIES IN A DIGITAL WORLD EXPANDING AT A PHENOMENAL PACE
2
INTRODUCTION
The index ranks key established and emerging locations by the most appropriate risks affecting data centre operations in today’s current climate. It has been designed primarily to support data centre due diligence and senior decision making when considering global investment and deployment activities.
Out latest edition, Data Centre Risk Index 2016, features 37 countries, a detailed scene setter surrounding the digital world and individual country and regional market commentaries.
INDEX BACKDROP

WHAT RISK FACTORS ARE INCLUDED AND WHY?
Following a global survey of more than 4,000 clients, carried out in the closing months of 2015, the criteria used in assessment has evolved. The risk factors have been trimmed from 13 to 10 with the survey also revealing that the individual risk criteria are now more evenly considered in terms of importance within the data centre world. This dilution is reflective of occupiers taking decisions across a broader, more equal spread of key decision making inputs with the aim of successfully prioritising risk, proximity to end market and ability to enhance the customer experience.
Despite this, our survey did highlight a growing concern among corporates surrounding political stability, natural disaster risk and energy security which have now surpassed more traditional drivers such as cost and connectivity. Natural disaster and a location’s coping capability ranked as the most important risk factors while political stability ranked second this year, collectively accounting for one third of overall decision making and implying a level of emotional sentiment throughout the survey following a number of major incidents over the past few years. Whether these risks outweigh the proximity picture, and corporates begin to realign real estate accordingly, is yet to be seen and is not always the case, with individuals weighing up the risks against the pressure of being able to serve consumers within the markets in which they operate.
Data centre downtime can cost providers millions in lost revenue and compensation. It can also threaten the livelihood of a business by causing irreparable damage to its reputation. The Data Centre Risk Index assesses various macro level risks – physical, economic and social, that could cause a threat to service continuity and uptime.
Although the Data Centre Risk Index clearly demonstrates that some countries provide a better overall environment for data centres than others, underlying commercial considerations remain a key driver, and therefore the need to be in a particular territory may take precedence over the risks highlighted by the Index. As such, by definition, the Data Centre Risk Index allows business decision makers to anticipate the risks and put in place appropriate measures to mitigate and manage threats accordingly.
The Index is a unique tool, bringing together the core risks and weighting them to create a balanced and comprehensive risk assessment methodology. All our information is sourced from reputable and published third party sources.
The Index is designed to assist companies in making strategic investment and operational decisions about where to locate their data, whether it be server rack deployments or the creation of brand new facilities. Each country has its own risk profile which should be reviewed against the commercial opportunity, business requirement and the company’s preference for risk aversion.
GETTING TO GRIPS WITH THE BASICS - WHAT IS RISK AND WHY SHOULD IT BE CONSIDERED?
3

4
THE RISKS AND APPROPRIATE WEIGHTINGS
The Data Centre Risk Index identifies the top risks likely to affect the successful operation of a data centre, and applies an individual weighting to those risks to create a balanced view and ranking of selected countries.
Criteria Weighting
Energy (Cost per Kwh) 8.97%
International Internet Bandwidth (Mbit/s)
11.54%
Ease of Doing Business (World Bank Ranking)
11.54%
Corporation Tax 6.41%
Political Stability (EIU Instability Index) 12.82%
Sustainability (% Energy from Alternatives)
8.97%
Natural Disaster 15.38%
Energy Security 12.18%
GDP per Capital 5.77%
Water (Availability per Capital) 6.41%

5
A ONE SIZE FITS ALL MODEL?
If your priorities and approach to risk require a different weighting, the flexibility of the Data Centre Risk Index allows for different weightings to be applied, methodology and considerations. The Index is based on a flexible risk assessment methodology and it can be applied to any country in the world.
ASSESSING BOTH THE MACRO AND MICRO
The Data Centre Risk Index identifies risk at a macro/ country level. Countries scoring poorly on the Index might be able to offer the ideal environment for a data centre at a micro/local level and should not be discounted. The Data Centre Advisory team can provide an in-depth country assessment where required. It should also be noted that many risks can be mitigated or managed with the introduction of relevant safeguards. In certain circumstances, the cost of these measures will be outweighed by the commercial need to be in a particular territory.
6
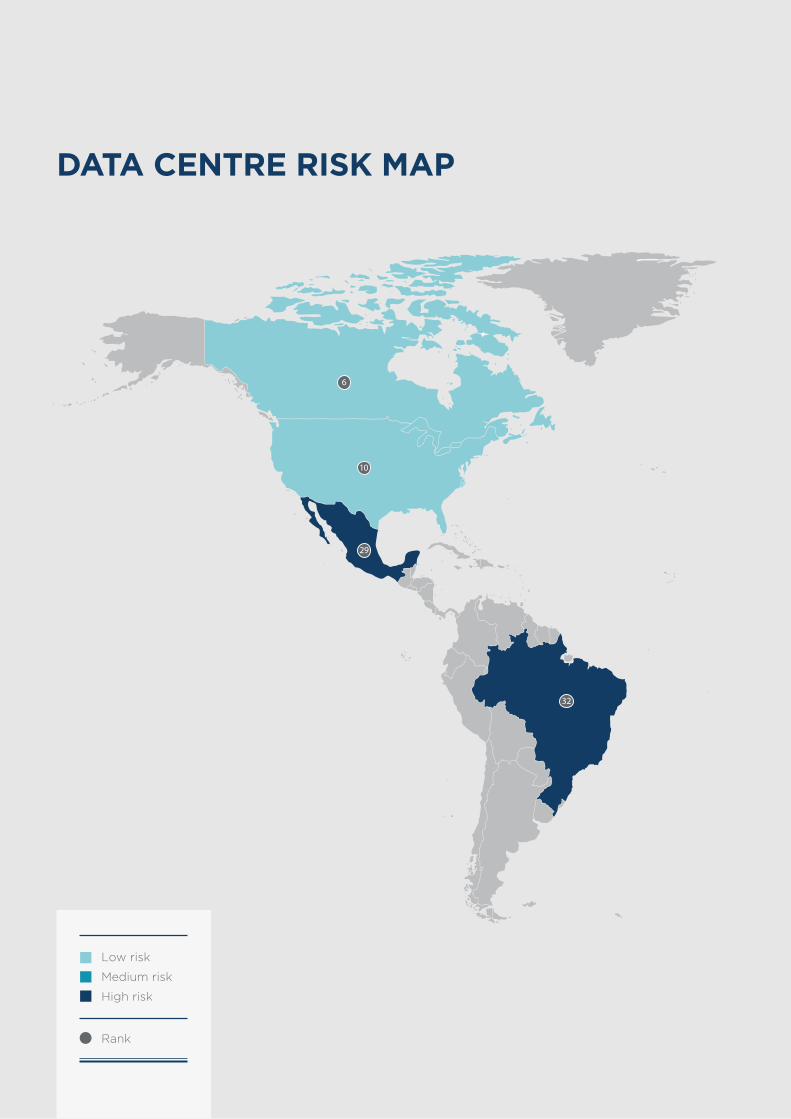
DATA CENTRE RISK MAP
1
6
10
20
2
29
32
Low risk
Medium risk
High risk
Rank

1
2
3
45
7
8
9
11
12
13
14
15
16
1718
19
20
21
2223
24
25
26
27
28
30
31
33
34
35
36
37
7
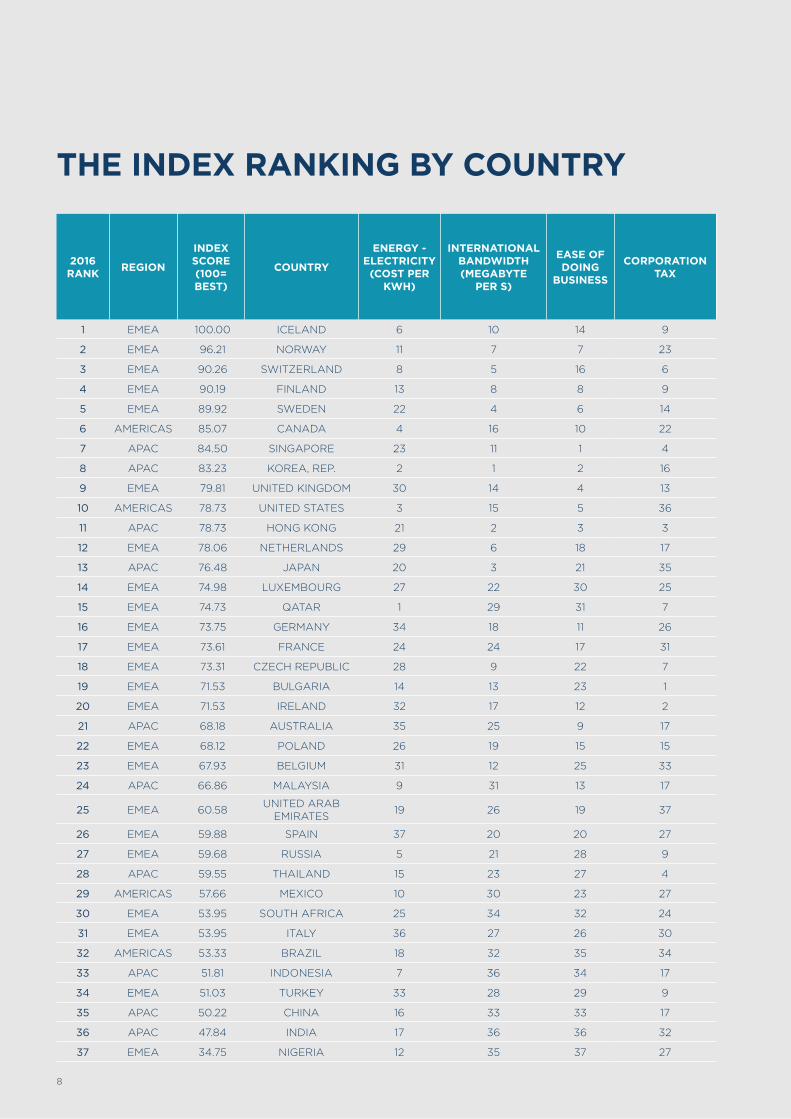
THE INDEX RANKING BY COUNTRY
2016 RANK REGION
INDEX SCORE (100= BEST)
COUNTRY
ENERGY - ELECTRICITY
(COST PER KWH)
INTERNATIONAL BANDWIDTH (MEGABYTE
PER S)
EASE OF DOING
BUSINESS
CORPORATION TAX
1 EMEA 100.00 ICELAND 6 10 14 9
2 EMEA 96.21 NORWAY 11 7 7 23
3 EMEA 90.26 SWITZERLAND 8 5 16 6
4 EMEA 90.19 FINLAND 13 8 8 9
5 EMEA 89.92 SWEDEN 22 4 6 14
6 AMERICAS 85.07 CANADA 4 16 10 22
7 APAC 84.50 SINGAPORE 23 11 1 4
8 APAC 83.23 KOREA, REP. 2 1 2 16
9 EMEA 79.81 UNITED KINGDOM 30 14 4 13
10 AMERICAS 78.73 UNITED STATES 3 15 5 36
11 APAC 78.73 HONG KONG 21 2 3 3
12 EMEA 78.06 NETHERLANDS 29 6 18 17
13 APAC 76.48 JAPAN 20 3 21 35
14 EMEA 74.98 LUXEMBOURG 27 22 30 25
15 EMEA 74.73 QATAR 1 29 31 7
16 EMEA 73.75 GERMANY 34 18 11 26
17 EMEA 73.61 FRANCE 24 24 17 31
18 EMEA 73.31 CZECH REPUBLIC 28 9 22 7
19 EMEA 71.53 BULGARIA 14 13 23 1
20 EMEA 71.53 IRELAND 32 17 12 2
21 APAC 68.18 AUSTRALIA 35 25 9 17
22 EMEA 68.12 POLAND 26 19 15 15
23 EMEA 67.93 BELGIUM 31 12 25 33
24 APAC 66.86 MALAYSIA 9 31 13 17
25 EMEA 60.58 UNITED ARAB EMIRATES 19 26 19 37
26 EMEA 59.88 SPAIN 37 20 20 27
27 EMEA 59.68 RUSSIA 5 21 28 9
28 APAC 59.55 THAILAND 15 23 27 4
29 AMERICAS 57.66 MEXICO 10 30 23 27
30 EMEA 53.95 SOUTH AFRICA 25 34 32 24
31 EMEA 53.95 ITALY 36 27 26 30
32 AMERICAS 53.33 BRAZIL 18 32 35 34
33 APAC 51.81 INDONESIA 7 36 34 17
34 EMEA 51.03 TURKEY 33 28 29 9
35 APAC 50.22 CHINA 16 33 33 17
36 APAC 47.84 INDIA 17 36 36 32
37 EMEA 34.75 NIGERIA 12 35 37 27
8

POLITICAL STABILITY
SHARE OF RENEWABLES
IN TOTAL ENERGY
SUPPLY (%)
WORLD RISK ASSESSMENT VULNERABILITY AND COPING
CAPACITY (NATURAL DISASTER/ ECONOMIC & POLITICAL
CHALLENGES IN URBAN AREAS)
ENERGY SECURITY
GDP PER CAPITA
WATER AVAILABILITY
6 1 2 22 13 2
1 2 7 3 5 4
6 10 8 1 6 6
9 7 5 7 19 1
9 5 4 2 11 5
2 11 12 5 15 14
4 33 6 17 3 18
26 34 25 29 22 16
4 30 17 4 17 10
9 24 19 9 8 21
16 35 36 18 7 19
9 28 34 8 10 7
6 29 36 21 20 3
2 31 9 14 2 11
24 37 1 19 1 23
15 16 11 10 12 9
14 20 10 6 18 8
21 22 16 23 24 12
20 21 21 34 30 30
23 23 24 16 9 20
9 26 20 13 14 28
21 19 14 26 26 22
19 27 15 12 16 13
17 25 30 15 25 25
29 36 3 25 4 17
29 13 13 11 23 15
36 32 18 27 27 27
35 9 29 36 31 24
29 18 28 27 29 33
17 15 27 35 34 35
28 12 23 20 21 26
27 3 22 24 32 34
32 4 35 30 35 32
33 16 26 32 28 31
33 14 31 31 33 29
24 6 32 37 36 36
37 8 33 33 37 36
9

1010
REGIONAL RANKINGS
EMEA
ICELAND NORWAY
APAC
SINGAPORE KOREA, REP
AMERICAS
CANADA UNITED STATES
INDEX KEY TAKEAWAYS
• European countries continue to offer a low risk environment for data centres, securing all top five index positions.
• Top five offer politically stable environments for doing business while offering a low risk location in terms of natural disaster risk and strong fundamentals in terms of energy security and share of renewable resources.
• Market realities are also reflected within the index with Singapore, South Korea and Hong Kong all featuring highly – the latter two evidence that proximity to market, ease of doing business and IT infrastructure can offset the risks of locating within a natural disaster zone while Singapore ranks as the most attractive market for doing business within our index.
• Tax favourable environments result in Ireland and Bulgaria ranking similarly – yet in reality Ireland’s critical mass leads to a much higher level of investment/occupancy with corporate clustering and co-location remaining ever important.

11
SWITZERLAND ITALY TURKEY NIGERIA
HONG KONG INDONESIA CHINA INDIA
MEXICO BRAZIL
Top
Bottom

12
MARKET BACKDROP
No matter the business, data continues to grow in its importance. At the same time the sheer volume, accessibility and requirements for its storage and transport, are ballooning. The digital universe is more or less doubling in size every few years, according to the IDC and the need to support and deliver time critical information to end users places huge pressure on the infrastructure, resources and inevitably corporate real estate location decisions.
BUT THERE REMAIN A FEW KEY GLOBAL CHALLENGES
Firstly, in the open market good quality space is being absorbed quickly in core markets and on, what seems in places, an industrial scale, especially by the cloud providers. The emergence of the “edge” data centre with proximity to large domestic markets is a case in point.
Whilst the provision of space is capital intensive, creating a high value asset class, pricing remains competitive and margins historically tight for the providers in a good proportion of the core markets. There is concern that aggressive pricing structures have driven some companies to the brink of failure, whilst the occupier has enjoyed the sun in recent years, the result will only mean increased consolidation, reduced choice and a return to rising occupational costs.
Finally, if hosted and cloud based applications are to thrive at the scale they are anticipated to do so then the need for a secure platform and location from which to operate from remains critical and where the Data Centre Risk Index can be part of the decision-making toolkit.
THE DATA CENTRE REMAINS THE MILLSTONE IN THE DIGITAL MIX
With such a diverse range of products being developed, service providers are seeking to ensure successful delivery into end markets. At the same time resellers are differentiating their offerings as the market becomes more competitive. Meanwhile the data centre forever remains the millstone in the broadening digital mix.
The industrial scale of demand has led to a rise in mega-data centres which are fast becoming a staple of our global technology infrastructure, serving as the backbone of the digital economy. The growth of the internet is driving an enormous appetite for network capacity and data storage, creating a new class/size of data centres, requiring in some instances of upwards of 1 million sq ft that can scale along with internet growth.
13
14
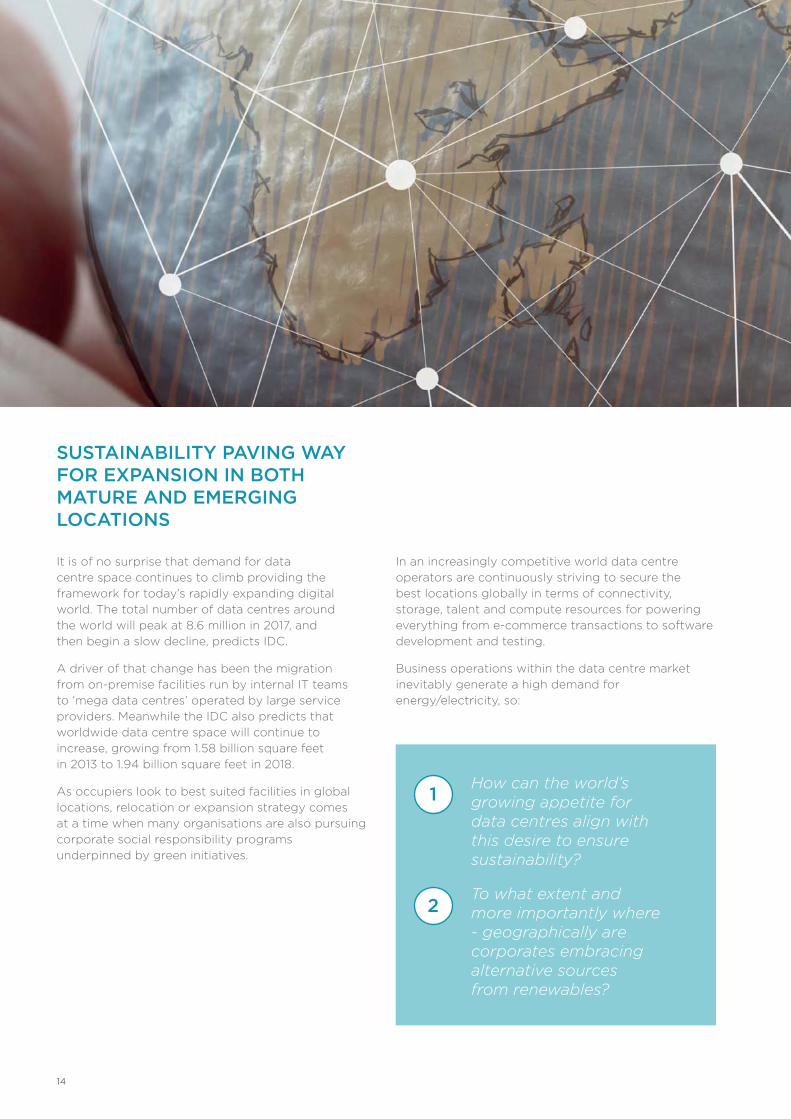
SUSTAINABILITY PAVING WAY FOR EXPANSION IN BOTH MATURE AND EMERGING LOCATIONS
It is of no surprise that demand for data centre space continues to climb providing the framework for today’s rapidly expanding digital world. The total number of data centres around the world will peak at 8.6 million in 2017, and then begin a slow decline, predicts IDC.
A driver of that change has been the migration from on-premise facilities run by internal IT teams to ‘mega data centres’ operated by large service providers. Meanwhile the IDC also predicts that worldwide data centre space will continue to increase, growing from 1.58 billion square feet in 2013 to 1.94 billion square feet in 2018.
As occupiers look to best suited facilities in global locations, relocation or expansion strategy comes at a time when many organisations are also pursuing corporate social responsibility programs underpinned by green initiatives.
In an increasingly competitive world data centre operators are continuously striving to secure the best locations globally in terms of connectivity, storage, talent and compute resources for powering everything from e-commerce transactions to software development and testing.
Business operations within the data centre market inevitably generate a high demand for energy/electricity, so:
How can the world’s growing appetite for data centres align with this desire to ensure sustainability?
1
To what extent and more importantly where - geographically are corporates embracing alternative sources from renewables?
2

15
GREEN INITIATIVES SET TO GAIN TRACTION?
While data centres present a natural opportunity for sustainability improvements, since they typically use large amounts of power, the push for greener computing infrastructure is causing increasing numbers of organisations to rethink where they locate and how they’re designing data centre space to meet requirements.
It is important to highlight that sustainability comes in a number of forms. While corporates are looking for ways to cut consumption levels technological advances illustrate the efficiency of modern day products and devices which operate much more efficiently. Although the grid doesn’t know the difference between renewable and coal fired operations, different geographic areas are certainly known for their production of renewable energy with positive branding and corporate social responsibility also acting as secondary benefits in these cases. Through purchasing renewable energy sources and/or cutting back energy use and minimising environmental footprints, green initiatives certainly can cut bottom line operating costs.
With a rising number of data centre operators seeking sustainable sources to support their operations, the Nordics and Canada represent prime examples of countries where more sustainable and renewable options are already in place. Locations such as Iceland, Norway and Switzerland score highly within our index and with a large share of renewables tends to come a secure energy supply.

MARKETS OF TODAY & TOMORROW – HOW IS SUSTAINABILITY IMPACTING THE DATA CENTRE LANDSCAPE?
But, in reality what proportion do these locations make up in terms of the overall global data centre market? With Europe attributable for approximately 20% of the global data centre market the Nordics only accounts for say less than 2% globally – if we add Canada into the mix this would potentially rise to say just 3%. While this reveals that proximity to market remains the key picture we do anticipate that these locations will develop a wider data centre platform - they must with sustainability measures and demands continuing to move up the agenda.
In contrast emerging markets elsewhere specific to the EU and inclusive of the likes of Czech Republic, Bulgaria, and Poland while remaining attractive locations are facing a fundamental issue, a lack of renewable energy sources. This has and will continue to hold these locations back from realising their full potential.
With energy security featuring highly in our index the reliance on the delivery of a new pipeline out of the Ukraine continues to have a downward drag on the rankings for these locations. As such it is inevitable that these markets are going to have to implement a shift in share of renewables to become more attractive to corporates, which are increasingly moving away from reliance on energy sourced from fossil fuels. At the same time, with proximity to end market remain all important we have started to see a number of providers investing in renewables elsewhere to run their data centres while still locating in markets close to end users – with Apple being an example of what we anticipate to be a growing trend.
Beyond energy security sheer market connectivity remains a key driver of corporate location strategy. We source global connectivity levels from Akamai’s connectivity study for our index.
16
17
CONNECTIVITY REMAINS A CRITICAL DECISION MAKING DRIVER
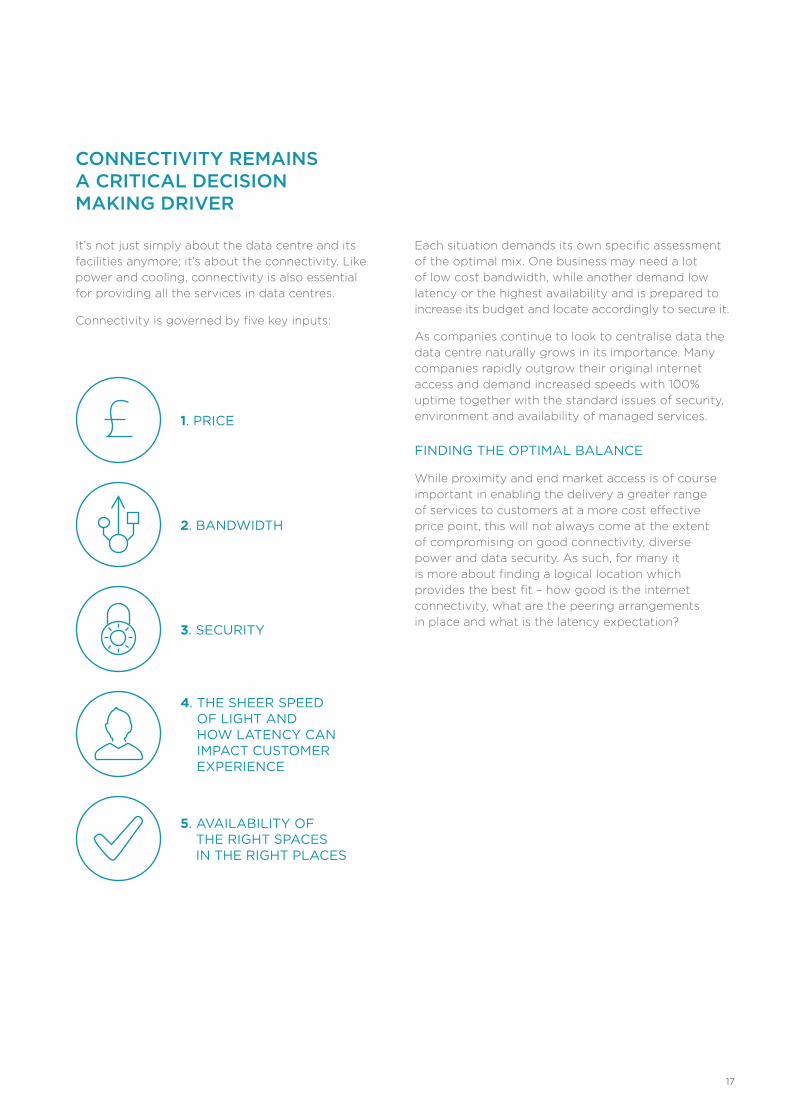
It’s not just simply about the data centre and its facilities anymore; it’s about the connectivity. Like power and cooling, connectivity is also essential for providing all the services in data centres.
Connectivity is governed by five key inputs:
Each situation demands its own specific assessment of the optimal mix. One business may need a lot of low cost bandwidth, while another demand low latency or the highest availability and is prepared to increase its budget and locate accordingly to secure it.
As companies continue to look to centralise data the data centre naturally grows in its importance. Many companies rapidly outgrow their original internet access and demand increased speeds with 100% uptime together with the standard issues of security, environment and availability of managed services.
FINDING THE OPTIMAL BALANCE
While proximity and end market access is of course important in enabling the delivery a greater range of services to customers at a more cost effective price point, this will not always come at the extent of compromising on good connectivity, diverse power and data security. As such, for many it is more about finding a logical location which provides the best fit – how good is the internet connectivity, what are the peering arrangements in place and what is the latency expectation?
1. PRICE
2. BANDWIDTH
3. SECURITY
4. THE SHEER SPEED OF LIGHT AND HOW LATENCY CAN IMPACT CUSTOMER EXPERIENCE
5. AVAILABILITY OF THE RIGHT SPACES IN THE RIGHT PLACES
18
GET YOURSELF CONNECTED - WHICH MARKETS ARE ATTRACTIVE AND WHY?
Data is becoming a more important tool for businesses every day, in almost every industry. Smaller businesses are using bigger data and the market for storage, collaboration and information management tools is on an upward curve.
Subsequently, a number of markets within our index score highly by offering an extremely robust and connected marketplace both in terms of operation and delivery. Markets from Asia Pacific such as Korea, Hong Kong, Singapore and Japan score highly as a result. While in EMEA, Switzerland and Sweden offer strong bandwidth rankings within our index, however, this is not necessarily reflected in internet traffic. Amsterdam remains the gateway to Europe and Frankfurt has seen stellar growth over the last few years driving a continued appetite for data centre colocation space.
In other scenarios bigger players are taking matters into their own hands in order to locate in markets offering up favourable alternative criteria. Locations are being chosen based on other factors with connectivity installed, in some instances on a bespoke basis to boost service offerings.
Examples of this include Apple’s decision to locate in Ireland and lay their own trans-Atlantic private network infrastructure. With key pinch points developing in respect of bandwidth, one could anticipate other leading enterprises being prepared to invest in a similar way.
NATURAL DISASTERS - ASSESSING NOT JUST THE VULNERABILITY BUT ALSO THE COPING CAPACITY OF LOCATIONS
When assessing risk it is important not only to assess the vulnerability of a location but also the coping capacity in an event of a natural disaster.
BUT WHAT EXACTLY DO WE MEAN BY THESE TWO TERMS?
Vulnerability comprises the components of susceptibility, lack of coping capacities and lack of adaptive capacities in relation to social, physical, economic and environmental factors which make systems susceptible to the impacts of natural hazards, the adverse effects of climate change or other transformation processes. Moreover, the term vulnerability covers factors which comprise the abilities and capacities systems in order to cope with and adapt to the negative impacts of natural hazards.
The terms coping capacities comprises various abilities of societies and exposed elements to minimise negative impacts of natural hazards should they occur and climate change through direct action and the resources available. Coping capacities encompass measures and abilities that are immediately available to reduce harm and damages in the occurrence of an event.
Both interrelate, while overall risk associated with natural disasters carries the highest weighting within our index at more than 15%.
Indonesia, Hong Kong and Thailand within our index all fall into high risk categories in terms of natural disaster exposure. While Norway has cemented its index position by a lower risk environment. Elsewhere, Qatar and the UAE also represent lower risk alternatives.
Despite this a vast amount of data centres globally continue to be located within high risk locations, as service providers focus on proximity and accessibility of end markets as an acceptable trade-off in relation to the risks natural disasters pose to their infrastructures.

19z

20
CORPORATION TAX – A GOVERNMENT LEVER FOR INWARD INVESTMENT
While making up just 6.4% of our overall index corporation tax is still regarded as a strong incentive when considering where to locate data centre facilities.
A number of locations have grown in attractiveness as a function of a competitive tax environment and, where able to attract major brands over a longer period the critical mass associated with occupancy within these markets has paved the way for further expansion.
Ireland is a primary example of this, with the second lowest corporate tax environment within our index and it is no secret that most of the global leaders in the IT Infrastructure sector operate large data centres in Dublin or are building large data centres there as a function of a favourable tax environment.
US companies looking to tap into Europe have typically started to use Dublin as a key landing point before expanding eastwards into more traditional markets. The likes of Google, Microsoft, AWS, Apple, Facebook, Digital Realty, and a long list of IT services providers, have already chosen to locate in Ireland with Amazon, Google, Microsoft, Apple and Facebook, having invested more than $2 billion during 2014 and 2015 to date and further expansion plans in the pipeline.
BREAKING AWAY FROM HERD MENTALITY
While Ireland offers a tax favourable market its attractiveness is rather mixed when it comes to alternate criteria within our index. So, in reality is it possible a more balanced environment elsewhere may overcome relocation strategies focused so selectively around existing brand clustering such as that seen in Ireland?
Looking eastwards within EMEA there is certainly a case for reconsideration. Bulgaria, not only offers a favourable tax environment but also strong connectivity and low cost energy.
Further afield, in well established markets of Singapore and Hong Kong these locations continue to benefit from an attractive tax environment and this is reflected in their overall index ranking of 7th and 11th respectively.

2121
CONCLUSIONAs the digital world changes at a phenomenal pace and businesses strive to use IT to gain competitive advantage, the pressure on decision-makers has arguably never been greater. The Cushman & Wakefield Data Centre Risk Index gives insight into the macro locational view but so much more needs to be taken into account. These include the likes of information security, soaring IT adoption rates in emerging markets, data privacy, increasing obsolescence of existing facilities (with substantial residual book values, liabilities and vacancy) and how to manage and store the sheer volume of data being generated.
On the flip side, the technology and telecommunications arena is an exciting place to be with the advent of 5G, continued M&A activity and corporate divorces. Add to that advancement in space technology and the expectation for increasing reliance on low orbit satellites for connectivity, we can see the industry community begin to see beyond our own backyards.
Comparing the Cushman & Wakefield Data Centre Risk Index 2016 to the last edition in 2013, we have seen sentiments change and broaden in what is a relatively short period of time. This only serves to underpin our observation that when it relates to data centres, however hard, endeavour to anticipate everything – to assume will only lead to errors in judgment.

ABOUT CUSHMAN & WAKEFIELD
43,000 Employees
Offices in more than 60 countries
£5bnIn revenue
4.3bnSq Ft Managed
£191bn In transaction value
Confidently Global,
Expertly Local
Cushman & Wakefield is a leading global real estate services firm that helps clients transform the way people work, shop, and live. Our 43,000 employees in more than 60 countries help investors optimise the value of their real estate by combining our global perspective and deep local knowledge with an impressive platform of real estate solutions. Cushman & Wakefield is among the largest commercial real estate services firms with revenue of $5 billion across core services of agency leasing, asset services, capital markets, facility services (C&W Services), global occupier services, investment & asset management (DTZ Investors), project & development services, tenant representation, and valuation & advisory. To learn more, visit www.cushmanwakefield.com or follow @CushWake on Twitter.
22
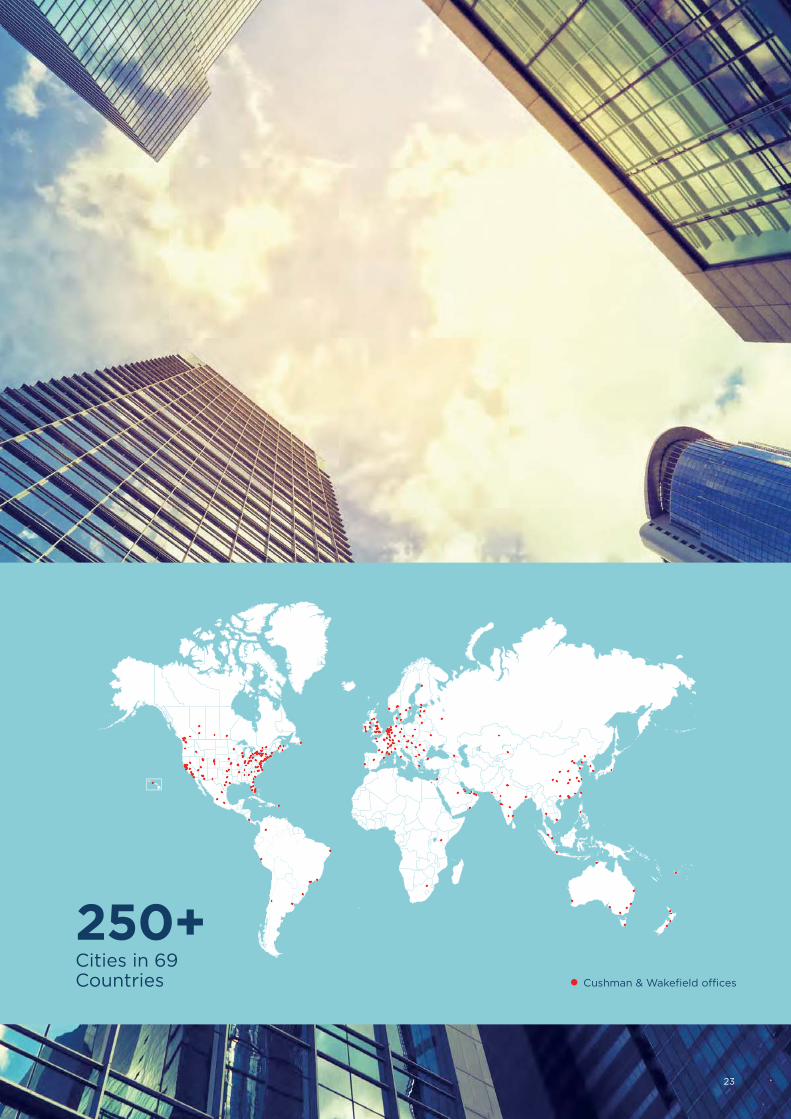
Cities in 69 Countries Cushman & Wakefield offices
250+
23

CONTACT DETAILS
Mark TrevorSenior DirectorEMEA Data Centre Advisory Group+44 (0) 20 3296 [email protected]
Keith Inglis, MRICSPartner, Account Management Global Occupier ServicesTechnology & Telecommunications Sector Group+44 (0) 20 3296 [email protected]
Andrew HeardResearch+44 (0) 20 3296 [email protected]
Copyright © 2016 Cushman & Wakefield. All rights reserved.
This report has been produced by Cushman & Wakefield LLP (C&W) for use by those with an interest in commercial property solely for information purposes and should not be relied upon as a basis for entering into transactions without seeking specific, qualified professional advice. It is not intended to be a complete description of the markets or developments to which it refers. This report uses information obtained from public sources which C&W has rigorously checked and believes to be reliable, but C&W has not verified such information and cannot guarantee that it is accurate or complete. No warranty or representation, express or implied, is made as to the accuracy or completeness of any of the information contained in this report and C&W shall not be liable to any reader of this report or any third party in any way whatsoever. All expressions of opinion are subject to change. The prior written consent of C&W is required before this report or any information contained in it can be reproduced in whole or in part, and any such reproduction should be credited to C&W.