data collection and analysis engr 1181 class 7. data collection in the real world data is collected...
TRANSCRIPT

Data Collection and AnalysisENGR 1181Class 7

Data Collection in the Real WorldData is collected all of the time, just think about it. When you are at the grocery store using your “loyalty card” or when the Google maps SUV is taking videos of your street.

Today's Learning ObjectivesAfter today’s class, students will be able to…
• Define accuracy, precision, and resolution.• Define systematic variation and random
variation.• Define the terms mean, median, mode, central
tendency, and standard deviation.• Analyze data using mean, median, and
standard deviation.

Today’s Plan Review of important terms from prep
reading
Lecture: Statistical terms
If time, start homework

Review of Important Terms“Clicker activity”
When measuring the length of an object, does accuracy and precision mean the same thing?
1. Yes
2. No

Review of Important TermsWhat is accuracy?
The degree of closeness between a measured value and the correct value. (implies there is a correct value!)
Precision is based on repeatability and resolution

Review of Important TermsWhat is repeatability?
The degree of closeness between repeated measurements of the same feature.
What is resolution?
The smallest measurable increment on a measurement device.

Review of Important Terms“Clicker activity”
Is this:
1. Repeatable and accurate?
2. Accurate, but not repeatable?
3. Repeatable, but not accurate
4. Neither accurate nor repeatable

Review of Important Terms“Clicker activity”
Is this:
1. Repeatable and accurate?
2. Accurate, but not repeatable?
3. Repeatable, but not accurate
4. Neither accurate nor repeatable

Review of Important TermsWhat is an example of a Systematic Error?

Review of Important TermsWhat is an example of a Random Error?

Sample Data 8 sample
measurements were collected using two different instruments• Scale
• Caliper

Sample DataSample Diameter Measurements, Shampoo Bottle A
Trial Scale Caliper
1 1.2 1.011
2 1.1 1.039
3 1.0 1.005
4 1.1 1.015
5 1.0 1.024
6 1.1 1.029
7 1.1 1.031
8 1.2 1.024
8 sample measurements were collected using two different instruments
The expected value is 1.020 inches
Which instrument has a higher resolution?
Which measurement offer good accuracy?
Which measurements offer good repeatability?
• 1. Scale or
• 2. Caliper

Sample Data Notice how the
measurements fall above and below the specified value of 1.02”
Which measurement tool provided more accurate values?• 1. Scale or• 2. Caliper 0 1 2 3 4 5 6 7 8
0.900
0.950
1.000
1.050
1.100
1.150
1.200
Bottle A
Scale
Caliper
Trials
Measu
rment
(in.)

OutliersOutliers are values that differ greatly from the specified value.
Do we have any outliers here?
Outliers can occur from systematic or random variation, or they can be a misrepresented value.
The important thing is to figure out why the values are so different.
0 1 2 3 4 5 6 7 80.900
0.950
1.000
1.050
1.100
1.150
1.200
Bottle A
Scale
Caliper
Trials
Measu
rment
(in.)

Propagation of Error The errors from inaccurate
measurements can be magnified when the erroneous value is used in an equation.
What seems like a small error in the initial measurement can propagate to a large overall error in the calculation of an equation.

Example: Propagation of ErrorTo calculate the moment of inertia of a cantilever beam, we must measure thickness and width of the beam.
Moment of inertia is calculated by:
I = 1/12wt3
What if there is an error measuring w?
What about an error measuring t?
Cantilever Beam

ExampleBase Case: I=1/12wt3 w=3.421 in t=2.129 in I1=2.751 in4
Assume 9.5% error in w
w=3.096 in
I=1/12(3.096)(2.129)3
I2=2.490 in4
(difference of 0.261 in4)
Assume 9.5% error in t
t=1.927 in
I=1/12(3.421)(1.927)3
I3=2.040 in4
(difference of 0.711 in4)
w t w tw t
9.5%error
25.8%error

Analyzing Measurement DataWhen collecting data, there will always be variation. We can use statistical tools to help us determine:
Is the variation (or error) systematic or random?
What is the cause of the variation?
Is the variation in an acceptable range?
What is an acceptable range of variation for this data?

Example: Slingshot Experiment!An engineer is performing a data collection experiment using a slingshot and a softball.
She predicted that if the slingshot is pulled back by 1 meter before launching the ball, the softball would land 17 meters downrange.
Data is collected from 20 trials. Let’s analyze the data and see how the experiment went…

Example: The Data
Most of this data falls in the range of 14-20 meters
Do you see any data that appears much outside this range?• These rogue data points are called outliers
Outliers: Deal With It. Outliers will happen even in good data sets.
Engineers know how to deal with them!
Engineers must determine whether an outlier is a valid data point, or if it is an error and thus invalid.
Invalid data points can be the result of measurement errors or of incorrectly recording the data.

Characterizing The Data Statistics allows us to characterize the
data numerically as well as graphically.
We characterize data numerically in two ways:• Central Tendency• Variation

Central Tendency This is a single value that best
represents the data. This value could be determined by:• Mean• Median• Mode
For many engineering applications, the mean and median are most relevant.

Central Tendency: ComparisonWhich value is a better representation of the slingshot data?
Mean = 18.47 m
Median = 17.4 m
0 5 10 15 20 2510
15
20
25
30
35
40
45
50
Slingshot Distance Testing
Trial Number
Dis
tance T
raveld
[m
]

Characterizing the Data We can select a value of central
tendency to represent the data, but is just one number enough?
No! It is also important to know how much variation is present in the data.
Variation describes how the data is distributed around the central tendency value.

Representing Variation As with central tendency, there are
multiple ways to represent variation in a set of data:• ± (“Plus/Minus”) gives the range of
values• Standard Deviation provides a more
sophisticated look at how the data is distributed around the central value.

Standard VariationDefinitionHow closely the values cluster around the mean; how much variation there is in the data.
Equation
Mean = Average in Excel
=OR

Calculating Standard Deviation
𝜎=√41.32
𝜎=6.4281

Calculating in Excel
Put the cursor where you want the mean (average) or standard deviation (stdev) or mode
Click on the Function Wizard (fx) button
Type in the function name
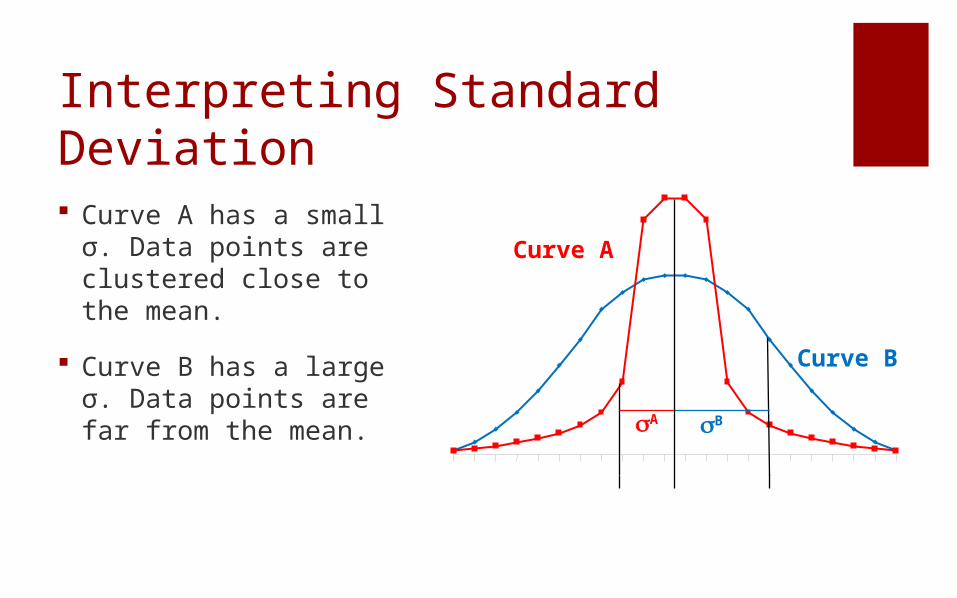
Interpreting Standard Deviation Curve A has a small σ.
Data points are clustered close to the mean.
Curve B has a large σ. Data points are far from the mean.
Curve B
Curve A
A B

What do you think?Say these curves describe the distribution of grades from an exam, with an average score of 83%...
What would be the benefit if you were in class with Curve A?
What about Curve B?
Curve B
Curve A
A B

Normal DistributionData that is normally distributed occurs with greatest frequency around the mean.
Normal distributions are also known as Gaussian Distributions or Bell Curves

Normal Distribution Mean = Median =
Mode
68% of values within 1 σ
95% of values within 2 σ
99.99966% of values are within 6 σ

Other Distributions
Skewed Distribution Bimodal Distribution

Important Takeaways We have learned about some basic
statistical tools that engineers use to analyze data.
Engineers use both central tendency and variation to numerically describe data.

Next Class Technical Communication 2