data collection study on regional development in ...open_jicareport.jica.go.jp/pdf/12068474.pdfon...
TRANSCRIPT

BDO JR
12-002
People’s Republic of Bangladesh
Data Collection Study on Regional Development
in Southeastern Bangladesh
Final Report
March 2012
JAPAN INTERNATIONAL COOPERATION AGENCY
PADECO Co., Ltd.

People’s Republic of Bangladesh
Data Collection Study on Regional Development
in Southeastern Bangladesh
Final Report
March 2012
JAPAN INTERNATIONAL COOPERATION AGENCY
PADECO Co., Ltd.

Data Collection Study on Regional Development in Southeastern Bangladesh Final Report
i
Contents
1. Outline of the Study ...................................................................................................... 1-1 1.1 Background of the Study ...................................................................................... 1-1 1.2 Objectives of the Study ........................................................................................ 1-2 1.3 Study Area and Main Organization Visited ........................................................... 1-3 1.4 Methodology of the Study .................................................................................... 1-3 1.5 Schedule of the Field Study.................................................................................. 1-4
2. Institutional Profile ....................................................................................................... 2-1 2.1 Administrative Set-Up ......................................................................................... 2-1 2.2 Chittagong Hill Tracts .......................................................................................... 2-2 2.3 Cox’s Bazar ......................................................................................................... 2-4
3. District and Community Profile ................................................................................... 3-1 3.1 District Profile ..................................................................................................... 3-1
3.1.1 Historical Background.................................................................................. 3-1 3.1.2 Natural Environment .................................................................................... 3-1 3.1.3 Population .................................................................................................... 3-2 3.1.4 Economic Situation ...................................................................................... 3-5 3.1.5 Social Situation ............................................................................................ 3-7 3.1.6 Basic Infrastructure .....................................................................................3-10 3.1.7 Poverty Situation.........................................................................................3-12 3.1.8 Public Services............................................................................................3-13
3.2 Community Profiles ............................................................................................3-17 3.2.1 Khagrachhari ..............................................................................................3-17 3.2.2 Rangamati ...................................................................................................3-25 3.2.3 Bandarban ...................................................................................................3-33 3.2.4 Cox’s Bazar ................................................................................................3-41
3.3 Issues to be Addressed ........................................................................................3-49
4. Local Industry Profile ................................................................................................... 4-1 4.1 Khagrachhari ....................................................................................................... 4-1
4.1.1 Agro-based Industries .................................................................................. 4-1 4.1.2 Particularity of Local Industries in Khagrachhari .......................................... 4-9
4.2 Rangamati ........................................................................................................... 4-9 4.2.1 Agro-based Industries .................................................................................. 4-9 4.2.2 Cottage Industry ..........................................................................................4-19 4.2.3 Particularity of Local Industries in Rangamati .............................................4-20
4.3 Bandarban ..........................................................................................................4-20 4.3.1 Agro-based Industries .................................................................................4-20 4.3.2 Tourism Industry .........................................................................................4-28 4.3.3 Particularity of Local Industries in Bandarban .............................................4-29
4.4 Cox’s Bazar ........................................................................................................4-29 4.4.1 Agro-based Industries .................................................................................4-29 4.4.2 Tourism Industry .........................................................................................4-33

Data Collection Study on Regional Development in Southeastern Bangladesh Final Report
ii
4.4.3 Particularity of Local Industries in CXB ......................................................4-34 4.5 Characteristics and Challenges of Local Industries in CHT and CXB ..................4-34
4.5.1 CHT............................................................................................................4-34 4.5.2 CXB ...........................................................................................................4-35
5. Safe Drinking Water Profile.......................................................................................... 5-1 5.1 Basic Information for Water Supply ..................................................................... 5-1
5.1.1 Geology and Geography ............................................................................... 5-1 5.1.2 Potential for Groundwater and Surface Water Development.......................... 5-5 5.1.3 Water Supply ............................................................................................... 5-6 5.1.4 Water Supply Technology............................................................................. 5-7 5.1.5 Type of Water Supply Device ....................................................................... 5-8 5.1.6 Time Spent for Water Collection and Distance of Water Source .................... 5-9 5.1.7 Water Use and Spending .............................................................................5-10 5.1.8 Community Perception on Quality of Drinking Water ..................................5-10 5.1.9 Supplier of the Technology .......................................................................... 5-11 5.1.10 Water Availability .......................................................................................5-12
5.2 Khagrachhari District ..........................................................................................5-13 5.2.1 Basic Information........................................................................................5-13 5.2.2 Current Situation of Water Supply ...............................................................5-14 5.2.3 Result of Water Quality Test ........................................................................5-14
5.3 Rangamati District ..............................................................................................5-18 5.3.1 Basic Information........................................................................................5-18 5.3.2 Current Situation of Water Supply ...............................................................5-19 5.3.3 Result of Water Quality Test ........................................................................5-19
5.4 Bandarban District ..............................................................................................5-23 5.4.1 Basic Information........................................................................................5-23 5.4.2 Current Situation of Water Supply ...............................................................5-24 5.4.3 Result of Water Quality Test ........................................................................5-24
5.5 Cox’s Bazar District ............................................................................................5-27 5.5.1 Basic Information........................................................................................5-27 5.5.2 Current Situation of Water Supply ...............................................................5-28 5.5.3 Result of Water Quality Test ........................................................................5-28
5.6 Characteristics and Challenges of Local Industries in CHT and CXB ..................5-32
6. Possible Cooperation Framework................................................................................. 6-1 6.1 Direction and Approach ....................................................................................... 6-1 6.2 Possible Steps ...................................................................................................... 6-2
Annex: Result of Water Quality Test

Data Collection Study on Regional Development in Southeastern Bangladesh Final Report
iii
Figures Figure 1-1 Poverty Map ................................................................................................... 1-1 Figure 1-2 Population Ratio without Safe Water Access.................................................... 1-2 Figure 2-1 Administrative Set-Up .................................................................................... 2-1 Figure 3-1 Annual Rainfall (2001 to 2010) (mm).............................................................. 3-1 Figure 3-2 Monthly Rainfall and Temperatures in 2010 .................................................... 3-2 Figure 3-3 Tribal Population in CHT and Cox’s Bazar ...................................................... 3-3 Figure 3-4 Population by Religion in Southeastern Bangladesh ........................................ 3-4 Figure 3-5 GDP and Growth Rate in Southeastern Bangladesh ......................................... 3-6 Figure 3-6 Rate of Household by Landholding Size ........................................................ 3-13 Figure 4-1 Ratio of Selected Items’ Cultivated Area to National Cultivated Area .............. 4-2 Figure 4-2 Ratio of Cultivated Area of Main Crops .......................................................... 4-2 Figure 4-3 Productivities of Other Major Crops in Khagrachhari ...................................... 4-4 Figure 4-4 Productivities of Vegetable in Khagrachhari and Bangladesh ........................... 4-5 Figure 4-5 Yields of Banana and Pineapple in Khagrachhari ............................................. 4-5 Figure 4-6 Productivity of Other Major Fruits .................................................................. 4-6 Figure 4-7 Ratio of Forest by Type in Khagrachhari ......................................................... 4-8 Figure 4-8 Ratio of Forest by Type in Bangladesh ............................................................ 4-9 Figure 4-9 Ratio of Major Crops of Rangamati in National Cultivated Area .................... 4-10 Figure 4-10 Ratio of Cultivated Area of Major Crops in Rangamati and Bangladesh......... 4-11 Figure 4-11 Productivity of Major Crops in Rangamati .................................................... 4-12 Figure 4-12 Yield of Vegetables in Rangamati .................................................................. 4-13 Figure 4-13 Productivity of Banana and Pineapple in Rangamati ...................................... 4-14 Figure 4-14 Productivity of Fruits in Rangamati ............................................................... 4-15 Figure 4-15 Ratio of Forest by Type in Rangamati............................................................ 4-18 Figure 4-16 Ratio of Forest by Type in Bangladesh .......................................................... 4-18 Figure 4-17 Ratio of Major Crops of Bandarban in National Cultivated Area .................... 4-21 Figure 4-18 Ratio of Cultivated Area of Major Crops in Bandarban and Bangladesh......... 4-21 Figure 4-19 Productivity of Other Major Crops in Bandarban ........................................... 4-23 Figure 4-20 Yield of Vegetable in Bandarban and Bangladesh .......................................... 4-24 Figure 4-21 Yields of Banana and Pineapple in Bandarban and Bangladesh ...................... 4-25 Figure 4-22 Productivities of Fruits in Bandarban ............................................................ 4-26 Figure 4-23 Ratio of Forest by Types in Bandarban .......................................................... 4-28 Figure 4-24 Ratio of Forest by Types in Bangladesh ......................................................... 4-28 Figure 4-25 Ratio of Irrigated Area by Facility ................................................................. 4-30 Figure 5-1 Geological Map .............................................................................................. 5-3 Figure 5-2 River Map ....................................................................................................... 5-4 Figure 5-3 Population (left) and Population Ratio (right) with No Access Improved
Safe Water ...................................................................................................... 5-6 Figure 5-4 Quality of Drinking-Water ............................................................................ 5-11 Figure 5-5 Sampling Points in Merung Union................................................................. 5-15 Figure 5-6 Sampling Points in Gomti Union ................................................................... 5-15 Figure 5-7 Sampling Points in Khagrachhari City ........................................................... 5-16 Figure 5-8 Sampling Points in Rangamati City ............................................................... 5-19 Figure 5-9 Sampling Points in Bandukvanga Union ........................................................ 5-20 Figure 5-10 Sampling Points in Kaptai Lake .................................................................... 5-20 Figure 5-11 Sampling Points in Chandraghona Union ...................................................... 5-21 Figure 5-12 Sampling Points of Bandarban City ............................................................... 5-24 Figure 5-13 Sampling Points of Sadar Union .................................................................... 5-25 Figure 5-14 Sampling Points in Swalock Union ............................................................... 5-25 Figure 5-15 Sampling Points in Cox’s Bazar City ............................................................. 5-29

Data Collection Study on Regional Development in Southeastern Bangladesh Final Report
iv
Figure 5-16 Sampling Points in Raja Palong Union .......................................................... 5-29 Figure 5-17 Sampling Points in Holodia Palong ............................................................... 5-30 Figure 5-18 Sampling Points in Bahar Chara Union ......................................................... 5-30
Tables Table 1-1 Chittagong Division ........................................................................................ 1-3 Table 1-2 Parameter for Water Quality Test ..................................................................... 1-4 Table 3-1 Population in CHT and Cox’s Bazar ................................................................ 3-3 Table 3-2 Rate of Population by Tribe in CHT ................................................................ 3-4 Table 3-3 GDP by Sector in Southeastern Bangladesh 2005/06 ....................................... 3-5 Table 3-4 GDP and Growth Rate in Southeastern Bangladesh 1995/96–2005/06 ............. 3-5 Table 3-5 GDP Growth Rate by Sector in Southeastern Bangladesh 1995/96–2005/06 .... 3-6 Table 3-6 Population Ratio by Occupation in CHT ......................................................... 3-7 Table 3-7 Infant and Under 5 Mortality Rate in Southeastern Region .............................. 3-8 Table 3-8 Attendance Rate in Secondary School and Adult Literacy Rate ........................ 3-8 Table 3-9 Gender Parity Index for Primary and Secondary School .................................. 3-9 Table 3-10 Economically Active Population and Participation Rate ................................... 3-9 Table 3-11 Selected MDG Indicators in CHT and CXB .................................................. 3-10 Table 3-12 Road Type and Length .................................................................................. 3-10 Table 3-13 Numbers of Doctor, Nurse and Medical Facilities .......................................... 3-11 Table 3-14 Numbers of School and Teacher–Student Rate in CHT and CXB ................... 3-11 Table 3-15 Irrigation Facilities and Covered Area (2009/2010) ....................................... 3-12 Table 3-16 Number of Household by Landholding Size .................................................. 3-12 Table 3-17 Breakdown of Program Budget by Sector ...................................................... 3-14 Table 3-18 Breakdown of Project Budget ........................................................................ 3-14 Table 3-19 Manpower and Vacancy of CHT District Council .......................................... 3-15 Table 3-20 Manpower and Vacancy in CXB District Council .......................................... 3-16 Table 4-1 Area of Rice Cultivation in Khagrachhari ........................................................ 4-1 Table 4-2 Area of Other Major Crop Cultivation in Khagrachhari ................................... 4-1 Table 4-3 Area of Vegetable Cultivation in Khagrachhari ................................................ 4-1 Table 4-4 Area of Fruits Cultivation in Khagrachhari ...................................................... 4-1 Table 4-5 Productivity and Cultivated Area of Rice in Khagrachhari ............................... 4-3 Table 4-6 Productivities of Other Major Crops in Khagrachhari ...................................... 4-3 Table 4-7 Cultivated Area and Productivities of Vegetables in Khagrachhari ................... 4-4 Table 4-8 Productivities of Banana and Pineapple in Khagrachhari ................................. 4-5 Table 4-9 Productivity of Other Major Fruits in Khagrachhari ......................................... 4-6 Table 4-10 Projects in DAE .............................................................................................. 4-6 Table 4-11 Rate of Animal Production in Khagrachhari to National Production ................. 4-7 Table 4-12 Fish Production by Water Bodies in Khagrachhari ........................................... 4-7 Table 4-13 Area of Forest by Type and Share of Khagrachhari .......................................... 4-8 Table 4-14 Cultivated Area of Rice in Rangamati.............................................................. 4-9 Table 4-15 Cultivated Area of Other Major Crops in Rangamati ..................................... 4-10 Table 4-16 Cultivated Area of Vegetable in Rangamati.................................................... 4-10 Table 4-17 Cultivated Area of Fruits in Rangamati .......................................................... 4-10 Table 4-18 Productivity and Cultivated Area of Rice in Rangamati ................................. 4-11 Table 4-19 Productivity and Cultivated Area of Other Major Crops in Rangamati ........... 4-12 Table 4-20 Productivity and Cultivated Area of Vegetable in Rangamati ......................... 4-13 Table 4-21 Productivity of Banana and Pineapple ........................................................... 4-14 Table 4-22 Productivity and Cultivated Area of Other Fruits in Rangamati ...................... 4-14 Table 4-23 Projects in DAE ............................................................................................ 4-15

Data Collection Study on Regional Development in Southeastern Bangladesh Final Report
v
Table 4-24 Numbers and Ratio of Livestock Production in Rangamati ............................ 4-15 Table 4-25 Summary of Projects in DoL ......................................................................... 4-16 Table 4-26 Fish Production by Water Bodies ................................................................... 4-16 Table 4-27 Projects in Fishery Office in Rangamati ........................................................ 4-17 Table 4-28 Ratio of Forest by Type in Rangamati............................................................ 4-18 Table 4-29 Cultivated Area for Rice in Bandarban .......................................................... 4-20 Table 4-30 Cultivated Area of Other Major Crops in Bandarban ..................................... 4-21 Table 4-31 Cultivated Area of Vegetable in Bandarban.................................................... 4-21 Table 4-32 Cultivated Area of Fruits in Bandarban .......................................................... 4-21 Table 4-33 Cultivated Area and Productivity of Rice in Bandarban ................................. 4-22 Table 4-34 Productivity of Other Major Crops in Bandarban ........................................... 4-23 Table 4-35 Productivities of Vegetable in Bandarban ...................................................... 4-24 Table 4-36 Yields of Banana and Pineapple in Bandarban ............................................... 4-25 Table 4-37 Productivities of Fruits in Bandarban ............................................................ 4-25 Table 4-38 DAE Project in Bandarban ............................................................................ 4-26 Table 4-39 Productivity of Livestock in Bandarban ......................................................... 4-26 Table 4-40 Fish Catch by Water Bodies in Bandarban ..................................................... 4-27 Table 4-41 Area of Forest by Types ................................................................................ 4-27 Table 4-42 Productivity and Cultivated Area of Rice in CXB .......................................... 4-29 Table 4-43 Numbers of Livestock and Share in National Production in CXB .................. 4-30 Table 4-44 Projects of Department of Livestock in CXB ................................................. 4-31 Table 4-45 Fish Catch by Water Bodies in CXB .............................................................. 4-31 Table 4-46 Catch Ratio of Inland and Marine Fisheries ................................................... 4-31 Table 4-47 Officers in Fishery Office .............................................................................. 4-32 Table 4-48 Projects in Fishery Office .............................................................................. 4-32 Table 4-49 Ratio of Forest by Type in CXB .................................................................... 4-33 Table 4-50 Offices of Divisional Forest Office ................................................................ 4-33 Table 5-1 Soil Distribution in CHT ................................................................................. 5-2 Table 5-2 Population Ratio with No Access Improved Safe Water ................................... 5-7 Table 5-3 Installed Well Depth Range by Water Supply Device by District (m) ............... 5-7 Table 5-4 Water Supply Technology and Feature ............................................................. 5-8 Table 5-5 Type of Installed Water Supply Device in Percentenge .................................... 5-8 Table 5-6 HHs Acces to Imploved Water Supply Device in Percentage ........................... 5-9 Table 5-7 Time Spent for Collecting Water ..................................................................... 5-9 Table 5-8 Distance of Source of Water by Category ...................................................... 5-10 Table 5-9 Daily Water Use of the Households (Litre) .................................................... 5-10 Table 5-10 Expenses for Water Collection (TK/month) ................................................... 5-10 Table 5-11 Quality of Drinking-Water (Percent of Respondents) ..................................... 5-11 Table 5-12 Reason of Bad Drinking-Water (Percent of Respondents) .............................. 5-11 Table 5-13 Supplier Ratio of the Water Technology and a Total Number of Water
Devices ......................................................................................................... 5-12 Table 5-14 District-Wise Water Availability in a Year ...................................................... 5-12 Table 5-15 Months of Water Available in a Year by Technology ...................................... 5-13 Table 5-16 Proportion of Population Using an Improved Drinking Water Source by
Upazila (%)................................................................................................... 5-13 Table 5-17 Annual Budget of DPHE, Khagrachhari for 2011–2012 ................................. 5-14 Table 5-18 Number of Existing Water Supply Devices .................................................... 5-14 Table 5-19 Water Quality Test Results in Khagrachhari ................................................... 5-17 Table 5-20 Proportion of Population Using an Improved Drinking Water Source by
Upazila (%)................................................................................................... 5-18 Table 5-21 Annual Budget of DPHE, Rangamati for 2011–2012 ..................................... 5-18 Table 5-22 Number of Existing Water Supply Devices .................................................... 5-19 Table 5-23 Water Quality Test Results in Rangamati District .......................................... 5-22

Data Collection Study on Regional Development in Southeastern Bangladesh Final Report
vi
Table 5-24 Proportion of Population Using an Improved Drinking Water Source by Upazila (%)................................................................................................... 5-23
Table 5-25 Annual Budget of DPHE, Bandarban for 2011–2012 ..................................... 5-23 Table 5-26 Number of Existing Water Supply Devices .................................................... 5-24 Table 5-27 Water Quality Test Result in Bandarban District ............................................ 5-26 Table 5-28 Proportion of Population Using an Improved Drinking Water Source by
Upazila (%)................................................................................................... 5-27 Table 5-29 Annual Budget of DPHE, Cox’s Bazar for 2011–2012 ................................... 5-28 Table 5-30 Number of Existing Active Water Supply Devices ......................................... 5-28 Table 5-31 Water Quality Test Results in Cox’s Bazar District ........................................ 5-31 Table 5-32 Point of Consideration for Rural Water Supply .............................................. 5-33

Data Collection Study on Regional Development in Southeastern Bangladesh Final Report
vii
Abbreviations and Acronyms
ADB Asian Development Bank
AL Awami League
AusAid Australian Agency for International Development
BARI Bangladesh Agricultural Research Institute
BCR CHT Baseline Census Report
BCS Bangladesh Civil Service
BNP Bangladesh Nationalist Party
BRDB Bangladesh Rural Development Board
BSRTI Bangladesh Sericulture Research and Training Institute
CHT Chittagong Hill Tracts
CHTDB Chittagong Hill Tracts Development Board
CHTDF Chittagong Hill Tracts Development Facility
CIDA Canadian International Development Agency
CXB Cox’s Bazar
DAE Department of Agricultural Extension
DANIDA Danish International Development Agency
DC Deputy Commissioner
DPHE Department of Public Health Engineering
DTW Deep tube-well
DYD Department of Youth Development
ECA Ecologically Critical Area
EPI Expanded Programme on Immunization
EU European Union
GFS Gravity flow System
GOB Government of Bangladesh
HDC Hill District Council
HYV High Yielding Varieties
ICDP Integrated Community Development Project
ILO International Labor Organization
IOM International Organization for Migration
JICA Japan International Cooperation Agency

Data Collection Study on Regional Development in Southeastern Bangladesh Final Report
viii
KDA Kaptai Dam Authority
LGD Local Government Division
LGED Local Government Engineering Department
LGSP Local Governance Support Project
MDGs Millennium Development Goals
MICS Multiple Indicator Cluster Survey
MoCHTA Ministry of Chittagong Hill Tracts Affairs
MoLGRDC Ministry of Local Government, Rural Development, and Cooperatives
NBDs Nation Building Departments
NGO Non-Governmental Organizations
PCSJJ Parbatya Chattagram Jana Samhati Samity
PDB Power Development Board
PDC Para Development Committee
PRDP 2 Participatory Rural Development Project 2
RC Regional Council
SAE Sub-Assistant Engineer
SBC Socio-Economic Baseline Survey of Chittagong Hill Tracts
STW Shallow tube-well
UDCCM Union Development Coordination Committee Meeting
UNDP United Nations Development Programme
UNFPA United Nations Population Fund
UNHCR United Nations High Commissioner for Refugees
UNICEF United Nations Children's Fund
UNO Upazila Nirbahi Officer
UPDF United Peoples Democratic Front
USAID United States Agency for International Development
WB World Bank
WFP World Food Programme
WSC Women Service Center
WSP Water & Sanitation Programme

Data Collection Study on Regional Development in Southeastern Bangladesh Final Report
1-1
1. Outline of the Study
1.1 Background of the StudyBangladesh has achieved significant economic growth in 1990s but poverty alleviation is still the most important concern of the Government of Bangladesh (GOB). The northwestern part, southwestern part, and southeastern part of Bangladesh especially suffer from poverty compared to the other areas as shown in Figure 1-1. GOB has addressed the problem of underdeveloped areas and aims at equilibrium development as one of the most important issues in the 6th Five Year Plan. It is considered that the development needs for the underdeveloped areas are high and urgent.
Source: Updating Poverty Maps of Bangladesh, Bangladesh Bureau of Statistics, World Bank, World Food Programme, 2005
Figure 1-1: Poverty Map
Bandarban
Cox’s Bazar
Rangamati
Khagrachhari

Data Collection Study on Regional Development in Southeastern Bangladesh Final Report
1-2
Chittagong Hill Tracts (CHT) and Cox’s Bazar (CXB) are the areas where the attention for regional development is required in southeastern Bangladesh. Among the development needs in CHT & CXB, one of the urgent issues is access to safe drinking water because the area is also underdeveloped in terms of safe water access as shown in Figure 1-2.
Source: JICA Expert based on Multiple Indicator Cluster Survey 2009 (UNICEF)
Figure 1-2: Population Ratio without Safe Water Access Comprehensive analysis is needed to upgrade the basic needs and utilize the potential of the area under such circumstances. For that analysis, basic data collection is required considering the area specific situations.
1.2 Objectives of the Study Objectives of the Study are as follows:
• To collect basic data in the area in terms of regional development, industrial development, and safe water development
• To analyze the data for the regional development

Data Collection Study on Regional Development in Southeastern Bangladesh Final Report
1-3
1.3 Study Area and Main Organization Visited The Study area consists of 4 districts in southeastern Bangladesh, namely, Khagrachhari district, Rangamati district, Bandarban district, and Cox’s Bazar district, which are located in Chittagong Division of the southeastern Bangladesh as shown in Table 1-1.
Table 1-1: Chittagong Division
District Upazila Union Village Municipalities/
City Corporation Bandarban 7 29 1,501 1 Khagrachhari 8 34 1,581 1 Rangamati 10 48 1,382 1 Chittagong 26 194 1,310 7 Cox’s Bazar 7 67 984 3 Brahmanbaria 8 98 1,331 4 Chandpur 8 87 1,237 6 Comilla 13 179 3,638 5 Feni 5 45 570 2 Lakshmipur 4 50 539 3 Noakhali 6 83 987 5
Source: Statistical Yearbook of Bangladesh 2009 Main organizations visited are:
• Ministry of Chittagong Hill Tracts Affairs • Department of Public Health Engineering • Chittagong Hill Tracts Regional Council • Chittagong Hill Tracts Development Board • Hill District Councils • District Council in CXB • Deputy Commissioner Office in each district • Nation Building Departments in each district • Other relevant organizations
1.4 Methodology of the Study The study was conducted by compiling the statistical data and qualitative data collected by documents, interviews, rapid rural appraisals, and water quality test on the spot. The results were summarized in the institutional profile, district profile, community profile, local industry profile, and safe drinking water profile. Accordingly, the present situation on regional development and possible cooperation framework were analyzed based on the results. Alignment with the existing development endeavor and other JICA technical cooperation projects was taken into consideration during the study for efficient and effective outcome. The parameters of water quality test are shown in Table 1-2.

Data Collection Study on Regional Development in Southeastern Bangladesh Final Report
1-4
Table 1-2: Parameter for Water Quality Test Water quality test item Test method 1 General Bacteria Test paper 2 Coliform Bacteria Test paper 3 Nitrate Nitrogen Pack-test 4 Nitrite Nitrogen Pack-test 5 Ammonia Nitrogen Pack-test 6 Iron Pack-test 7 Manganese Pack-test 8 Arsenic Field kit (hach) 9 pH pH meter 10 Electrical conductivity EC meter 11 Oxidation-reduction Potential ORP meter 12 Taste Taste 13 Odor Smell 14 Chromaticity Eye check 15 Turbidity Eye check 16 Water temperature Thermometer
The study team is as follows:
(1) Team Leader/Regional development: Yojiro Fujiwara (2) Industrial development: Taisuke Tokuoka (3) Safe water development: Masahide Shimamura
1.5 Schedule of the Field Study The schedule of the filed study is as follows:
Date Work 1 January 21 to 25, 2012 Meeting with relevant organizations
Data collection and analysis in Dhaka 2 January 26 to 31, 2012 Meeting with relevant organizations
Data collection and analysis in Khagrachhari district 3 February 1 to 6, 2012 Meeting with relevant organizations
Data collection and analysis in Rangamati district 4 February 7 to 11, 2012 Meeting with relevant organizations
Data collection and analysis in Bandarban district 5 February 12 to 16, 2012 Meeting with relevant organizations
Data collection and analysis in Cox’s Bazar district 6 February 17 to 20, 2012 Data compilation and analysis in Dhaka
Reporting to JICA Bangladesh Office and Embassy of Japan

Data Collection Study on Regional Development in Southeastern Bangladesh Final Report
2-1
2. Institutional Profile
2.1 Administrative Set-Up Bangladesh is divided into 7 divisions, 64 districts, 508 upazilas, and 4,466 unions all over the country. There are District Councils in district, Upazila Parishads in upazila, and Union Parishads in union under the Ministry of Local Government, Rural Development, and Cooperatives (MoLGRFC). Local elections at district level have not been held yet but District Administrators have been appointed according to District Council Act 2000. In CHT, there are Hill District Councils in each district according to District Council Act 1989 (amended in 1998) under the Ministry of Chittagong Hill Tracts Affairs (MoCHTA). Local elections have not been held for newly formed Hill District Councils. Besides Hill District Councils, there are CHT Regional Council (CHTRC) and CHT Development Board (CHTDB) under MoCHTA. In addition to that, there is a traditional local administrative set-up of Circle chief, Headman, and Karbari/Sadar in CHT. Government officers have been appointed to both District Councils and Hill District Councils as Chief Executive Officers, who are administrative cadre of Bangladesh Civil Service. Parallel to local government institutions, officers of central government are appointed to divisions, districts, and upazilas as Divisional Commissioner, Deputy Commissioner, and Upazila Nirbahi Officer. Their main roles are to maintain law and order and coordinate development work in plain areas of Bangladesh. In CHT, the main role of them is to maintain law and order, and Hill District Councils take the role of coordination of development work. Public services are delivered by Nation Building Departments (NBDs) like Department of Agricultural Extension. NBDs have its own offices in division, district, and upazila levels. In CHT, however, a total of 33 broad areas of authority were designated to be transferred to Hill District Councils based on the Peace Accord in December 1997. Up to now 19, 21 and 20 government departments/agencies have been transferred respectively to the Hill District Councils of Khagrachhari, Rangamati and Bandarban. Administrative set-up is shown in Figure below.
Source: Prepared by the Study Team
Figure 2-1: Administrative Set-Up
Cabinet Division
Divisional Commissiner
DC
UNO
Line Ministries
NBDs
Division Office
District Office
Upazila Office
GOB MoLGRDC
LGD
District Council
Upazila Parishad
Union Parishad
MoCHTA
CHTRC
Hill District Councils
CHTDB
Circle chief
Headman
Karbari/Sardar
Transferred NBDs

Data Collection Study on Regional Development in Southeastern Bangladesh Final Report
2-2
2.2 Chittagong Hill Tracts CHT is hilly area with the border to India and Myanmar. 11 or more ethnic groups live in the area with different socio economic culture than flood area. Although there has long been disputes regarding the ethnic groups and Bengali settlers, CHT Peace Accord has been agreed in 1997. It is recognized that the Peace Accord is the basis of the development in the CHT region although some issues like land dispute are not fully resolved.
Land Administration All the lands in the CHT are classified under the category of (1) Forests, (2) Paddy land, (3) Fringe land, (4) Grove land, (5) Private land, and (6) Village commons. Forests are sub-categorized into Reserve Forests, Protected Forests, and Unclassified State Forests.
Land of CHT is administered/governed by a number of laws. These are:
a. CHT Regulations 1900 b. Forest Act, 1927 (as amended in 2003) c. Headmen Rules, 1936 d. Bazar Fund Rules, 1936 e. CHT (Land Acquisition) Regulation, 1958 f. Forest Transit Rule, 1974 g. Land Khatian Ordinance, 1984 h. Land Appeal Board Rules, 1989 i. CHT Accord 1997 j. HDCs (Bandarban, Rangamati and Khagrachhari) Act, 1998 k. CHT Regional Council Act, 1998 l. CHT Land Commission Act, 2001
Major Institutions for CHT are as follows: Ministry of Chittagong Hill Tracts Affairs (MoCHTA)
With the signing of the Peace Accord, most of the activities of the former Special Affairs Division have been turned into a full cabinet level body with the title of Ministry of Chittagong Hill Tracts Affairs. MoCHTA has the responsibility of overseeing the overall policy formulation and planning and implementation of administrative and development activities for the benefit of the region. Unlike other ministries, the MoCHTA has an Advisory Committee, comprising of the following: 1. Minister in charge of the MoCHTA – Chairman 2. Chairman / representative, RC 3. Chairmen / representatives, HDCs (Rangamati, Bandarban and Khagrachhari) 4. MPs (Rangamati, Bandarban and Khagrachhari) 5. Circle Chief, Rangamati (Chakma Raja) 6. Circle Chief, Bandarban (Bohmang Raja) 7. Circle Chief, Khagrachhari (Mong Raja) 8. Three representatives of the Bengali Community, one from each district, nominated by the Government (MoCHTA) Regional Council (RC)
Regional Council was established by the Chittagong Hill Tracts Regional Council Act, 1998. Its functions are overall supervision and coordination of development activities and general

Data Collection Study on Regional Development in Southeastern Bangladesh Final Report
2-3
administration in CHT. The composition of RC membership is as follows, with the condition that its Chairman belong to one of the “tribal” communities of the region: a. Chairman – 01 b. Tribal member – 12 c. Non-tribal member – 06 d. Tribal women – 02 e. Non-tribal woman – 01 f. Chairmen of three Hill Districts – 03 (ex-officio) Total – 25 The representation of the various tribal groups is as follows: a. Chakma – 05 b. Marma – 03 c. Tripura – 02 d. Mro (Murang) and Tanchangya – 01 e. Lushai, Bawm, Pangkho, Khumi, Kheyang and Chak – 01 Hill District Council (HDC)
As a result of the Peace Accord the three former Hill District Local Government Councils have been re-named as Hill District Councils (HDCs) and the relevant Act of 1989 was amended. Each HDC is composed of 30 members. The Chairman and the members are to be directly elected by universal suffrage though these elections (last held in 1989) have been postponed since the signing of the Peace Accord. Along with their administrative roles, the HDCs are mandated to be the principal organs for implementation of development projects. Deputy Commissioner (DC) Office
The roles of DC are focused primarily on government administrative and law and order matters. DC does not have active role on development activities as a result of the institutional arrangements set out by the Peace Accord. Chittagong Hill Tracts Development Board (CHTDB)
The CHTDB was established as an autonomous body in 1976 by an Ordinance for undertaking developmental activities in the CHT region. As per the Peace Accord and the CHT Regional Council Act, it is supposed to become the institutional wing for development work under the supervision of Regional Council. Local NGOs
In recent years, various local NGOs have emerged as viable institutions for extending developmental services to the people of the region. But most of these NGOs are still new, small in size and still in a phase of gaining development and management experience. Traditional Institutions and Leaders
Alongside MoCHTA, RC and HDCs, the traditional institutions and leadership are to play a special role in terms of land and revenue matters in the CHT. There are three circles with Circle Chiefs, namely, Mong Circle, Chakma Circle, and Bohmang Circle. Under Circle Chiefs, there are Headmen at Muza level and Karbari at Para level. Chiefs (and to a lesser degree, also the Headmen) have the judicial authority of trying any cases that are not of a criminal nature, with the power of a magistrate.

Data Collection Study on Regional Development in Southeastern Bangladesh Final Report
2-4
UNDP has been assisting for the development of CHT and formulated Chittagong Hill Tracts Development Facility (CHTDF) to coordinate the development activities. Major development projects are as follows: Promotion of Development and Confidence Building in the CHT
Implementation agencies: MoCHTA/CHTDF Development partners: EU, CIDA, DANIDA, UNDP, etc. Budget: US$160 million (2003 to 2013) Main activities: Main activities are community empowerment, economic development, primary
education, health, capacity building of local government, confidence building. More than 3,000 Para Development Committee (PDC) have been formulated. It is planned to utilize Union Development Coordination Committee Meeting (UDCCM) for linkage between government agencies and villagers.
Chittagong Hill Tracts Rural Development Project Phase II
Implementation agencies: MoCHTA, HDCs, Local Government Engineering Department (LGED) Development partners: Asian Development Bank Budget: US$65 million (7 years from 2012) Main activities: Main activities are construction of road and rural infrastructure, marketing
support, construction of community infrastructure, capacity building. Watershed management is to be piloted in 6 areas.
Integrated Community Development Project
Implementation agencies: CHTDB Development partners: UNICEF Budget: 1,790 million TK (1996 to 2011)
Phase 1 was from 1985 to 1995. Phase 2 was from 1996 to 2011. Phase 3 is expected to be approved considering the importance of the project.
Main activities: Main activities are education, sanitation and health. About 3,500 Para Centres were constructed where public services are delivered. Para workers are recruited from the corresponding para. 95% of para workers are women.
2.3 Cox’s Bazar CXB is the most popular tourist spot known as having the longest beach in the world and different socio economic culture than flood area which attracts tourists. But the area is cyclone-prone and underdeveloped than other areas. The administrative set-up is same as other areas and DC has the role of coordination of development activities. LGED implements two projects on regional development. Improved Rural Infrastructure Development Project is a nation-wide project including CXB for 5 years from 2010/11. 330 million TK was allocated for 2 years in CXB. Union Connecting Road Improvement Project in Greater Chittagong District is for 4 years from 2009/10 with budget of 3,000 TK. 130 TK million was allocated for 2 years in CXB. CARE implements Standing Household Ability to Respond to Development Opportunity II financed by GOB and USAID. The budget is US$130 million for 11 districts including CXB which are identified as most vulnerable area with the duration of 2010 to 2015. Ukhia upazila and Teknaf upazila are the target upazilas covering 6 unions, 72 villages, and 20,000 households.

Data Collection Study on Regional Development in Southeastern Bangladesh Final Report
2-5
The project is implemented with 12 government agencies like Department of Agricultural Extension, Department of Public Health Engineering, utilizing local NGOs with overall supervision by DC. Main activities are agriculture and income generation, sanitation, health and nutrition, empowerment of women and children, capacity development, disaster management. UNICEF implements Convergence Programme for 7 districts including CXB. Main activities are on good governance, capacity development of public service provider and villagers, improving public service delivery. Focused public services are regarding women and children which are provided by Department of Public Health Engineering, Department of Primary Education and so on. NGOs like Child Protection and BRAC are also involved in the programme utilizing 69 Community Based Organizations (CBOs). The budget for CXB in 2011 is US$2.5 million. UNFPA works on safe childbirth in all over the country including CXB with Department of Health and Family Planning, Department of Primary Education, Department of Youth Development, Department of Women and Children Affairs, and so on. The 8th country programme will be starting in 2012. WFP works on food and nutrition in all over the country including CXB. Main activities are improving mother and child nutrition, school feeding, and enhancing food security. UNHCR works for Rohingya refugees in 2 camps in Ukhia upazila and Teknaf upazila with other UN agencies in collaboration with NGOs. The budget for 2012 is US$14 million.

Data Collection Study on Regional Development in Southeastern Bangladesh Final Report
2-6

Data Collection Study on Regional Development in Southeastern Bangladesh Final Report
3-1
3. District and Community Profile
3.1 District Profile 3.1.1 Historical Background According to the “Bangladesh District Gazetteer, Chittagong Hill Tracts,”the history of Chittagong Hill Tracts (CHT) ascended to the 6th century. Then, Arakanese and Tripra scrambled the territories until it came under contol of the sultanate in the 14th century. During the Sultan era, Chakma Circle came to be an important actor in CHT, and contested with Arakanese and Tripra for sovereignty over CHT. The area was ruled by Mugal since 1666, then it was alienated from Mugal to the East Indian Company in 1760. The first Deputy Commissioner was delegated to CHT, and direct control by the colonial government was established. In the colonial era, CHT was granted limited autonomy. After the British colonial government, Pakistani government repealed autonomy of CHT. The conflict was started to resist against the policy to integrate CHT into the Bengali society. The Peace Accord was concluded between the Bangladeshi government and Jana Samhati Samity (JSS) in 1997 for establishment of a new regime in CHT. 3.1.2 Natural Environment (1) Rainfall Figure 3-1 shows annual rainfall from 2001 to 2010. Decline of annual rainfall is not identifiable.
2001 2002 2003 2004 2005 2006 2007 2008 2009 2010 AverageRangamati 2,066 2,784 2,474 3,113 2,124 2,316 3,076 1,780 2,395 2,673 2,480Cox's Bazar 3,282 3,384 4,177 4,006 4,603 3,283 3,438 3,739Chittagong 2,302 2,745 2,769 2,924 2,331 2,375 4,340 3,032 3,461 2,405 2,868
0500
1,0001,5002,0002,5003,0003,5004,0004,5005,000
RangamatiCox's BazarChittagong
(mm)
Source: 2010 Agriculture Statistics of Bangladesh
Figure 3-1: Annual Rainfall (2001 to 2010) (mm) Figure 3-2 shows monthly rainfall and minimum and maximum temperatures in 2010. Most of the rainfall was seen from May to October.

Data Collection Study on Regional Development in Southeastern Bangladesh Final Report
3-2
Jan Feb Mar Apr May Jun Jul Aug Sep Oct Nov DecRain Fall 0.0 9.0 121.0 112.0 424.0 653.0 304.0 496.0 183.0 281.0 45.0 17.0Max Temperture 26.6 29.5 34.2 33.8 32.8 32.2 32.5 32.8 32.4 32.2 30.4 26.6Min Temperture 12.4 13.6 20.6 24.7 24.4 24.8 25.3 25.3 24.8 24.2 20.2 14.9
0
200
400
600
800
1,000
1,200
1,400
0
5
10
15
20
25
30
35
40
Rai
n F
all (
mm
)
Tem
pert
ure (℃
)
Rangamati
Rain Fall Max Temperture Min Temperture
Jan Feb Mar Apr May Jun Jul Aug Sep Oct Nov DecRain Fall 0.0 0.0 15.0 12.0 717.0 982.0 496.0 501.0 257.0 375.0 15.0 68.0Max Temperture 27.2 30.3 32.9 34.0 32.7 32.2 31.7 32.3 32.1 32.3 31.7 28.4Min Temperture 15.3 17.5 23.2 26.2 26.0 25.9 25.7 25.6 25.3 25.3 21.7 17.5
0
200
400
600
800
1,000
1,200
1,400
0
5
10
15
20
25
30
35
40
Rai
n F
all (
mm
)
Tem
pert
ure (℃
)
Cox's Bazar
Rain Fall Max Temperture Min Temperture
Jan Feb Mar Apr May Jun Jul Aug Sep Oct Nov DecRain Fall 0.0 9.0 50.0 50.0 282.0 916.0 245.0 392.0 86.0 301.0 52.0 22.0Max Temperture 26.5 29.0 31.6 32.0 32.5 32.0 30.1 30.6 31.4 31.2 29.9 26.2Min Temperture 14.9 16.8 21.5 25.3 24.9 25.5 25.4 25.7 25.4 24.0 21.0 15.8
0
200
400
600
800
1,000
1,200
1,400
0
5
10
15
20
25
30
35
Rai
n F
all (
mm
)
Tem
pert
ure (℃
)
Chittacong
Rain Fall Max Temperture Min Temperture
Source: 2010 Agriculture Statistics of Bangladesh
Figure 3-2: Monthly Rainfall and Temperatures in 2010 3.1.3 Population According to the Population Census in 2008/09, the population density in Bangladesh is 977 per square kilometer. As is shown in Table 3-1, the population density in CHT is very low. The population growth rate in Bangladesh is 1.26%, while the rates in CHT districts are more than 2%. It is assumed that contributing factors of population growth are not only natural growth but also migration from plain land.

Data Collection Study on Regional Development in Southeastern Bangladesh Final Report
3-3
Table 3-1: Population in CHT and Cox’s Bazar Khagrachari Rangamati Bandarban Cox's Bazar
Total 525,664 508,182 298,120 1,773,709Population Density* 2008/09 (per Sq. Km) 195 83 67 712Population Growth Rate (%) 2001 4.38 2.39 2.60 2.25Traibal Population** 192,647 257,679 142,651 25,493Population by Religion
Muslim 228,753 187,132 147,062 1,648,211Hindu 86,351 26,944 10,796 87,123
Buddist 3,745 8,781 28,546 1,722Christian 206,473 284,906 103,997 35,737
Other 342 419 7,719 916 Source: Population Census-2001, Community Series, Zila: Khagrachhari, Rangamati, Bandarban and Cox’s Bazar; *Bangladesh Economic Review, “Socio-economic indicators of Bangladesh”; **Statistical Yearbook of Banlgadesh-2010.
Tribal population in Southeastern Bangladesh is higher than other parts. Figure 3-3 shows the percentage of tribal people in each district. Around 30 to 40% of the population is tribal in CHT, while only 1% is tribal in Cox’s Bazar.
36.6%
50.7% 47.9%
1.4%0.0%
10.0%
20.0%
30.0%
40.0%
50.0%
60.0%
Khagrachari Rangamati Bandarban Cox's Bazar
Rate of TribalPopulation
Source: Produced based on Population Census-2001, Community Series, Zila: Khagrachhari, Rangamati, Bandarban and Cox’s Bazar by the research team.
Figure 3-3: Tribal Population in CHT and Cox’s Bazar As is common in Bangladesh, the majority of Bengal is Muslim. The tribal population usually consists of non-Muslims, such as Hindu, Buddhist and Christian. As shown below, population percentage by religion demonstrates distribution of Bengali population and the tribal population.

Data Collection Study on Regional Development in Southeastern Bangladesh Final Report
3-4
44%
16%
1%
39%
0%
Khagrachari
Muslim
Hindu
Buddist
Christian
Other
37%
5%2%
56%
0%
Rangamati
Muslim
Hindu
Buddist
Christian
Other
49%
4%9%
35%
3%
Bandarban
Muslim
Hindu
Buddist
Christian
Other
93%
5%0%
2%0%
Cox's Bazar
Muslim
Hindu
Buddist
Christian
Other
Source: Population Census-2001, Community Series, Zila: Khagrachhari, Rangamati, Bandarban and Cox’s Bazarby the research team.
Figure 3-4: Population by Religion in Southeastern Bangladesh
Distribution of tribal populations is diverse in CHT. As shown in Table 3-2, Chakma and Tripra are the main tribes in Khagrachhari while Chakma account for about 50% of the population in Rangamati, and Marma follows it. In Bandarban, Marma and Mro are the majority.
Table 3-2: Rate of Population by Tribe in CHTEthnicity Khagrachhari Rangamati BandarbanChakma 28.67 47.25 1.1Marma 11.5 11.62 26.15Tanchanga 0.03 5.15 4.02Tripura 15.14 1.73 6.07Bom 0 0.06 3.86Khang 0 0.25 0.73Pangkhoa 0 0.33 0.03Mro 11.08Khumi 0 0.01 0.6Kuki 0 0.01 0.01Lusai 0 0.08 0.02Santhal 0.13 0.01Chak 0 0.01 0.89Bengalis 44.5 33.43 45.43Rakhain 0.02 0.03 0.01Other 0.01 0.03 0.01Total 100 100 100Respondents (N) 95,995 90,895 47,845
Source: CHT Baseline Census Report 2010, Water Aid.

Data Collection Study on Regional Development in Southeastern Bangladesh Final Report
3-5
3.1.4 Economic Situation The industry sector has been dramatically growing in Bangladesh in recent years. The share of industry was 17.31% in 1980/81, and it grew up to 29.73% by 2008/09. On the other hand, the share of agriculture as the key sector in Bangladesh decreased from 33.07% in 1980/81 to 20.6% in 2008/09. However, it is said in the“Bangladesh Economic Review 2009” that 36.4% of households engage in agricultural work in urban areas, and 46% in rural areas. Since industry and service sectors are based on agriculture in many ways, it is said that agriculture is still the basic sector in Bangladesh. The macro economy of southeastern part of Bangladesh is structurally the same as Bangladesh as a whole. As it can be seen in Tables 3-3, 3-4 and Figure 3-5, service sector is predominant over others in Cox’Bazar and Bandarban. Agriculture is the leading sector only in Khagrachhari. Though the structure of macro economy is the same as Bandarban and Cox’s Bazar, the growth rate of Rangamati is minus due to the minus trend in agriculture and industry sectors. The growth trend of Cox’s Bazar is hightly upward compared to CHT area. It is considered that rapid tourism growth contribute the trend in Cox’s Bazar.
Table 3-3: GDP by Sector in Southeastern Bangladesh 2005/06
Kagrachhari Rangamati Bandarban Cox's Bazar Chittagong NationalAgriculture 146 39 19 233 421 11,014
Crop 22 14 8 75 195 6,881Livestock 10 8 4 18 54 1,445
Fishery 0 10 1 132 152 2,237Forestry 7 8 5 8 20 958
Industry 28 32 20 203 1,869 16,674Service 97 116 66 383 2,581 31,356 Source: Deb, Hoque, Khaled and Bairagi, Paper presented at the Dialogue on “Addressing Regional Inequalities: Policy Options and Strategies” held on 28 February 2008 at the CIRDAP Auditorium; organized by the Centre for Policy Dialogue (CPD).
Table 3-4: GDP and Growth Rate in Southeastern Bangladesh 1995/96–2005/06
Kagrachhari Rangamati Bandarban Cox's Bazar Chittagong National1995/96 105 263 93 564 3,055 39,0681999/00 124 196 104 660 3,543 45,4472005/06 163 187 105 820 4,871 59,748
Growth Rate (1995/96 - 2005/06) 55.0 -28.9 13.2 45.3 59.4 52.9 Source: Deb, Hoque, Khaled and Bairagi, Paper presented at the Dialogue on “Addressing Regional Inequalities: Policy Options and Strategies” held on 28 February 2008 at the CIRDAP Auditorium; organized by the Centre for Policy Dialogue (CPD).

Data Collection Study on Regional Development in Southeastern Bangladesh Final Report
3-6
0
100
200
300
400
500
600
700
800
900
1995/96 1999/00 2005/06
Kagrachhari
Rangamati
Bandarban
Cox's Bazar
Source: Prepared by the Study Team based on Deb, Hoque, Khaled and Bairagi, Paper presented at the Dialogue on “Addressing Regional Inequalities: Policy Options and Strategies” held on 28 February 2008 at the CIRDAP Auditorium; organized by the Centre for Policy Dialogue (CPD).
Figure 3-5: GDP and Growth Rate in Southeastern Bangladesh
Table 3-5: GDP Growth Rate by Sector in Southeastern Bangladesh 1995/96–2005/06
Kagrachhari Rangamati Bandarban Cox's Bazar Chittagong NationalAgriculture 8.6 -8.3 -8.0 0.2 1.8 1.1Industry 5.4 -2.7 5.4 5.1 5.3 5.2Service 6.4 3.2 2.8 5.1 4.6 5.0Tital GDP 7.5 -1.9 0.7 3.4 4.6 4.2 Source: Deb, Hoque, Khaled and Bairagi, Paper presented at the Dialogue on “Addressing Regional Inequalities: Policy Options and Strategies” held on 28 February 2008 at the CIRDAP Auditorium; organized by the Centre for Policy Dialogue (CPD). It is surmised from the above tables that agriculture is the bottleneck of the economy in southeastern Bangladesh. When we compare the structural macroeconomic trend with occupational structure in CHT (see Table 3-6), it is demonstrated that around half of the occupation is shared by agriculture related work but the growth of the agriculture sector is nevertheless in a recession except in Khagrachhari. It is presumably said that the livelihood of the majority are disadvantaged by the economic trend for the 10 years shown in the above tables.
Data Collection Study on Regional Development in Southeastern Bangladesh Final Report
3-7
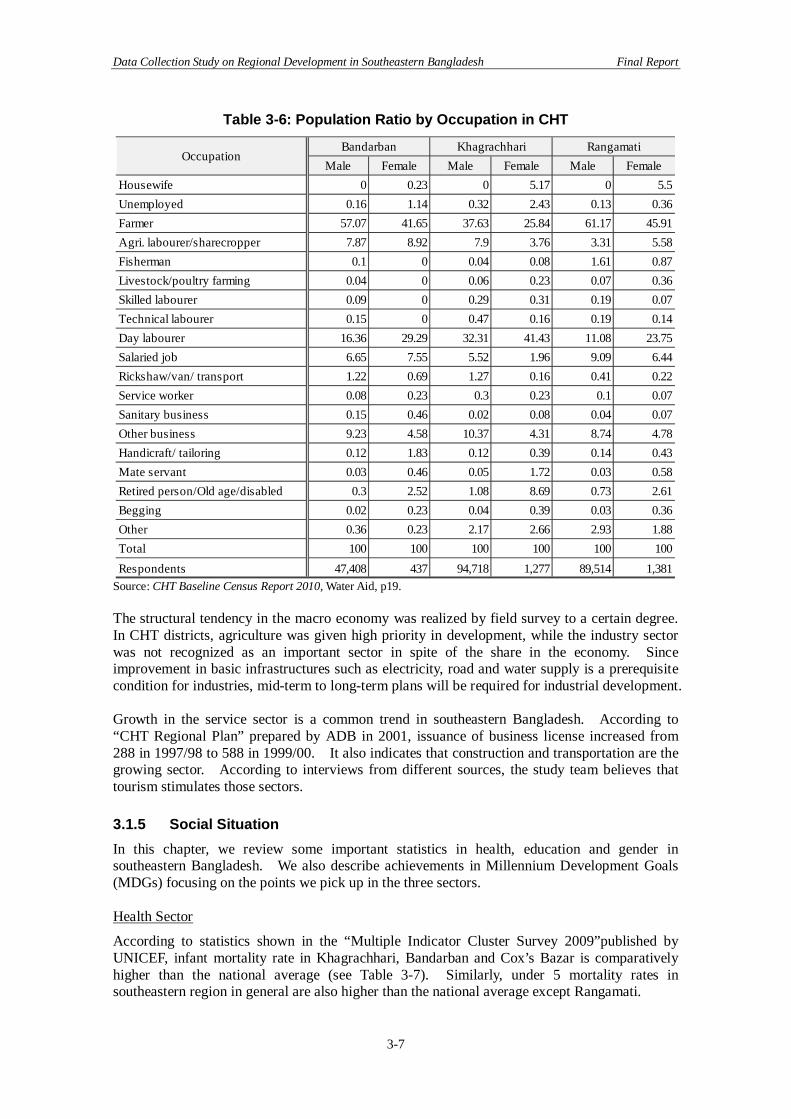
Table 3-6: Population Ratio by Occupation in CHT
Male Female Male Female Male FemaleHousewife 0 0.23 0 5.17 0 5.5Unemployed 0.16 1.14 0.32 2.43 0.13 0.36Farmer 57.07 41.65 37.63 25.84 61.17 45.91Agri. labourer/sharecropper 7.87 8.92 7.9 3.76 3.31 5.58Fisherman 0.1 0 0.04 0.08 1.61 0.87Livestock/poultry farming 0.04 0 0.06 0.23 0.07 0.36Skilled labourer 0.09 0 0.29 0.31 0.19 0.07Technical labourer 0.15 0 0.47 0.16 0.19 0.14Day labourer 16.36 29.29 32.31 41.43 11.08 23.75Salaried job 6.65 7.55 5.52 1.96 9.09 6.44Rickshaw/van/ transport 1.22 0.69 1.27 0.16 0.41 0.22Service worker 0.08 0.23 0.3 0.23 0.1 0.07Sanitary business 0.15 0.46 0.02 0.08 0.04 0.07Other business 9.23 4.58 10.37 4.31 8.74 4.78Handicraft/ tailoring 0.12 1.83 0.12 0.39 0.14 0.43Mate servant 0.03 0.46 0.05 1.72 0.03 0.58Retired person/Old age/disabled 0.3 2.52 1.08 8.69 0.73 2.61Begging 0.02 0.23 0.04 0.39 0.03 0.36Other 0.36 0.23 2.17 2.66 2.93 1.88Total 100 100 100 100 100 100Respondents 47,408 437 94,718 1,277 89,514 1,381
OccupationBandarban Khagrachhari Rangamati
Source: CHT Baseline Census Report 2010, Water Aid, p19. The structural tendency in the macro economy was realized by field survey to a certain degree. In CHT districts, agriculture was given high priority in development, while the industry sector was not recognized as an important sector in spite of the share in the economy. Since improvement in basic infrastructures such as electricity, road and water supply is a prerequisite condition for industries, mid-term to long-term plans will be required for industrial development. Growth in the service sector is a common trend in southeastern Bangladesh. According to “CHT Regional Plan” prepared by ADB in 2001, issuance of business license increased from 288 in 1997/98 to 588 in 1999/00. It also indicates that construction and transportation are the growing sector. According to interviews from different sources, the study team believes that tourism stimulates those sectors. 3.1.5 Social Situation In this chapter, we review some important statistics in health, education and gender in southeastern Bangladesh. We also describe achievements in Millennium Development Goals (MDGs) focusing on the points we pick up in the three sectors. Health Sector
According to statistics shown in the “Multiple Indicator Cluster Survey 2009”published by UNICEF, infant mortality rate in Khagrachhari, Bandarban and Cox’s Bazar is comparatively higher than the national average (see Table 3-7). Similarly, under 5 mortality rates in southeastern region in general are also higher than the national average except Rangamati.

Data Collection Study on Regional Development in Southeastern Bangladesh Final Report
3-8
Table 3-7: Infant and Under 5 Mortality Rate in Southeastern Region Kagrachhari Rangamati Bandarban Cox's Bazar Chittagong National
Infant Mortality Rate 49 36 63 54 40 41Under 5 Mortality Rate 63 45 85 72 50 54 Source: Multiple Indicator Cluster Survey 2009, Volume II: Chittagong Division The “CHT Regional Development plan” claims that malaria and diarrhea are major diseases in CHT. It also notes that they have lack of manpower for medical services. According to the hearing from Civil Surgeon in Khagrachhari, it is said that only 42 first class medical officers are appointed out of 127, and second class are only two out of six. On the other hand, 521 third class and 195 fourth class officers are recruited by the Hill District Council for the total posts of 571 and 203 respectively. It proves that disposition by the central government is the challenge of medical services in CHT. It seems that certain number of community health centers is established, but outreach of the services is limited in rural areas. Education Sector
Generally speaking, eucation sector in southeastern region is underdeveloped. Table 3-8 shows that attendance rate in pre-school is higher in CHT, but the rates in both primary and secondary levels are lower than the national average.
Table 3-8: Attendance Rate in Secondary School and Adult Literacy Rate Indicators Khagrachhari Rangamati Bandarban Cox’s Bazar Chittagong National Pre-school Attendance Rate (%) 38.5 40.8 29.5 19.0 25.8 22.9 Net Attendance Rate in Primary School (%) 79.4 75.0 60.6 70.0 83.9 81.3 Net Attendance Rate in Secondary School (%) 41.6 41.7 28.1 31.2 48.8 49.0 Adult Literacy Rate of Population for All Age (%) 42.2 41.8 28.0 28.9 54.9 45.3
Source: Multiple Indicator Cluster Survey 2009 Volume II: Chittagong Division As attendance rate in schools, adult literacy is lower than the national average in southeastern districts. The rate in Bandarban and Cox’s Bazar are remarkably low. According to interviews at the community level, the hilly geographic feature and scattered settlement pattern in CHT prevent people from sending their children to schools. Because of the reasons for low rates in school attendance and adult literacy, the demand of boarding school was very high. Gender
Table 3-9 shows indicators related to gender compiled in the “Multiple Indicator Cluster Survey.” It is recognizable in the Gender Parity Index (GPI) for primary schools in general that net attendance rate of female student against the rate of male is lower than national average in the southeastern region except Bandarban. The same tendency is observed in secondary schools except Cox’s Bazar.

Data Collection Study on Regional Development in Southeastern Bangladesh Final Report
3-9
Table 3-9: Gender Parity Index for Primary and Secondary School Indicators Khagrachhari Rangamati Bandarban Cox's Bazar Chittagong National Gender Parity Index (GPI) for Primary School (NAR) 1.01 1.02 1.04 1.02 1.02 1.03 Gender Parity Index (GPI) for Secondary School (NAR) 1.06 0.98 1.02 1.38 1.07 1.17
Source: Multiple Indicator Cluster Survey 2009 Volume II, Chittagong Division Labor participatory rate can serve as an indicator to assess the situation of gender balance in the society. Table 3-10 shows the participation rate of the economically active population in the southeastern region. The national average of the participatory rate is relatively lower than districts in the southeastern region except Khagrachhari. Generally speaking, female labor participatory rate is lower than male in Muslim society. Since CHT consists of tribal people whose religions are non-Muslim, religious background could be the reason for high female labor participation. However, interestingly female labor participatory rates are higher in Cox’s Bazar and Bandarban where Muslim population is higher than other districts in the southeastern region. Because these two districts have higher poverty rates compared to other CHT districts, poverty would be another factor for high female labor participatory rate.
Table 3-10: Economically Active Population and Participation Rate Khagrachhari Rangamati Bandarban Cox’s Bazar Chittagong National Population +15
Total 303 340 183 1,200 5,063 84,586 Male 157 175 95 633 2,574 43,006
Female 146 165 89 568 2,489 41,580 Economically Active Pop
Total 165 225 127 913 2,908 49,461 Male 138 153 82 570 2,128 37,330
Female 27 72 45 343 780 12,131 Participation Rate
Total 54.6 66.11 69.21 76.09 57.43 58.47 Male 88.03 87.71 86.48 90.16 82.68 86.80
Female 18.48 43.25 50.71 60.41 31.32 29.17 Source: Statistical Yearbook of Bangladesh – 2010, Bangladesh Bureau of Statistics Millennium Development Goals (MDGs)
Some indicators selected from “Multiple Indicator Cluster Survey” to assess MDGs achievement in CHT and Cox’s Bazar are shown in Table 3-11. The indicators other than MDGs No. 6.3, 7.8 and 7.9 have already been described above. In No. 6.3, we used female’s comprehensive knowledge in HIV/AIDS. It is lower than national average in any district. Indicators for safe drinking water and improved sanitary facility are crucially low in CHT.

Data Collection Study on Regional Development in Southeastern Bangladesh Final Report
3-10
Table 3-11: Selected MDG Indicators in CHT and CXB No. in MDG Indicators
Current Status
Target by 2015
Status of Progress Khagrachari Rangamati Bandarban Cox's Bazar
2.2Proportion of pupils starting grade 1 who reach grade 5
79.8(2009)
100 78.9 79.9 61.9 59.3
2.3Adult literacy rate of 15-24 years of population (Female)
72.0(2009)
- - 53.8 52.7 39.8 54.4
3.1aRatio of girl to boys in primary education (Gender Parity Index)
1.03(2009)
1.0 1.01 1.02 1.04 1.02
3.1bRatio of girl to boys in secondary education (Gender Parity Index)
1.17(2009)
1.0 1.06 0.98 1.02 1.38
4.1Under-five mortality rate 64
(2009)48 63 45 85 72
4.2Infant mortality rate 49
(2009)31 49 36 63 54
6.3
Proportion of population aged 15-24 years with comprehensive correct knowledge of HIV/AIDS
15.8(2006
Low Knowledge
15.6 11.4 7.2 12.5
7.8Propotion of population using improved drinking water sources
97.8(2009)
100 69.7 66.5 67.8 96.6
7.9Proportion of population using an improved sanitation facility
54.1(2009)
60 N/A 42.7 48.6 33.2 58.0
Source: Produced by research team based on Bangladesh Millennium Goal at Glance and Multiple Indicator Cluster Survey 2009 Volume II, Chittagong Division. 3.1.6 Basic Infrastructure Road
As it is shown in Table 3-12, road construction in CHT is underdeveloped. It is assumed that the situation of road construction will be a negative factor for development of other sectors. On the other hand, it is indicated by some of interviewees that rapid development of road communication may also have negative impact on the local society and environment.
Table 3-12: Road Type and Length Surface Type Khagrachhari Rangamati Bandarban Cox's Bazar Earthen 2113.32 4602.47 1897.09 316.93 Flexible Pavement (BC) 222.8 118.67 142.97 363.99 Brick Pavement (WBM/HBB/BFS) 459.19 224.95 188.60 264.15 Rigid Pavement (CC/RCC) 0 25.78 9.76 7.72 Total Length 2795.31 4971.87 2238.42 952.79
Source: Local Government Engineering Department, Basic Information of Road Medical Facilities
It was realized that there is high demand of medical facilities as basic infrastructure. Table 3-13 shows the number of doctors, nurses and beds in each district in the southeastern region.

Data Collection Study on Regional Development in Southeastern Bangladesh Final Report
3-11
Table 3-13: Numbers of Doctor, Nurse and Medical Facilities
Doctor Nurse Bed Doctor Nurse Bed Doctor Nurse Bed Doctor Nurse BedClinic 13 33 24 3 7 0 0 1 0 N/A N/A N/AFWC 13 64 11 14 0 8 13 0 N/A N/A N/APrimary Health Care 6 264 0 2 5 0 1 0 0 N/A N/A N/AMaternity Center 3 14 0 2 1 2 2 6 10 N/A N/A N/AHospital 133 218 424 48 174 393 42 81 173 N/A N/A N/ATotal 168 593 448 66 201 395 53 101 183 N/A N/A N/APopulation Per No. 3,129 886 1,173 7,700 2,528 1,287 5,625 2,952 1,629 N/A N/A N/A
Khagrachari Rangamati Bandarban Cox's Bazar
Source: Bangladesh Bureau of Statistics website: http://www.bbs.gov.bd/RptZillaProfile.aspx, Feb., 2012 Population per doctor is higher in Rangamati and Bandarban as Table 3-13 shows. Population per nurse in Bandarban is highest, and Rangamati follows next. Population per bed shows a similar tendency. Medical facilities in Khagrachhari are comparatively better than other districts in CHT. Educational Facilities
Generally speaking, needs of educational service and facilities are very high in CHT and CXB. Table 3-14 shows the teacher-student rate in CHT and CXB. As can be seen in the table, CXB has an outstandingly high teacher-student rate. The rates are approximate in CHT districts, but Bandarban’s rate is a little higher than the other two districts. The teacher-student rates in secondary school are almost equal in CHT and CXB; meanwhile, the rate of junior high school in CXB is conspicuously high.
Table 3-14: Numbers of School and Teacher–Student Rate in CHT and CXB Khagrachari Rangamati Bandarban Cox's Bazar
Primary School 1,186 743 341 616Teacher 4,879 2,824 1,171 3,032Student 193,143 130,146 37,133 271,813
Teacher-Student Rate 40 46 32 90
Secondary High School 112 93 29 111Teacher 1,634 1,182 215 1,259Student 49,776 34,902 9,345 56,423
Teacer-Student Rate 30 30 43 45
Junior High School 90 46 12 18Teacher 484 297 50 104Student 13,246 8,439 1,522 67,719
Teacher-Student Rate 27 28 30 651 Source: Bangladesh Bureau of Statistics website: http://www.bbs.gov.bd/RptZillaProfile.aspx, Feb., 2012

Data Collection Study on Regional Development in Southeastern Bangladesh Final Report
3-12
Irrigation Facilities
CHT and CXB are not well equipped with irrigation facilities. Table 3-15 shows the area covered by different irrigation facilities in CHT and Chittagong which includes CXB. The Table 3-15 shows that there is no tube-well for irrigation in CHT at all, but only power pump and traditional method. In other words, it is surmised that CHT is disadvantaged in production of boro rice which highly depend on irrigation due to poor irrigation facilities.
Table 3-15: Irrigation Facilities and Covered Area (2009/2010) (,000 acre)
Deep Shallow HandKhagrachari 22 0 0 0 0 27 49Rangamati 15 0 0 0 0 10 25Bandarban 13 0 0 0 0 13 26Chittagong 270 15 35 2 52 72 394
National 2,696 2,449 10,111 59 15,315 871 16,136
DistrictPower Pump
Tube-well Total Tube-well
Traditional Method
Total Irrigation Area
Source: Yearbook of Agricultural Statistics of Bangladesh-2010
3.1.7 Poverty Situation As we have already seen with the Poverty Map in Chapter 1, population under poverty line in CHT and CXB is comparatively high in Bangladesh. Taking into account with much circumstance, poverty rate is higher in the hill side where it is away from the district centers in CHT and coastal areas in CXB. Out of five districts in the southeastern region, the poverty rate in Bandarban and CXB are higher. Table 3-16 provides the number of households by landholding size which may be one of the factors indicating poverty. In CHT and CXB where income source is mainly based on agriculture, landholding is closely related to poverty. Figure 3-16 demonstrates that landless household is 46% in Bangladesh, while rates of landless in Chittagong and CXB are 71% and 52% respectively. On the other hand, the rate of landless in CHT is only from 20 to 30% in spite of high poverty rate. Taking account the correlation between high poverty rate and greater landholding, it may be assumed that the productivity of land in CHT and CXB may be lower than other districts, or access to the market may be one of the factors preventing farmers from income generation by agricultural production.
Table 3-16: Number of Household by Landholding Size
Khagrachhari Rangamati Bandarban Cox's Bazar Chittagong NationalAll Holdings 130,480 112,147 66,424 332,304 1,376,536 28,165,700Non-farm Holdings 31,804 44,083 20,369 172,913 974,840 13,076,613Farm Holdings
Total 98,676 68,064 46,055 19,391 401,696 15,089,087Marginal (0.05-0.49 acre) 26,687 9,778 9,770 70,385 181,258 5,828,809
Small (0.5-2.49 acre) 53,290 32,109 19,716 76,492 194,176 7,522,541Medium (2.5-7.49 acre) 17,217 24,181 13,687 11,797 24,416 1,560,774
Large (7.5- acre) 1,481 1,996 2,883 717 1,846 176,962 Source: Yearbook of Agricultural Statistics of Bangladesh-2010.

Data Collection Study on Regional Development in Southeastern Bangladesh Final Report
3-13
24%
21%41%
13% 1%
KhagrachariNon-farmHoldingsMarginal (0.05-0.49 acre)Small (0.5-2.49acre)Medium (2.5-7.49 acre)Large (7.5- acre)
39%
9%29%
21%
2%
RangamatiNon-farmHoldings
Marginal (0.05-0.49 acre)
Small (0.5-2.49acre)
Medium (2.5-7.49 acre)
Large (7.5- acre)
31%
15%30%
20%
4%
BandarbanNon-farmHoldings
Marginal (0.05-0.49 acre)
Small (0.5-2.49acre)
Medium (2.5-7.49 acre)
Large (7.5- acre)
52%21%
23%
4% 0%
Cox's BazarNon-farmHoldings
Marginal (0.05-0.49 acre)
Small (0.5-2.49acre)
Medium (2.5-7.49 acre)
Large (7.5- acre)
71%
13%14%
2%0%
Chittagong
Non-farmHoldings
Marginal (0.05-0.49 acre)
Small (0.5-2.49acre)
Medium (2.5-7.49 acre)
Large (7.5- acre)
46%
21%
27%
5% 1%
NationalNon-farmHoldings
Marginal (0.05-0.49 acre)
Small (0.5-2.49acre)
Medium (2.5-7.49 acre)
Large (7.5- acre)
Figure 3-6: Rate of Household by Landholding Size
3.1.8 Public ServicesPublic Services are mostly delivered by Nation Building Departments (NBDs) which have about 94% of the development budget shown in the table 3-17. Hill District Councils supervise the implementation of development projects conducted by transferred NBDs in CHT but have limited role of budget formulation. Besides sector-wise budget, development assistance is allocated to the District Council in CXB, Hill District Councils in CHT, and CHT Development Board. The parallel structure is seen in terms of the budgeting system.
Expanded Programme on Immunization (EPI) is well implemented in both CHT and CXB. However, other public services are not well provided to villagers due to difficult access to villages especially in CHT.
Bangladesh Rural Development Borad (BRDB) implements Participatory Rural Development Project 2 (PRDP 2) for linkage between government agencies and villagers in 4 unions in each district of CHT and CXB.

Data Collection Study on Regional Development in Southeastern Bangladesh Final Report
3-14
Table 3-17: Breakdown of Program Budget by Sector (10 million TK)
Sl. No. Sector/Program
Local Currency % Budgeted % Total %
1 Agriculture 1968.67 7.21 765.97 4.10 2734.64 5.94 2 Rural Development and Rural
Institution 3186.88 11.67 1215.97 6.51 4402.85 9.57 3 Water Recourses 959.72 3.51 415.10 2.22 1374.82 2.99 4 Industry 613.25 2.25 52.39 0.28 665.64 1.45 5 Electricity 4688.37 17.16 2484.10 13.29 7172.47 15.59 6 Fuel , Gas and Natural Resources 395.64 1.45 718.36 3.84 1114.00 2.42 7 Transportation 3344.52 12.24 4405.27 23.58 7749.79 16.85 a) Road Transportation 1856.00 6.79 2885.35 15.44 4741.35 10.31
b) Railway, Waterway/ River and Civil Aviation Transportation 1488.52 5.45 1519.92 8.13 3008.44 6.54
8 Communication 98.20 0.36 206.43 1.10 304.63 0.66 9 Physical Planning, Water Supply
and Housing 2888.23 10.57 2762.83 14.79 5751.06 12.28 10 Education and Religion 3847.97 14.09 2276.70 12.18 6124.67 13.31 11 Sports and Culture 262.06 0.96 4.50 0.02 266.56 0.58 12 Health, Nutrition, Population and
Family Welfare 2251.26 8.24 1691.27 9.05 3942.53 8.57 13 Public Relation 110.58 0.40 5.78 0.03 116.36 0.25 14 Social Welfare, Women and Youth
Affairs 323.83 1.19 121.29 0.65 445.12 0.97 15 Public administration 455.51 1.67 630.11 3.37 1085.62 2.36 16 Science, Information and
Communication Technology 160.08 0.59 76.94 0.41 237.02 0.52 17 Labor and Employment Generation 160.72 0.59 14.33 0.08 175.05 0.38 Sub Total: 17 Sector 25715.49 94.14 17847.34 95.52 43562.83 94.70
Source: Annual Development Plan, 2010
Table 3-18: Breakdown of Project Budget (10 million TK)
Sl. No. Sector/Program
Local Currency % Budgeted % Total %
Development Assistance 18 a) Upazilla Development
Assistance 400.00 1.46 0.00 0.00 400.00 0.87 b) Union Council Development Assistance 40.00 0.15 0.00 0.00 40.00 0.09
19 Municipality Development Assistance 320.00 1.17 0.00 0.00 320.00 0.70
20 CHT Development Assistance 85.00 0.31 0.00 0.00 85.00 0.18
21 CHT Local Govt. Development Assistance 30.00 0.11 0.00 0.00 30.00 0.07
22 CHT Development Board Development Assistance 35.00 0.13 0.00 0.00 35.00 0.08
23 Particulars Areas Development Assistance (excluding CHT) 15.00 0.05 0.00 0.00 15.00 0.03
24 District Council Development Assistance 300.00 1.10 0.00 0.00 300.00 0.65
25 City Corporation Development Assistance 135.00 0.49 0.00 0.00 135.00 0.29
26 Development assistance for Special Needs 239.51 0.88 837.66 4.48 1077.17 2.34
Sub Total: Development Assistance 1599.51 5.86 837.66 4.48 2437.17 5.30 Total (17 Sector + Dev. Assistance) 27315.00 100 18685.00 100 46000.00 100 Grand Total 27315.00 100 18685.00 100 46000.00 100
Source: Annual Development Plan, 2010

Data Collection Study on Regional Development in Southeastern Bangladesh Final Report
3-15
Implementaion set-ups of Hill District Councils in CHT and District Councils in CXB are as follows according to the interviews:
Table 3-19: Manpower and Vacancy of CHT District Council Name of the Office Name of the Position
Existing post
Khagrachhari Rangamati Bandarban Vacant Post Vacant Post Vacant Post
Office of the Chairman
Personal Secretary of Chairman 1 1 - 0 Public Relation Officer 1 1 - 1 Stenographer (PA) Cum Computer Operator 1 0 - 0 Driver 1 0 - 0 Depositor 1 0 - 0 Orderly 1 0 - 1 MLSS 2 0 - 0
Sub-Total 8 2 - 2
Chief Executive Officer
Chief Executive Officer 1 0 - 0 Stenographer (PA) Cum Computer Operator 1 0 - 0 Driver 1 0 - 0 MLSS 1 0 - 0
Sub-Total 4 0 - 0
Department of Administration
Executive Officer/ Senior Assistant Secretary 1 0 - 0 Administrative Officer 1 0 - 0 Computer Operator 1 0 - 0 Upper Divisional Assistant 1 0 - 0 Office Assistant 1 0 - 1 Computer typist 1 0 - 0 Assistant Librarian 1 1 - 1 Mechanic 1 0 - 1 Driver 4 0 - 1 Electrician 1 0 - 1 Duplicate Machine Operator 1 0 - 1 Messenger 1 0 - 0 MLSS 1 0 - 0 Guard 1 0 - 1 Sweeper 1 0 - 1 Speedboat Driver 1 - - - Night Guard 8 0 - 1 Gardener 1 0 - 1
Sub-Total 27 1 - 10
Dept of Engineer
Executive engineer 1 0 - 0 Assistant Engineer 2 2 - 0 Sub Assistant Engineer 4 0 - 0 Drafts man 1 1 - 1 Upper Divisional Assistant 1 0 - 0 Office Assistant 1 0 - 1 Computer Typist 1 0 - 0 Account Assistant 1 0 - 0 Work Assistant 4 0 - 4 Driver 1 0 - 1 MLSS 3 0 - 0
Sub-Total 17 3 - 7

Data Collection Study on Regional Development in Southeastern Bangladesh Final Report
3-16
Name of the Office Name of the Position
Existing post
Khagrachhari Rangamati Bandarban Vacant Post Vacant Post Vacant Post
Land Office
Land officer/Senior Assistant Secretary 1 0 - 0 Kanungo 1 0 - 1 Surveyor 1 0 - 1 Office Assistant 1 0 - 0 Chairman 2 0 - 1 MLSS 1 0 - 0
Sub-Total 7 0 - 3
Accounts and Audit Branch
Accounts Audit Officer 1 0 - 0 Accountant 1 0 - 0 Junior Auditor 1 0 - 1 Accounts Assistant 1 0 - 0 Computer Typist 1 0 - 0
Sub-Total 5 0 - 1 Total Post and Vacancy 68 6 - 23
Table 3-20: Manpower and Vacancy in CXB District Council Description Name of the Position Existing post Vacant Chairman Chairman 1 0
Stenographer (PA) 1 1 Driver 1 1 MLSS 2 2
Sub-Total 5 4 Chief Executive Officer
Chief Executive Officer 1 1 Stenographer (PA) 1 0 Driver 1 0 MLSS 1 0
Sub-Total 4 1 Dept. of Administration
Secretary 1 1 Administrative Officer 1 0 Chief Assistant 1 0 Upper Divisional Assistant 1 0 Accountant/Assistant Accountant 1 0 Lower Divisional Assistant Cum typist 1 0 Driver/Motor Mechanics 1 0 Duplicating Machine Operator Cum Peon 1 0 Guard 1 0 Data Messenger 1 1 MLSS 2 2 Sweeper 1 0
Sub-Total 13 4 Dept. of Engineering
Assistant engineer 1 0 Sub Assistant Engineer 1 0 Upper Divisional Assistant 1 0 Lower Divisional Assistant Cum Typist 1 0 Surveyor 1 1 Electrician 1 0 MLSS 2 0
Sub-Total 8 1 Total 30 10

Data Collection Study on Regional Development in Southeastern Bangladesh Final Report
3-17
3.2 Community Profiles 3.2.1 Khagrachhari
Shimana Para (Dighinala Upazila) History Tripura people consisting of 7 to 8 households moved to this village about 150 years ago in the process of shifting cultivation. The present Karbari is the third generation. Other households also moved to this village and population increased up to 80 households. Diarrhea became widespread in 1965 and 2000. Villagers had to eat natural taro due to poor harvest in 1980. A cyclone hit the village badly in 1991. Society It is a paternal society. Properties of fathers are inherited by sons and properties of mothers are inherited by daughters. Tripura has 36 clans. It is rare for several clans to live in the same village. It is common to marry within the same clan. Marriage with other clans is also seen traditionally but marriage with other ethnic groups is a recent phenomenon. All the villagers are Hindu. Villagers celebrate religious events together. When a villager dies, all the villagers contribute 10 TK for the funeral. When a villager falls into trouble, other villagers help him/her. Reciprocal practice is in common among villagers without money. Marriage is also conducted with help of each other. Village meeting Villagers consult Karbari when a dispute arises. To submit the claim, he/she pays 50 TK or a drink of alcohol as a fee. Villagers hold a meeting as necessary like religious events, school construction, and so on. The leader of an event assumes the responsibility of the chairperson. The Karbari is not necessarily the chairman but is informed of the decision of the meeting. Natural conditions The overall geology of the area consists of Surma group, Boka Bill formation and Tipam group, Tipam Sandston formation of Neogene age. Field survey identified sand stone and silt stone around village.
The village is located on dividing ridge between Chingri River and Myani River. Elevation is about 230 m. On the ridge slope, V-shaped valley has formed on a hill slope, and the valley is few hundred meters to one kilometer long. The V-shaped valleys join with the main valley which has flat land on the bottom of valley. At the meeting points between V-shape valley and main valley, there are springs which is used as drinking water sources by villagers. During the rainy season (from June to October) V-shape valley has water flow. Within the village area, small landslides occur sometimes but there are close to no human damage. Socio-economy Agriculture is the base of economic activities. Agricultural production is basically for self-consumption. Income from agricultural production is limited; nevertheless, surplus from jhum cultivation and home gardening are important income source for villagers. Since the production from jhum cultivation is not stable these days, income is inevitably unstable.
Major crops in jhum cultivation are rice, til, taro, pumpkin, eggplant, banana and others. Each household has a small fruit garden around the settlement. Small portion of flat land on foot of the hill is utilized for horticulture production such as radishes and beans during dry season. Villagers also utilize the hill slope to produce timber wood.

Data Collection Study on Regional Development in Southeastern Bangladesh Final Report
3-18
Turmeric and banana are main income sources in this village. Because the income from these crops is limited, they also earn money through day labor.
There is a school run by an NGO in the village. A governmental school is located in the neighboring village, but it is difficult for children to go to school due to the far distance. Students who go to secondary school need to go to the nearest town, but it is also too far to go every day.
Access to medical facilities is not good. Basic medicines are available in a small shop in the village. There is a woman trained in health care by an NGO who is able to provide basic health advice.
The biggest cultural event for village is Boishabi which is usually held in the beginning of rain season (Boishak). Loki Puja which is held in August is an important religious ritual in the village. Poverty The livelihood of village is based on jhum cultivation. Villagers produce essential crops for their daily consumption. Other necessary food items are purchased by money earned through sale of surplus agricultural production and day labor. Wage of day labor is about 200 TK for male and 150 TK for female. Since they do not have opportunity of day labor regularly, income from the labor is unstable.
According to a hearing with villagers, approximate annual income from cash crops such as banana and some jhum productions is 36,000 TK.
Housing in the village is basically tin sheds and dirt walls. Rooms are separated into different functions such as bedrooms, dining and storage. Kitchen with food storage is separated from the main building.
Sanitary latrines are not available, but villagers use self-made toilets built near their houses. The latrienes are walled by bamboo covers, but there is no roofing. Livelihood Livelihood of the village based on jhum cultivation, cash crops and day labor. Necessary food items are produced by jhum, and items unavailable in the village such as food, goods and medical services are covered by money earned from day labor and sale of surplus agricultural products. They produce rice as staple food, but rice produced on jhum can cover only 50% of village’s needs. It is said that village cultivates about 5 acre of jhum on average. About 2–3 acres of land out of 5 are usually utilized for rice cultivation. Yield of rice per acre is only 1 ton which is much less than HYV rice usually cultivated in flat land.
Turmeric is the main cash crop in this village. Price of raw turmeric is about 500 TK per 40 kg and dried turmeric is 32,000 TK per 40 kg. Because the weight of turmeric decreases to one fifth when it is dried, 40kg of dried turmeric is equal to 200 kg of raw turmeric worth 25,000 TK. Thus, villagers can produce about 700 TK value from 200 kg turmeric by drying.
Problem in agriculture is damage by wild animals such as monkeys, squirrels and wild pigs. Only one villager who works in the district office earns a regular salary. There is no household receiving remittance. Villagers spend cash on food items which are not produced in village such as dry fish, spices and oil. Land Ownership Villagers used to utilize the vast area of hill slope for jhum cultivation. Jhum cycle was more than 10 years at that time. Due to natural population growth and migration, they can use limited land for jhum. They are now forced to cut down the cycle of jhum to 2–3 years.

Data Collection Study on Regional Development in Southeastern Bangladesh Final Report
3-19
Villagers usually decide where they cultivate for jhum every year in village meetings. Villagers themselves divide the area selected at meetings. Each household usually use 2 acres of land for jhum cultivation these days. Infrastructure There is a brick road from main road to the entrance of the village. That road has been built by CHT Development Board. Safe drinking water There is no improved water supply device for drinking. All villagers are using stream water or spring water. The main water source is located 3 km away from village and more than 50 meters lower in elevation. 3 hours are needed to collect water.
Near the village, there is a ring well which was installed by DPHE. Several years after installation, the ring well was abandoned due to no water in dry season. Community Infrastructure Road communication in village made along with ridge of hill. The village roads are managed by the village committee. There are no bridges or channels. Public services It is about 20 km to Union Parishad. Due to the hilly location and no direct shortcuts, villagers have to go to Union via Upazila. The Sub Assistant Agricultural Officer rarely visits. Access to public services is very poor. EPI is conducted but villagers are afraid of injections. Assistance Zabarang (NGO) supported construction of a primary school and posted a teacher. Villagers contributed to school construction. Villagers bought cows using Quick Impact Fund. A rice bank was also established. Union Parishad received 1.3 million TK from Local Governance Support Project (LGSP).

Data Collection Study on Regional Development in Southeastern Bangladesh Final Report
3-20
Pond used for bathing and washing clothesWater source located in neighboring village
Standard housing in the village Panoramic view of the village
Collapsed slope by turmeric cultivation Thrashed forest for jhum
Ring well with no water Carrying water by 1 hour walk

Data Collection Study on Regional Development in Southeastern Bangladesh Final Report
3-21
Nuru Siqdar Para (Matiranga Upazila) History Villagers moved to this village from India in 1962. The present Sardar is second generation. The Sardar position is not hereditary but selected by villagers as a leader. The population increased up to 100 households. Villagers suffered from heavy floods in 1987 and 1995. Society It is a paternal society. Property of parents is inherited by sons and daughters according to Islamic law. It is common for parents to arrange marriages. Villagers help marriage of poor households but usually hold marriage ceremony individually. When villagers receive help from other villagers, they usually pay money for help. Villagers celebrate religious events together. Village meeting Villagers consult Sardar when a dispute arises. There is no custom to pay money as a fee for consultation. When the dispute is beyond the capacity of Sardar, villagers go to Union Parishad Members, Union Paridhad Chairman, and Upazila Parishad Chairman. Decisions on communal work, like construction of religious places, are made at village meeting presided by Sardar. 5 to 6 village meetings are conducted in a year on average. A meeting of Para Development Committee (PDC) is held monthly. Villagers discuss collecting savings at PDC meetings. Balance of PDC fund is 279,000 TK as of now. Natural conditions The overall geology of the area consists of Duti Tila formation of Neogene to Pleiocene age. Field survey identified mainly sand stone.
From a geographical point of view, this area is classified as low hills and top of hills is formed by flat land, where residential area is located. Around the low hills, there is a valley with flat land. Relative elevation between the bottom of valley and the hilltop is approximately 15 m to 20 m. Most valleys have springs that source small streams which are used for terraced paddy fields. Socio-economy Basically, agriculture is the main economic activity. Main crops in this village are rice, vegetables, spices and fruits. They cultivate rice on small flat land between hills. Vegetables, other cereals, spices, vegetable and fruits are produced on slopes. The main crops cultivated on slopes are turmeric, ginger, banana, taro, cabbage, cauliflower, potato, pumpkin and beans. Most of products are basically for self-consumption, and small amounts of surplus are sold in local markets. Banana and turmeric are cultivated mainly as cash crop.
Water reservoir for rice cultivation is used for fish cultivation as well. Some villagers invested in fish culture. Each family owns livestock such as cattle, goats and chickens. These livestock are sold when they need cash. Many households own only 1 or fewer acre of land, so production of cash crops such as turmeric and some vegetables are limited. Thus, villages usually earn money by day labor.
There is one primary school built by the community. It is registered with the government, but practically run by the community. All children go to the primary school. Secondary school is located in a neighboring town, so only 10 students attend. Only one student respectively attends high school and university.
A hospital is located in town, an hour drive from the village. There was a case that a child

Data Collection Study on Regional Development in Southeastern Bangladesh Final Report
3-22
badly injured died before reaching hospital. Usually, villagers use pharmacies in nearest market, if symptoms are not so serious.
There are Eid related religious events in this village. Poverty Staple foods in this village are rice and vegetables produced in home gardens. Meat and fish are eaten once or twice in a month.
Houses are made of wood, and dirt or bamboo walls and tin roof are common. The kitchen is usually separated from main house, but structure is almost the same.
There are not many sanitary latrines, so usually huoseholds build toilets themselves. Livelihood Income sources of a standard household in this village are surplus of banana, jackfruit, and turmeric production. For example, bananas can be harvested twice a year, and villagers usually earn 300–400 TK per tree in one season. Jackfruit can be harvested once a year, and they can earn about 1,000–2,000 TK per tree. Income from turmeric fluctuates by year.
Villagers usually can sustain their livelihoods by income from agriculture only for 2 or 3 months; thus, they need sell labor to earn money for rest of the year. Wage of labor is usually 200TK for male and 150TK for female.
A calf was given to 80 families by UNDP fund. They can get profit by refunding the value of calf from the money recovered by sale of cattle. Every family has some livestock such as goats and chickens. They sell them according to need of cash.
There are seven families receiving remittance from foreign countries. Five are working in Qatar and two are in Bahrain.
Average expenditure of one family with 6 members is estimated as 2,000 TK.
Grameen Bank and other NGOs provide micro-credit, and many households depend on these programmes. Land Ownership, Institution Most of the land belongs to the government called khas. Private-owned land is very limited. Many families build their house on 1 acre of land, and cultivate fruits and vegetables around the house. Some of villagers rent flat land and cultivate rice.
There is one body of water for rice irrigation. Some families rent the pond as a group for fish culture. Infrastructure There is a brick road from main road to the village which was built by CHT Development Board.
A primary school was built in the village. A small embankment was developed to supply irrigation water and fish culture. Safe drinking water There are 22 STWs in the village. Villagers use mainly STWs. Most of STWs are located at ending point of flat land of valley. Approximately 90% of STWs were installed privately. Community Infrastructure The village road is managed by the community. There is no bridge or channel.

Data Collection Study on Regional Development in Southeastern Bangladesh Final Report
3-23
Public services It is about 7 km to Union Parishad and about 16 km to Upazila. Sub Assistant Agricultural Officer visits occasionally. EPI is well conducted. The problem is no access to nearby medical services. A worker was posted in the community clinic 2 months ago. Generally speaking, doctors are reluctant to be posted in remote areas. Assistance A brick road was constructed in the village in 2007 by CHT Development Board. Alo (NGO) also helps PDC activities. Villagers bought cows by Quick Impact Fund. There is no Rice Bank in this village.

Data Collection Study on Regional Development in Southeastern Bangladesh Final Report
3-24
Main STW used by villagers Paddy field irrigated from spring
Banana plantation on slope Sapping date tree
Fruit plantation and paddy fields Reservoir made by riverbank
Normal village housing Firewood collected from forest

Data Collection Study on Regional Development in Southeastern Bangladesh Final Report
3-25
3.2.2 Rangamati Sagu Para (Rangamati Sadar Upazila) History The village was formed more than 150 years ago when 5 out of 15 households in the village moved to this location in 1960 due to Kaptai Dam construction. The present Karbari is the second generation. The village has 23 households now. A cyclone hit the village heavily in 1991. Society It is a paternal society. Properties of parents are inherited by sons. It is common for parents to arrange marriages though an increasing number of young couples are making their own decisions recently. 3 clans of Chakma peoples live in the village. Marriage among sub-clans is inhibited. All villagers are Buddhists and have a temple in the village. Villagers celebrate religious events together. When a villager falls into trouble, other villagers help him/her. Reciprocal practice is common among villagers without money. Weddings are also conducted with help of each other. Village meetings Villagers consult Karbari when a dispute arises. To consult the matter, he/she pays 10 TK as a fee. Karbari and elders mediate in an open space in the village through a committee. Villagers can also make comments on the mediation. When a fine is imposed, the money is used for eating and drinking among villagers. The Headman of this Para is Raja himself. When the dispute is beyond the capacity of Karbari, villagers go to Raja for solution. 1 to 2 village mediations in a year are conducted on average. There are no thieves in the village. Every July, the Union Parishad Chairman, Karbari, PDC representative, and villagers get together for discussion on village events and development work. Natural conditions The overall geology of the area consists of Tipam group, Tipam Sandston formation of Neogene age. Field survey identified sand stone and silt stone in alternate layers.
From a geographical point of view, this area is classified as low hills and the top of the hills is formed by flat land, where the village is located. Around the low hill area, there is a valley with flat land. Height difference between the bottom of valley and hilltop is about 10m to 15 m. Most valleys have springs that source small streams which are used for terraced paddy fields. Socio-economy Economic activities are based on fishery in Kaptai Lake and agriculture. Cash crops are very limited, and fishery is mainly for self-consumption.
Terraces are made along a creek toward the lake. Land is categorized according to accessibility to water. First category is near hills where enough water can be collected. Second category land is located in the middle of terrace where water can still be drawn. Third category land is where it is difficult to bring water. Production of rice per acre in first, second and third category land is 0.8 tons, 0.7 tons and 0.4 tons respectively. Every household has land on hill slopes, so they produce horticulture products. Main crops cultivated on slope are banana, jackfruit, orange, turmeric, ginger, radish, pumpkin, beans, cucumber, sweet potato, chili and eggplant.

Data Collection Study on Regional Development in Southeastern Bangladesh Final Report
3-26
Villagers fish from June to August. They usually use large fishing nets as group. They do not conduct fish culture. Almost all households own livestock such as cattle, goat, poultry and pigs.
Villagers are keen to send their children to school. Thus, all children go to primary school. 14 students go to secondary school, 16 go to high school, and 3 students go to university. There is one Ph.D. graduate who teaches at the University of Dhaka.
There is a medical center which has 15 beds in a neighboring village, but there is no doctor or even a nurse. Thus, people usually use the hospital in Rangamati town.
There is a religious event from October to November and Buddha Ponima is held in April to May. Poverty There is no particular income source in the village. Every household engages in agriculture, fishery and animal rearing. The scale of production is small, but they earn small amount of money from each sector. Because they make money according to their need by selling surplus of any products, they do not have savings.
Houses are made of dirt walls and tin sheds. There are only two sanitary latrines. Each household usually has a home garden to produce food for self-consumption.
Fish is often available because of fishery in Kaptai Lake. Vegetables are produced at the household level, so villagers can afford to eat vegetables every day. Livelihood Villagers’ income sources are agriculture, fishery, livestock and timber. Income from day labor is limited in this village. There are few families which receive remittance. Every family has women who can make traditional textiles. These textiles are sold at local events. Land ownership The average household land is 3 acres with the exception of few households owning more than 10 acres. Two thirds of the land is located in a hilly area where villagers plant timber trees, banana, turmeric, ginger, and so on. Most households cultivate horticulture products and some households with more land area cultivate rice using ravine water. All the households are said to have legal land ownership granted by Circle Chief. Infrastructure There is no paved road or bridge. Irrigation water is dependent on spring water. There is a concrete ditch which was made by ADB’s budget. The village is unelectrified but all households have solar photovoltaic power generation system. Safe drinking water There is a private STW, a Tara pump and more than ten springs as drinking water sources. Additionally there are two inactive ring wells. Usually villagers use spring water. Kaptai Lake water is used for bathing and washing but not drinking. During the peak of dry season, if springs dry up villagers collect drinking water from the STW. In rainy season some springs become submerged in Kaptai Lake water. Community Infrastructure There is a pre-primary school supported by UNICEF. There is a primary school and a secondary school near the village.

Data Collection Study on Regional Development in Southeastern Bangladesh Final Report
3-27
Since there is no market, villagers need to go to Rangamati town.
There is a graveyard which is established by a villager near the lake. Public services Union Parishad Office is in the town of Rangamati. Union Parishad Complex is expected to be constructed in the village. Sub Assistant Agricultural Officer visits as per request over the phone. There are 2 high schools and teachers commute by boat across Kaptai Lake. The Veterinary assistant rarely visits. Vaccination for livestock was conducted by NGO. EPI is well conducted. Assistance Union Parishad received 800,000 TK in 2010/11 from LGSP. DPHE installed 2 shallow tube wells funded by DANIDA. Integrated Community Development Project (ICDP) installed ring-wells. Villagers bought a solar power system, boat, and cows by Quick Impact Fund. Rice Bank was also established.

Data Collection Study on Regional Development in Southeastern Bangladesh Final Report
3-28
Irrigation from stream on a hill Home garden instructed by DAE
Textile made by village women Kitchen of a standard house
Main spring used by villagers Terraced paddy fields irrigated from spring
Pump not used due to odor Ring well out of use

Data Collection Study on Regional Development in Southeastern Bangladesh Final Report
3-29
Bar Ghonia Para (Kaptai Upazila) History 5 households moved to this village in 1935 seeking arable land. The present Karbari is the second generation. The village has 64 households now. 12 households are Bengali settlers. The village is located in valley, which is why damage from cyclone in 1991 was not so severe. Society It is a paternal society. Property of parents is inherited by sons. It is common for parents to arrange marriage though an increasing number of young couples are making their own decisions recently. 1 out of 11 clans of Tanchangya peoples lives in this village. Tanchangya people are Buddhist and have a temple in the village. They marry within the same clan and marriage among sub-clans is not inhibited. Reciprocal practice is in common among villagers without money. Villagers celebrate religious events together. When a villager falls into trouble, other villagers help him/her. Village meeting Villagers consult elders and Karbari when a dispute arises. To consult the matter, he/she pays 10 TK as a fee. Karbari and elders mediate in open space in the village through a committee. When a young couple marries without permission of their parents, a fine of one pig is imposed. Villagers eat the pig. There are no thieves in the village. Village mediation rarely happens. 5 to 6 village meetings are conducted in a year on average for discussion on religious events, cultivation, and so on. PDC meeting is held monthly for discussion on development work. Natural conditions The overall geology of the area consists of Surma group, Boka Bil formation of Neogene age. Field survey identified sand stone and silt stone in alternate layers.
From a geographical point of view, this area is classified as low hills and top of hills is formed by small flat land. Around the low hill area, there is a valley with flat land. Therefore residence area is located at the base of hill slope where it is a little higher than flat land of the valley.
Most valleys have springs. The spring water makes small streams which are used for terraced paddy fields. Socio-economy People in this village live on agriculture, fishery, livestock and forestry. This village has flat land along the river; thus they cultivate rice. Because private investor constructed a creek dam in village, they have water supply for not only growing rice but also vegetables during dry season. They use not only gravity irrigation but also pump irrigation.
Agricultural land is categorized into first and second categories according to condition of irrigation. First category lands are located upstream where water access is better. Second category lands are located downstream where they have water shortage. HYV purchased from DAE is utilized for both categories. Approximate yield of rice per acre is 1.4 tons in the first category, and 1 ton in the second category.
People produce other major crops and vegetables such as maize, sugar cane, potato, radish, tomato, cauliflower, cabbage, cucumber and others. They also cultivate crops on jhum such as turmeric, ginger, taro, and banana. Households which have land cultivate fruits such as

Data Collection Study on Regional Development in Southeastern Bangladesh Final Report
3-30
mangoes, jackfruits, papayas, and tamarinds.
Basically, these crops are produced for self-consumption. When there is surplus production, villagers sell them to middle man who visits the village once a week.
Villagers culture fish in a creek dam constructed by the local government. They fish once a year. Some households keep domestic animals at the household level. Cattle are used for plowing, and milking. Rearing goats and pigs are common, but one household rears pigs for commercial purpose. Many households grow timber trees on their slope land.
The level of education is comparatively high in this village. All children go to primary school, and complete primary education. 70% go to secondary school. There are some villagers who have finished undergraduate level.
Access to medical facilities is not very good. There is no medical facility or pharmacy near the village. Thus, they need to go to Kaptai town for any treatments.
There are religious festivals called Bud Panima, Assin Panima, and Madu Panima in this village.
Poverty Most households do not have regular income from agriculture, fishery, livestock and forestry; therefore, they earn money for daily expenditure by selling surplus products. When they need a certain amount of money, then they usually sell livestock or timber. There are few villagers who have regular income.
Houses are usually built on hills. They use soil for walls and tin for roofs. Rooms are functionally separated such as kitchen and bedrooms. There are 40 sanitary latrines in this village. Villagers produce fruits in their home gardens.
Villagers eat rice and vegetables every day, but meat and fish only once or twice a week.
Village women produce textiles for their traditional clothes that they usually wear. Clothes are produced by almost every household, but they do not sell them out of the village. Livelihood Main income source of this village is surplus from agriculture, fishery, livestock and forestry. Main cash crops are rice, turmeric, ginger, banana, and jackfruit.
Expenditure of a family of five members is about 5,000 TK. There are 35 persons who have a regular salary.
There is no remittance from foreign country. Land ownership Average land ownership is 3 acres. About 30% is flat land, and rest of land is on hill slopes. They utilize flat land for rice cultivation and horticulture. Slopes are used for jhum cultivation, fruit plantation, and timber production. Villagers have legal ownership of their land. There is no village common forest. Infrastructure From the main road to the village, there is a brick road which was constructed by district council. Presently, improvement of access road and concrete embankment between road and paddy fields is under construction by district council. A mini dam for irrigation was constructed in 2004 by BWDP with 3 million taka. Electrification is 100% completed.

Data Collection Study on Regional Development in Southeastern Bangladesh Final Report
3-31
Safe drinking water There are ring wells, STWs which were installed by Union, HYSAWA project and other organizations. Spring water is also being used because it is available all year long. Community Infrastructure There is a primary school. Apart from the creek dam constructed by the government, there is another small dam under construction by private investment. There is no medical facility in the village. There is no regular market, but they have one grocery shop.
An irrigation system is established, but it is only to supply water to paddy fields in village. Public services It is about 2 km to Union Parishad and about 3 km to Upazila. Villagers receive the same service as other areas, like old age allowance from Union Parishad. Sub Assistant Agricultural Officer comes and provides technical advice. Family planning workers also visit to provide their services. EPI is well conducted. A community clinic has not been constructed because villagers do not contribute the land for construction. Assistance Union Parishad received 1 million TK in 2010/11 from LGSP. Village road and fence around the temple were constructed through Food for Work programme. Access road to main road and bridge were constructed by Hill District Council. NGOs of Grameen Bank, IDF, and CIDP are working in this village. About 20 households received micro finance from NGOs for agriculture. Villagers bought cows by Quick Impact Fund.

Data Collection Study on Regional Development in Southeastern Bangladesh Final Report
3-32
Pond constructed by BWDB Community road
Traditional dance Traditional textile
Ring well constructed by DPHE Spring water used by local residents
Sapling nursery Horticulture on flat land

Data Collection Study on Regional Development in Southeastern Bangladesh Final Report
3-33
3.2.3 Bandarban Kattali Para (Bandarban Sadar Upazila)
History 20 households moved to this village about 85 years ago seeking a water resource. The present Karbari is the sixth generation. The Karbari position is not hereditary but selected by villagers. The village has 52 households now. Diarrhea was severely spread about 25 years ago and 7 villagers died. Society It is a paternal society. Property of parents is inherited by sons and daughters. 1 out of 22 clans of Marma peoples live in this village. Nowadays, young couples decide their own marriage. Inter-clan marriage is common. Villagers are Buddhist and have a temple in the village. Reciprocal practice is in common among villagers without money. Villagers celebrate religious events together. When a villager falls into trouble, other villagers help him/her. Villagers installed a well and maintain access village road commonly. Village meetings Villagers consult Karbari when a dispute arises. To consult the matter, he/she pays 400 TK as a fee. Karbari and elders mediate in an open space in the village through a committee. Monks are not involved in the mediation. Village meetings are held as necessary. 12 meetings are held in a year on average. Karbari, elders, and Union Parishad Members are important participants but monks do not participate in the meeting. PDC meeting is held monthly for development work. Natural conditions The overall geology of the area is near the boundary between Tipam group, Tipam Sandston formation of Neogene age and Dihing, DupiTila Formation of Pleiocene to Pleistocene age. Field survey identified silt stone with sand layer.
The village is located on a high hill in the riverhead area of Sang River tributary. Elevation is about 90m. Socio-economy Agriculture and forestry are main economic activities in this village. Rice is produced on flat land near the river. They use HYV seeds purchased from the market. Yield of rice per acre is about 2–2.4 tons. Hill slopes are used for jhum cultivation. They dam the stream, and use the water to irrigate rice cultivation. They use fertilizers and pesticides for HYV production. Use of local varieties is limited.
Villagers produce rice and turmeric on jhum. They believe they can reduce labor input for weed control by cultivating rice and turmeric together. They also cultivate ginger on slopes, but it is cultivated separately. They grow eggplants and pumpkins in jhum. Villagers usually plant fruit trees in homesteads but it is mainly for self-consumption. Commercial production of fruits such as mangoes, papayas, and bananas is limited. CHTBD once supplied free mango tree saplings.
Bodies of water for fishing are very limited. There is only one household who has a pond for fish culture. Villagers rear cattle, goats, pigs and poultry.
Since there is no primary school in this village, children are taught by a tutor. Due to lack of primary education, few children can go to secondary school.

Data Collection Study on Regional Development in Southeastern Bangladesh Final Report
3-34
There is no hospital or pharmacy near the village, so they need to go to Bandarban town for treatment. Poverty Agricultural products are consumed by the villagers themselves. Thus, income from agricultural products is minimal. Houses are built with bamboo and wood collected from hills.
They hardly eat meat and fish because they need to purchase these items from markets.
Vegetables are not always available, because they produce vegetables on small portion of land. Livelihood Main income of this village is day labor for agricultural work. Wage of labor is 200 TK for male and 150 TK for female. There are two villagers who earn salary as regular income. One works in a government office. The other works as a teacher.
Turmeric is one of the most important cash crops. Yield of turmeric is 2.8 tons per acre. It is usually sold after drying. Selling price of raw turmeric is 5,000 TK per ton, thus profit is 14,000 TK per acre. Production of dried turmeric is 560 kg per acre. Because the price of dried turmeric is 2,000 TK per 40 kg, income from dried turmeric is 28,000 TK per acre. Since the average area of turmeric production in this village is 0.5 acres, annual income from turmeric is estimated at 14,000 TK. Price of turmeric in 2010 was three times higher than in 2011. Ginger is also cultivated as cash crop. Land ownership 15 out of 52 households have around 5 acre of land total. 4 households have about 0.5 acres of land, and rest of them is landless. Private land ownership is common in this village. Landless farmers depend on sharecropping of jhum. Share croppers usually pay 30% of products, or 3,000 TK for half acre of paddy land or 2,000 TK for horticulture.
Flat land is used for paddy cultivation if water is accessible. If there is not enough water then they cultivate vegetables. They use hill slopes only for jhum.
Because jhum land decreases year by year, they are forced to cultivate jhum land almost every year. Only households who have more than 5 acres maintain 2–15 year jhum cycle. Infrastructure From the main road to the village, there is unsurfaced union road. In a section of the road, a bridge and culvert are under construction. Presently vehicles cannot enter the village. The village road is maintained by villagers. Safe drinking water There is no improved water supply device and villagers are using stream water. There are 4 to 5 water collection points. During rainy season water collection is very difficult because the path is slippery. Community infrastructure Access from paved road to the village is very bad. A stream that flows through the village is utilized for irrigation.
There is one Buddhist temple. One sanitary latrine is established by the temple.
There is no market in village, or even in the nearest villages.

Data Collection Study on Regional Development in Southeastern Bangladesh Final Report
3-35
Public services It is about 20 km to Union Parishad and about 15 km to Upazila. Villagers receive the same services as other areas, like old age allowance from Union Parishad. Sub Assistant Agricultural Officer rarely comes to the village. EPI is well conducted. One household one farm project is expected to be implemented. Assistance A bridge was constructed by Project Implementation Office. A box culvert and small dam were constructed by CHT Development Board. BRAC supports primary education through a local NGO. Eco-Development (NGO) plans to implement activities for mixed fruit garden support. Villagers bought seeds of turmeric and goats by Quick Impact Fund in 2011, and 200,000 TK out of 400,000 TK remains in the account.

Data Collection Study on Regional Development in Southeastern Bangladesh Final Report
3-36
Land for jhum cultivation Stream from valley used for many purposes
Standard housing in the village Soil erosion by slope cultivation
Sorting work for turmeric Valley prepared for jhum
Stream is used for washing and bathing Banana cultivation on slopes

Data Collection Study on Regional Development in Southeastern Bangladesh Final Report
3-37
Ranglai Chairman Para (Bandarban Sadar Upazila) History 25 households relocated to the village in 1994. Some households left the village seeking arable land and the number of households reduced to 19. 23 households moved to the village due to relocation in 2007. The present Karbari is the first generation. An outbreak of rats in 2007 damaged common forests. Society It is a paternal society. Property of parents is inherited by sons. 3 out of more than 40 clans of Mro people live in the village. Inter-clan marriage is common. Marriage within the same clan is prohibited. Originally Mro people were Buddhist but a new religion started about 30 years ago. 55% of people are followers of a new religion, Buddhists make up 40% of the population, and Christians 5%. Reciprocal practice is in common among villagers without money. Villagers celebrate religious events together. When a villager falls into trouble, other villagers help him/her. Village meeting Villagers consult elders and Karbari when a dispute arises. There is no custom to pay money as a fee for mediation. Village mediation rarely happens. Village meeting is held as necessary when a village event is held. PDC is formed in 2004 with 19 households. Future plans of PDC are to expand mixed fruit gardens, to maintain pre-primary education, and to facilitate small businesses. Natural conditions The overall geology of the area consists of Surma group, Boka Bill formation of Neogene age. Field survey identified silt stone mainly. From a geographical point of view, this area is classified as high hills and elevation is about 520 m. Most springs are located between 370 m to 450 m in elevation and V-shape valleys have formed from springs. The village is located on a ridge and elevation is 375 m to 410 m. The village has not been affected by natural disasters in the recent years. Socio-economy Jhum cultivation on steep slopes is the base of livelihood in this village. There is no flat land for paddy cultivation at all. They produce rice, pumpkin, radish, taro, til, chili, potato, sweet potato, cucumber, bean, turmeric, ginger and papaya. Main cash crops are turmeric, ginger, pumpkin, chili and papaya. Harvested cash crops are collected at a hut established by an NGO. A middleman visits the village to collect crops 3 times per week.
Villagers grow fruit trees with NGO assistance. In the mixed fruit garden, they produce mangoes, jackfruits, litchis and others. Fruits are also sold through a middleman.
They usually rear pigs, but few rear goats and cattle because they cannot produce fodder. Pigs and poultry are mainly consumed in the village. There is no fishery practice due to lack of water body.
A primary school is 20-minute walk from the village. All children go to primary school. 10 students go to secondary school. Only 5 villagers have graduated from high school.
A community clinic is also in 20 minute walking distance from the village. Since there is no pharmacy in village, they go to the market near the community clinic.
They hold religious festivasl three times in a year, in January, March and April.

Data Collection Study on Regional Development in Southeastern Bangladesh Final Report
3-38
Poverty The village’s income source is production of jhum and fruit gardens, thus it is unstable. When they do not have production, they earn cash by day labor.
Daily meals are mainly rice and vegetables. Meat and fish are available once or twice in a month.
Houses are built with bamboo and wood collected from hills. Structure is made of wood, and wall and floors are made of bamboo.
Villagers usually do not use toilets, but there are 5 sanitary latrines. Livelihood Main income is from jhum production and fruits. Ginger, turmeric and papaya are major cash crops. The selling price of ginger is 2,000 TK per 100 kg, and turmeric is 5,000 TK per 100 kg.
Day labor is also an important income source. Wage is 150 TK for male and 100TK for female. 5 villagers have salary. One works in a school, and four work in NGOs.
Expenditure of one family is about 3–5,000 TK. There are no families receiving remittance. Land ownership Average landholding is 1 or 2 acres. These lands are usually utilized for fruit plantation. There is no ownership document. Every family uses land around the village. The size of land use is different from family to family, but usually 1–5 acres.
Due to the lack of land, villagers cannot maintain enough time for jhum. They used to maintain a minimum 7 year cycle, now shortened to every 1–3 years. Infrastructure There is a brick road from main road to the entrance of the village and concrete stairs in the village constructed by CHT Regional Development Board.
There is no electrification. Safe drinking water There is a GFS with two public taps which was constructed by CHT Regional Development Board.
Water collecting point of the GFS is 1km away from village. Water is supplied by gravity though a water GI pipe. The villagers can collect water from public taps for 24 hours.
Regular maintenance is carried out by villagers and paid with their contributions. Community Infrastructure Paved road is available near the village. Concrete stairs was built by budget of the union.
Electricity is not available, but there are some households which installed solar panels of grameen Shakti.
There is a building for religion.
Market is in 20-minute walking distance from the village. Public services It is about 14 km to Union Parishad and about 20 km to Upazila. Villagers receive the same services as other areas, like old age allowance from Union Parishad. This village is on a

Data Collection Study on Regional Development in Southeastern Bangladesh Final Report
3-39
very steep slope. That is why steps were constructed by Union Parishad with the budget of 80,000 TK. Gravity flow system was installed by CHTDB with the budget of 1.5 million TK. Sub Assistant Agricultural Officer rarely comes. EPI is well conducted. There is a community clinic about 1.5 km away. Assistance Union Parishad received 500,000 TK last year from LGSP. Total of 500,000 TK was provided by Quick Impact Fund. Villagers constructed a community center and set up mixed fruit gardens. GRAUS (NGO) facilitates PDC activities. BNKS (NGO) runs a pre-primary school with the fund of Save the Children. CCDP (NGO) provides micro finance. NGOs facilitate linkage between government agencies and villagers. Utilizing UDCCM is planned for the linkage.
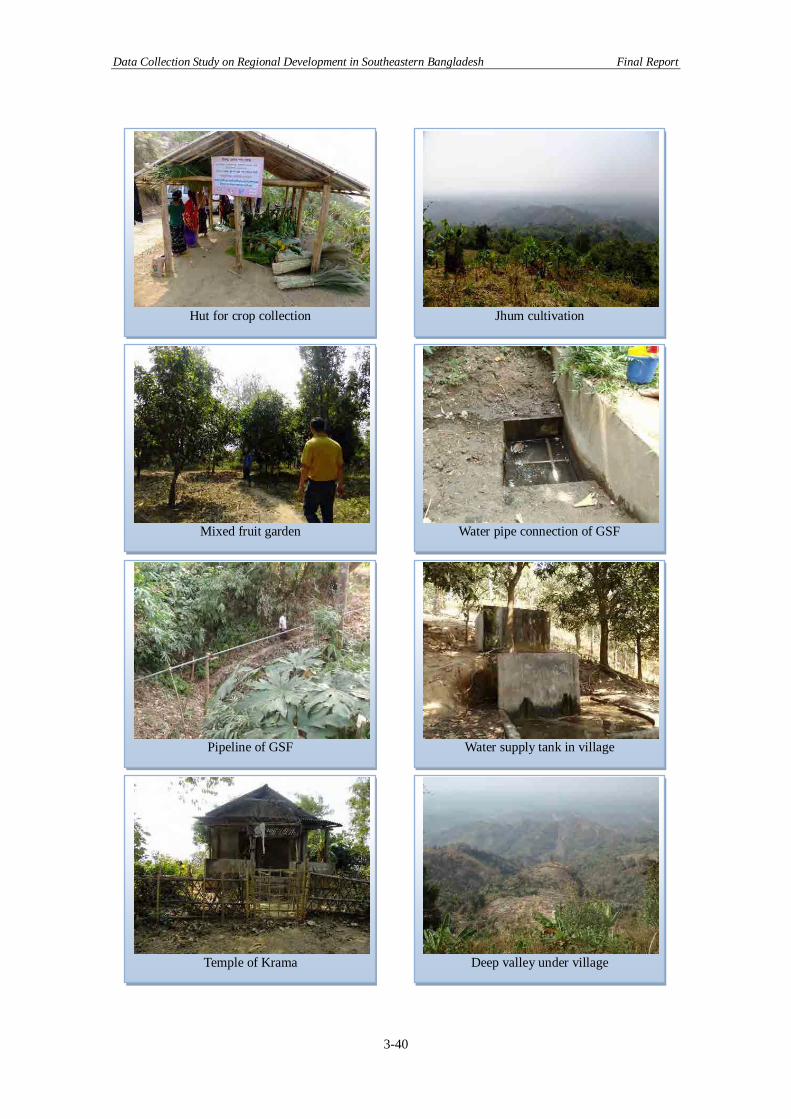
Data Collection Study on Regional Development in Southeastern Bangladesh Final Report
3-40
Hut for crop collection Jhum cultivation
Mixed fruit garden Water pipe connection of GSF
Pipeline of GSF Water supply tank in village
Temple of Krama Deep valley under village

Data Collection Study on Regional Development in Southeastern Bangladesh Final Report
3-41
3.2.4 Cox’s Bazar Kutu Palong Para
(Ukhia Upazila) History The origin of this village goes back to 6th Century. Rakhain peoples came to the village in 18th Century. After Rakhain people left, Buddhists and Muslims of Chittagong came in the 19th Century and still live today. 1,700 households live in the village now. There is Rohingya refugee camp in the village. The village is cyclone-prone and suffered severe damage in 1991. Society It is a paternal society. Property of parents is inherited by sons and daughters according to Islamic law. About half of the villagers are Muslim and the other half are Buddhist. About 50 households are Hindu. Property of parents is inherited by son among Buddhists. It is common for parents to arrange marriages. Reciprocal practice was common among villagers 20 years ago but villagers pay money for help nowadays. Even though unity seems weakened, when a villager falls into trouble, other villagers help him/her. Villagers celebrate religious events together. Village meeting Villagers consult elders when a dispute arises. There is no custom to pay money as a fee for mediation. 1 to 2 village mediations are conducted in a year on average. Villagers go to Union’s Parishad Chairman when the dispute is beyond the capacity of villagers. Village meetings are held as necessary when a village event is conducted. When Union Parishad Chairman comes to the village, villagers get together and discuss various issues including development work. A Muslim society has 7 traditional social units and a Buddhist society has 6 traditional social units. Each social unit has Sardar selected by villagers. Natural conditions The overall geology of the area consists of DupiTila formation of Pleiocene and Pleistocene age. From a geographical point of view, this area is classified as low foothills with flat land. Field survey identified sand stone from low hills. Therefore residential area is located at the base of hill slopes. Asmall river flows through the area. Socio-economy Agriculture is the main economic activity. Main production is rice and some vegetables and fruits. They use HYV rice such as BR-11, 28, 32, 33. They also use their own seeds. Average yield of rice is 1.6–2.2 tons per acre. Production using own seeds is 1.6 tons per acre. Produced vegetables include potatoes, chilis, eggplants, tomatoes, radishes, beans, pumpkins and others. Scale of production is very small, so they are self-consumed. Villagers produce fruits in their homesteads such as mango, jackfruit, banana, water melon, pineapple, papaya and guava.
An important cash crop is betel leaf and nut.
Many households keep cattle for mainly plowing. They sell cattle only in Eid festival. There are goats and chickens but their numbers are minimal. Only households that have their own pond culture fish.
There is a primary school and a secondary school in the village. Therefore, all children go to primary school, and graduate. 80% of students go to secondary school. 60% students graduate secondary school and 40% students go to high school. Students who go to

Data Collection Study on Regional Development in Southeastern Bangladesh Final Report
3-42
university are only 5%.
There is a community clinic in the village. Usually people use this clinic for the initial treatment. There is hospital run by MSF which provides service for Rohingya people. Local community can also receive medical service in MSF hospital.
50% of population is Muslim, and another 50% is Buddhist. Thus, there are religious festivals for both religions. Poverty Because many households depend on share cropping, income is not stable. Rice and vegetables are main items to be consumed as daily meals. T hey can eat meat or fish once or twice in a month.
Houses are made by dirt walls and tin-sheds. Sanitary latrines are not used. Livelihood Betel leaf is the main cash crop. Production cost such as fertilizers, pesticides, shed and labor for 0.1 ha land is about 82,000 TK. Profit from the sale of betel leaf is 48,000 to 120,000TK. Since betel leafs are sometimes destroyed by insects, risk is very high in spite of high profit. They utilize loan programmes of Grameen Bank and other BRAC for betel leaf production.
Day labor is also important income source, especially for landless household. Wage of day labor is 300 TK for male, and 150 TK for female.
Expenditure per person per month is estimated at 1,000 TK.
200 villagers are thought to be working in foreign counties. Thepeople are from large farming families. Land ownership 70% of households are landless. Most of other households usually have less than 1 acre. Few households have more than 2 acres of land.
Generally speaking, two thirds of the land is utilized for paddy cultivation. The rest of the land is used for cultivation of betel leaf, vegetables and fruits. Infrastructure A 671 m-long Union road was improved by AFC and financially supported by the Netherlands and Spain.
There is no irrigation facility. Villagers source irrigation water from a small channel by their own low lift pump. Power line connection is available but less than 10% of households are connected. Safe drinking water There are STWs and Ring wells. Most households having their own wells or use nearby wells. Therefore villagers are not facing a water problem. I n the western part of the village, there is a small river that villagers use for bathing and washing. Community infrastructure Road communication in the village is good. There is a market and small grocery shops in the village.
Mosques and Buddhist temples are also available.

Data Collection Study on Regional Development in Southeastern Bangladesh Final Report
3-43
Public services It is about 5 km to Union Parishad and Upazila. Villagers receive the same service as other areas like old age allowance from Union Parishad. Sub Assistant Agricultural Officer comes and provides technical advice. EPI is well conducted in community clinic but medical services are not provided in community clinic. Villagers go to Upazila Health Complex for medical services. Assistance Help CXB (NGO) provided assistance to domestic problems up to 2010 as a project. Concern Worldwide worked on gender issue. CODEC supports pre-primary school. ACF constructed a village road. UNICEF constructed a playground and UNHCR constructed the high school office.

Data Collection Study on Regional Development in Southeastern Bangladesh Final Report
3-44
STW is commonly used Union road constructed by ACF
River used for bathing and washing Homestead vegetable garden
Primary school in village Betel leaf cultivation
Irrigated paddy field and vegetable garden Shed for betel leaf cultivation

Data Collection Study on Regional Development in Southeastern Bangladesh Final Report
3-45
Matha Bhanga Para (Teknaf Upazila) History The origin of the village dates to before British rule. 200 households live in the village now. The village is located along the seashore with hills in backside. Leader of the village is a Union Parishad Member. The village is cyclone-prone and had severe damage in 1991 and 1994. An earthquake in 2009 caused landslides that damaged arable land. The village is very peaceful and stable. Society It is a paternal society. Property of parents is inherited by sons and daughters according to Islamic law. Only 1 household is Hindu. It is common for parents to arrange marriages. Reciprocal practice is in common among villagers without money. When a villager falls into trouble, other villagers help him/her. Weddings and funerals are conducted as social events. Villagers celebrate religious events together. Villagers also work together to construct simple community infrastructure. Village meeting Villagers consult elders and Union Parishad Member when a dispute arises. There is no custom to pay money as a fee for mediation. However, if Union guards distribute a notice among stakeholders, 50 TK is required for the work. 1 to 2 mediations are held in a month on average. Villagers submit the application for mediation to Union’s Parishad Chairman when the dispute over the capacity of villagers. Village meeting is held as necessary when a village event is conducted or to maintain the peace and order in the village. 5 to 6 village meetings are held in a year on average. Development work is discussed at Union Parishad meetings. There are 7 traditional social units and each unit has Sardar selected by villagers. Natural conditions The overall geology of the area consists of Surma group, Boka Bill formation of Neogene age. Field survey identified silt stone and few sand layers mainly.
From a geographical point of view, this area consists of high hills, terrace at the base of high hills, and coastal plains. On the high hill slopes, V-shape valleys are formed.
Residential area is located in terraces and coastal plains. Socio-economy Economic activities in this village based on agriculture and fishery. In agriculture, they produce rice in rainy season. During dry season, horticulture by using stream water from hills is the main activity. For paddy cultivation, they use HYV such as BR-16, 28, 32, and 33. HYV seeds are renewed every 2–3 years. However, yield per acre is only 0.5 tons. Most of rice production is for self-consumption. For horticulture, they produce potato, bean, chili, cucumber, eggplant, tomato, lady’s finger and radish. Some parts of vegetable production are sold in local market.
Fruit production is very limited, but mango and jackfruit are mainly cultivated. Watermelon is very important as a cash crop in this area. Some households rent land in the reserved forest, and produce fruits. Banana and jackfruit are damaged by elephants sometimes.
Another important cash crop is betel leaf and nut produced in specially built sheds. Many households use 0.1–0.2 acres of land for betel leaf cultivation. Betel nut trees are planted in homesteads and harvested once in a year.

Data Collection Study on Regional Development in Southeastern Bangladesh Final Report
3-46
Because the village is located by the seashore, about 30% of households depend on fishery. Of the 30%, 10% of households have their own engine boat. Other households work in fishery.
Cattle are kept for plowing. Other domestic animals such as goats and chickens are also reared for income generation.
There is a primary school. All children go to school, but 75% graduate. Secondary school is located in a neighboring village. Not many students go on to higher education in this village.
There is no community clinic. Hospitals are also not available in this area. Villagers need to go to Teknaf for medical treatment. There is a pharmacy in the nearest market.
Most of villagers are Muslim; thus important events in village are rituals related to Islam, especially Eid festival.
Poverty Main income is from betel leaf, betel nut and watermelon. Because the scale of landholding is small, production is also limited. Monthly expenditure of standard household with 7 family members is 100,000 TK to 120,000 TK. Since they cannot cover this expenditure by agricultural products, they earn cash by day labor.
They eat mainly rice and vegetables, but fish is often available. They eat meat once a month. Houses are made with dirt walls and tin sheds. Livelihood Income source is betel leaf and nut. Villages need a lot of input to cultivate betel leaf such as fertilizers, pesticides and sheds. Profit is higher than other crops, but if there is damage from pests, prices dramatically fall. In other words, betel leaf cultivation is very high risk. Average profit from betel leaf is 100,000 TK per 0.2 acres.
Water melon is also a high profit cash crop. Villagers can earn 100,000–150,000 TK per 2 acres. Land ownership 40% of villagers are landless. Landholding of majority of villagers is less than 1 acre. Few households have more than 5 acres of land. Thus, many families depend on sharecropping. They cultivate rice during rainy season and horticulture during dry season.
20 households are involved in participatory forest programme. They rent 50 ha of land from Forestry Office, and grow trees. Infrastructure The Upazila road is neaby the village. Village road is maintained by villagers.
There is small dam made of clay at streams to collect and supply drinking and agricultural water by individual pipes. Beside the main road, there is a power line, to which 30% of villagers are connected. Safe drinking water In the village, there are ring wells, STWs and IFG (Infiltration Gallery). Households have no water supply facility; they collect water from a nearby water device. Therefore, villagers are not facing a problem to collect water. Some groundwater is saline and/or contains iron. Some private water devices have no hygienic platforms.

Data Collection Study on Regional Development in Southeastern Bangladesh Final Report
3-47
Community infrastructure Mosque and madras are established by community.
They have small water tank for horticulture farming. Irrigation system is also established by community contribution. Public services It is about 6 km to Union Parishad and about 18 km to Upazila. Villagers receive the same service as other areas like old age allowance from Union Parishad. Sub Assistant Agricultural Officer rarely comes. EPI is well conducted. There is no community clinic nearby. Villagers go to Upazila Health Complex for medical services. Assistance SHED (NGO) works on nutrition with support of CARE. BRAC supported sanitation and safe drinking water programmes, and continues pre-primary education. Union Parishad received 400,000 TK in 2009/10 from LGSP but no funding in 2011/12 so far.

Data Collection Study on Regional Development in Southeastern Bangladesh Final Report
3-48
Retaining water and pump for irrigation High school cum cyclone shelter
IFG Cultivation of betel nut trees
Water tank for betel leaf cultivation Seashore by village
Settlements on terrace Irrigated farm and fallow lands

Data Collection Study on Regional Development in Southeastern Bangladesh Final Report
3-49
3.3 Issues to be Addressed One of the most hindering constraints in CHT is hard accessibility to villages. It is very difficult to deliver public services to villagers because villagers are scattered in hilly areas. Utilization of local NGOs is one way to ensure outreach to villagers. Expanded Programme on Immunization (EPI) is well conducted in the area but other public services on safe drinking water, education, agricultural extension, and so on are very limited due to the constraints. Capacity development of Hill District Councils to overcome the constraints is needed to improve public services. Deforestation is another urgent issue. It is considered that watershed management should be introduced. Diversification and improvement of livelihoods is considered to be a key factor for sustainable development. Attention should be paid especially to villages in high land areas because the area has still little support from outside service providers. CXB has also limited accessibility to villages because it is located between hilly area and sea. EPI is well conducted in CXB too but other public services have limited outreach. However, CXB is better than CHT in terms of accessibility of government field workers to villages. Therefore, linkage between government agencies and villagers could be enhanced through Union Development Coordination Committee Meeting (UDCCM). On the other hand, rapid and uncoordinated tourism development might have some negative impact on natural resources and rich traditional society in the region, which are the most important values for tourism. Diversification and improvement of livelihoods and access to safe drinking water are considered to be one of the urgent issues in both CHT and CXB. Linkages between government agencies and villagers should be enhanced in the process of development activities.

Data Collection Study on Regional Development in Southeastern Bangladesh Final Report
3-50

Data Collection Study on Regional Development in Southeastern Bangladesh Final Report
4-1
4. Local Industry Profile
4.1 Khagrachhari 4.1.1 Agro-based Industries Agriculture
As described in the previous chapter, agriculture is the foundation of the economy in Khagrachhari. According to the interview from the Khagrachhari Hill District Council, they claimed that agriculture is the footing in developing industries in this region. Thus, we will demonstrate the features of agricultural production in Khagrachhari through statistical data and information collected by interviews. Tables 4-1, 4-2, 4-3 and 4-4 show the cultivated areas of rice1, other major crops, vegetables and fruits. As shown in Figure 4-1, comparing the rate of cultivated area in Khagrachhari to the total national area for each category, the ratios of rice cultivation is low, but comparatively higher in other major crops, vegetables and fruits. The area of land cultivated for fruits is especially remarkable. Hilly geographic feature in Khagrachhari, which may be the same in all over CHT, is the factor confineing rice cultivation which requires plain land.
Table 4-1: Area of Rice Cultivation in Khagrachhari
Local HYV Local HYV Local HYV
26,881,000 87,154 1,248 4,643 3,671 74,090 - 3,502
Aus Aman BoroKagrachari Cultivated Area
National Cultivated Area
Source: Yearbook of Agricultural Statistics of Bangladesh-2010
Table 4-2: Area of Other Major Crop Cultivation in Khagrachhari
National Cultivated Area
Kagrachari Cultivated Area Maiz Til Tarmaric Ginger Rabi Chili
711,792 8,177 422 238 4,713 2,145 659 Source: Yearbook of Agricultural Statistics of Bangladesh-2010
Table 4-3: Area of Vegetable Cultivation in Khagrachhari
National Cultivated Area
Kagrachari Cultivated Area
Lady's Finger Jinga Taro
Rabi Pumbkin Tomato Beans
Sweet Potato
308,512 8,340 438 580 5,181 526 466 494 655 Source: Yearbook of Agricultural Statistics of Bangladesh-2010
Table 4-4: Area of Fruits Cultivation in Khagrachhari
National Cultivated Area
Kagrachari Cultivated Area Banana Pinapple Mango Papaya Jackfruit
Wood Apple
2,364,530 88,780 3,775 1,695 2,164 1,951 77,994 1,201 Source: Yearbook of Agricultural Statistics of Bangladesh-2010
1 There are tree types of rice cultivation in Bangladesh, namely Aman and Aus in rainy season and Boro in dryseason.

Data Collection Study on Regional Development in Southeastern Bangladesh Final Report
4-2
0.00%
0.50%
1.00%
1.50%
2.00%
2.50%
3.00%
3.50%
4.00%
RiceCultivation
OtherMajorCrops
Vegetable Fruits
% in NationalCultivated Area
Source: Yearbook of Agricultural Statistics of Bangladesh-2010
Figure 4-1: Ratio of Selected Items’ Cultivated Area to National Cultivated Area
Figure 4-2 demonstrates ratio of crop categories at the national level and in Khagrachhari. It shows only selected items, so does not describe comprehensive characteristics of cultivation patterns. However, it can give us an idea about basic features of the cropping pattern in Khagrachhari. For example, at the national level, it is clear that rice cultivation occupy extremely high rate in the cultivation area; meanwhile, rice cultivation is only 45%, and fruits account for about the same ratio as rice in Khagrachhari.
89%
2% 1%8%
National
Rice Cultivation
Other MajorCrops
Vegetable
Fruits
45%
4%5%
46%
Khagrachari
Rice Cultivation
Other MajorCrops
Vegetable
Fruits
Source: Produced by research team based on Yearbook of Agricultural Statistics of Bangladesh-2010
Figure 4-2: Ratio of Cultivated Area of Main Crops
Tables shown below are to compare productivities of selected crops. Table 4-5 shows the productivity of different types and varieties of rice in Khagrachhari and at the national level. Though cultivated area is smaller than national average, productivities are approximately the same as the national level.

Data Collection Study on Regional Development in Southeastern Bangladesh Final Report
4-3
Table 4-5: Productivity and Cultivated Area of Rice in Khagrachhari District Rice Variety Item 2008/09 2009/10 National (2009/10
Area (acre) 1,380 1,248 832,230Production (ton) 771 668 393,434Yield (ton/acre) 0.6 0.5 0.5Area (acre) 5,060 4,643 1,599,462Production (ton) 4,093 3,714 1,315,693Yield (ton/acre) 0.8 0.8 0.8Area (acre) 3,270 3,671 3,494,580Production (ton) 2,704 2,741 2,236,737Yield (ton/acre) 0.8 0.7 0.6Area (acre) 69,250 74,090 9,323,203Production (ton) 73,231 84,461 9,403,633Yield (ton/acre) 1.1 1.1 1.0Area (acre) - - 265,220Production (ton) - - 214,550Yield (ton/acre) - - 0.8Area (acre) 3,264 3,502 9,671,268Production (ton) 5,054 5,800 14,622,485Yield (ton/acre) 1.5 1.7 1.5
Local
HYV
Aus
AmonKhagrachari
Local
HYV
Local
HYV
Boro
Source: Yearbook of Agricultural Statistics of Bangladesh-2010 Table 4-6 indicates productivities of other major crops. Although other major crops are cultivated mainly as cash crops, its productivities are lower than the national level. For instance, productivity of maize and til (sesame) are about half of the national average productivity. Chili and ginger are widely produced in Khagrachhari and among the main income source for farmers, but the productions per acre are less than national average. Turmeric is a major cash crop in CHT, and it is produced in the especially hill slopes where tribal people live. The table shows high productivity of turmeric compared to the national average though it is produced with little or without input such as fertilizer and pesticide.
Table 4-6: Productivities of Other Major Crops in Khagrachhari
Name of Crops Items 2008/09 2009/10National (2009/10)
Area (acre) 397 422 375,628Production (ton) 380 411 887,391Yield (ton/acre) 0.96 0.97 2.36Area (acre) 253 238 87,850Production (ton) 57 46 32,306Yield (ton/acre) 0.23 0.19 0.37Area (acre) 4,570 4,713 56,203Production (ton) 13,408 14,010 117,081Yield (ton/acre) 2.93 2.97 2.08Area (acre) 2,071 2,145 22,403Production (ton) 5,741 6,316 74,841Yield (ton/acre) 2.77 2.94 3.34Area (acre) 665 659 169,708Production (ton) 206 206 90,042Yield (ton/acre) 0.31 0.31 0.53
Rabi Chili
Maiz
Til
Turmaric
Ginger
Source: Yearbook of Agricultural Statistics of Bangladesh-2010

Data Collection Study on Regional Development in Southeastern Bangladesh Final Report
4-4
0.00
0.50
1.00
1.50
2.00
2.50
3.00
3.50
4.00
Maiz Til Turmaric Ginger Rabi Chili
ton
Khagrachari National
Source: Yearbook of Agricultural Statistics of Bangladesh-2010
Figure 4-3: Productivities of Other Major Crops in Khagrachhari In Khagrachhari, people produce various vegetables on hill slopes by shifting cultivation. Table 4-7 shows the main vegetables cultivated in Khagrachhari. Productivity of selected vegetables is approximate to the national average, but only the yield of pumpkin produced widely throughout CHT is low.
Table 4-7: Cultivated Area and Productivities of Vegetables in Khagrachhari
Name of Vegetable Items 2008/09 2009/10National (2009/10)
Area (acre) 438 438 25,204Production (ton) 753 778 42,366Yield (ton/acre) 1.72 1.78 1.68Area (acre) 781 580 23,039Production (ton) 1,337 1,098 44,064Yield (ton/acre) 1.71 1.89 1.91Area (acre) 4,988 5,181 58,736Production (ton) 1,965 21,164 224,546Yield (ton/acre) 0.39 4.08 3.82Area (acre) 508 526 24,908Production (ton) 1,579 1,628 124,534Yield (ton/acre) 3.11 3.10 5.00Area (acre) 432 466 58,854Production (ton) 1,371 1,435 190,213Yield (ton/acre) 3.17 3.08 3.23Area (acre) 479 494 40,992Production (ton) 921 947 88,581Yield (ton/acre) 1.92 1.92 2.16Area (acre) 644 655 76,779Production (ton) 2,102 2,134 306,633Yield (ton/acre) 3.26 3.26 3.99
Beans
Sweet Potato
Lady's Finger
Jinga
Taro
Rabi Pumpkin
Tomato
Source: Yearbook of Agricultural Statistics of Bangladesh-2010

Data Collection Study on Regional Development in Southeastern Bangladesh Final Report
4-5
0.00
1.00
2.00
3.00
4.00
5.00
6.00
Lady'sFinger
Jinga Taro RabiPumpkin
Tomato Beans SweetPotato
ton
Khagrachari National
Source: Yearbook of Agricultural Statistics of Bangladesh-2010
Figure 4-4: Productivities of Vegetable in Khagrachhari and Bangladesh Banana and pineapple are major fruits grown on hill slopes in CHT. However, as shown in Table 4-8 and Figure 4-5, the yield of both banana and pineapple are much less than the national yield. Though banana is one of main income source for Khagrachhari farmers, the production does not reach even half of the national average.
Table 4-8: Productivities of Banana and Pineapple in Khagrachhari
Name of Vegetable Items 2008/09 2009/10National (2009/10)
Area (acre) 3,427 3,775 133,305Production (ton) 10,366 10,278 818,254Yield (ton/acre) 3.02 2.72 6.14Area (acre) 1,601 1,695 39,583Production (ton) 5,699 6,399 234,493Yield (ton/acre) 3.56 3.78 5.92
Banana
Pineapple
Source: Yearbook of Agricultural Statistics of Bangladesh-2010
0.00
1.00
2.00
3.00
4.00
5.00
6.00
7.00
Banana Pinapple
ton
Khagrachari National
Source: Yearbook of Agricultural Statistics of Bangladesh-2010
Figure 4-5: Yields of Banana and Pineapple in Khagrachhari

Data Collection Study on Regional Development in Southeastern Bangladesh Final Report
4-6
Comparing to banana and pineapple, the yield of other major fruits are high as shown in Table 4-9. As Figure 4-6 indicates, for example, production of jackfruit in Khagrachhari is 40% higher than national average. Though we could not observe cultivation of wood apple in CHT, it shows high productivity. Papaya’s production is almost the same as the national level, but production of mango is lower.
Table 4-9: Productivity of Other Major Fruits in Khagrachhari
2008-09 2009-10 2008-09 2009-10Khagrachari 651 839 25 26National 76,715 79,066 67 81Khagrachari 105 103 16 18National 2,750 2,790 23 20Khagrachari 2,673 2,719 219 228National 22,814 25,166 138 135Khagrachari N/A N/A 44 73National 220 177 52 51
Fruit
Area Under Garden(acre)
Average Yield Per Fruit Bearing Tree (kg)
Mango
Papaya
Jackfruit
Wood Apple
Source: Yearbook of Agricultural Statistics of Bangladesh-2010
0
50
100
150
200
250
Mango Papaya Jackfruit Wood Apple
kg
Khagrachari National
Source: Yearbook of Agricultural Statistics of Bangladesh-2010
Figure 4-6: Productivity of Other Major Fruits Table 4-10 shows the extension activities by the Department of Agriculture Extension (DAE). It mainly conducts activities for the extension of improved varieties. According to the field visit to the rural area, it is assumed that extension services do not reach to remote areas.
Table 4-10: Projects in DAE Office Name Duration Budget Activities Dept of Agriculture Extension (DAE)
Improved seed of Rice, Wheat and Jute, production, Storage & distribution project at farmers level.
2011–2012 - Demonstration of seeds in different upazila. Seed preservation
Mix fruit garden 2004– - Distribution of fruits grafting sapling
Source: Interview with DAE

Data Collection Study on Regional Development in Southeastern Bangladesh Final Report
4-7
Livestock
According to the hearing from the Department of Livestock (DoL) in Khagrachhari, it has advantage in livestock as follows: (1) long term cool weather which prevents livestock from diseases, (2) preferable soil and rain fall for fodder production, (3) less infectious diseases due to scattered settlement. Though it has advantages mentioned above, livestock production is very low as shown in Table 4-11. One of the challenges for DoL in Khagrachhari is lack of mobility to outreach remote areas. In order to overcome the difficulty, they propose to set up a livestock service center where vetenarians can provide services such as diagnosis, vaccine, artificial insemination and extension of new varieties. Since approximately 80% of animal products consumed in Khagrachhari are imported from out of district, there is good opportunity for producing meats and milk in Khagrachhari.
Table 4-11: Rate of Animal Production in Khagrachhari to National Production Livestock Use of Livestock Khagrachhuri National Share
Commercial 2,241 194,154 1.15%Subsistance 187,231 24,941,184 0.75%
Total 189,472 25,135,338 0.75%Commercial 12,587 881,507 1.43%Subsistance 142,085 16,577,554 0.86%
Total 154,672 17,459,061 0.89%Commercial 147,003 21,809,649 0.67%Subsistance 1,176,011 166,588,650 0.71%
Total 1,323,014 188,398,299 0.70%Commercial 815 115,410 0.71%Subsistance 27,245 10,764,513 0.25%
Total 28,060 10,879,923 0.26%
Cattle & Buffaloes
Goats & Sheep
Fowls & Ducks
Pigeons
Source: Yearbook of Agricultural Statistics of Bangladesh-2010
Fishery
As it will be explained in the next chapter, CHT has lack of water resource in general. Thus, this area has less opportunity for fishery. As is shown in Table 4-12, fish production in Kagrachhari is small and only of beel. According to field level observation, it is said that there are some fish culture in small ponds for self-consumption.
Table 4-12: Fish Production by Water Bodies in Khagrachhari (ton)
Kagrachhari NationalRiver N/A 138,016Beel 10 79,200Flood Land N/A 879,513Pond N/A 912,178Baor N/A 5,038Shrimp Farm N/A 145,585Total 10 2,159,530 Source: Yearbook of Agricultural Statistics of Bangladesh-2010

Data Collection Study on Regional Development in Southeastern Bangladesh Final Report
4-8
Forestry
Rubber tree and teak plantation can be observed on road side hill slope in Khagrachhari. Some areas of state forest are leased out for plantation, but basically managed by the Department of Forest. As it is shown in Table 4-13, area of forest in Khagrachhari accounts for 8.63% of the total forest area2. The forest in Khagrachhari mainly categorized as Un-classified state forest (USF) shares a quarter of total USF. Although there are a lot of potentials in forestry in Khagrachhari, there are obstacles to develop this sector due to the land issue.
Table 4-13: Area of Forest by Type and Share of Khagrachhari
Type of Forest Khagrachhari National Share of
Khagrachhari Protected Forest (20th Ammendment) 88,492.83 3,020,047.88 2.93% Protected Forest (4 & 6th Ammendment) 7,342.67 1,457,171.47 0.50% Reserved Forest 0.00 91,381.89 0.00% Acquired Forest 0.00 20,848.40 0.00% Vested Forest 0.00 9,491.97 0.00% Un-classfied Forest 4,202.76 42,847.51 9.81% Total Forest Area Controled by Forestry Dept. 100,038.26 4,641,789.12 2.16% Un-classfied State Forest 454,077.95 1,716,609.32 26.45% Khas Forest Area 0.00 59,510.84 0.00%
Total Forest Area 554,116.21 6,417,909.28 8.63% Source: Yearbook of Agricultural Statistics of Bangladesh-2010
16% 1%1%
82%
Khagrachari
Protected Forest(20th Ammendment)
Protected Forest(4 & 6thAmmendment)
Un-classfied Forest
Un-classfied StateForest
Source: Yearbook of Agricultural Statistics of Bangladesh-2010
Figure 4-7: Ratio of Forest by Type in Khagrachhari
2 Types of forest are described in page 2-2.

Data Collection Study on Regional Development in Southeastern Bangladesh Final Report
4-9
47%
23%
1%
0%0%
1%
27%
1%
National
Protected Forest(20th Ammendment)
Protected Forest(4 & 6th Ammendment)
Reserved Forest
Acquired Forest
Vested Forest
Un-classfied Forest
Un-classfied State Forest
Source: Yearbook of Agricultural Statistics of Bangladesh-2010
Figure 4-8: Ratio of Forest by Type in Bangladesh 4.1.2 Particularity of Local Industries in Khagrachhari As we have described above, agriculture is the foundation of local industries in Khagrachhari, and it has high potential in horticulture and fruit gardening on hill slopes. Animal production is still limited, but development of livestock production to acquire a share of the local market will be worthwhile. Potential of fishery is minimal due to lack of water bodies. Only in the context of watershed management, fish culture will be possible to develop. Deforestation will be an urgent challenge in forestry sector. Though Khagrachhari has a large forest area, there are historical, political and administrative issues related to land, so we need a long term perspective for development of forestry in this area. 4.2 Rangamati 4.2.1 Agro-based Industries Agriculture
Historically and geographically, Rangamati has been a focal point in CHT. Thus, industrial investment was flung into the district by governments such as Kaptai Dam, paper mill and so on. Due to the Kaptai Lake which occupies most of Rangamati, fishery should be considered as having high potential. We will describe the situation of these industries, yet we again start from agriculture, because it is still the foundation of income source for many people in Rangamati. Tables 4-14, 4-15, 4-16 and 4-17 show cultivated area of rice, other major crops, vegetable and fruits. As we have already seen in Khagrachhari, rice cultivation is very minimal, and other major crops, vegetable and fruits cultivation are the main crops in Rangamati. In Rangamati, cultivated area of other major crops such as maize, til and turmeric are larger than vegetables. On the other hand, the ratio of cultivate area of selected fruits to the national total is highest in the southeastern region (see Figure 4-9).
Table 4-14: Cultivated Area of Rice in Rangamati
Local HYV Local HYV Local HYV
26,881,000 45,394 11,652 3,466 831 23,091 - 6,354
Aus Aman BoroRangamati Cultivated Area
National Cultivated Area
Source: Yearbook of Agricultural Statistics of Bangladesh-2010

Data Collection Study on Regional Development in Southeastern Bangladesh Final Report
4-10
Table 4-15: Cultivated Area of Other Major Crops in Rangamati
National Cultivated Area
Rangamati Cultivated Area Maiz Til Tarmaric Ginger Rabi Chili
711,792 14,981 693 3,489 5,949 3,671 1,179 Source: Yearbook of Agricultural Statistics of Bangladesh-2010
Table 4-16: Cultivated Area of Vegetable in Rangamati
National Cultivated Area
Rangamati Cultivated Area
Lady's Finger Jinga Taro
Rabi Pumbkin Tomato Beans
Sweet Potato
308,512 5,144 421 755 1,774 598 545 584 467 Source: Yearbook of Agricultural Statistics of Bangladesh-2010
Table 4-17: Cultivated Area of Fruits in Rangamati
National Cultivated Area
Rangamati Cultivated Area Banana Pinapple Mango Papaya Jackfruit
Wood Apple
2,364,530 95,772 9,305 3,157 2,164 1,951 77,994 1,201 Source: Yearbook of Agricultural Statistics of Bangladesh-2010
0.00%0.50%1.00%1.50%2.00%2.50%3.00%3.50%4.00%4.50%
RiceCultivation
OtherMajorCrops
Vegetable Fruits
% in NationalCultivated Area
Source: Yearbook of Agricultural Statistics of Bangladesh-2010
Figure 4-9: Ratio of Major Crops of Rangamati in National Cultivated Area As we have seen in Khagrachhari, rice cultivation area accounts for almost 90% of selected crops; meanwhile, fruits occupy 60% in Rangamati (Figure 4-10), and rice cultivation accounts for only 28%. Comparing with Khagrachhari, cultivable land for rice is more limited due to Kaptai lake and hills.

Data Collection Study on Regional Development in Southeastern Bangladesh Final Report
4-11
28%
9%
3%
60%
Rangamati
Rice Cultivation
Other MajorCrops
Vegetable
Fruits 89%
2% 1%8%
National
Rice Cultivation
Other MajorCrops
Vegetable
Fruits
Source: Yearbook of Agricultural Statistics of Bangladesh-2010
Figure 4-10: Ratio of Cultivated Area of Major Crops in Rangamati and Bangladesh
Though area of rice cultivation is extremely limited, productivity of rice is normal except local variety of aus rice. In spite of low productivity, area of local aus cultivation is four times larger than HYV cultivation in Rangamati.
Table 4-18: Productivity and Cultivated Area of Rice in RangamatiDistrict Rice Variety Item 2008/09 2009/10 National (2009/10
Area (acre) 12,845 11,652 832,230Production (ton) 7,063 6,363 393,434Yield (ton/acre) 1.82 1.83 2.12Area (acre) 3,500 3,466 1,599,462Production (ton) 2,902 2,840 1,315,693Yield (ton/acre) 1.21 1.22 1.22Area (acre) 750 831 3,494,580Production (ton) 601 610 2,236,737Yield (ton/acre) 1.25 1.36 1.56Area (acre) 23,325 23,091 9,323,203Production (ton) 21,732 24,927 9,403,633Yield (ton/acre) 1.07 0.93 0.99Area (acre) - - 265,220Production (ton) - - 214,550Yield (ton/acre) - - 1.24Area (acre) 6,209 6,354 9,671,268Production (ton) 11,380 12,174 14,622,485Yield (ton/acre) 0.55 0.52 0.66
Local
HYV
Aus
AmonRangamati
Local
HYV
Local
HYV
Boro
Source: Yearbook of Agricultural Statistics of Bangladesh-2010
Other major crops are the source of income for majority of the communities, yet the productivities of many crops are comparatively low. Ginger is the only crop whose productivity is higher than national standard (see, Table 4-19). Turmeric is one of the cash crops widely cultivated in CHT; yet, its production is about 20% lower than national average.

Data Collection Study on Regional Development in Southeastern Bangladesh Final Report
4-12
Table 4-19: Productivity and Cultivated Area of Other Major Crops in Rangamati
Name of Crops Items 2008/09 2009/10National (2009/10)
Area (acre) 1,491 693 375,628Production (ton) 1,442 706 887,391Yield (ton/acre) 0.97 1.02 2.36Area (acre) 3,538 3,489 87,850Production (ton) 956 945 32,306Yield (ton/acre) 0.27 0.27 0.37Area (acre) 5,852 5,949 56,203Production (ton) 9,041 9,187 117,081Yield (ton/acre) 1.54 1.54 2.08Area (acre) 3,600 3,671 22,403Production (ton) 15,628 15,588 74,841Yield (ton/acre) 4.34 4.25 3.34Area (acre) 1,192 1,179 169,708Production (ton) 592 595 90,042Yield (ton/acre) 0.50 0.50 0.53
Rabi Chili
Maiz
Til
Turmeric
Ginger
Source: Yearbook of Agricultural Statistics of Bangladesh-2010
0.000.501.001.502.002.503.003.504.004.50
Maiz Til Turmaric Ginger Rabi Chili
ton
Rangamati National
Source: Yearbook of Agricultural Statistics of Bangladesh-2010
Figure 4-11: Productivity of Major Crops in Rangamati

Data Collection Study on Regional Development in Southeastern Bangladesh Final Report
4-13
Table 4-20: Productivity and Cultivated Area of Vegetable in Rangamati
Name of Vegetable Items 2008/09 2009/10National (2009/10)
Area (acre) 411 421 25,204Production (ton) 586 594 42,366Yield (ton/acre) 1.43 1.41 1.68Area (acre) 736 755 23,039Production (ton) 1,284 1,340 44,064Yield (ton/acre) 1.74 1.77 1.91Area (acre) 1774.00 1774.00 58,736Production (ton) 4988.00 3580.00 224,546Yield (ton/acre) 2.81 2.02 3.82Area (acre) 590.00 598.00 24,908Production (ton) 1938.00 1968.00 124,534Yield (ton/acre) 3.28 3.29 5.00Area (acre) 557.00 545.00 58,854Production (ton) 1189.00 1062.00 190,213Yield (ton/acre) 2.13 1.95 3.23Area (acre) 574.00 584.00 40,992Production (ton) 860.00 839.00 88,581Yield (ton/acre) 1.50 1.44 2.16Area (acre) 530.00 467.00 76,779Production (ton) 1863.00 1676.00 306,633Yield (ton/acre) 3.52 3.59 3.99
Beans
Sweet Potato
Lady's Finger
Jinga
Taro
Rabi Pumpkin
Tomato
Source: Yearbook of Agricultural Statistics of Bangladesh-2010
According to the interviews from communities, vegetables are produced mainly for self-consumption, or sale inside of communities, and surplus of vegetables are minimal income source. Cultivated area of vegetables accounts for high ratio in Rangamati; however, as shown in Table 4-12, productivity of vegetable is lower than national standard. In particular, the yield of taro and pumpkin are a half or one third of national productivity.
0.00
1.00
2.00
3.00
4.00
5.00
6.00
Lady'sFinger
Jinga Taro RabiPumpkin
Tomato Beans SweetPotato
ton
Rangamati National
Source: Yearbook of Agricultural Statistics of Bangladesh-2010
Figure 4-12: Yield of Vegetables in Rangamati

Data Collection Study on Regional Development in Southeastern Bangladesh Final Report
4-14
As is mentioned above, fruit has the highest ratio in the cultivated area in Rangamati. Moreover, fruit also shows comparatively high productivity rate in Rangamati. As is demonstrated in Table 4-21 and Figure 4-13, pineapple, papaya, jackfruit and wood apple is higher in productivity than national productions. Banana and mango's productivity is lower than national level as it was in Khagrachhari.
Table 4-21: Productivity of Banana and Pineapple
Name of Vegetable Items 2008/09 2009/10National (2009/10)
Area (acre) 9,110 9,305 133,305Production (ton) 44,562 40,874 818,254Yield (ton/acre) 4.89 4.39 6.14Area (acre) 3,133 3,157 39,583Production (ton) 22,087 22,209 234,493Yield (ton/acre) 7.05 7.03 5.92
Banana
Pinapple
Source: Yearbook of Agricultural Statistics of Bangladesh-2010
0.001.002.003.004.005.006.007.008.00
Banana Pinapple
ton
Rangamati National
Source: Yearbook of Agricultural Statistics of Bangladesh-2010
Figure 4-13: Productivity of Banana and Pineapple in Rangamati
Table 4-22: Productivity and Cultivated Area of Other Fruits in Rangamati
2008-09 2009-10 2008-09 2009-10Rangamati 332 478 52 63National 76,715 79,066 67 81Rangamati 140 147 20 26National 2,750 2,790 23 20Rangamati 1,055 1,388 203 220National 22,814 25,166 138 135Rangamati 12 9 58 62National 220 177 52 51
Fruit
Area Under Garden(acre)
Average Yield Per Fruit Bearing Tree (kg)
Mango
Papaya
Jackfruit
Wood Apple
Source: Yearbook of Agricultural Statistics of Bangladesh-2010

Data Collection Study on Regional Development in Southeastern Bangladesh Final Report
4-15
0
50
100
150
200
250
Mango Papaya Jackfruit Wood Apple
kg
Rangamati National
Source: Yearbook of Agricultural Statistics of Bangladesh-2010
Figure 4-14: Productivity of Fruits in Rangamati Table 4-23 shows project implemented by Department of Agriculture Extension. The contents of projects are mainly extension of improved varieties.
Table 4-23: Projects in DAE
No. Name Duration Budget Activities
1 Improved seed production, storage & distribution project at farm level
5 years (Extended) 360,000 240 demonstration farms (BRRI Dhan-28=220, BRRI Dhan-50= 20)
Source: Interview to officer in Dept. of Agricultural Extension Livestock
There is not much commercial production in the livestock sector. As can be seen in Table 4-24, commercial production is high in cattle and buffaloes, but quite low in other productions. It was also observed in communities in Rangamati that people rear animals basically for self-consumption, or community level sale and exchange.
Table 4-24: Numbers and Ratio of Livestock Production in Rangamati
Livestock Use of Livestock Rangamati National ShareCommercial 6,103 194,154 3.14%Subsistance 137,927 24,941,184 0.55%
Total 144,030 25,135,338 0.57%Commercial 11,226 881,507 1.27%Subsistance 125,458 16,577,554 0.76%
Total 136,684 17,459,061 0.78%Commercial 34,290 21,809,649 0.16%Subsistance 987,086 166,588,650 0.59%
Total 1,021,376 188,398,299 0.54%Commercial 0 115,410 0.00%Subsistance 16,230 10,764,513 0.15%
Total 16,230 10,879,923 0.15%
Cattle & Buffaloes
Goats & Sheep
Fowls & Ducks
Pigeons
Source: Yearbook of Agricultural Statistics of Bangladesh-2010

Data Collection Study on Regional Development in Southeastern Bangladesh Final Report
4-16
Table 4-25: Summary of Projects in DoL No. Name of Project Duration Budget Activities
1
a) Poverty alleviation through self employment (Phase-I) Continuous
BDT 1,141,500 Providing Loan for livestock activities
b) Poverty alleviation through self employment (Phase-II) BDT 1,579,001 Training on cow rearing for
self employment
2
a) Micro credit activities to alleviate poverty (Goat) Continuous
BDT 3,300,000 Providing Loan for livestock activities
b) Micro credit program to alleviate poverty (Goat) BDT 510,001 Training on cow rearing for
self employment
3
a) Breed up gradation through Progeny test Project (Phase-I) Continuous
BDT 38,750 Providing Loan for livestock activities
b) Breed upgradation through Progeny test Project (Phase-II) BDT 74,749 Training on cow rearing for
self employment
4 Anti-septic spray program for the Livestock, Poultry and Duck Continuous BDT 74,750 Training on spray
5 Training program at the Union level about Livestock, Poultry and Duck Continuous BDT 543,500 Training on Poultry
6 Artificial breeding extension and transplant technology of fetus implementation project (Phase-II)
Continuous BDT 90,000 Training and Loan for livestock
7 Bird flu surveillance activities project Continuous - Collect bird flue sample and
test Source: Interview with Department of Livestock As is described in Table 4-25, various projects are implemented by DoL. Main activities are training programs with loan for poverty reduction, introduction of new varieties, and livestock management. Fishery
Fish production by water bodies is shown in Table 4-26.
Table 4-26: Fish Production by Water Bodies
(unit: ton)
Rangamati NationalRiver N/A 138,016Beel 29 79,200Kaptai 8,590 8,590Flood Land N/A 879,513Pond N/A 912,178Baor N/A 5,038Shrimp Farm N/A 145,585Total 8,619 2,168,120
Source: Yearbook of Agricultural Statistics of Bangladesh-2010 Annual fish catchment in Rangamati is not to be compared with catchment in Khagrachhari and Bandarban, though contribution to national catchment is only 0.4%. Fish catch of Kaptai in 2011 was about 9,000 tonnes, which values about 67,500,000TK. 5% of the value is paid as tax to the Bangladesh Fish Development Corporation (BFDC). Local consumption is about 1,000 tonnes, and the rest of them are sold in Chittagong. The Department of Fishery (DoF) implements a project titled “Fish Production Conservation and Management Project in Kaptai Lake” from 2011 to 2013. In this project, BFDC, Fish Research Institute, Rangamati Fishery Office conduct activities such as enforcement of fishery law (Fish Act), establishment of

Data Collection Study on Regional Development in Southeastern Bangladesh Final Report
4-17
training centers, promotion of fish nursery, and so on. Other projects implemented by the Rangamati Fishery Office are as mentioned in Table 4-27.
Table 4-27: Projects in Fishery Office in Rangamati
Office Name Duration Budget Activities
1 Poverty reduction program in fisheries sector by providing micro credit
Continuous 484,000 Providing loan for fishery
2 Poverty reduction program by integrated fisheries activities
Continuous 5,116,993 Providing loan for fishery
Conducting awareness program
Conducting mobile court for fish protection.
Conducting training to the fishermen
Preservation of native species fish finger lings
Cultivation of fish fingerlings in nursery
Fish fingerlings breeding
Establishment of training center
Conducting training
Fish act implementation by mobile court
5
4
3
Strengthening of production, preservation and management of fisheries growth in Kaptai lake – component B
- -
Awareness program on using formalin and controlled formalin - -
Identified water body development and management - -
Source: Interview with Fishery Office The Fishery Office promotes fish culture in creek in which water is stored by small dam in Rangamati. The Engineering Department in the Fishery Office supports the community to establish creek dam which costsabout 300,000 to 500,000TK. Then, the Fishery Office provides fish fries and training for fish cultivation for communities. 287 creek dams with 131.79 ha of water bodies have already been established. It is estimated that there are 4,727 potential creeks in Rangamati. It is said that there is high potential in creek dam development in the hill areas, but accessibility is among the crucial challenges for providing government services. Forestry
Forest in Bangladesh is geographically categorized into nine units, and Forestry Offices in different districts implement projects according to the categories. Khagrachhari, Rangamati and some part of Bandarban are included in one circle. The rest of Bandarban forest belongs to the Chittagong circle. The Head of Circle is Conservator of Forest. There are six divisions controlled by Divisional Forest Officers who is under the Conservator of Forest. 59 Range Officers in total work in six divisions in Rangamati. The main responsibility of the Forestry Office is to manage protected forest and reserved forest. Field level activities are managed by the Range Office. Permission for logging should be given by the Forestry Office according to the CHT Forest Transit Rule in 1973. Un-classified Forests are supposed to be controlled by HDC, but it is still managed by the Deputy Commissioner Office. There are some ongoing national projects implemented in CHT such as Agar Plantation Project (from 2010 to 2015) and Bamboo Cane Project. Social Forestry Program had started in 2008, but it was suspended. Challenge in forestry is the same as in Khagrachhari. Timber

Data Collection Study on Regional Development in Southeastern Bangladesh Final Report
4-18
production in Rangamati is 200,000 cubic feet (CFT) per month. Table 4-28 shows area of forest by types. As it is clear in Figures 4-15 and 4-16, the ratio of Protected Forest (20th Amendment) and Un-classified State Forest (USF) are the major forest types in Rangamati. The total forest area in Rangamati accounts for 21.73% of the total Bangladeshi forest.
Table 4-28: Ratio of Forest by Type in Rangamati
Production Rangamati National Share of
Rangamati Protected Forest (20th Ammendment) 573,265.2 3,020,047.9 18.98% Protected Forest (4 & 6th Ammendment) 57,127.7 1,457,171.5 3.92% Reserved Forest 0.0 91,381.9 0.00% Acquired Forest 1.5 20,848.4 0.01% Vested Forest 0.0 9,492.0 0.00% Un-classfied Forest 0.0 42,847.5 0.00%
Total Forest Area Controled by Forestry Dept. 630,394.4 4,641,789.12 13.58% Un-classfied State Forest 763,890.5 1,716,609.32 44.50% Khas Forest Area 21.5 59,510.84 0.04%
Total Forest Area 1,394,306.4 6,417,909.3 21.73% Source: Yearbook of Agricultural Statistics of Bangladesh-2010
41%
4%0%
55%
RangamatiProtected Forest(20th Ammendment)
Protected Forest(4 & 6thAmmendment)
Un-classfied Forest
Un-classfied StateForest
Source: Yearbook of Agricultural Statistics of Bangladesh-2010
Figure 4-15: Ratio of Forest by Type in Rangamati
47%
23%
1%
0%0%
1%
27%
1%
National
Protected Forest(20th Ammendment)
Protected Forest(4 & 6th Ammendment)
Reserved Forest
Acquired Forest
Vested Forest
Un-classfied Forest
Un-classfied State Forest
Source: Yearbook of Agricultural Statistics of Bangladesh-2010
Figure 4-16: Ratio of Forest by Type in Bangladesh

Data Collection Study on Regional Development in Southeastern Bangladesh Final Report
4-19
According to the hearing from members of the Timber Merchant Association, it started with about 50 members in 1991. Income of the association is membership fee of 50TK per month, and donation from timber merchants, which is 1,000TK per timbers of one truck. The association also provides services to members such as advice on forestry law, loan, and selection of recipients of sapling from the Forestry Office, and so on. Legal logging in Rangamati is about 250,000CFT per month. Timbers are wholesaled in Dhaka. The price of 1CFT is sold at 500TK by timber producers, and it is sold at 2,000TK by wholesaler in Dhaka. There is no specific project that the association is involved in. It purchased 100 acre of land from local headman, but they have not yet started activities due to lack of funds. 4.2.2 Cottage Industry Textile weaving is very common in tribal society. It is practiced at the household level. It is said that some amount of traditional textile are sold in market especially to tourists, but it is very limited because producers do not have institutional or organizational establishment and marketing system. We describe challenges and opportunities for the cottage industry with findings collected from a women’s group. According to the interview to a women’s association named Pani Purbo Mohira Samity, they started their group activities based on micro-finance. Initially, it was a self-organized association. Because the NGO which had been supporting them by micro-finance received funds from UNDP to develop the cottage industry, the association was reorganized as a women’s group for textile development. They received 50,000TK to start production of textile. The NGO provided training on business management. They have 50 members who are able to produce traditional textile, and 30 members received weaving materials, and regularly produce textile. Profit from one set of traditional textile is 500 to 4,500TK. Usually one person can produce 4 sets of textile per month. They said that it is necessary to produce textile with new design because what they can produce is only traditional dress which would not be used by the majority of Bangladeshi and tourists. They usually sell their product in cultural events held 1 or 2 times per year; otherwise they sell it through personal network. Thus, marketing is one of the essential challenges for the women’s group. Sericulture
A branch of Bangladesh Sericulture Research and Training Institute (BSRTI) is in Rangamati. Rangamati BSRTI is a sub-station of BSRTI in the Rajshahi district. The main objective of the institute is to develop and promote new sericulture technology. The project, titled “Project on Sericulture Research and Technology Dissemination in Hilly Area” started in 2009, and will end in 2012. In this project, they developed high yielding silk warm variety, which can produce about 5 time larger amount of silk than the norm. They also introduced a new variety of mulberry which can produce three times as large amount of feed for silk warm than normal mulberry. Silk production is based on household level, so BSRTI supplies 500 farmers with improved silk warm. They also buy cocoon from farmers, and wholesale to the Sericulture Board in Rajshahi. Total national supply of cocoon is only 30 to 80 tonnes; while the demand is 300 tonnes. The demand is supplemented by import from China and Vietnam so far. Since the quality of cocoon produced in Rangamati is better than import products, multiplication of production is among the challenges for sericulture development. Paper Mill
According to the interview from a representative of Karnaphuli Paper Mill, the mill is under the Ministry of Industry, and one of the companies supervised by the Bangladesh Chemical Industry Corporation (BCIC). The Chairman of the Company is Additional Secretary deputed by central government. The total number of employees is 1,602 which consist of 182 officers, 562 staffs and 858 workers. They use pulp timber and bamboo for paper production. The

Data Collection Study on Regional Development in Southeastern Bangladesh Final Report
4-20
ratio of pulp tree and bamboo is 70% and 30% respectively. Production per day is 100 tonnes, and annual targeted production is 25,000 tonnes. Recently, the number of private companies is increasing. 50 to 60 companies exist at present, and paper supply does not meet the demand yet. Price of paper produce by private companies is about 80,000TK per ton, but Karnaphuli paper mill sells at 85,000TK per ton. They sell paper to government organization and educational institutions exclusively. One of the problems is shortage of pulp tree. The company has rented 1,000 acres of forest land for 99 years from the Forestry Office, but the land area was occupied by jhum cultivators. In order to secure raw material for paper production, they had tried to produce jute paper, but it is still not practical. They know about paper production with eichhornia crassipes, but had never thought of trial for paper production. Another challenge is the lack of skilled labor. Due to lack of funds, they are not able to recruit young workers and train them. 4.2.3 Particularity of Local Industries in Rangamati Rangamati has several options for industrial development due to its geographic and economic position in CHT. The biggest lake in Bangladesh, for example, provides fish resources. As we have described above, sericulture is also one of the industries with opportunities. Since there is chance to acquire a share in the national market, multiplication of cocoon production is expected. The majority of producers are local farmers, thus, it is also expected to support income generation. Since most of the people actually depend on agricultural production in Rangamati, agriculture development should still be the footing of local industry. This area is not very good in producing rice, but strong in fruits production. Challenges in fruits production are marketing and improvement of production. 4.3 Bandarban 4.3.1 Agro-based Industries Agriculture
Local industries in Bandarban are based on agriculture as the other two districts in CHT, but geographic characteristics such as high and steep mountains exaggerate the particularity of this area. Tables 4-29, 4-30, 4-31 and 4-32 show cultivated areas of rice, other major crops, vegetable and fruits. As can be seen, rice cultivation in Bandarban is larger than other areas in CHT. Looking at the details of rice cultivation, boro cultivation is much less than that of aus and amon. It can be assumed that there is difficulty in securing water for rice cultivation especially during dry season in this area. It was also observed during field visits in the Bandarban community (see community profiles). Other major crop and vegetable cultivation are larger than rice cultivation. These products are cultivated especially on hill slopes. Taro cultivation in vegetable and cultivation area of jackfruit are outstanding in Bandarban.
Table 4-29: Cultivated Area for Rice in Bandarban
Local HYV Local HYV Local HYV
26,881,000 39,931 14,470 4,408 1,486 19,307 21 260
Aus Aman BoroKagrachari Cultivated Area
National Cultivated Area
Source: Yearbook of Agricultural Statistics of Bangladesh-2010

Data Collection Study on Regional Development in Southeastern Bangladesh Final Report
4-21
Table 4-30: Cultivated Area of Other Major Crops in Bandarban
National Cultivated Area
Bandarban Cultivated Area Maiz Til Tarmaric Ginger Rabi Chili
711,792 5,280 343 1,182 1,703 1,334 718Source: Yearbook of Agricultural Statistics of Bangladesh-2010
Table 4-31: Cultivated Area of Vegetable in Bandarban
National Cultivated Area
Bandarban Cultivated Area
Lady's Finger Jinga Taro
Rabi Pumbkin Tomato Beans
Sweet Potato
308,512 2,810 210 409 949 291 298 280 373
Source: Yearbook of Agricultural Statistics of Bangladesh-2010
Table 4-32: Cultivated Area of Fruits in Bandarban
National Cultivated Area
Bandarban Cultivated Area Banana Pinapple Mango Papaya Jackfruit
Wood Apple
2,364,530 14,589 3,201 1,493 2,300 1,694 5,705 196Source: Yearbook of Agricultural Statistics of Bangladesh-2010
0.00%0.10%0.20%0.30%0.40%0.50%0.60%0.70%0.80%0.90%1.00%
RiceCultivation
OtherMajorCrops
Vegetable Fruits
% in NationalCultivated Area
Source: Yearbook of Agricultural Statistics of Bangladesh-2010
Figure 4-17: Ratio of Major Crops of Bandarban in National Cultivated Area
64%8%5%
23%
Bandarban
Rice Cultivation
Other MajorCrops
Vegetable
Fruits 89%
2% 1%8%
National
Rice Cultivation
Other MajorCrops
Vegetable
Fruits
Source: Yearbook of Agricultural Statistics of Bangladesh-2010
Figure 4-18: Ratio of Cultivated Area of Major Crops in Bandarban and Bangladesh

Data Collection Study on Regional Development in Southeastern Bangladesh Final Report
4-22
Table 4-33 shows that in all rice varieties, Bandarban maintains national level productivity. As is described in the community profile of Kattoripara in Bandarban, people produce HYV rice with irrigation facilities. On the other hand, in Langraipara, people could produce only jhum rice which is a local variety on hill slope. Because many parts of Bandarban are of hill slope, and people depend on the land, it should be assumed that limited number of people actually produce HYV rice on limited plain land in Bandarban.
Table 4-33: Cultivated Area and Productivity of Rice in Bandarban District Rice Variety Item 2008/09 2009/10 National (2009/10
Area (acre) 14,395 14,470 832,230Production (ton) 9,059 6,341 393,434Yield (ton/acre) 1.59 2.28 2.12Area (acre) 6,405 4,408 1,599,462Production (ton) 6,577 4,349 1,315,693Yield (ton/acre) 0.97 1.01 1.22Area (acre) 1,295 1,486 3,494,580Production (ton) 1,248 1,099 2,236,737Yield (ton/acre) 1.04 1.35 1.56Area (acre) 19,350 19,307 9,323,203Production (ton) 21,105 21,570 9,403,633Yield (ton/acre) 0.92 0.90 0.99Area (acre) 21 - 265,220Production (ton) 30 - 214,550Yield (ton/acre) 0.70 - 1.24Area (acre) 1,075 260 9,671,268Production (ton) 1,784 418 14,622,485Yield (ton/acre) 0.60 0.62 0.66
Local
HYV
Aus
AmonBandarban
Local
HYV
Local
HYV
Boro
Source: Yearbook of Agricultural Statistics of Bangladesh-2010 In terms of other major crops, there are some crops that are produced more than the national average as shown in Table 4-34. For example, productivities of til, turmeric and chili are higher than national standard; meanwhile, the production of maize is about half of the national level.
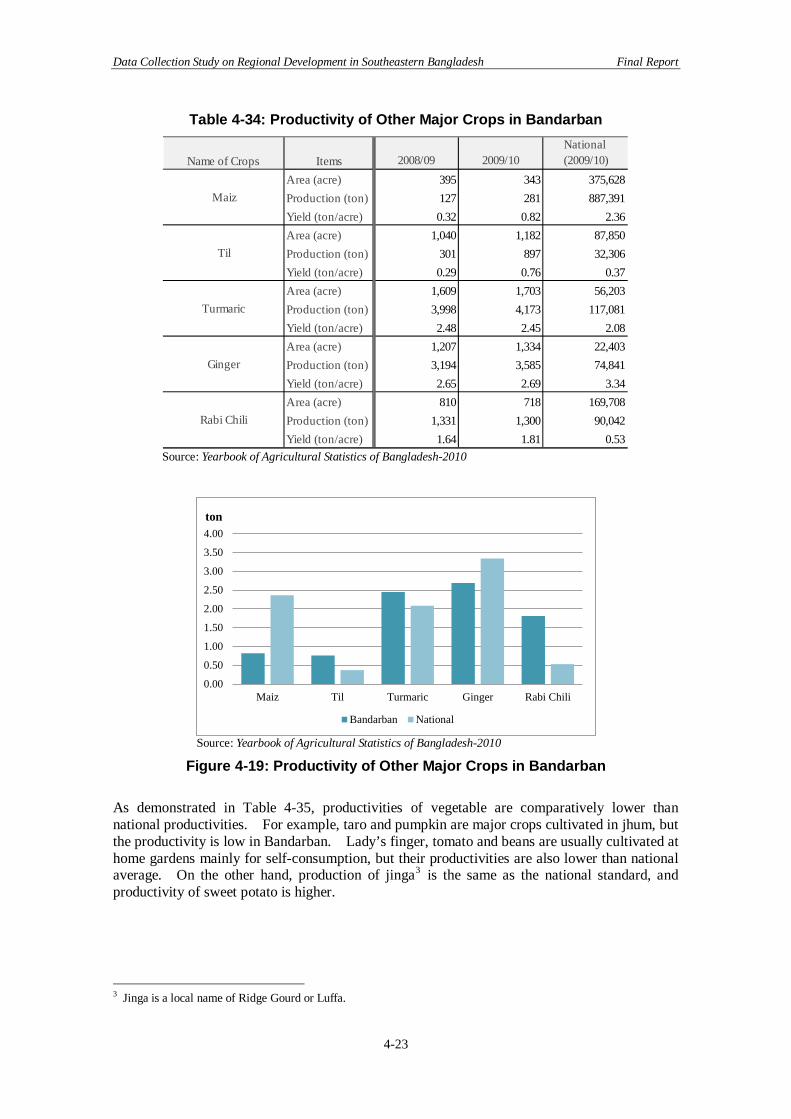
Data Collection Study on Regional Development in Southeastern Bangladesh Final Report
4-23
Table 4-34: Productivity of Other Major Crops in Bandarban
Name of Crops Items 2008/09 2009/10National (2009/10)
Area (acre) 395 343 375,628Production (ton) 127 281 887,391Yield (ton/acre) 0.32 0.82 2.36Area (acre) 1,040 1,182 87,850Production (ton) 301 897 32,306Yield (ton/acre) 0.29 0.76 0.37Area (acre) 1,609 1,703 56,203Production (ton) 3,998 4,173 117,081Yield (ton/acre) 2.48 2.45 2.08Area (acre) 1,207 1,334 22,403Production (ton) 3,194 3,585 74,841Yield (ton/acre) 2.65 2.69 3.34Area (acre) 810 718 169,708Production (ton) 1,331 1,300 90,042Yield (ton/acre) 1.64 1.81 0.53
Rabi Chili
Maiz
Til
Turmaric
Ginger
Source: Yearbook of Agricultural Statistics of Bangladesh-2010
0.00
0.50
1.00
1.50
2.00
2.50
3.00
3.50
4.00
Maiz Til Turmaric Ginger Rabi Chili
ton
Bandarban National
Source: Yearbook of Agricultural Statistics of Bangladesh-2010
Figure 4-19: Productivity of Other Major Crops in Bandarban As demonstrated in Table 4-35, productivities of vegetable are comparatively lower than national productivities. For example, taro and pumpkin are major crops cultivated in jhum, but the productivity is low in Bandarban. Lady’s finger, tomato and beans are usually cultivated at home gardens mainly for self-consumption, but their productivities are also lower than national average. On the other hand, production of jinga3 is the same as the national standard, and productivity of sweet potato is higher.
3 Jinga is a local name of Ridge Gourd or Luffa.

Data Collection Study on Regional Development in Southeastern Bangladesh Final Report
4-24
Table 4-35: Productivities of Vegetable in Bandarban
Name of Vegetable Items 2008/09 2009/10National (2009/10)
Area (acre) 203 210 25,204Production (ton) 150 159 42,366Yield (ton/acre) 0.74 0.76 1.68Area (acre) 399 409 23,039Production (ton) 779 801 44,064Yield (ton/acre) 1.95 1.96 1.91Area (acre) 858 949 58,736Production (ton) 1,724 1,808 224,546Yield (ton/acre) 2.01 1.91 3.82Area (acre) 316 291 24,908Production (ton) 798 784 124,534Yield (ton/acre) 2.53 2.69 5.00Area (acre) 310 298 58,854Production (ton) 810 794 190,213Yield (ton/acre) 2.61 2.66 3.23Area (acre) 266 280 40,992Production (ton) 281 295 88,581Yield (ton/acre) 1.06 1.05 2.16Area (acre) 354 373 76,779Production (ton) 1,723 1,748 306,633Yield (ton/acre) 4.87 4.69 3.99
Beans
Sweet Potato
Lady's Finger
Jinga
Taro
Rabi Pumpkin
Tomato
Source: Yearbook of Agricultural Statistics of Bangladesh-2010
0.00
1.00
2.00
3.00
4.00
5.00
6.00
Lady'sFinger
Jinga Taro RabiPumpkin
Tomato Beans SweetPotato
ton
Bandarban National
Source: Yearbook of Agricultural Statistics of Bangladesh-2010
Figure 4-20: Yield of Vegetable in Bandarban and Bangladesh The ratio of cultivated area of fruit in Bandarban is larger than the national level, but lower in CHT. Productivities of banana and pineapple are slightly less than the national standard (see, Table 4-36). However, as it is shown in Table 4-37, mango, papaya and wood apple are higher than the national average in its yield per tree.

Data Collection Study on Regional Development in Southeastern Bangladesh Final Report
4-25
Table 4-36: Yields of Banana and Pineapple in Bandarban
Name of Vegetable Items 2008/09 2009/10National (2009/10)
Area (acre) 3,187 3,201 133,305Production (ton) 18,701 17,846 818,254Yield (ton/acre) 5.87 5.58 6.14Area (acre) 1,436 1,493 39,583Production (ton) 5,709 7,074 234,493Yield (ton/acre) 3.98 4.74 5.92
Banana
Pinapple
Source: Yearbook of Agricultural Statistics of Bangladesh-2010
0.00
1.00
2.00
3.00
4.00
5.00
6.00
7.00
Banana Pinapple
ton
Bandarban National
Source: Yearbook of Agricultural Statistics of Bangladesh-2010
Figure 4-21: Yields of Banana and Pineapple in Bandarban and Bangladesh
Table 4-37: Productivities of Fruits in Bandarban
2008-09 2009-10 2008-09 2009-10Bandarban 649 378 84 96National 76,715 79,066 67 81Bandarban 113 95 29 32National 2,750 2,790 23 20Bandarban 582 283 227 244National 22,814 25,166 138 135Bandarban 10 17 77 83National 220 177 52 51
Fruit
Area Under Garden(acre)
Average Yield Per Fruit Bearing Tree (kg)
Mango
Papaya
Jackfruit
Wood Apple
Source: Yearbook of Agricultural Statistics of Bangladesh-2010

Data Collection Study on Regional Development in Southeastern Bangladesh Final Report
4-26
0
50
100
150
200
250
300
Mango Papaya Jackfruit Wood Apple
kg
Bandarban National
Source: Yearbook of Agricultural Statistics of Bangladesh-2010
Figure 4-22: Productivities of Fruits in Bandarban
Table 4-38: DAE Project in Bandarban No. Name Duration Budget Activities 1 Improved seed production,
storage & distribution project at farm level
5 years (Extended)
315,000.01 210 demonstration (BRRI Dhan-28=130, BRRI Dhan-29=65, BRRI Dhan-50= 15)
2 Establishment of high productive fruits garden
2010–2011 - Conducted 29 demonstration program of fruits at 29 Union
3 Orange development 2010–2011 - Distribution of orange plant to 732 family (12plants / family) Demonstration of orange Block
Source: Interview from DAE in Bandarban Livestock
Table 4-39 shows that productions in any livestock in Bandarban are less than 1%. It was also observed in the field survey that animal productions were basically for self-consumption, and commercial oriented products were limited.
Table 4-39: Productivity of Livestock in Bandarban Livestock Use of Livestock Bandarban National Share
Commercial 642 194,154 0.33%Subsistance 112,368 24,941,184 0.45%
Total 113,010 25,135,338 0.45%Commercial 4,863 881,507 0.55%Subsistance 52,856 16,577,554 0.32%
Total 57,719 17,459,061 0.33%Commercial 10,859 21,809,649 0.05%Subsistance 549,005 166,588,650 0.33%
Total 559,864 188,398,299 0.30%Commercial 472 115,410 0.41%Subsistance 14,517 10,764,513 0.13%
Total 14,989 10,879,923 0.14%
Cattle & Buffaloes
Goats & Sheep
Fowls & Ducks
Pigeons
Source: Yearbook of Agricultural Statistics of Bangladesh-2010

Data Collection Study on Regional Development in Southeastern Bangladesh Final Report
4-27
Fishery
In the field survey, we could not observe even small scale fishery in ponds and rivers. It is assumed that the situation of fishery in Bandarban is more or less the same in other areas. Table 4-40 shows fish catch in different types of water bodies. As can be seen, fish catch is comparatively higher in flood plain, but the amount of fish catch is still limited.
Table 4-40: Fish Catch by Water Bodies in Bandarban Bandarban National
River 17 138,016Beel N/A 79,200Flood Land 154 879,513Pond N/A 912,178Baor N/A 5,038Shrimp Farm N/A 145,585Total 171 2,159,530 Source: Yearbook of Agricultural Statistics of Bangladesh-2010
Forestry
As demonstrated in Table 4-41, the share of forest area of Bandarban is 17% of total forest land. There is no reserved forest, but the area of UCF is very high, accounting for 90% of total UCF in Bangladesh, and 62% of forest land in Bandarban. Un-classified State Forest is 29%. According to the hearing from local people, due to the increase of population, especially by migration from out of CHT, local people have lack of land for jhum cultivation these days. UCF is also occupied by settlers and logged by outsiders.
Table 4-41: Area of Forest by Types Production Bandarban National Share of Bandarban
Protected Forest (20th Ammendment) 242693.4 3020047.88 8.04%Protected Forest (4 & 6th Ammendment) 23535.4 1457171.47 1.62%
Reserved Forest 0 91381.89 0.00%
Acquired Forest 0 20848.4 0.00%
Vested Forest 0 9491.97 0.00%
Un-classfied Forest 38644.75 42847.51 90.19%Total Forest Area Controled by
Forestry Dept. 304873.55 4,641,789.12 6.57%
Un-classfied State Forest 494372.5 1,716,609.32 28.80%
Khas Forest Area 0 59,510.84 0.00%
Total Forest Area 799246.05 4641789.12 17.22% Source: Yearbook of Agricultural Statistics of Bangladesh-2010

Data Collection Study on Regional Development in Southeastern Bangladesh Final Report
4-28
30%
3%5%62%
Bandarban
Protected Forest(20th Ammendment)
Protected Forest(4 & 6thAmmendment)Un-classfied Forest
Un-classfied StateForest
Source: Yearbook of Agricultural Statistics of Bangladesh-2010
Figure 4-23: Ratio of Forest by Types in Bandarban
47%
23%
1%
0%0%
1%
27%
1%
National
Protected Forest(20th Ammendment)
Protected Forest(4 & 6th Ammendment)
Reserved Forest
Acquired Forest
Vested Forest
Un-classfied Forest
Un-classfied State Forest
Source: Yearbook of Agricultural Statistics of Bangladesh-2010
Figure 4-24: Ratio of Forest by Types in Bangladesh 4.3.2 Tourism Industry There was no statistical data on tourism in Bandarban like the other two districts. Thus, we obtained an interview from one tourism company in Bandarban. The company organizes tours to various places in Bangladesh such as Sylhet, Barisal, Rajshahi and CHT. They have only one own resort hotel in Bangladesh, which is located on a mountain near by Bandarban town. They said that the number of tourists is dramatically increasing in CHT, especially in Bandarban. During the tourism season from October to April, all hotel rooms are always occupied, though number of guests is half of it the rest of the time. 80% of guests in this hotel are foreigners, because the price of this hotel is higher than the standard hotel in Bangladesh (more than 3,000TK per night). They provide tour packages for guests such as riverside tracking, highland tour, and tour to tribal villages. While tourism industry is booming in Bandarban, establishment of services and infrastructure are not catching up with the increase of tourists. Waste management, water supply and road construction will be the main issues for infrastructure. Since people visit CHT to enjoy cultural practice of local people which is based on nature, conservation of the environment is also an urgent issue to be tackled.

Data Collection Study on Regional Development in Southeastern Bangladesh Final Report
4-29
4.3.3 Particularity of Local Industries in Bandarban Similarly with Khagrachhari and Rangamati, agriculture is the basic sector for industrial development in Bandarban. Due to the geographical limitation, it may be difficult to increase production of rice in Bandarban, unless further improvement of HYV proceeds. Potential crops for income generation are turmeric, chili and ginger. Jackfruit, mango and papaya are also potential products to be developed as the footing of local industries. Where they can improve in terms of industrial development are scale of production, transportation and post-harvesting treatment. Tourism industry has high potential since the number of tourists increase year by year. In order to establish the tourism industry in Bandarban, they need to meet the demand of tourists such as basic infrastructure, public and private services for visitors and conservation of cultural and natural diversity. 4.4 Cox’s Bazar 4.4.1 Agro-based Industries Agriculuture
The economy of CXB is quite different from the situation in CHT. Industries in CHT are based on natural resources in especially on hill slope such as vegetables, fruits, fish culture in creek dam, sericulture and paper mill. On the other hand, basic resources for industries in CXB are not only hill, but also the sea. According to “Statistical Yearbook of Bangladesh-2010” and “Yearbook of Agricultural Statistics of Bangladesh-2010,” there are few data on agriculture in CXB. Thus, we will describe the agricultural situation qualitatively below. Since CXB has large plain land compared to CHT, rice cultivation is the basic production in agriculture like other parts of Bangladesh. As it is shown in Table 4-42, HYV of amom and boro are the same as the national average in productivity. It was also observed in field survey in the communities of CXB.
Table 4-42: Productivity and Cultivated Area of Rice in CXB District Rice Variety Item 2008/09 2009/10 National (2009/10
Area (acre) 25 26 832,230Production (ton) 14 15 393,434Yield (ton/acre) 1.79 1.73 2.12Area (acre) 1,760 1,606 1,599,462Production (ton) 1,857 2,194 1,315,693Yield (ton/acre) 0.95 0.73 1.22Area (acre) 7,170 7,564 3,494,580Production (ton) 5,658 7,827 2,236,737Yield (ton/acre) 1.27 0.97 1.56Area (acre) 169,340 173,588 9,323,203Production (ton) 206,760 216,872 9,403,633Yield (ton/acre) 0.82 0.80 0.99Area (acre) 0 0 265,220Production (ton) 0 0 214,550Yield (ton/acre) 0.00 0.00 1.24Area (acre) 12,777 10,305 9,671,268Production (ton) 17,165 16,456 14,622,485Yield (ton/acre) 0.74 0.63 0.66
Local
HYV
Aus
AmonKhagrachari
Local
HYV
Local
HYV
Boro
Source: Yearbook of Agricultural Statistics of Bangladesh-2010

Data Collection Study on Regional Development in Southeastern Bangladesh Final Report
4-30
69%
4%
9%
0% 18%
Chittagong
Power Pump
Deep
Shallow
Hand
Traditional Method
Source: Yearbook of Agricultural Statistics of Bangladesh-2010
Figure 4-25: Ratio of Irrigated Area by Facility
Other major crops such as turmeric and ginger are not observed in the field survey. Production of vegetable was also limited, though they sell surplus in market for income. Main cash crops in CXB were betel leaf and betel nut. As is described in community profiles in CXB, betel leaf generates high profit, but it costs people to produce betel leaf because it requires high inputs such as fertilizer, pesticides and shed. At the same time, betel leaf is easily affected by insect disease, and destroyed all at once. Thus, it is said that betel leaf cultivation is high risk and high return. Betel leaf and betel nut are widely produced in CXB, thus production and marketing system were already established though there should be need of improvements. Apart from betel leaf and nut, watermelon is an important cash crop in CXB. Farmers produce watermelon during the dry season which is off-season for rice cultivation. Producers sell them to middleman, and they are wholesaled in CXB town. It is said that if they have better irrigation facilities, they could produce larger watermelon, besides expanding area of cultivation.
Livestock
As is livestock in CHT, livestock production in CXB is low in general. Table 4-43 shows that production of goat, sheep, and poultry are all less than 1%, but only commercial purpose production of cattle and buffaloes is over 1% contribution. This was also observed in the fieldsurvey. People hardly keep large animals but only for plowing purpose. Though they do poultry, it is basically for own consumption, and small sale according to the need of cash.
Table 4-43: Numbers of Livestock and Share in National Production in CXBLivestock Use of Livestock Cox's Bazar National Share
Commercial 2,241 194,154 1.15%Subsistance 187,231 24,941,184 0.75%
Total 189,472 25,135,338 0.75%Commercial 12,587 881,507 1.43%Subsistance 142,085 16,577,554 0.86%
Total 154,672 17,459,061 0.89%Commercial 147,003 21,809,649 0.67%Subsistance 1,176,011 166,588,650 0.71%
Total 1,323,014 188,398,299 0.70%Commercial 815 115,410 0.71%Subsistance 27,245 10,764,513 0.25%
Total 28,060 10,879,923 0.26%
Cattle & Buffaloes
Goats & Sheep
Fowls & Ducks
Pigeons
Source: Yearbook of Agricultural Statistics of Bangladesh-2010

Data Collection Study on Regional Development in Southeastern Bangladesh Final Report
4-31
Table 4-44 shows projects implemented by the Department of Livestock in CXB. The projects are to vaccine for poultry, loan for goat rearing and so on.
Table 4-44: Projects of Department of Livestock in CXB No. Name of Project Duration Budget Activities 1 Poultry and cow vaccination on going 4,900,000 Average 60% recovered 2 Small scale loan for Goat rearing on going 2,360,000 3 Free interest and funding on Duck, poultry and
goat rearing on going 1,440,000
Source: Interview from officers in Department of Livestock Fishery
CXB has one of the best access to sea resources in Bangladesh, thus fishery is one of the important industries. On the other hand, as can be seen in Table 4-45, productions of inland fishery are not very high. According to the hearing from the Department of Fishery in CXB, the main fish products are row fish, dry fish and shrimp fry. Row and dry fishes are collected from coast, and wholesaled in Dhaka and Chittagong. Some amount of frozen and dry fish is exported. CXB is famous for shrimp hatchery. Shrimp fries hatched in CXB are sold to shrimp culture farmers in Khulna division. It is said that the environment in CXB is favorable for shrimp hatchery, but not for culture. However, by improving technologies of shrimp culture, they have the opportunity to develop shrimp culture in CXB. At present, shrimp production in Khulna is 1 ton per hector, while they produce only 150 to 200kg per ha in CXB. Fishing practice in CXB is based on household level. Fishermen use small engine boat which can accommodate only 5-6 persons. Catch of fishes is not stable. They usually sell row fishes to middlemen who visit villages. According to an interview in the community, it is said that the catch of fish is decreasing year by year. It is also demonstrated by the Department of Environment which implemented an environmental conservation project in CXB that there are endangered fish species in CXB.
Table 4-45: Fish Catch by Water Bodies in CXB (ton)
District River Sundarban Beel Kaptai Lake Flood Inland Pond Baor Shrimp Farm TotalCox's Bazar 717 - - - 5,293 21,024 - 3 27,037ChittagonDivision
42,989 - 558 8,590 198,309 243,616 - 31,087 525,149
National 138,160 18,462 79,200 8,590 879,513 912,178 5,038 145,585 2,186,726 Source: Yearbook of Agricultural Statistics of Bangladesh-2010
Table 4-46: Catch Ratio of Inland and Marine Fisheries
Sector of Fisheries Water Area (Ha)Total Catch
(ton) %Inland Fisheries 4,575,706 2,186,726 80.95Marine Fisheries - 514,644 19.05Total 4,575,706 2,701,370 100
Source: Yearbook of Agricultural Statistics of Bangladesh-2010 The Fishery Office provides technical training for people on fish and shrimp culture, because they use traditional method for fish and shrimp culture. They also give training on fishery law, and monitoring on law enforcement. In order to prevent illegal fishing, they promote fishing license to fishermen. There is illegal practice of shrimp fry collection in the coastal area, which is usually practiced by poor people including Rohingya. They sell shrimp fry to

Data Collection Study on Regional Development in Southeastern Bangladesh Final Report
4-32
middlemen and they sell them in Khulna. In order to stop this illegal practice, they do monitoring of fishing practice. Quality control is another important activity of the Fishery Office. They visit fish farm and market, and check hygiene and use of medicine. In order to improve shrimp culture technology, 7,021 acre of land is leased for the Fishery Office, but due to the lack of funds, they have not yet utilized it. Officers in the Fishery Office are shown in Table 4-47.
Table 4-47: Officers in Fishery Office Name of Designation No. of Post VacancyDistrict Fishery Officer 1Assistant Director 1 1Quality Control Inspector 1Sub-assistant Engineer 1Fishery Survey Officer 1 1Head Assistant 1 1Accountant 1 1Office Assistant 1MLSS 3 2Driver 1Total 12 6 Source: Hearing from officers in Fishery Office
Table 4-48: Projects in Fishery Office Sl. No. Project’s Name Duration Budget Activities 1 National Agricultural
Technology Project (NATP)
2008–2013
2011–12=45,760 1. Group Formation 2010-11=103,049 2. Training for Selected groups 2009-10=163,885 3. Demonstration Pond establishment 4. Exchange Visit 5. Technology Fair 6. Establishment of Farmers information center
(FIAC) at union parisad office 7. Recruit Local Extension Agent for Fisheries
(LEAF) 2 Bagda Shrimp Culture
Technology Extension Project
2007–2012
2011–12=26,000 1. Farmer’s Training 2010–11=195,000 2. Demonstration Farm establishment 2009–10=80,000 3. Exchange Visit 4. Professinal Training on Bagda Shrimp
Hatchery Operation (Nation wide) 3 Union Level Fish Culture
Technology Service Extension Project
2009–2014
2010–11=90,000 1. Training for Selected farmers 2009–10=15,000 2. Demonstration Pond establishment 3. Recruit Local Extension Agent for Fisheries
(LEAF) 4 Strengthening of Fishery
and Aquaculture Food Safety and Quality Management Systen in Bangladesh (BEST project)
2010– 2011–12 = 136,000/=
1. Training & Motivation special emphasis on Shrimp Hatchery, Farm, Depot & Fish Processors personnel and all other stakeholders
2010–11 = 63,000/=
2. Up gradation of Fish & Fish Products Exporters establishment.
5 Marine Fisheries Capacity Building Project
2010–11=10,000/= 1. Survey of fishing crafts & gears 2009–10=19,000/= 2. Data collection of Marine Fisheries Resources 2008–09=42,000/=
6 Selected Degradated Water bodies development & management and conservation of Indigenous small fishes
Nil 1. Indigenous small fish fry release in natural water bodies
2. Degradated water bodies develop for fish culture
Source: Interview with Fishery Office

Data Collection Study on Regional Development in Southeastern Bangladesh Final Report
4-33
Forestry
As Table 4-49 demonstrates, the area of reserved forest is remarkable in CXB, accounting for 37% of total reserved forest in Bangladesh. On the other hand, 60 to 70% of forest in CXB have degraded over the last 50 years.
Table 4-49: Ratio of Forest by Type in CXB
Production Cox’s Bazar National Share of
Cox’s Bazar Protected Forest (20th Ammendment) 168,900.50 3,020,047.88 5.59% Protected Forest (4 & 6th Ammendment) 30,000.00 1,457,171.47 2.06% Reserved Forest 33,521.42 91,381.89 36.68% Acquired Forest 0.00 20,848.40 0.00% Vested Forest 0.00 9,491.97 0.00% Un-classfied Forest 0.00 42,847.51 0.00% Total Forest Area Controled by Forestry Dept. 232,421.92 4,641,789.12 5.01% Un-classfied State Forest 0.00 1,716,609.32 0.00% Khas Forest Area 0.00 59,510.84 0.00%
Total Forest Area 232,421.92 4,641,789.12 5.01% Source: Yearbook of Agricultural Statistics of Bangladesh-2010 Participatory Forest has been implemented according to the Forest Act all over Bangladesh. It has started in CXB in 2002. In this forestry system, the people and government share 45% profit each and 10% will be deposited for Tree Farming Fund to invest on the next plantation. In this forestry system, around 20 to 30 households are grouped, and given 5 acre of land and saplings. They are supposed to cut branches of tree after four years, and make forest thin out in the 7th year, and cut all to make timber 10 years after the plantation.
Table 4-50: Offices of Divisional Forest Office Name of Designation No. of Post VacancyDivisional Forest Officer 1 -Assistant Conservator of Forest 4 -Range Officer 11 -Forester - -Forest Guard 5-7 -Total 300 127
Source: Hearing from officers in Divisional Forest Office 4.4.2 Tourism Industry Tourism has been the center of attention as a key local industry in CXB for a long time. Moreover, the number of tourists is dramatically increasing year by year. The number of tourists was estimated at 15,000 persons per day from October to March in five years before, and now it is 20,000 persons. In order to meet this change, the master plan for tourism development was produced by related ministries and the local government. They proposed to establish an exclusive tourism zone, infrastructure, cricket stadium, a golf field, and an industrial port. Beach Management Committee is organized by the District Commissioner, Mayor of CXB city, Police, LGDE and other related local government departments. Challenges for the tourism industry are to set up basic infrastructure to meet demand of tourists and public services such as waste management and water and electricity supply. Because
Data Collection Study on Regional Development in Southeastern Bangladesh Final Report
4-34
many people come to CXB to see nature in coastal zones such as beach and mountains, it is proposed to promote environmental conservation and establishment of eco-tourism. CXB already has three eco-tourism centers, but they are not well managed. There is a sanctuary for Asian elephant in Teknaf. 4.4.3 Particularity of Local Industries in CXB In CXB, rice is basically produced like other parts of Bangladesh, but betel leaf and nut are important as cash crops. Although they produce vegetables and fruits, these products are mainly for self-consumption, or sale in the local market. Only watermelon is produced as a market oriented item in this area. Fishery in the coastal area also has economic potential. Since it is demonstrated that the amount of fish catch has been decreasing year by year, it is recommended to promote sustainable use of coastal resource in fishing communities. Tourism is a promising industry for CXB, but there are many challenges to receive dramatically increasing tourists. Establishment of basic infrastructure with strategies to harmonize environmental conservation implemented by the Department of Environment is recommended for development of the tourism industry. 4.5 Characteristics and Challenges of Local Industries in CHT and
CXB 4.5.1 CHT As we have discussed throughout this chapter, agriculture is the foundation of local industries in CHT. Utilizing hill slopes, people produce varieties of crops such as turmeric, ginger, taro, sweet potato, pumpkin, jackfruit, mango, and banana. Many of vegetables are basically for self-consumption or limited sale in the local market, while some of crops such as turmeric, ginger, banana, papaya and other fruit have already been widely marketed. Some of the issues which are bottleneck for the development of an agro-based industry may be resolved through assistance. One of the challenges is soil erosion. It is caused by monoculture on hill slope. In order to optimize agricultural work and expand scale of production, people plant single cash crop on hill slope such as banana, pineapple, turmeric and ginger. It is said that the monoculture, especially of root vegetables, cause soil erosion. Bangladesh Agriculture Research Institute (BARI) and Bangladesh Conservation Approaches and Technologies (BANCAT) are inventing new cropping system to sustain hill environment and livelihood of jhum cultivators. Though these systems are not practically assessed on farm, alternative farming practice should be introduced for sustainable development of hill slope agriculture. Watershed management is also an essential issue for the development of local industries in CHT. It could multiply productions and cultivated areas by supplying water during dry season. Since creek dam has already been introduced in Rangamati, this method may be a possible way to supply water for agriculture on hill slope. Marketing is the third challenge for development of agro-based industries. It is assumed that lack of basic infrastructures such as storage facility, road communication and telecommunication are obstacles to sell agricultural products at competitive prices. Although a long term plan will be required for infrastructures, institutional approach such as organizing cooperatives could be taken to improve the marketing environment. Sericulture also has potential to be developed. High yielding varieties have already been invented; therefore, they need to disseminate the varieties to farmers. Since cocoon production is based on household level, it can also help the local community to generate income. Tourism industry is rapidly growing in CHT, but there is no specific plan to develop this sector in CHT as a whole. Since the challenges for tourism industries have already been clear, assistance for planning may be required in the future.

Data Collection Study on Regional Development in Southeastern Bangladesh Final Report
4-35
4.5.2 CXB One of the basic industries in CXB will be fishery based. It has favorable environment for fishery such as seacoast fishery, fish culture, shrimp fry hatchery and fry fish production. By improving technologies for fishery, it can generate more productions and job opportunities. At the same time, they are expected to take some measures to promote sustainable development. Since fish catch has already decreased year by year, conservation of natural resource will be an urgent challenge requiring assistance. In the tourism sector, it can be proposed to make a detail plan to prevent destructive resource use and development. Some of areas of CXB have already been declared as Ecologically Critical Area 4 , and the Department of Environment has implemented a project to establish management of biodiversity in the coastal zone. However, due to lack of a holistic plan, it has not been able to regulate of the coastal area along with its development. Since some government forces have already developed plans for developing tourism in CXB, what they may need an integrative plan to develop the local industry.
4 Ecologically Critical Area is the area to conserve the evvirontment according to Bangladesh Environment Conservation Act in 1995.

Data Collection Study on Regional Development in Southeastern Bangladesh Final Report
4-36

Data Collection Study on Regional Development in Southeastern Bangladesh Final Report
5-1
5. Safe Drinking Water Profile
5.1 Basic Information for Water Supply 5.1.1 Geology and Geography (1) Geology and Geography According to the “Chittagong Hill Tracts Regional Development Plan, ADB (2000)” it is described that the CHT hills are the result of the uplifting, folding and faulting of sedimentary rocks dating from the Tertiary period. The folds run from the North to South, forming several semi-parallel anticlinal ridges in the east–west direction. The ridges consist of ‘high hill’ and ‘low hill’ ranges, formed by geological erosion of the original folds, which has exposed the oldest Miocene rocks of the inner core. The elevation of the hill ranges increases towards the south–east from Rangamati and reaches a peak at few km south-east of Bandarban where peak elevation of the crest is approximately 1,300 m. The relief in this part is relatively young and V-shaped. Elevation of the hill range decreases towards the south, west and north from the highest peak. Steepness of the slopes depends on the spacing between successive ridges and on the nature of the rock. Spacing decreases and slope steepness increases from west to east. The soils derived from these old rocks (Surma–Tipam soil series) occupy the core position of each anticlinal ridge while the lower hillocks (Dupi–Tila soil series) occur on the flanks. The slopes on the high hills are steep (slope classes C and D) in most cases. Those on the low hills become less steep away from the centre of the ridges (slope classes B and C). The narrowly spaced ridges with steep slopes occupy a relatively small area on the north-eastern side of the CHT, of which they form a large part of the southern half (Bandarban). On a micro scale, steepness of slope is also affected by the occurrence of hard sandstone embedded in the predominant softer shales. (2) Surface Soil According to the “Chittagong Hill Tracts Regional Development Plan, ADB (2000)” it is described that soils of the high hills exceeding 100 meters of elevation are steeply sloping, excessively drained, and of shallow depth (usually less than 1 meter). They are yellowish brown to strong brown, well-structured, loamy, consisting of acid subsoils resting on consolidated or semi-consolidated siltstone, clayey siltstone or shale. Soils developed on shale are clay loam or silty clay loam, brownish yellow while those derived from sandstone are strong brown, sandy loam to sandy clay loam. Well drained, dissected, sloping piedmont terraces may occur locally at the outer most part of the anticlines. Morphologically these terraces resemble the low hills. Like soils of the Dupi-Tila series, the piedmont terrace fan soils have deep, strong brown to yellowish brown, loamy, acid subsoil. The terrace fan soils are more strongly leached than Dupi-Tila soils and have a lower base saturation percent (less than 35%). The soils in the valleys are poorly to very poorly drained and have grey mottled, loamy to clayey, weakly structured, acid subsoil. Irrespective of the parent material and lithology, hill soils occurring on the excessively drained narrow ridge crests, steep slopes and cliffs have a Cambic horizon, while those occurring on well-drained flat hill tops and gentle slopes have an Argillic horizon. The topsoil is usually dark grayish brown unless eroded

Data Collection Study on Regional Development in Southeastern Bangladesh Final Report
5-2
Table 5-1: Soil Distribution in CHT Parent Material Location Soil series % of CHT
Hill Soils Consolidated shales, sandstones and siltstone (Surma-Tipam)
Higher hill ranges Sandy loan, silty clay loam 70
Unconsolidated sandstone & siltstone (Dupi-Tila sands and clays)
Lower hill ranges Sandy or silty loam Sandy clay loan
26
Alluvial soils Slope run-off Stream-borne sediment
High river banks terraces Valley bottoms floodplains
Silt loam layered with sandy loam Silty clay loan layered with clay
4
Source: Chittagong Hill Tracts Regional Development Plan (ADB,2000)

Data Collection Study on Regional Development in Southeastern Bangladesh Final Report
5-3
Source: Geological Map of Bangladesh (Geological Survey of Bangladesh, 1990)
Figure 5-1: Geological Map

Data Collection Study on Regional Development in Southeastern Bangladesh Final Report
5-4
Source: Graphosman’s World Atlas, 2010
Figure 5-2: River Map

Data Collection Study on Regional Development in Southeastern Bangladesh Final Report
5-5
(3) River According to the “Chittagong Hill Tracts Study on Potential for Integrated Water Resources Management, ADB (2010)” it is described that the rivers in the area flow along a north-south axis in either direction – depending upon the valleys involved. Northern catchments are drained by the Karnafuli River and its tributaries (Chengri, Myani and Kasalong) – while in the south the Sangu River is the main drainage. These rivers have cut deep gorges in a south-western direction before entering the coastal plain and draining into the Gulf of Bengal. In the Chittagong coastal plain, these rivers and their tributaries meander as a result of reduced flow velocity and routinely deposit large quantities of silt. Typical drainage patterns on hill slopes consist of a dense dendritic network of gullies fanning out into winding valleys. 5.1.2 Potential for Groundwater and Surface Water Development (1) Groundwater According to the “Chittagong Hill Tracts Study on Potential for Integrated Water Resources Management, ADB (2010)” it is described that CHT does not have an abundance of groundwater resources. This is mainly due to the great depth of consolidated shale bed that does not permit a high volume of annual recharge. However, along the synclinal region (valley areas) deep ground water is available within 100–300 m depth. Almost everywhere in CHT, slope is very steep. In all cases, groundwater level reaches or comes close to the ground surface in monsoon and goes down to a depth of 1.5 m to 4.0 m below the surface in dry months indicating low groundwater fluctuation. The area is however considered unfavorable for extensive groundwater development. The aquifer has low transmissivities and intensive development would therefore incur large draw down. However, wells can be developed successfully on an individual basis. According to the “Water Management Program Mission Chittagong Hill Tracts Bangladesh, (EU, 2012)”, drinking water sources differ per area. In Khagrachhari tubewells and ring wells are quite feasible and common. In Rangamati lakeside communities use lake water and ring wells, while communities higher up use streams. In hilly Bandarban wells are rarely feasible and communities depend on streams mostly. Coverage of safe drinking water provision is expanding, but at the same time many streams are reported to dry up due to over-use and deforestation. Drinking water supply is affected by irrigation, industry and aquaculture. (2) Spring The spring is one of essential drinking water source for high hill area people. According to Water Aid report, it is assumed that a hundred years ago, as many as 200,000 springs were flowing over the CHT area. It is unknown how many of these precious sources of fresh water exist today. In the context of geology, the springs located in Tipam Sandstone Formation seems most favorable geological formation in the context of flow of the springs. Bhuban and Bokabil Formations seem next to Tipam Sandstone and they can be designated as moderately suitable. Undifferentiated Dihing-DupiTila seems do not suitable for spring flow. (Assessment of the underlying causes for the deterioration of water flow in the natural springs of Chittagong Hill Tracts Districts (Water Aid)) (3) Kaptai Lake The resulting Kaptai Lake covers an area varying from 55,000 to 68,000 hectares. The Kasalong and Myani Rivers both drain into the lake. Kaptai Lake is intensively used for transport and for domestic and commercial fishing. Lake waters are allowed to rise from June

Data Collection Study on Regional Development in Southeastern Bangladesh Final Report
5-6
to November – where after water levels drop as it is used for power generation.(Chittagong Hill Tracts Region Development (ADB). According to interview from Kaptai Authority that water level of Kaptai Lake is controlled between 68 feet to 109feet MSL. At the moment bottom of lake is sediment upon 40 to 50 feet MSL by soil. 5.1.3 Water Supply (1) Population and Proportion of Population Using an Improved Drinking Water
Source According to “Key Findings of the Bangladesh Multiple Indicator Cluster Survey 2009 (hereinafter referred to as MICS)” which was conducted by UNICEF, 69.7% of population in Khagrachhari, 66.5% in Rangamati, 67.8% in Bandarban and 96.6% in Cox’s Bazar is using an improved drinking water source (Figure 5-3 and Tables 5-3). However “CHT Baseline Census Report (hereinafter referred to as BCR)” which field survey was conducted by Green Hill (NG) and published by Water Aid mentioned that 76% of population in Khagrachhari, 47% in Rangamati and 48% in Bandarban is using an improved drinking water source. According to interview of Green Hill, most of population living in hill top area is not able to reach improved drinking water source. Main reasons are that road communication is not good and resident area is located above water source.
Source: Key Findings of the Bangladesh Multiple Indicator Cluster Survey 2009 (UNICEF)
Figure 5-3: Population (left) and Population Ratio (right) with No Access Improved Safe Water

Data Collection Study on Regional Development in Southeastern Bangladesh Final Report
5-7
Table 5-2: Population Ratio with No Access Improved Safe Water
Improvedsources
Unimprovedsources
SurveyedNumber
Improvedsources
Unimprovedsources
SurveyedHouse Hold
Khagrachhari 76% 24% 95,995 69.7% 30.3% 21,896Rangamati 47% 53% 90,895 66.5% 33.5% 26,884Bandarban 48% 52% 47,845 67.8% 32.2% 19,913
Cox's Bazar - - - 96.6% 3.4% 26,404Total 59% 41% 234,735 - - 95,097
DistrictBCR※1 MICS※2
Source: ※1 CHT Baseline Census Report (2010, Water Aid), ※2 Key Findings of the Bangladesh Multiple Indicator Cluster Survey 2009 (UNICEF)
5.1.4 Water Supply Technology (1) Available Water Supply Device In the CHT area, available water supply technologies are Deep tube-well (DTW), Shallow tube-well (STW), Ring well (RW), Dug well/Pat well which water source is groundwater and Gravity flow System (GFS), Infiltration Glary (IFG), Infiltration Well (IFW), Spring water, River Water, Lake water, Fall water which water source is surface water. Though, rain water harvest system is another technology. According to interview form SAE of DPHE, Khagrachhari, Rangamati and Bandarban, well depth range of respective water supply device is shown in Table 5-2. Table 5-4 shows feature of respected water supply technology.
Table 5-3: Installed Well Depth Range by Water Supply Device by District (m)
Min Max Min Max Min MaxKhagrachhari 9 60 182 243Rangamati 30 106 39 188 7 22Bandarban 18 67 79 173 12 22Cox’s Bazar 9 60 182 243 6 13
STW DTW Ring WellDistrict
Source: Interview with DPHE

Data Collection Study on Regional Development in Southeastern Bangladesh Final Report
5-8
Table 5-4: Water Supply Technology and Feature
Water Supply Technology Water Source Advantages and Disadvantages
Deep tube-well GroundwaterLarge amount of water is availableNeed appropriate aquifer and drilling machine
Popular in Bangladesh, Cheep, Machine is not requireHard rock area is not feasible
Ring well Machine is not requireDug well/Pat well Suitable aquifer area is small, Need feasibility survey
Available pump up even groundwater level is Bellow 7mDifficult regular maintenance and to get spare partsCommon water source, Pump is not necessaryWater source is far from hill top. Dried up during dry seasonCollected water is supplied by gravity flowDried up during dry seasonCollected water is supplied by gravity flowRegular maintenance for sand filter is require
Infiltration Well Surface Water Regular maintenance for sand filter is requireSpecific facility is not necessaryWater source is far from hill top. Dried up during dry seasonDried up during dry seasonWater volume is hugeWater level fluctuate between dry season and rainy seasonCommon water source, Pump is not necessaryDried up during dry seasonWater strage tank is set-up beside house8- month drinking water volume should be reserved during rain season
Spring Groundwater
Shallow tube-well Groundwater
Groundwater
Tara dev Groundwater
GFS Surface Water
Infiltration Glary Surface Water
River Water Surface Water
Rain waterRain water harvesting
Fall water Surface Water
Lake water Surface Water
Source: Prepared by the study team (2) Source of Installed Water Supply Device Table 5-5 shows percentage of water source of installed water supply devices. Most of water supply devices are using groundwater. That percentage is 99.9% in Khagrachhari, 99.9% in Cox’s Bazar, 97.9%in Rangamati and 94.5% in Bandarban. However, surface water is only5.6% is used in Bandarban and 1.9% in Rangamati (BCR).
Table 5-5: Type of Installed Water Supply Device in Percentenge
Water Source Khagrachhari※1 Rangamati※1 Bandarban※1 Cox's Bazar※2
Pipe line 0.01% 0.2% 0.9% 0.04%Groundwater 99.9% 97.9% 94.5% 99.7%Sueface Waer 0.1% 1.9% 5.6% 0.2%Rain water 0.01% 0.1% 0.0% 0.04%Other 0.01% 0.1% 0.0% 0.0% Source: ※1 CHT Baseline Census Report (2010, Water Aid), ※2 Groundwater circle, DPHE provided information
5.1.5 Type of Water Supply Device According to MICS, 84% of population in Khagrachhari 76% in Cox’s Bazar, 72% in Rangamati and 52% in Bandarban is using groundwater with improved and unimproved water device. However “Socio-Economic Baseline Survey of Chittagong Hill Tracts (hereinafter referred to as SBC)” mentioned that 63.0% of Bangalee in habitants of CHT are able to access

Data Collection Study on Regional Development in Southeastern Bangladesh Final Report
5-9
to improved groundwater source against 44.6% of Indigenous. Situation of surface water, percentage of unimproved water source is higher improved water source.
Table 5-6: HHs Acces to Imploved Water Supply Device in Percentage
Khagrachhari※1 Rangamati※1 Bandarban※1 Cox's Bazar※1Indigenouspeoples※2 Bangalee※2 All CHT※2
Pipe line Improved sources 1.60% 5.90% 9.90% 20.60% - - -Improved sources 67.0% 55.9% 48.2% 75.5% 44.6% 63.0% 53.0%Unimproved sources 17.2% 16.1% 3.8% 0.5% 24.0% 8.0% 16.9%
Sub total 84.2% 72.0% 52.0% 76.0% 68.6% 71.0% 69.9%Improved sources 1.1% 4.6% 9.6% 0.3% 5.5% 5.7% 5.5%Unimproved sources 10.9% 17.3% 27.2% 1.5% 30.4% 28.5% 29.4%
Sub total 12.0% 21.9% 36.8% 1.8% 35.9% 34.2% 34.9%Rain water Improved sources 0.10% 0.00% 0.10% 0.00% 3.30% 1.50% 2.50%
Improved sources 0.00% 0.10% 0.10% 0.00% - - -Unimproved sources 2.20% 0.20% 1.10% 1.50% - - -
Sub total 2.2% 0.3% 1.2% 1.5% - - -21,896 26,884 19,913 26,404 1,786 1,452 3,238Number of HH
Groundwater
Sueface Waer
Other
Water Source
Source: ※1: Key Findings of the Bangladesh Multiple Indicator Cluster Survey 2009 (UNICEF), ※2: Socio Economic Baseline Survey of Chittagong Hill Tracts 2009 (UNDP)
5.1.6 Time Spent for Water Collection and Distance of Water Source Table 5-7 shows time spent for water collection that most of the households spend less than 15 minutes to collect both drinking- and cooking- water (82.78%), followed by a time range of 16–30 minutes (14.96% households). The highest proportion of households spends 16–30 minutes in Bandarban to collect both types of water. (BCR) However, in case of Cox’s Bazar, there has no such type census survey report.
Table 5-7: Time Spent for Collecting Water Using type
of water Minute Bandarban Kagrachhari Rangamati Total
Drinking water
<=15 76.53 83.43 85.39 82.78 16 - 30 20.69 14.46 12.46 14.96 31 – 45 1.95 1.66 1.66 1.72 46 – 60 0.61 0.35 0.42 0.43
61 and above 0.22 0.09 0.08 0.11 Total 100.00 100.00 100.00 100.00
Respondents 47,845 95,995 90,895 234,735
Cooking water
<=15 76.58 83.41 85.37 82.78 16 - 30 20.65 14.48 12.47 14.96 31 – 45 1.94 1.66 1.65 1.71 46 – 60 0.60 0.36 0.43 0.43
61 and above 0.23 0.11 0.08 0.12 Total 100.00 100.00 100.00 100.00
Respondents 47,845 95,995 90,894 234,734
Source: ※1: CHT Baseline Census Report (2010, Water Aid) Table 5-8 shows distance of source of drinking water that most of the households were distant. Considering minimum distance 50 meter following the national standard of GoB, 66% of all households had to collect water from distant sources. The highest proportion of households in Bandarban (74%) had remote source of drinking-water, followed by Rangamati. A similar pattern can be observed for cooking-water in all the districts. (BCR) Cox’s Bazar district has no same type of data

Data Collection Study on Regional Development in Southeastern Bangladesh Final Report
5-10
Table 5-8: Distance of Source of Water by Category
Using type of water Distance District
Total Bandarban Khagrachhari Rangamati
Drinking water
<= 50 meter 26.48% 40.34% 31.34% 34.03% 51 to 100 meter 23.09% 22.69% 26.65% 24.30%
> 100 meter 50.43% 36.98% 42.02% 41.67% Total 100.00% 100.00% 100.00% 100.00%
Respondents 47,845 95,995 90,895 2,34,735
Cooking water
<= 50 meter 26.50% 40.38% 31.43% 34.08% 51 to 100 meter 23.10% 22.68% 26.59% 24.28%
> 100 meter 50.40% 36.95% 41.98% 41.64% Total 100.00% 100.00% 100.00% 100.00%
Respondents 47,845 95,995 90,895 2,34,735
Source: ※1: CHT Baseline Census Report (2010, Water Aid)
5.1.7 Water Use and Spending Table 5-9 shows that Daily average use of water was found to be the highest on Bandarban, followed by Khagrachhari and Rangamati. On average, poor households use more water than non-poor ones (BCR). Cox’s Bazar district has no same type of data.
Table 5-9: Daily Water Use of the Households (Litre)
District Mean Non-Poor Poor (Moderate) Poor (Extreme)
Bandarban 98.31 93.60 101.97 106.17
Khagrachhari 92.86 83.89 94.48 99.39
Rangamati 78.14 82.55 90.97 89.09
Source: CHT Baseline Census Report (2010, Water Aid) Table 5-10 explains the average cost of obtaining water per month. Even though the daily consumption of water was lowest in Rangamati, households of this district spend highest amount for water collection. On the other hand, in part of the Khagrachhari district, the expense was significantly low compared to other districts. It is also worth-mentioning that the non-poor households spend higher even if their quantity of consumption was lower than the poor ones in all the districts. This was due to the fact that poor households collect water mostly from non-payable and public sources. (BCR). Cox’s Bazar district has no same type of data.
Table 5-10: Expenses for Water Collection (TK/month)
District Mean Non-Poor Poor (Moderate) Poor (Extreme)
Bandarban 5.57 9.80 1.87 1.40
Khagrachhari 0.18 0.27 0.15 0.12
Rangamati 6.14 8.84 1.72 1.90
Source: CHT Baseline Census Report (2010, Water Aid) 5.1.8 Community Perception on Quality of Drinking Water A common pattern can be observed in all the three districts in terms of responding about the quality of water that the CHT population drinks. Majority of them were unaware of the quality

Data Collection Study on Regional Development in Southeastern Bangladesh Final Report
5-11
of the drinking-water. However, those who were conscious reported that the quality was good.(BCR). Cox’s Bazar district has no same type of data.
Source: CHT Baseline Census Report (2010, Water Aid)
Figure 5-4: Quality of Drinking-Water
Table 5-11: Quality of Drinking-Water (Percent of Respondents)
District Good Moderate Not Good Do Not Know Total Respondents
Bandarban 36.04 4.44 10.50 49.02 100.00 47,845
Khagrachhari 49.17 2.32 2.93 45.59 100.00 95,995
Rangamati 40.45 6.43 6.46 46.66 100.00 90,894Source: CHT Baseline Census Report (2010, Water Aid)
Majority of the respondents identify that water was unclean in all the districts. Amongst others, salty/bad taste of water had been recognized to be the topmost reason of bad quality of drinking- water, followed by salty/bad taste and contamination. (BCR). Cox’s Bazar district has no same type of data.
Table 5-12: Reason of Bad Drinking-Water (Percent of Respondents)Reasons Bandarban Khagrachhari Rangamati Total Respondents
More iron 0.58 6.37 0.83 1.94 457Salty/bad taste 3.54 9.88 11.61 8.84 2,080Unclean 79.85 80.96 86.01 83.10 19,562Bad smell 2.82 12.51 2.06 4.52 1,063Contaminated 13.53 3.61 1.19 5.38 1,266Arsenic present 0.01 0.08 0.01 0.03 6Others 0.61 0.68 1.59 1.10 260Total 100.96 114.08 103.30 104.91 23540
Source: CHT Baseline Census Report (2010, Water Aid)
5.1.9 Supplier of the TechnologyWater technology was mainly supplied by the government institutions and NGOs besides personal initiatives. These three combine almost 98% as the supplier of the water technology in Bandarban, Khagrachhari, and Rangamati. In Khagrachhari, the personal initiative was higher enough than the government and NGOs. However, Bandarban has received greater supply from the government amongst the districts of CHT. (BCR). Cox’s Bazar district has no same type of data.

Data Collection Study on Regional Development in Southeastern Bangladesh Final Report
5-12
Table 5-13: Supplier Ratio of the Water Technology and a Total Number of Water Devices
District Government NGO Personal Joint ownership Neighbour Natural TotalKhagrachhari 21 11 68 0 0 0 15,368Rangamati 42 16 41 1 0 0 5,368Bandarban 53 22 24 1 0 1 1,621Total 28 13 59 0 0 0 22,357 Source: CHT Baseline Census Report (2010, Water Aid)
5.1.10 Water Availability Water was available in most of the sources for 9 to 12 months; however, the pattern of availability differs for one or two months across the three districts. Following table shows water availability from the different sources. (BCR) Cox’s Bazar district has no same type of data.
Table 5-14: District-Wise Water Availability in a Year Month Khagrachhari Rangamati Bandarban Total
1-3 month 0.20% 1.30% 1.60% 0.50%4-6 month 1.60% 8.40% 18.80% 4.20%7-9 month 0.40% 2.30% 5.50% 1.20%9-12 month 97.80% 88.00% 74.10% 94.10%Total 100.00% 100.00% 100% 100.00% Source: CHT Baseline Census Report (2010, Water Aid)
In most of the tube wells water well available for 9 to 10 months, whereas the other technologies were sometimes useful for 11 to 12 months. For instance, in Bandarban, shallow tube-well, ring well, and DPHE supply lines had been in use for less than 10 months, whereas water was available from these types of sources for more than 10 months in the other two districts. Again, the availability in all seasons was also important as there are some differences between the water availability in between rainy season and summer. Following table explain the average months of water available in a year by Technol (BCR). Cox’s Bazar district has no same type of data.

Data Collection Study on Regional Development in Southeastern Bangladesh Final Report
5-13
Table 5-15: Months of Water Available in a Year by Technology
AverageMonths
Number ofTechnology
AverageMonths
Number ofTechnology
AverageMonths
Number ofTechnology
Deep tube-well 11.18 1,776 10.44 1,883 10.91 423Shallow tube-well 11.86 13,163 11.21 1,274 9.21 231Ring well 9.68 391 9.17 1,936 9.77 819DPHE supply line 11.33 9 9.2 15Tara dev 10.86 21 7.18 145 10.36 32Dug well/Pat well 12 1 5.5 6 11.45 11GFS 12 1 12 18 10.27 58GFS cum rain water 6 4 0Rain water 6 1 3 5 0IFG 12 4 10.82 51 11.29 27IFW 12 1 11.14 28 0Lake water 12 4 12 1 0Fall water 12 2 12 2 12 5KPM supply line 12 2 12 2 0Other 12 1 9 4 0Total 11.72 15,368 10.07 5,368 10.05 1,621
DistrictBandarbanKhagrachhari Rangamati
Source: CHT Baseline Census Report (2010, Water Aid)
5.2 Khagrachhari District 5.2.1 Basic Information (1) Outline of Water Supply and Sanitation Table 5-16 shows upazila wise option wise proportion of population using improved drinking water source. According to the data, Khagrachhari Sadar Upazila has the highest proportion of population who were using improved water source and it was 85.4%, with respect to the Lakshmichhari (32.3%) and Dighinala (58.1%).
Table 5-16: Proportion of Population Using an Improved Drinking Water Source by Upazila (%)
Pipe
d in
to d
wel
ling
Pipe
d in
to y
ard
or p
lot
Publ
ic ta
p/ s
tand
pipe
Shal
low
tube
wel
l (<5
00 fe
et)
Dee
p tu
be w
ell (
500+
feet
)
Prot
ecte
d w
ell
Prot
ecte
d sp
ring
Rai
nwat
er c
olle
ctio
n
Pond
San
d Fi
lter
Bot
tled
wat
er
Unp
rote
cted
wel
l
Unp
rote
cted
spr
ing
Surf
ace
wat
er
Oth
er
Dighinala 0.3 0 0 44.4 0.6 7.6 5.3 0 0 0 31 4.6 6.2 0.1 100 58.1 2,457
Khagrachhari Sadar 2.8 0.2 0.3 75.2 4.7 2.2 0 0 0 0 8.3 5.1 1.1 0 100 85.4 3,475
Lakshmichhari 0 0 0 23.6 1.9 4.3 2.6 0 0 0 11.7 7 3.9 45 100 32.3 2,276
Mahalchhari 0.2 0 0 57.6 2.9 2.4 0.1 0 0 0 29.9 5.6 1.3 0 100 63.1 2,376
Manikchhari 0 0.2 0 70.2 2.4 4.6 0 0 0 0 18.2 2.8 1.5 0.1 100 77.4 2,539
Matiranga 0 0 1.8 64.2 3.6 2 0.4 0.2 0 0 13.6 13.8 0 0.4 100 72.2 3,520
Panchhari 0.2 0 0 62.4 3.6 4.6 0.3 0 0 0 10.2 18.2 0.4 0 100 71.2 2,178
Ramgarh 0 3.5 1 61 3.5 0.6 0.2 0.1 0 0 15 9.8 4.8 0.5 100 69.9 3,075
Upazila
Improved sources Unimproved sources
Main source of drinking water
Tota
l (%
)
Impr
oved
sou
rce
of d
rink
ing
wat
er (%
)
Num
ber
of h
ouse
hold
mem
bers
D Source: Key Findings of the Bangladesh Multiple Indicator Cluster Survey 2009 (UNICEF)

Data Collection Study on Regional Development in Southeastern Bangladesh Final Report
5-14
(2) 2011–2012 Budget of DPHE Khagrachhari Table 5-17 shows allocated budget of 2011–2012 for DPHE Khagrachhari. The total budget was about fifteen million taka and consisted of test boring, Maintenance for Urban water supply, rural water supply and sanitation.
Table 5-17: Annual Budget of DPHE, Khagrachhari for 2011–2012 Project activity Budget
1. Assessment Project Test boring, 20 nos 373,600.002. Municipality water supplydevelopment & extension project
Maintenance of 2 water supply units andassessment of 2
24,49,968.00
3. GoB Unicef Project Water supply in rural & town areas, scoolsanitation and health education
1,15,50,104.00
4. Special Rural wate supply project Installation of water sources 7,00,000.005. Public Health & water supply 2,49,824.00
Source: DPHE Khagrachhari office 5.2.2 Current Situation of Water Supply Table 5-18 shows total number of installed active water supply device by device type. With respect to STW, 12,939 STWs were found by BCR however 1,573 were registered by DPHE as actives device. There for, it is clear that a lot of private STWs were installed by own initiative. On the other hand, Ring well and Rainwater harvesting had different outcome. Value of those devices by BCR is match less than DPHE value. It will be expected that there will be a number of Ring well and Rainwater harvesting devices found abandoned after installation because no water in dry season and no one maintanain the installed water propery.
Table 5-18: Number of Existing Water Supply Devices
Data Source STWRingwell
DTW/Tara-deb/
Tara
Rain waterharvesting
GFSIFG/IFW
Other total
BCR 12,939 391 1,811 1 1 5 10 15,158
DPHE 1,573 2,133 2,106 14 0 24 0 5,850 Source: BCR: CHT Baseline Census Report (2010, Water Aid); DPHE: DPHE Khagrachhari office. 5.2.3 Result of Water Quality Test Table 5-19 shows results of water quality test in Khagrachhari District.
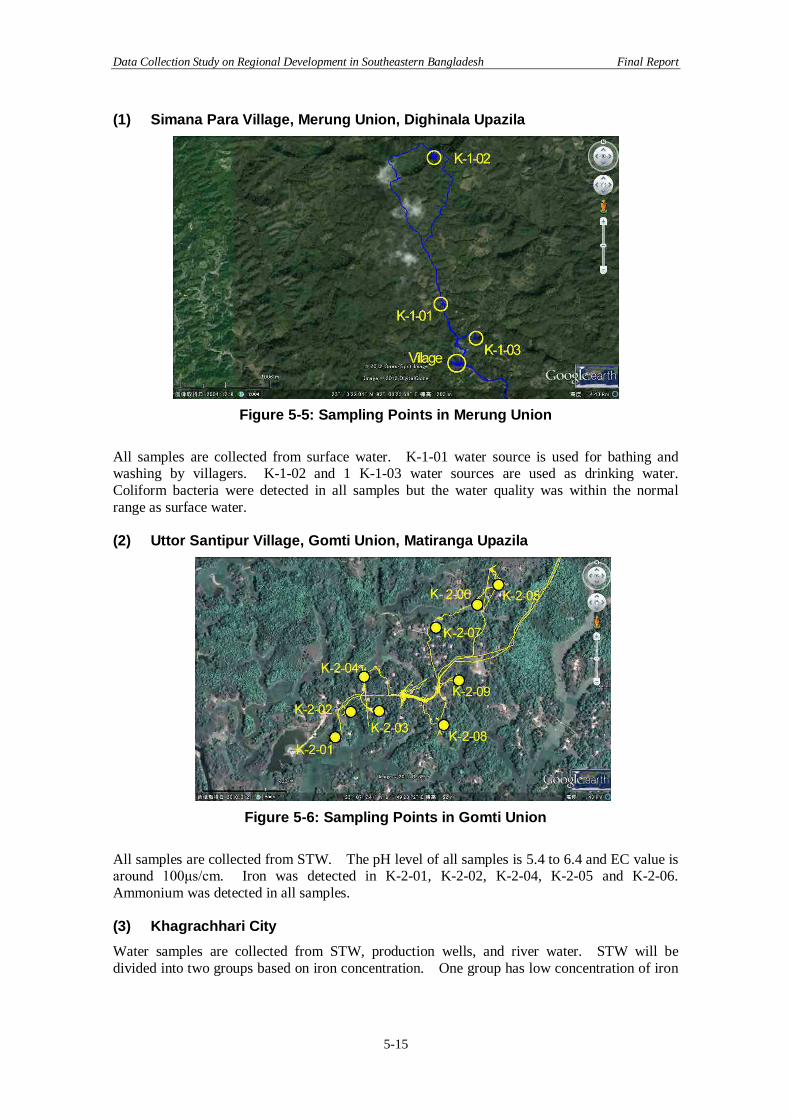
Data Collection Study on Regional Development in Southeastern Bangladesh Final Report
5-15
(1) Simana Para Village, Merung Union, Dighinala Upazila
Figure 5-5: Sampling Points in Merung Union
All samples are collected from surface water. K-1-01 water source is used for bathing and washing by villagers. K-1-02 and 1 K-1-03 water sources are used as drinking water. Coliform bacteria were detected in all samples but the water quality was within the normal range as surface water. (2) Uttor Santipur Village, Gomti Union, Matiranga Upazila
Figure 5-6: Sampling Points in Gomti Union
All samples are collected from STW. The pH level of all samples is 5.4 to 6.4 and EC value is around 100μs/cm. Iron was detected in K-2-01, K-2-02, K-2-04, K-2-05 and K-2-06. Ammonium was detected in all samples. (3) Khagrachhari City Water samples are collected from STW, production wells, and river water. STW will be divided into two groups based on iron concentration. One group has low concentration of iron

Data Collection Study on Regional Development in Southeastern Bangladesh Final Report
5-16
(K-3-02 and K-6-02) and the other has high concentration (7 to 14 mg/L) of iron (K-4-01, K-4-03, K-6-01). The pH level of this group indicated low acid.
Figure 5-7: Sampling Points in Khagrachhari City

Data Collection Study on Regional D
evelopment in Southeastern Bangladesh
Final Report
5-17
Table 5-19: Water Quality Test Results in Khagrachhari (1) Dighinala Upazila, Merung Union, Simana Para Village
ID Sampling
data
Type of water source
well depth (m) pH
EC (μS/cm)
ORP (mv)
water temp. (°C)
NO3 (mg/L)
NO2 (mg/L)
NH4 (mg/L)
Fe (mg/L)
Mn (mg/L)
As (mg/L) taste odor color turbidity
General Bacteria
Colif. Bacteria
Standards for drinking water, Bangladesh 6.5-8.5 - - - 10 <1 - 0.3–1.0 0.1 0.05 - - - - - - K-1-01 2012/1/27 Pond - 8.2 152 208 24.0 ND ND 1.0 0.5 ND ND - ammonium Brownish yellow Mild 23 132 K-1-02 2012/1/27 River - 8.4 145 238 14.3 ND ND ND ND ND ND - No odor Clear ND 32 82 K-1-03 2012/1/27 Spring - 7.4 31 138 22.6 ND ND 0.2 ND ND ND tasteless No odor light brown ND 38 18
(2) Matiranga Upazila, Gomti Union, Uttor Santipur Village
ID Sampling
data
Type of water source
well depth pH
EC (μS/cm)
ORP (mv)
water temp. (°C)
NO3 (mg/L)
NO2 (mg/L)
NH4 (mg/L)
Fe (mg/L)
Mn (mg/L)
As (mg/L) taste odor color turbidity
General Bacteria
Colif. Bacteria
K-2-01 2012/1/28 STW 21.0 6.4 105 119 24.7 ND ND 0.3 3.0 1 ND tasteless No odor Clear ND 24 0 K-2-02 2012/1/28 STW 19.8 5.9 66 227 25.1 ND ND 0.3 0.2 ND ND little iron little ammonia Clear ND 50 0 K-2-03 2012/1/28 STW 18.3 5.7 62 274 25.3 ND ND ND ND ND ND tasteless little iron Clear little 21 0
K-2-04 2012/1/28 STW 16.0 6 73 207 23.8 ND ND 0.3 0.7 ND ND tasteless Slightly ammonia Clear Slightly turbid 118 20
K-2-05 2012/1/28 STW 36.5 5.4 43 239 25.0 ND ND 0.1 0.6 ND ND tasteless Slightly iron Clear ND 52 0 K-2-06 2012/1/28 STW 16.0 5.5 48 248 25.6 1.0 ND 0.1 0.1 0.2 ND little iron No odor Clear ND 1 0 K-2-07 2012/1/28 STW 22.8 5.7 47 312 24.8 ND ND 0.1 ND ND ND tasteless No odor Clear ND 52 78 K-2-08 2012/1/28 STW 16.0 5.7 37 281 24.7 0.5 ND 0.1 ND ND ND tasteless No odor Clear ND - 0 K-2-09 2012/1/28 STW 16.0 5.9 39 318 24.8 ND ND 0.1 ND ND ND tasteless No odor Clear ND - 0
(3) Khagrachhari City
ID Sampling
data
Type of water source
well depth pH
EC (μS/cm)
ORP (mv)
water temp. (°C)
NO3 (mg/L)
NO2 (mg/L)
NH4 (mg/L)
Fe (mg/L)
Mn (mg/L)
As (mg/L) taste odor color turbidity
General Bacteria
Colif. Bacteria
K-3-01 2012/1/29 River - 7.2 104 173 19 ND ND 0.3 0.2 ND - - little Ammonia Clear little turbid 84 0
K-3-02 2012/1/29 STW 122.0 7.9 40 106 19 ND ND 0.5 ND ND - tasteless No odor Clear No turbidity 56 0
K-4-01 2012/1/30 STW 30.5 5.9 161 96 24.4 ND ND 1 14 0.5 ND tasteless Slightly iron Clear ND 84 0
K-4-02 2012/1/30 Treated of K4-03 - 7.9 158 210 21 ND ND 0.2 ND ND ND tasteless No odor Clear
little turbid 56 0
K-4-03 2012/1/30 STW - 6.6 149 54 24.3 ND ND 0.7 12 ND ND little iron Slightly iron Clear ND 63 0 K-4-04 2012/1/30 Production 46.0 6.3 115 312 25.3 4 ND ND ND ND ND tasteless No odor Clear ND 89 61 K-4-05 2012/1/30 Production 85.0 6.8 160 6 24.8 ND ND 0.7 9 ND ND - Slightly iron Clear ND 2 0 K-4-06 2012/1/30 Treated 85.0 7.5 152 189 23 0.1 ND ND ND ND - tasteless No odor Clear little 72 150 K-6-01 2012/1/31 STW 24.0 6.1 113 49 24.2 ND ND 0.5 7 ND ND little iron little ammonia Clear ND - - K-6-02 2012/1/31 STW 24.0 - - 212 25.2 ND ND 0.1 0.6 ND ND tasteless little iron Clear ND - -
K-6-03 2012/1/31 River - 7.8 176 213 22.1 ND ND 0.6 0.1 0.5 - tasteless No odor Brownish green Mild - -

Data Collection Study on Regional Development in Southeastern Bangladesh Final Report
5-18
5.3 Rangamati District 5.3.1 Basic Information (1) Outline of Water Supply and Sanitation The proportion of population using an improved drinking water source by district is 47% by BCR and 66.5% by MICS. However, by upazila Rajasthali Upazila had the highest proportion (91.9%) followed by Rangamati city (82.4%), because groundwater is a feasible option in those areas. On the other hand, Barkal had lowest proportions (25.7%), because groundwater is mostly not a feasible option. Table 5-20: Proportion of Population Using an Improved Drinking Water Source
by Upazila (%)
Pipe
d in
to d
wel
ling
Pipe
d in
to y
ard
or p
lot
Publ
ic ta
p/ s
tand
pipe
Shal
low
tube
wel
l (<5
00 fe
et)
Dee
p tu
be w
ell (
500+
feet
)
Prot
ecte
d w
ell
Prot
ecte
d sp
ring
Rai
nwat
er c
olle
ctio
n
Pond
San
d Fi
lter
Bot
tled
wat
er
Unp
rote
cted
wel
l
Unp
rote
cted
spr
ing
Surf
ace
wat
er
Oth
er
Baghaichhari 0 0.5 0.1 50 1.9 2.5 1.3 0 0 0 19.4 24.3 0 0 100 56.3 2,961Barkal 0 0 0 8.7 1.5 9.4 5.7 0 0.4 0 36.6 32.2 5.4 0 100 25.7 2,626Kaw khali (betbunia) 0.2 1.2 0 57.5 1.3 3.2 8.5 0.3 0 0 19.2 8.3 0.4 0 100 72.1 2,264Belai chhari 0 0 0 50.8 0.7 6 12.4 0 0 0 1 22.5 6.7 0 100 69.9 2,427Kaptai 4.5 1.2 15.3 32.3 0 5.1 8.1 0 0 0 9.4 4 20 0 100 66.6 2,428Jurai chhari 0 0 0 33.3 3.2 2.1 7.1 0 0 0 37.1 16.6 0.6 0 100 45.7 2,199Langadu 0.3 0 0 27.7 1.5 35.9 4.2 0 0 0 13.6 6.7 9.5 0.8 100 69.5 2,758Naniarchar 0 0.3 0 27.1 2.5 34 5.6 0 0 0 23.9 6.7 0 0 100 69.4 2,486Rajasthali 0.6 0 0 82.4 0.7 7.2 0.9 0 0 0.2 1.6 4.6 1.9 0 100 91.9 2,305
Rangamati Sadar 5.8 3.7 7.8 32.6 26 4.4 1.5 0 0 0.5 8.1 2.1 7 0.4 100 82.4 4,430
Improved sources Unimproved sources
Tota
l (%
)
Impr
oved
sou
rce
of d
rink
ing
wat
er (%
)
Num
ber
of h
ouse
hold
mem
bers
Upazila
Main source of drinking water
Source: Key Findings of the Bangladesh Multiple Indicator Cluster Survey 2009 (UNICEF)
(2) 2011–2012 Budget of DPHE Rangamati Table 5-21 shows allocated budget of 2011–2012 for DPHE Rangamati. The total budget was eight million taka, which is lowest level among CHT circles of DPHE. Of the total budget, only 2.9 million was allocated for rural water supply and no allocation for water supply devices for surface water.
Table 5-21: Annual Budget of DPHE, Rangamati for 2011–2012 Name of the Project /Development activity
Major Activities Budget in BDT Remarks
1. Boundary wall and pump house construction2. Test boring of 2 nos 38 mm dia well3. Test boring of 2 nos 38 mm dia well4. Installation of 300 x 100mm dia production well1. Site development for the water treatment plant2. Laying of 150 mm dia pipeline from Rangamatimosque to District School3. Laying of 100mm dia pipeline along DC Bunglowroad4. Laying of 100mm dia pipeline in Sornatila area5. Procurement of logistics1. Installation of Ring Well (159 Nos)2. Installation of Shallow Tara (146 Nos)3. Installation of Deep Tara (100 Nos)
80,00,000.001,62,73,881.00
82,73,881.00
Total Fund ReceivedTotal amount of Fund requested
Shortfall of Fund in the FY 2010-11
Special rural water supplyproject 29,00,000.00
Received materials supply for 225set of water technologies
Bagaichari water supplyproject
26,00,000.00
Construction of RangamatiDistrict School Reservoir andwater supply in the nearbyarea 25,00,000.00
Source: DPHE Rangamati Office

Data Collection Study on Regional Development in Southeastern Bangladesh Final Report
5-19
5.3.2 Current Situation of Water Supply Table 5-22 shows the total number of installed active water supply device by device type. With respect to STW, 1,219 STWs were found by BCR; however, 984 STWs were registered by DPHE as active devices. Therefore, it is assumed that installing STW is very difficult due to hard rock compared to ring well and rainwater harvesting. Value of those devices by BCR was less than the DPHE value. According to interviews with the Regional development council, GFS is one of the feasible water supply devices in this district.
Table 5-22: Number of Existing Water Supply Devices
Data Source STWRingwell
DTW/Tara-deb/
Tara
Rain waterharvesting
GFS IFG/IFW Other total
BCR 1,219 1,936 2,009 5 22 79 24 5,294
DPHE 984 2,997 2,639 0 0 19 0 6,639 Source: BCR: CHT Baseline Census Report (2010, Water Aid); DPHE: DPHE Khagrachhari office.
5.3.3 Result of Water Quality Test (1) Rangamati City Water samples are collected from a STW, a ring well and a purification plant for drinking water. pH levels indicated low acidity, and high concentration of nitrogen was detected in STW and ring well.
Figure 5-8: Sampling Points in Rangamati City
(2) Mogh Paravillage/ Sagu Paravillage/ Kuki ParaVillage, Bandukvanga Union,
Rangamati SadarUpazila Water samples were collected form 7 springs and 2 STWs. All springs and STWs indicated pH levels of low acid (5.8 to 6.6). Low level ammonia was detected in all water samples. High concentration of iron was detected in R-2-08.

Data Collection Study on Regional Development in Southeastern Bangladesh Final Report
5-20
Figure 5-9: Sampling Points in Bandukvanga Union
(3) Kaptai Lake All samples were collected from Kaptai Lake. Water quality indicated normal levels. The pH level was 7.2 to 7.9 and EC was around 100μg/L. Coliform Bacteria was not detected in center of Kaptai Lake (R-2-11). However, nitrogen and high concentration of Coliform Bacteria was detected in R-2-12 sampling point from the Rangamati city side.
Figure 5-10: Sampling Points in Kaptai Lake
(4) Barogonia Tonchangya Para Village, Chandraghona Union, Kaptai Upazila Water samples were collected from tow ring wells, tow STWs and tow springs. STWs and springs had medium level of EC. Only springs had high concentration of Coliform Bacteria. Other water quality results were of normal levels.

Data Collection Study on Regional Development in Southeastern Bangladesh Final Report
5-21
Figure 5-11: Sampling Points in Chandraghona Union

Data Collection Study on Regional D
evelopment in Southeastern Bangladesh
Final Report
5-22
Table 5-23: Water Quality Test Results in Rangamati District (1) Rangamati City
ID Sampling
data
Type of water source
well depth (m) pH
EC (μS/cm)
ORP (mv)
water temp. (°C)
NO3 (mg/L)
NO2 (mg/L)
NH4 (mg/L)
Fe (mg/L)
Mn (mg/L)
As (mg/L) taste odor color turbidity
General Bacteria
Colif. Bacteria
Standards for drinking water, Bangladesh 6.5–8.5 - - - 10 <1 - 0.3–1.0 0.1 0.05 - - - - - - R-1-02 2012/2/2 STW 20 5.9 121 204 24.4 10 ND 0.4 0.4 ND ND tasteless little Ammonia Clear ND 43 0 R-1-03 2012/2/2 DW 20 5.3 152 289 26.5 45 ND 0.1 ND ND ND tasteless No odor Clear ND 50 180 R-1-04 2012/2/2 PWSS - 7.4 116 242 26.4 0.7 ND 0.1 0.2 ND - tasteless No odor Clear ND 57 287 R-1-05 2012/2/2 PWSS - 7.4 111 236 22.5 0.4 ND 0.7 ND ND - tasteless No odor Clear little turbid 64 109
(2) Mogh Paravillage/ Sagu Paravillage/ Kuki ParaVillage, BandukvangaUnion, Rangamati SadarUpazila
ID Sampling
data
Type of water source
well depth (m) pH
EC (μS/cm)
ORP (mv)
water temp. (°C)
NO3 (mg/L)
NO2 (mg/L)
NH4 (mg/L)
Fe (mg/L)
Mn (mg/L)
As (mg/L) taste odor color turbidity
General Bacteria
Colif. Bacteria
R-2-01 2012/2/4 Spring - 6.3 93 241 21.4 ND ND 0.2 ND ND ND tasteless No odor Clear ND 137 12 R-2-03 2012/2/4 Spring - 6.3 107 268 21.8 ND ND 0.2 ND ND ND tasteless No odor Clear ND 199 0 R-2-04 2012/2/4 Spring - 6.3 186 282 22.9 0.5 ND 0.1 ND ND ND tasteless No odor Clear ND 92 0 R-2-05 2012/2/4 Spring - 6.3 230 266 20.8 0.5 ND 0.1 ND ND ND - little Ammonia Clear ND 118 107 R-2-06 2012/2/4 Spring - 5.8 61 275 22.7 ND ND 0.3 ND ND - tasteless little Ammonia Clear ND 106 98 R-2-07 2012/2/4 Spring - 6.1 82 289 22.6 ND ND 0.2 0.1 ND - tasteless little Ammonia Clear ND 49 15 R-2-02 2012/2/4 STW - 6.6 105 137 24.9 1.5 ND 0.3 0.7 ND ND little iron little iron Clear ND 0 0 R-2-08 2012/2/4 STW 21 6.4 138 15 26.1 ND ND 0.9 20.0 ND ND Iron Iron Clear ND 6 0
(3) Kaptai Lake
ID Sampling
data
Type of water source
well depth (m) pH
EC (μS/cm)
ORP (mv)
water temp. (°C)
NO3 (mg/L)
NO2 (mg/L)
NH4 (mg/L)
Fe (mg/L)
Mn (mg/L)
As (mg/L) taste odor color turbidity
General Bacteria
Colif. Bacteria
R-3-01 2012/2/5 DW 12.2 6.8 300 87 24 0.2 ND 0.8 0.6 ND ND little iron little iron Clear little turbidity 9 0 R-3-02 2012/2/5 STW 61 7.7 510 103 25.6 ND ND 1.5 1.0 ND ND little iron little iron Clear very little turbidity 0 0 R-3-03 2012/2/5 Spring 6.7 200 210 21.2 ND ND 0.2 ND ND - tasteless No odor Clear little turbidity 82 138
R-3-04 2012/2/5 STW 61 8.7 750 4 25.4 ND ND 1.0 0.1 ND ND tasteless Ammonia Clear Very little turbidity 42 39
R-3-05 2012/2/5 DW 12.2 6.8 570 50 25.9 ND ND 0.3 0.8 ND ND tasteless No odor Clear ND 16 153 R-3-06 2012/2/5 Spring 12.2 6.8 166 193 20.9 ND ND ND ND ND - tasteless No odor Clear ND 103 180
R-3-07 2012/2/5 STW 60 8.0 370 25 25.1 ND ND 0.2 0.1 ND ND tasteless little ammonia Clear
Very little turbidity 25 0
R-3-08 2012/2/5 DW 13 6.8 250 113 24.2 ND ND 0.2 0.2 ND ND tasteless No odor Clear ND 36 180
(4) Barogonia Tonchangya Para Village, Chandraghona Union, Kaptai Upazila
ID Sampling
data
Type of water source
well depth (m) pH
EC (μS/cm)
ORP (mv)
water temp. (°C)
NO3 (mg/L)
NO2 (mg/L)
NH4 (mg/L)
Fe (mg/L)
Mn (mg/L)
As (mg/L) taste odor color turbidity
General Bacteria
Colif. Bacteria
R-1-01 2012/2/2 Lake 7.5 106 225 21.3 0.5 ND 0.1 ND ND - - No odor Clear ND 87 124 R-2-09 2012/2/4 Lake - 7.4 107 169 24.4 ND ND 0.6 ND ND - - little Ammonia greenish little turbidity 21 120 R-2-10 2012/2/4 Lake - 7.9 97 229 22.7 ND ND 0.2 ND ND - - No odor Clear ND 0 1 R-2-11 2012/2/4 Lake - 7.9 97 239 23.8 ND ND 0.2 ND ND - - No odor Clear ND 5 0 R-2-12 2012/2/4 Lake - 7.2 103 265 23.4 1.5 ND 0.6 ND ND - - No odor Clear ND 82 87

Data Collection Study on Regional Development in Southeastern Bangladesh Final Report
5-23
5.4 Bandarban District 5.4.1 Basic Information (1) Water Supply and Sanitation The proportion of population using an improved drinking water source by District was 48% by BCR and 67.8% by MICS. However, by upazila, Lama Upazila had the highest proportion (71.6%), because this area is able to use groundwater. On the other hand, Tanchi Upazila had the lowest proportion (37.9%), because groundwater is mostly not feasible. In the case of Ruma Upazila, there is a distinguishing characteristic that 50.6% of the total population is using Protected Spring. Table 5-24: Proportion of Population Using an Improved Drinking Water Source
by Upazila (%)
Pipe
d in
to d
wel
ling
Pipe
d in
to y
ard
or p
lot
Publ
ic ta
p/ s
tand
pipe
Shal
low
tube
wel
l (<5
00 fe
et)
Dee
p tu
be w
ell (
500+
feet
)
Prot
ecte
d w
ell
Prot
ecte
d sp
ring
Rai
nwat
er c
olle
ctio
n
Pond
San
d Fi
lter
Bot
tled
wat
er
Unp
rote
cted
wel
l
Unp
rote
cted
spr
ing
Surf
ace
wat
er
Oth
er
Alikadam 6.8 3.8 8.8 9.1 11.7 13 3.4 0 0 0 6.9 0 36.4 0 100 56.7 2,583Bandarban Sadar 3.6 4.7 9.9 20.8 11.4 22.5 4.1 0.1 0.1 0 2.2 0.1 18.2 2.2 100 77.3 4,509Lama 0 0.3 1.1 59.7 9.4 2.5 4.1 0.1 0.8 0 4 4.8 12.6 0.4 100 78.1 3,152Naikhongchhari 3.2 0.7 2.9 17.6 20.1 16.2 2.4 0 0 0.3 8.4 13.5 13.9 0.8 100 63.5 2,641Row angchhari 0 8.7 3.7 13.4 1.1 5.6 21.2 0 0 0 0 10 36.3 0 100 53.7 2,275Ruma 0 0.1 5.6 0.6 0.7 7 50.6 0 0 0 0 12.1 22.3 0.9 100 64.5 2,468Thanchi 0 0.3 4.4 0.4 1.3 12 18.4 0.6 0 0.4 0 9.4 47.1 5.6 100 37.9 2,285
Upazila
Main source of drinking water
Tota
l (%
)
Impr
oved
sou
rce
of d
rink
ing
wat
er (%
)
Num
ber
of h
ouse
hold
mem
bersImproved sources Unimproved sources
Source: Key Findings of the Bangladesh Multiple Indicator Cluster Survey 2009 (UNICEF)
(2) 2011–2012 Budget of DPHE, Bandarban Table 5-25 shows allocated budget of 2011–2012 for DPHE Bandarban. The total budget was hundred three million taka, which is the highest amount among CHT circle, DPHE. One peculiarity of the budget is that GOB–UNICEF project allocated construction cost for GFS.
Table 5-25: Annual Budget of DPHE, Bandarban for 2011–2012 Name of the Project /Development activity
Major Activities Budget in BDT
1. Ring Well, 74 Nos 7,077,8782. Deep Tube Well, 60 nos 3,621,4803. GFS, 19 Nos 38,000,0004. Stairs for water collection, 20 nos 639,9825. Ring Well repair, 95 nos 2,020,650
total 51,359,9901. Water treatment plant, 1 nos 15,000,0002. Water treatment plant partial, 1 no 5,000,0003. Test well, 04 nos 348,0004. Production well, 2 nos 2,835,6225. Booster station, 2 nos 5,000,0006. Deep Tube well, 10 nos 1,000,000
total 29,183,6221. Installation of Ring Well (120 Nos) 11,616,4802. Deep Tube Well 9,804,248total 21,420,728
1. Latrine production by dphe manpower, 1400 set 966,9052. Latrine supply by Contractor, 630 set 519,211
tatol 1,486,116103,450,456
National Sanitationprogramme
Special rural water supplyproject
GoB Unicef Project
MoCHTA special allocation
Source: DPHE Bandarban office

Data Collection Study on Regional Development in Southeastern Bangladesh Final Report
5-24
5.4.2 Current Situation of Water Supply Table 5-26 shows total number of installed active water supply device by device type. With respect to STWs, 501 STWs were found by BCR; however, 961 were registered by DPHE as active devices. Therefore, it is expected that installing STW is very difficult due to hard rock. For ring well and rainwater harvesting, the value of those devices by BCR was less than that of DPHE.
Table 5-26: Number of Existing Water Supply Devices
Data Source STW Ring wellDTW/
Tara-deb/Tara
Rain waterharvesting
GFS IFG/IFW Other total
BCR 501 673 416 0 43 17 31 1,681
DPHE 961 2,209 2,052 39 53 10 0 5,324 Source: BCR: CHT Baseline Census Report (2010, Water Aid); DPHE: DPHE Khagrachhari office.
5.4.3 Result of Water Quality Test (1) Bandarban City Table 5-27 shows results of water quality test. Water samples were collected from ponds, springs, rivers, STWs and ring wells in Bandarban city. Pond water was highly contaminated by Coliform Bacteria. River water quality was determined from samples from Sang River, which had clear water and quality indicated normal levels. One ring well (B-3-04) was highly contaminated by nitrate. Another STW (B-3-01) contained iron and manganese.
Figure 5-12: Sampling Points of Bandarban City
(2) Senior Para Village, Sadar Union, Bandarban Sadar Upazila Table 5-27 shows results of water quality test. All samples were collected from the side stream of Sang River. Result of the water quality test showed very low levels of ammonia in all samples. Other water quality item indicated normal conditions.

Data Collection Study on Regional Development in Southeastern Bangladesh Final Report
5-25
Figure 5-13: Sampling Points of Sadar Union
(3) Moddhyam Para/ Ranglai Headman Para/ Sing Song Para/ Moddhyam Para,
Swalock Union, Bandarban Sadar Upazila Table 5-27 shows results of water quality test. Water samples were collected from stream water and supplied water by GSFs. All stream water indicated normal water quality as surface water. Nitrate was detected in B-4-07 and Coliform bacteria were detected in all samples.
Figure 5-14: Sampling Points in Swalock Union

Data Collection Study on Regional D
evelopment in Southeastern Bangladesh
Final Report
5-26
Table 5-27: Water Quality Test Result in Bandarban District (1) Bandarban City
ID Sampling
data Type of water source
well depth (m) pH
EC (μS/cm)
ORP (mv)
water temp. (°C)
NO3 (mg/L)
NO2 (mg/L)
NH4 (mg/L)
Fe (mg/L)
Mn (mg/L)
As (mg/L) taste odor color turbidity
General Bacteria
Colif. Bacteria
Standards for drinking water, Bangladesh 6.5–8.5 - - - 10 <1 -
0.3–1.0 0.1 0.05 - - - - - -
B-1-01 2012/2/8 Pond - 9.1 460 184 25.5 ND ND 0.3 0.1 ND - - Little Amonia Not clear
High turbidity 101 395
B-1-02 2012/2/8 GFS (source B-01-02), Tap - 7.9 260 268 25.4 ND ND 0.1 0.1 ND - tasteless No odor Clear ND 50 260
B-1-03 2012/2/8 River (outlet of supply pipe) - - - - - - - - - - - - No odor Clear ND 10 94
B-3-01 2012/2/10 STW 55 5.8 380 125 25.3 ND ND 0.2 5.0 2.0 ND tasteless Little amonia Clear ND 40 0 B-3-02 2012/2/10 River - 8.2 260 178 23.3 ND ND 0.1 ND ND - - No odor Clear ND 40 38 B-3-03 2012/2/10 PWSS (treated wateer) - 8.0 270 227 22.7 ND ND 0.1 0.1 ND - tasteless No odor Clear ND 113 105 B-3-04 2012/2/10 DW 5 6.3 280 341 24.6 60 0.04 0.1 ND ND - - No odor Clear ND 52 89 B-3-05 2012/2/10 STW 27 7.9 300 136 26.2 ND ND 0.1 ND ND ND tasteless No odor Clear ND 0 0 B-3-06 2012/2/10 Spring - 6.6 200 258 23.1 ND ND 0.1 ND ND - tasteless No odor Clear ND 16 16 B-3-07 2012/2/10 DW 5 6.8 220 253 23.2 0.3 ND 0.1 0.1 ND - - Little Iron Clear ND 25 254
(2) Senior ParaVillage, SadarUnion, Bandarban Sadar Upazila
ID Sampling
data
Type of water source
well depth (m) pH
EC (μS/cm)
ORP (mv)
water temp. (°C)
NO3 (mg/L)
NO2 (mg/L)
NH4 (mg/L)
Fe (mg/L)
Mn (mg/L)
As (mg/L) taste odor color turbidity
General Bacteria
Colif. Bacteria
B-2-01 2012/2/9 Spring - 7.7 79 197 19.5 ND ND 0.2 0.1 ND - tasteless No odor Clear ND 51 88 B-2-02 2012/2/9 Spring - 7.9 79 230 24 ND 0.02 0.2 0.3 ND - - No odor Clear ND 18 72 B-2-03 2012/2/9 Spring - 7.0 48 254 18.3 ND ND 0.1 ND ND - - No odor Clear ND 29 46 B-2-04 2012/2/9 Spring - 7.7 145 216 21.5 ND ND 0.1 0.1 ND - - No odor Clear ND 23 175 B-2-05 2012/2/9 Spring - 7.9 139 209 21.8 ND ND 0.2 0.1 ND - - No odor Clear ND 99 310
(3) Moddhyam Para/ Ranglai Headman Para/ Sing Song Para/ Moddhyam Para, Swalock Union, Bandarban Sadar Upazila
ID Sampling
data Type of water source
well depth (m) pH
EC (μS/cm)
ORP (mv)
water temp. (°C)
NO3 (mg/L)
NO2 (mg/L)
NH4 (mg/L)
Fe (mg/L)
Mn (mg/L)
As (mg/L) taste odor color turbidity
General Bacteria
Colif. Bacteria
B-4-01 2012/2/11 Spring - 8.4 270 254 21.4 ND ND ND ND ND - - No odor Clear Very little turbidity 91 105
B-4-02 2012/2/11 Spring - 7.7 135 46 19 ND ND 0.5 0.3 ND - - Little iron Clear ND 29 87 B-4-03 2012/2/11 Spring - 7.9 153 228 22.8 ND ND 0.1 ND ND - - No odor Clear ND 10 157 B-4-04 2012/2/11 Spring - 8.2 186 236 20.9 ND ND ND ND ND - tasteless No odor Clear ND 43 149 B-4-05 2012/2/11 GFS (source B-04-03) - 8.2 155 226 26.7 ND ND 0.1 ND ND - - No odor Clear ND 56 228 B-4-06 2012/2/11 GFS (source B-04-01) - 8.1 260 219 21 ND ND 0.1 ND ND - - No odor Clear ND 73 147
B-4-07 2012/2/11 GFS (source B-04-02), direct - 7.7 136 369 32.1 1 ND 0.1 ND ND - - No odor Clear ND 29 104
B-4-08 2012/2/11 GFS (source B-04-02), Tap 01 - 7.9 137 253 20.1 ND ND 0.1 ND ND - - No odor Clear ND 5 99
B-4-09 2012/2/11 GFS (source B-04-02), Tap 02 - 7.9 138 256 20.9 ND ND 0.1 ND ND - - No odor Clear ND 169 56

Data Collection Study on Regional Development in Southeastern Bangladesh Final Report
5-27
5.5 Cox’s Bazar District 5.5.1 Basic Information (1) Outline of Water Supply and Sanitation The proportion of the population using an improved drinking water source by District is 96.6% by MICS. However, by upazila Teknaf Upazila had lowest proportion (90.1%) followed by Moheshkhali Upazila (94.1%). In case of Teknaf Upazila, there is hard rock area that is not suitable for installing tube well and ring well. In case of Moheshkhali Upazila, groundwater samples indicated salinity. A feasibility survey for a small dam development project was completed by UNICEF. According to the report, a small dam is feasible with 2.5 million US dollar as construction cost. If the small dam functions properly, it can supply water to the entire Teknaf Upazila. As for urban water supply, Cox’s Bazar City and Chakaria City have pipe water supply systems which were installed by DPHE and operated by Pourashabva. In case of Cox’s Bazar, water supply capacity is much less than demands, because of rapid development of new hotels and growth of population. In addition, large consumption of groundwater caused a drawdown of water level. It is known that a part of Ukia Upazila has arsenic contaminated tube wells.
Table 5-28: Proportion of Population Using an Improved Drinking Water Source by Upazila (%)
Pipe
d in
to d
wel
ling
Pipe
d in
to y
ard
or p
lot
Publ
ic ta
p/ s
tand
pipe
Shal
low
tube
wel
l (<5
00 fe
et)
Dee
p tu
be w
ell (
500+
feet
)
Prot
ecte
d w
ell
Prot
ecte
d sp
ring
Rai
nwat
er c
olle
ctio
n
Pond
San
d Fi
lter
Bot
tled
wat
er
Unp
rote
cted
wel
l
Unp
rote
cted
spr
ing
Surf
ace
wat
er
Oth
er
Chakaria 7.6 10.9 7 71.9 0.8 0.4 0.2 0 0 0 0.2 0 0.2 0.7 100 98.9 4,037Cox's Bazar Sadar 12.1 15.3 5.3 46 18.3 0.1 0.5 0 0 0.2 0 0.6 0.3 1.2 100 97.8 3,716Kutubdia 0.3 4.4 1.3 51.9 37.1 3.1 0 0 0 0 1.4 0 0 0.5 100 98.2 2,759Maheshkhali 6.8 16.2 3.8 53.1 13.2 0.8 0.2 0 0 0 0.3 0.1 0 5.5 100 94.1 3,592Pekua 10.8 4.7 10.9 26.8 46.5 0 0 0 0 0 0.3 0 0 0 100 99.7 2,705Ramu 0.4 2.3 0 89.6 1.2 1.6 1.2 0 0 0 0 0 3.9 0 100 96.1 3,108Teknaf 5.3 4.3 8.2 66.9 2.6 2.9 0 0 0 0 2.1 3.8 1.7 2.3 100 90.1 3,632
Ukhia 0.6 7.6 0.7 83.4 3.6 2.2 0 0 0 0 0.3 0 0.7 0.9 100 98 2,855
Improved sources Unimproved sources
Tota
l (%
)
Impr
oved
sou
rce
of d
rink
ing
wat
er (%
)
Num
ber
of h
ouse
hold
mem
bers
Upazila
Main source of drinking water
Source: Key Findings of the Bangladesh Multiple Indicator Cluster Survey 2009 (UNICEF) (2) 2011–2012 Budget of DPHE, Cox’s Bazar Table 5-29 shows the allocated budget of 2011–2012 for Cox’s Bazar. The total budget was 12.5 million taka consisting of test installation of 75 STWs, 175 DTWs, 20 Deep Taras and 5 Shallow Taras.

Data Collection Study on Regional Development in Southeastern Bangladesh Final Report
5-28
Table 5-29: Annual Budget of DPHE, Cox’s Bazar for 2011–2012
Name of the Project / Development activity Major Activities Budget in BDT
1. Shallow Tube Well, 75 Nos2.Deep Tube Well, 175 nos3.Deep Tara, 20 Nos4.Shallow Tara, 5 Nos
(Total 275 Nos)Municipality pipeline extension 4 km extension (GoB) --
Special rural water supply project 12,500,000
Source: DPHE Cox’s Bazar office
5.5.2 Current Situation of Water SupplyTable 5-30 shows the number of installed active water supply devices by DPHE. According to the information, STW is the dominant drinking water source followed by DTW. Depending on groundwater level, Tara Deep will be selected.
Table 5-30: Number of Existing Active Water Supply Devices
Source: DPHE Cox’s Bazar office
5.5.3 Result of Water Quality Test (1) Cox’s Bazar City Table 5-31 (1) shows the results of water quality test in Cox’s Bazar District. Water samples are collected from rivers, STWs and DTWs.
River water samples were collected from the upstream and downstream of a rubber dam in Bakkhali River. Downstream water had high salinity levels (1.1%) because of its location in a tidal zone. However, the EC value of upstream water is only 330 μs/cm. In the case of STWs, high concentration of EC was detected in C-1-03 and C-3-09, where it is a coastal area.

Data Collection Study on Regional Development in Southeastern Bangladesh Final Report
5-29
Figure 5-15: Sampling Points in Cox’s Bazar City
(2) Kutupalong Village, Raja Palong Union, Ukhiya Upazila Table 5-31 (2) shows results of water quality test in Raja Palong Union. Water samples were collected from a pond, a river and 6 STWs. Results of water quality test, pond water and river water indicated normal characteristics. Coliform bacteria were detected in both samples. In case of STW, high concentration of iron was detected in C-2-01, C-2-02, C-2-04 and C-2-10. Arsenic contamination was detected in C-2-10.
Figure 5-16: Sampling Points in Raja Palong Union

Data Collection Study on Regional Development in Southeastern Bangladesh Final Report
5-30
Figure 5-17: Sampling Points in Holodia Palong
(3) Mata Vanga Village, Bahar Chara Union, Teknaf Upazila Table 5-31 (3) shows results of water quality test in Bahar Chara Union. Water samples were collected from the river, IFG, STW and 2 ring wells. Results of water quality test, 2 IFG showed high levels of EC (above 1300μS/cm). Other items indicated normal levels. Coliform bacteria were detected in ring wells and river water.
Figure 5-18: Sampling Points in Bahar Chara Union

Data Collection Study on Regional D
evelopment in Southeastern Bangladesh
Final Report
5-31
Table 5-31: Water Quality Test Results in Cox’s Bazar District (1) Cox’s Bazar City
ID Sampling
data
Type of water source
well depth (m) pH
EC (μS/cm)
ORP (mv)
water temp. (°C)
NO3 (mg/L)
NO2 (mg/L)
NH4 (mg/L)
Fe (mg/L)
Mn (mg/L)
As (mg/L) taste odor color turbidity
General Bacteria
Colif. Bacteria
Standards for drinking water, Bangladesh 6.5–8.5 - - - 10 <1 - 0.3–1.0 0.1 0.05 - - - - - - C-1-01 2012/2/13 River - 8.7 330 221 21.8 ND ND 0.1 ND ND - - No odor Clear ND 8 249
C-1-02 2012/2/13 River - 7.8 1.1% (+) 209 22.6 0.5 0.09 0.5 0.1 ND - - No odor Clear ND 178 148
C-1-03 2012/2/13 STW 12 7.0 800 112 25.3 ND ND 0.4 15.0 0.25 ND Iron Little iron & amonia Clear ND 53 0
C-1-04 2012/2/13 STW 36.5 7.2 250 49 25.7 ND ND 0.3 2.0 ND ND tasteless Little iron Clear ND 0 0 C-1-05 2012/2/13 DW 91 7.3 260 71 26 ND ND 0.2 1.2 ND ND tasteless Little amonia Clear ND 23 0 C-3-09 2012/2/15 DTW - 7.9 650 60 25.8 ND ND ND ND ND ND Tastless No odder Clear ND 2 0
(2) Kutupalong Village, Raja Palong Union, Ukhiya Upazila
ID Sampling
data
Type of water source
well depth (m) pH
EC (μS/cm)
ORP (mv)
water temp. (°C)
NO3 (mg/L)
NO2 (mg/L)
NH4 (mg/L)
Fe (mg/L)
Mn (mg/L)
As (mg/L) taste odor color turbidity
General Bacteria
Colif. Bacteria
C-2-01 2012/2/14 STW 43 6.1 101 116 25.7 ND ND 0.2 10.0 ND ND Little iron Little iron Clear ND 30 0 C-2-02 2012/2/14 STW 33 6.3 160 7 25.7 ND ND 0.3 9.0 ND ND Little iron Little iron Clear ND 27 0
C-2-03 2012/2/14 Pond - 7.0 65 247 21.3 ND ND 0.1 ND ND - - No odor Not clear
Little turbidity 70 107
C-2-04 2012/2/14 STW 51.8 6.3 166 12 25 ND ND 0.3 10.0 ND ND Little iron Little iron & amonia Clear ND 50 140
C-2-05 2012/2/14 River - 7.0 70 261 23.5 ND ND 0.1 ND ND - - No odor Not clear
Little turbidity 76 122
C-2-08 2012/2/14 STW 15 7.8 520 340 25.6 1 ND 0.1 0.5 ND ND tasteless No odor Clear ND 1 0
C-2-09 2012/2/14 STW 7 5.4 139 329 23.8 0.2 ND 6.0 2.0 ND ND tasteless Little amonia Clear ND 14 0
C-2-10 2012/2/14 STW 7 5.9 138 70 25 ND ND 0.5 18.0 ND 0.025 - Little iron Clear ND 12 0
(3) T(3) Mata Vanga Village, Bahar Chara Union, Teknaf Upazila
ID Sampling
data
Type of water source
well depth (m) pH
EC (μS/cm)
ORP (mv)
water temp. (°C)
NO3 (mg/L)
NO2 (mg/L)
NH4 (mg/L)
Fe (mg/L)
Mn (mg/L)
As (mg/L) taste odor color turbidity
General Bacteria
Colif. Bacteria
C-3-01 2012/2/15 River - 8.4 480 242 20.8 ND ND 0.1 ND ND - - No odor Clear ND 71 74 C-3-02 2012/2/15 DW 8.5 7.0 580 259 25.5 ND ND 0.1 ND ND - tasteless No odor Clear ND 52 174 C-3-03 2012/2/15 IFG - 7.0 660 119 23.6 2 ND 0.1 0.2 0.5 - tasteless No odor Clear ND 24 0 C-3-04 2012/2/15 STW 9 7.2 580 157 26.1 5 0.01 0.1 ND ND ND - No odor Clear ND 4 0 C-3-05 2012/2/15 River - 7.9 620 199 21.2 ND ND 0.1 ND ND - - No odor Clear ND 44 2 C-3-06 2012/2/15 IFG - 7.7 1350 42 21.7 ND ND 0.1 ND ND - Taste salt No odor Clear ND 36 7 C-3-07 2012/2/15 DW 12 7.0 440 25 25.4 0.5 ND 0.1 3.0 ND ND Little iron Little iron Clear ND 11 62 C-3-08 2012/2/15 IFG - 8.1 1450 60 27.5 ND ND 0.4 1.5 2 - Little iron Little amonia Clear ND 9 0

Data Collection Study on Regional Development in Southeastern Bangladesh Final Report
5-32
5.6 Characteristics and Challenges of Local Industries in CHT and CXB
(1) CHT Area The following four categories are used for consideration of rural water supply in CHT areas.
1) Flat land along a main river or tributary 2) Low hills 3) High hills 4) Lake side or coastal area
1) Flat land along a main river or tributary
In the northern part of flat lands in CHT (Khagrachhari, part of Rangamati), most of the area has the possibility of using groundwater, especially Khagrachhari district. Whereas the southern part of CHT (Bandarban, part of Rangamati), there is narrow, flat land and hard rock; therefore there is the possibility to install tube wells but it is costly compared with plain land.
2) Low hills There are several types of water source (STW, Ring well, Tara pump, spring, River). Therefore, residents of these areas are able to access water sources. The problem is access during the rainy season due to the changing water height between residential area and water source.
3) High hills Residents of these areas face the problem of collecting water and most of the residents are not able to reach improved water source. The reason is that water source is located at a lower elevation than the residential area and conditions of roads connecting to the main road are not good. If the water source is located above the residential area, GFS is one water supply device option. Bandarban district, part of Rangamati, is a feasible area for this; otherwise, developing new technology is needed.
4) Lake area Water source of lake depends on the above mentioned land types. For residents near Kaptai Lake, the lake water is available for use.
(2) CXB Area 97% of the population in the CXB area already has improved safe water, so problem areas are very limited. One problem area is a part of Teknaf Upazila due to hard rock. Another problem area is Moheshkhali Upazila due to groundwater salinity. According to the above issues, development of a rural water supply plan with scientific surveys as well as new technology for high hill areas is needed. Table 5-32 shows points to be considered for rural water supply by area category.

Data Collection Study on Regional Development in Southeastern Bangladesh Final Report
5-33
Table 5-32: Point of Consideration for Rural Water Supply
Land Category CHT CXB Flat Land Located besides a main river
STW, DTW, Ring Well are feasible Located besides a main river STW, DTW, Ring Well are feasible
Southern part of CHT is narrower than Northern part of CHT
Arsenic in groundwater is detected in a part of Ukiya Upazila
Valleys & Low Hills
Tributary area, Groundwater, spring, pond and mini dam are possibilities. Relatively close to a water source
Tributary area, Groundwater, spring, pond and mini dam are possibilities. Relatively close to a water source. Little height difference compared with CHT area
Surface water has bio-contamination risk If residential area is located on a low hill, need to go downhill for water collection. Decrease of water volume in dry season.
Surface water has bio-contamination risk Decrease of water volume in dry season. Need watershed management.
High Hills GFS is one of feasible water supply device options if residential area is located below water source level.
No information
If residential area is located above water source level, need go down to water source for a long distance. Decrease of water volume in dry season. Bad road conditions in rainy season This is no option to supply water presently and need to develop new technology.
Lake side or Coastal area
Use Kaptai Lake water. STW, DTW, Ring Well are feasible.
STW, DTW, Ring Well are feasible GFS, IFG are also feasible.
Difference of lake water level between dry season and rainy season.
Part of groundwater is saline. Decrease of water volume in dry season for GFS and IFG.

Data Collection Study on Regional Development in Southeastern Bangladesh Final Report
5-34

Data Collection Study on Regional Development in Southeastern Bangladesh Final Report
6-1
6. Possible Cooperation Framework
6.1 Direction and Approach CHT is steep hilly area and CXB is narrow area between hill and sea. This geographical condition leads to insufficient public service delivery in the area. Improvement of linkage between government agencies and villagers is required to thrust dynamic regional development activities as a collective endeavor of both government and the people in the area. Active utilization of Union Development Coordination Committee Meeting (UDCCM) could be one way to facilitate the linkage. Such endeavor for regional development being made as so far is reviewed in Chapter 2. However, it is not enough to address the issues in CHT and CXB, especially deforestation and access to safe drinking water which are the urgent issues in CHT. Likewise, sound utilization of natural resources is the important issue in CXB. Because poverty is prevailing in both CHT and CXB, upgrading livelihoods is considered to be the key issue to sustain any development endeavor. Therefore, improvement of livelihood could be the basis of natural resource management in both CHT and CXB, which includes income generating activities and construction of community infrastructure. Considering the above, sustainable regional development plan is needed at district level based on objective data. The possible direction and approach are shown as below: Direction
CHT CXB
Steep hilly area
Deforestation
Insufficient public services
Needs for safe drinking water
Needs for natural resource management with diversity of
the society in the area
Narrow area between hill and sea
Uncoordinated development
Sustainable retional development focusing on the values of the area
SATOYAMA Inisiative

Data Collection Study on Regional Development in Southeastern Bangladesh Final Report
6-2
Initiation of the Satoyama Initiative To tackle this critical issue, the Ministry of the Environment of Japan and the United Nations University Institute of Advanced Studies (UNU-IAS) jointly initiated the Satoyama Initiative. This international effort promotes activities consistent with existing fundamental principles including the Ecosystem Approach. Our core vision is to realise societies in harmony with nature, that is, built on positive human-nature relationships.
With the launch of the International Partnership for the Satoyama Initiative at the Tenth Meeting of the Conference of the Parties (COP10) to the Convention on Biological Diversity in October 2010, we intend to officially establish an international platform to accelerate our efforts. The Satoyama Initiative is expected to contribute significantly to achieving the three objectives of the Convention.
Source : http://satoyama-initiative.org/en/about-2/
Approach
6.2 Possible Steps It is ideal to dispatch JICA cooperation preparation mission to confirm the cooperation framework and technical feasibility. However, it is preferable to make quick start of development intervention utilizing the following scheme because the dispatchment of the mission might take time and the issues to be addressed are rather urgent.
• Grant Assistance for Grassroots and Human Security Projects • Japan Overseas Cooperation Volunteers • JICA Partnership Program (Grassroots technical cooperation project)
Theme 1: Divesified income generation
Theme 2: Safe drinking water developemnt
Theme 3: Community infrastructure development
Theme 4: Enhancement of linkage among stakeholders

Annex Result of Water Quality Test

Data Collection Study on Regional Development in Southeastern Bangladesh Final Report
A-1
ID Date
Location Data water source water quality
District Upazila Union Village Latitude Longitude House Owner
Number of HH
(person) well
depth
Type of
water source pH
EC (μS/cm) ORP
water temp. (℃)
NO3 (mg/L)
NO2 (mg/L)
NH4 (mg/L)
Fe (mg/L)
Mn (mg/L)
As (mg/L) taste odor color turbidity
General Bacteria
Colif. Bacteria
Standards for drinking water, Bangladesh 6.5–8.5 – – – 10 <1 – 0.3–1.0 0.1 0.05 – – – – – –
Standards for drinking water, WHO – – – – 50 3 – – 0.4 0.01 – – – – – – K-1-01 27-Jan-12 Khagrachhari Dighinala Merung Simana Para
23°13′9.44″N 92°00′41.03″E Community – – Pond 8.2 152 208 24.0 ND ND 1.0 0.5 ND ND No tested ammonium Brownish yellow Mild++ 23 132
K-1-02 27-Jan-12 Khagrachhari Dighinala Merung Toidu Chara 23°14′00.95″N 92°00′38.84″E Community – – River 8.4 145 238 14.3 ND ND ND ND ND ND No tested No odor Clear ND 32 82 K-1-03 27-Jan-12 Khagrachhari Dighinala Merung Simana Para
23°12′57.32″N 92°00′53.03″E Community – – Spring 7.4 31 138 22.6 ND ND 0.2 ND ND ND Tasteless No odor
Slightly muddy color ND 38 18
K-2-01 28-Jan-12 Khagrachhari Matiranga Gomti Uttor Santipur 23°07′10.53″N 91°49′14.45″E Joynal Abedin 2(10) 21 STW 6.4 105 119 24.7 ND ND 0.3 3.0 1 ND Tasteless No odor Clear ND 24 0 K-2-02 28-Jan-12 Khagrachhari Matiranga Gomti Uttor Santipur
23°07′13.68″N 91°49′16.30″E Akter Hossain 3(15) 19.8 STW 5.9 66 227 25.1 ND ND 0.3 0.2 ND ND Little iron
Little amonia Clear ND 50 0
K-2-03 28-Jan-12 Khagrachhari Matiranga Gomti Uttor Santipur 23°07′13.17″N 91°49′20.13″E Abdul Hakim 2(10) 18.3 STW 5.7 62 274 25.3 ND ND ND ND ND ND Tasteless Little iron Clear Little 21 0 K-2-04 28-Jan-12 Khagrachhari Matiranga Gomti Uttor Santipur
23°07′18.08″N 91°49′18.42″E Abdul Hakim 2(10) 16 STW 6.0 73 207 23.8 ND ND 0.3 0.7 ND ND Tasteless Slightly amonia Clear
Slightly turbid 118 20
K-2-05 28-Jan-12 Khagrachhari Matiranga Gomti Uttor Santipur 23°07′29.21″N 91°49′36.02″E Kala Mia 5(25) 36.5 STW 5.4 43 239 25.0 ND ND 0.1 0.6 ND ND Tasteless
Slightly iron Clear ND 52 0
K-2-06 28-Jan-12 Khagrachhari Matiranga Gomti Uttor Santipur 23°07′26.39″N 91°49′33.47″E Md. Harun 5(25) 16 STW 5.5 48 248 25.6 1.0 ND 0.1 0.1 0.2 ND
Little iron No odor Clear ND 1 0
K-2-07 28-Jan-12 Khagrachhari Matiranga Gomti Uttor Santipur 23°07′24.04″N 91°49′28.03″E Amanullah 12(60) 22.8 STW 5.7 47 312 24.8 ND ND 0.1 ND ND ND Tasteless No odor Clear ND 52 78 K-2-08 28-Jan-12 Khagrachhari Matiranga Gomti Uttor Santipur 23°07′11.60″N 91°49′29.04″E Abdul Hakim 5(25) 16 STW 5.7 37 281 24.7 0.5 ND 0.1 ND ND ND Tasteless No odor Clear ND – 0 K-2-09 28-Jan-12 Khagrachhari Matiranga Gomti Uttor Santipur 23°07′18.24″N 91°49′30.64″E Abdul Aziz 4(20) 16 STW 5.9 39 318 24.8 ND ND 0.1 ND ND ND Tasteless No odor Clear ND – 0 K-3-01 29-Jan-12 Khagrachhari Sadar Perachara BARI
23°08′25.97″N 92°00′02.95″E BARI (irrigation) NA – River 7.2 104 173 19.0 ND ND 0.3 0.2 ND
Not tested
Not tested
Little Amonia Clear
Little turbid 84 0
K-3-02 29-Jan-12 Khagrachhari Sadar Perachara BARI Not taken Not taken BARI 20(100) 122 STW 7.9 40 106 19.0 ND ND 0.5 ND ND
Not tested Tasteless No odor Clear
No turbidity 56 0
K-4-01 30-Jan-12 Khagrachhari Pourashava LGED Office 23°07′04.98″N 91°58′24.11″E LGED 10(50) 30.5 STW 5.9 161 96 24.4 ND ND 1 14 0.5 ND Tasteless
Slightly iron Clear ND 84 0
K-4-02 30-Jan-12 Khagrachhari Pourashava Police line 23°07′14.65″N 91°59′44.58″E – 10(250) – nul 7.9 158 210 21.0 ND ND 0.2 ND ND ND Tasteless No odor Clear
Little turbid 56 0
K-4-03 30-Jan-12 Khagrachhari Pourashava Police line 23°07′14.65″N 91°59′44.58″E – 10(250) – STW 6.6 149 54 24.3 ND ND 0.7 12 ND ND
Slightly iron
Slightly iron Clear ND 63 0
K-4-04 30-Jan-12 Khagrachhari Pourashava Pourashava water supply unit 1 23°06′44.07″N 91°59′30.61″E – N/A 46 STW 6.3 115 312 25.3 4 ND ND ND ND ND Tasteless No odor Clear ND 89 61
K-4-05 30-Jan-12 Khagrachhari Pourashava Pourashava water supply unit 2 23°06′08.21″N 91°58′57.39″E – N/A 85 STW 6.8 160 6 24.8 ND ND 0.7 9 ND ND
Not tested
Slightly iron Clear ND 2 0
K-4-06 30-Jan-12 Khagrachhari Pourashava Pourashava water supply unit 2 23°06′08.21″N 91°58′57.39″E – N/A 85 PWSS 7.5 152 189 23.0 0.1 ND ND ND ND
Not tested Tasteless No odor Clear Little 72 150
K-6-01 31-Jan-12 Khagrachhari Pourashava Khagrapur 23°07′13.24″N 91°59′33.38″E
Zabarang Office 5(20) 24 STW 6.1 113 49 24.2 ND ND 0.5 7 ND ND
Little iron
Little amonia Clear ND 0 0
K-6-02 31-Jan-12 Khagrachhari Pourashava Khagrapur
23°07′30.74″N 91°59′30.82″E
Multi Purpose Community Centre 4(30) 24 STW 5.9 50 212 25.2 ND ND 0.1 0.6 ND ND Tasteless Little iron Clear ND 0 0
K-6-03 31-Jan-12 Khagrachhari Pourashava Parjaton Ghat 23°06′12.63″N 91°58′08.06″E Chingri River N/T – River 7.8 176 213 22.1 ND ND 0.6 0.1 0.5 N/T Tasteless No odor
Brownish green Mild 0 0
R-1-01 2-Feb-12 Rangamati Pourashava Giri Shova
22°38′51.55″N 92°11′14.20″E
Giri Shova Floating Restaurant NA – Lake 7.5 106 225 21.3 0.5 ND 0.1 ND ND
Not tested
Not tested No odor Clear ND 87 124
R-1-02 2-Feb-12 Rangamati Pourashava Asam Bosti (Narikel Farm) 22°38′16.62″N 92°10′42.61″E Nurul Alam 3(15) 20 STW 5.9 121 204 24.4 10 ND 0.4 0.4 ND ND Tasteless
Little Amonia Clear ND 43 0
R-1-03 2-Feb-12 Rangamati Pourashava Monoghor 22°38′34.81″N 92°09′42.62″E
Bidya Dhan Chakma 5(25) 20 DW 5.3 152 289 26.5 45 ND 0.1 ND ND ND Tasteless No odor Clear ND 50 180
R-1-04 2-Feb-12 Rangamati Pourashava DPHE
22°39′30.319″N 92°10′30.670″E
DPHE water treatment plant – – PWSS 7.4 116 242 26.4 0.7 ND 0.1 0.2 ND
Not tested Tasteless No odor Clear ND 57 287
R-1-05 2-Feb-12 Rangamati Pourashava DPHE
22°39′30.974″N 92°10′31.001″E
DPHE water treatment plant – – PWSS 7.4 111 236 22.5 0.4 ND 0.7 ND ND
Not tested Tasteless No odor Clear
Little turbid 64 109
R-2-01 4-Feb-12 Rangamati Sadar Bandukvanga Sagu Para 22°44′20.40″N 92°10′34.32″E Community 23(120) – Spring 6.3 93 241 21.4 ND ND 0.2 ND ND ND Tasteless No odor Clear ND 137 12 R-2-02 4-Feb-12 Rangamati Sadar Bandukvanga Sagu Para
22°44′22.51″N 92°10′33.19″E Nara Bijoy Chakma 3(15) data STW 6.6 105 137 24.9 1.5 ND 0.3 0.7 ND ND
Little iron Little iron Clear ND 0 0
R-2-03 4-Feb-12 Rangamati Sadar Bandukvanga Mogh Para 22°44′03.27″N 92°10′44.63″E
Bala Ram Chakma 10(50) – Spring 6.3 107 268 21.8 ND ND 0.2 ND ND ND Tasteless No odor Clear ND 199 0
R-2-04 4-Feb-12 Rangamati Sadar Bandukvanga Mogh Para 22°44′10.37″N 92°10′58.48″E
Bharat Kumar Chakma 15(75) – Spring 6.3 186 282 22.9 0.5 ND 0.1 ND ND ND Tasteless No odor Clear ND 92 0
R-2-05 4-Feb-12 Rangamati Sadar Bandukvanga Mogh Para 22°44′10.37″N 92°10′58.48″E
Bharat Kumar Chakma 15(75) – Spring 6.3 230 266 20.8 0.5 ND 0.1 ND ND ND
Not tested
Little Amonia Clear ND 118 107
R-2-06 4-Feb-12 Rangamati Sadar Bandukvanga Mogh Para 22°44′07.33″N 92°10′50.82″E
Gyana Jyoti Chakma 5(25) - Spring 5.8 61 275 22.7 ND ND 0.3 ND ND
Not tested Tasteless
Little Amonia Clear ND 106 98
R-2-07 4-Feb-12 Rangamati Sadar Bandukvanga Kuki Para 22°44′29.21″N 92°10′27.12″E
Gyana Jyoti Chakma 5(25) - Spring 6.1 82 289 22.6 ND ND 0.2 0.1 ND
Not tested Tasteless
Little Amonia Clear ND 49 15
R-2-08 4-Feb-12 Rangamati Sadar Bandukvanga Kuki Para
22°44′26.32″N 92°10′26.40″E
Provat Chandra Chakma 3(15) 21 STW 6.4 138 15 26.1 ND ND 0.9 20 ND ND Iron Iron Clear ND 6 0

Data Collection Study on Regional Development in Southeastern Bangladesh Final Report
A-2
ID Date
Location Data water source water quality
District Upazila Union Village Latitude Longitude House Owner
Number of HH
(person) well
depth
Type of
water source pH
EC (μS/cm) ORP
water temp. (℃)
NO3 (mg/L)
NO2 (mg/L)
NH4 (mg/L)
Fe (mg/L)
Mn (mg/L)
As (mg/L) taste odor color turbidity
General Bacteria
Colif. Bacteria
R-2-09 4-Feb-12 Rangamati Sadar Bandukvanga Sagu Para 22°44′19.43″N 92°10′27.97″E Community 3(15) – Lake 7.4 107 169 24.4 ND ND 0.6 ND ND
Not tested
Not tested
Little Amonia
Little greenish
Little turbidity 21 120
R-2-10 4-Feb-12 Rangamati Sadar Bandukvanga Sagu Para 22°44′11.32″N 92°10′25.40″E Boat landing N/A – Lake 7.9 97 229 22.7 ND ND 0.2 ND ND
Not tested
Not tested No odor Clear ND 0 1
R-2-11 4-Feb-12 Rangamati Sadar Bandukvanga Sagu Para 22°42′00.82″N 92°10′32.05″E
Middle point of lake N/A – Lake 7.9 97 239 23.8 ND ND 0.2 ND ND
Not tested
Not tested No odor Clear ND 5 0
R-2-12 4-Feb-12 Rangamati Sadar Pourashava Cultural Academy Ghat 22°39′36.69″N 92°10′13.92″E Community N/A – Lake 7.2 103 265 23.4 1.5 ND 0.6 ND ND
Not tested
Not tested No odor Clear ND 82 87
R-3-01 5-Feb-12 Rangamati Kaptai 1 no Chandraghona
Barogonia Tonchangya Para 22°30′34.55″N 92°07′21.22″E
Priyadarshi Tonchangya 5(30) 12.2 DW 6.8 300 87 24.0 0.2 ND 0.75 0.6 ND ND
Little iron Little iron Clear
Little turbidity 9 0
R-3-02 5-Feb-12 Rangamati Kaptai 1 no Chandraghona
Barogonia Tonchangya Para
22°30′35.01″N 92°07′20.12″E Provat Tonchangya 5(30) 61 STW 7.7 510 103 25.6 ND ND 1.5 1 ND ND
Little iron Little iron Clear
very little turbidity 0 0
R-3-03 5-Feb-12 Rangamati Kaptai 1 no Chandraghona
Barogonia Tonchangya Para 22°30′42.34″N 92°07′19.75″E
Rosomoy Tonchangya 6(35) – Spring 6.7 200 210 21.2 ND ND 0.2 ND ND
Not tested Tasteless No odor Clear
Little turbidity 82 138
R-3-04 5-Feb-12 Rangamati Kaptai 1 no Chandraghona
Barogonia Tonchangya Para
22°30′08.95″N 92°07′31.62″E Diptimoy Tonchangya 3(15) 61 STW 8.7 750 4 25.4 ND ND 1 0.1 ND ND Tasteless Amonia Clear
Very little turbidity 42 39
R-3-05 5-Feb-12 Rangamati Kaptai 1 no Chandraghona
Barogonia Tonchangya Para 22°30′09.49″N 92°07′34.42″E
Ratna Mohan Tonchangya 5(25) 12.2 DW 6.8 570 50 25.9 ND ND 0.3 0.8 ND ND Tasteless No odor Clear ND 16 153
R-3-06 5-Feb-12 Rangamati Kaptai 1 no Chandraghona
Barogonia Tonchangya Para 22°30′15.66″N 92°07′33.82″E
Mia Prue Tonchangya 3(15) 12.2 Spring 6.8 166 193 20.9 ND ND ND ND ND
Not tested Tasteless No odor Clear ND 103 180
R-3-07 5-Feb-12 Rangamati Kaptai 1 no Chandraghona
Barogonia Tonchangya Para
22°30′18.24″N 92°07′31.12″E Mia Prue Tonchangya 5(25) 60 STW 8.0 370 25 25.1 ND ND 0.2 0.1 ND ND Tasteless
Little amonia Clear
Very little turbidity 25 0
R-3-08 5-Feb-12 Rangamati Kaptai 1 no Chandraghona
Barogonia Tonchangya Para 22°30′19.21″N 92°07′30.85″E
Doya Ram Tonchangya 6(30) 13 DW 6.8 250 113 24.2 ND ND 0.2 0.2 ND ND Tasteless No odor Clear ND 36 180
R-4-01 7-Feb-12 Rangamati Kaptai Raikhali Ferry Ghat (Karnafully River downstrem of Kaptai dam) 22°27′57.61″N 92°07′48.25″E N/A N/A – River 8.2 117 254 23.9 ND ND 0.1 ND ND
Not tested
Not tested No odor Clear ND 11 210
B-1-01 8-Feb-12 Bandarban Sadar Pourasahva Rajbari Pond 22°11′51.25″N 92°13′14.97″E Community 100(1000) – Pond 9.1 460 184 25.5 ND ND 0.3 0.1 ND
Not tested
Not tested
Little Amonia Not clear
High turbidity 101 395
B-1-02 8-Feb-12 Bandarban Sadar Sadar Senior Para 22°09'50.50″N 92°10'57.93"E Community 100(1000) – River 7.9 260 268 25.4 ND ND 0.1 0.1 ND
Not tested Tasteless No odor Clear ND 50 260
B-1-03 8-Feb-12 Bandarban Sadar Sadar Senior Para 22°11′51.25″N 92°13′14.97″E Community 100(1000) – Spring – – – – – – – – – – – – – – 10 94 B-2-01 9-Feb-12 Bandarban Sadar Sadar Kattoli Para (Thei
Prue) 22°15′52.01″N 92°15′13.89″E Community N/A – Spring 7.7 79 197 19.5 ND ND 0.2 0.1 ND Not tested Tasteless No odor Clear ND 51 88
B-2-02 9-Feb-12 Bandarban Sadar Sadar Kattoli Para (Kanergri) 22°15′45.44″N 92°15′17.68″E Community N/A – Spring 7.9 79 230 24.0 ND 0.02 0.2 0.3 ND
Not tested
Not tested No odor Clear ND 18 72
B-2-03 9-Feb-12 Bandarban Sadar Sadar Kattoli Para (Loktoi Mro) 22°15′35.34″N 92°15′27.90″E Community N/A – Spring 7.0 48 254 18.3 ND ND 0.1 ND ND
Not tested
Not tested No odor Clear ND 29 46
B-2-04 9-Feb-12 Bandarban Sadar Sadar Kattoli Para (Sa Prue Jhiri) 22°15′11.47″N 92°15′02.79″E Community N/A – Spring 7.7 145 216 21.5 ND ND 0.1 0.1 ND
Not tested
Not tested No odor Clear ND 23 175
B-2-05 9-Feb-12 Bandarban Sadar Sadar Kattoli Para (Paing Chara) 22°15′11.47″N 92°15′02.79″E Community N/A – Lake 7.9 139 209 21.8 ND ND 0.2 0.1 ND
Not tested
Not tested No odor Clear ND 99 310
B-3-01 10-Feb-12 Bandarban Sadar Pourashava Ujania Para 22°11′53.49″N 92°13′08.10″E Hotel Royal 3(60) 55 STW 5.8 380 125 25.3 ND ND 0.2 5 2 ND Tasteless
Little amonia Clear ND 40 0
B-3-02 10-Feb-12 Bandarban Sadar Pourashava Kywching Ghata 22°11′00.17″N 92°13′50.67″E Community N/A 0 River 8.2 260 178 23.3 ND ND 0.1 ND ND
Not tested
Not tested No odor Clear ND 40 38
B-3-03 10-Feb-12 Bandarban Sadar Pourashava New Gulshan 22°11′14.21″N 92°13′41.57″E
DPHE water supply 2400 0 PWSS 8.0 270 227 22.7 ND ND 0.1 0.1 ND
Not tested Tasteless No odor Clear ND 113 105
B-3-04 10-Feb-12 Bandarban Sadar Pourashava Kalaghata
22°11′35.07″N 92°13′51.66″E
Md Kamal Hossain (Community) 15(75) 5 DW 6.3 280 341 24.6 60 0.04 0.1 ND ND
Not tested
Not tested No odor Clear ND 52 89
B-3-05 10-Feb-12 Bandarban Sadar Sadar Lemu Jhiri 22°12′51.62″N 92°13′04.04″E Community 50(250) 27 STW 7.9 300 136 26.2 ND ND 0.1 ND ND ND Tasteless No odor Clear ND 0 0 B-3-06 10-Feb-12 Bandarban Sadar Pourashava Ukhyang Jhiri
22°12′22.19″N 92°13′01.70″E Community 10(50) 0 Spring 6.6 200 258 23.1 ND ND 0.1 ND ND Not tested Tasteless No odor Clear ND 16 16
B-3-07 10-Feb-12 Bandarban Sadar Pourashava Ukhyang Jhiri 22°12′22.62″N 92°13′00.09″E
Sushil Bikash Tonchangya 2(12) 5 DW 6.8 220 253 23.2 0.3 ND 0.1 0.05 ND
Not tested
Not tested Little Iron Clear ND 25 254
B-4-01 11-Feb-12 Bandarban Sadar Swalock Moddhyam Para
22°05′05.80″N 92°15′09.42″E Community N/A – Spring 8.4 270 254 21.4 ND ND ND ND ND Not tested
Not tested No odor Clear
Very little turbidity 91 105
B-4-02 11-Feb-12 Bandarban Sadar Swalock Ranglai Headman Para 22°05′01.68″N 92°15′14.89″E Community NA – Spring 7.7 135 46 19.0 ND ND 0.5 0.3 ND
Not tested
Not tested Little iron Clear ND 29 87
B-4-03 11-Feb-12 Bandarban Sadar Swalock Sing Song Para 22°05′10.71″N 92°15′03.59″E Community NA – Spring 7.9 153 228 22.8 ND ND 0.1 ND ND
Not tested
Not tested No odor Clear ND 10 157
B-4-04 11-Feb-12 Bandarban Sadar Swalock Ranglai Headman Para 22°05′10.80″N 92°15′02.45″E Community NA – Spring 8.2 186 236 20.9 ND ND ND ND ND
Not tested Tasteless No odor Clear ND 43 149
B-4-05 11-Feb-12 Bandarban Sadar Swalock Sing Song Para
22°05′09.03″N 92°14′58.81″E Community 15(90) –
GFS (source B-04-03) 8.2 155 226 26.7 ND ND 0.1 ND ND
Not tested
Not tested No odor Clear ND 56 228

Data Collection Study on Regional Development in Southeastern Bangladesh Final Report
A-3
ID Date
Location Data water source water quality
District Upazila Union Village Latitude Longitude House Owner
Number of HH
(person) well
depth
Type of
water source pH
EC (μS/cm) ORP
water temp.(℃)
NO3 (mg/L)
NO2 (mg/L)
NH4 (mg/L)
Fe (mg/L)
Mn (mg/L)
As (mg/L) taste odor color turbidity
General Bacteria
Colif. Bacteria
B-4-06 11-Feb-12 Bandarban Sadar Swalock Moddhyam Para
22°05′13.73″N 92°14′58.65″E Community 10(60) –
GFS (source B-04-01) 8.1 260 219 21.0 ND ND 0.1 ND ND
Not tested
Not tested No odor Clear ND 73 147
B-4-07 11-Feb-12 Bandarban Sadar Swalock Ranglai Head Man Para
22°05′18.90″N 92°14′53.03″E Community 15(90) –
GFS (source B-04-02),
direct 7.7 136 369 32.1 1 ND 0.1 ND ND Not tested
Not tested No odor Clear ND 29 104
B-4-08 11-Feb-12 Bandarban Sadar Swalock Sing Song Para
22°05′18.90″N 92°14′53.03″E Community 15(90) –
GFS (source B-04-02),
Tap 01 7.9 137 253 20.1 ND ND 0.1 ND ND Not tested
Not tested No odor Clear ND 5 99
B-4-09 11-Feb-12 Bandarban Sadar Swalock Sing Song Para
22°05′19.64″N 92°14′49.27″E Community 20(120) –
GFS (source B-04-02),
Tap 02 7.9 138 256 20.9 ND ND 0.1 ND ND Not tested
Not tested No odor Clear ND 169 56
C-1-01 13-Feb-12 Cox's Bazar Sadar Ghilenga Chander Para 21°26′07.89″N 92°01′04.40″E Community N/A – River 8.7 330 221 21.8 ND ND 0.1 ND ND
Not tested
Not tested No odor Clear ND 8 249
C-1-02 13-Feb-12 Cox's Bazar Sadar Ghilenga Chander Para 21°26′07.89″N 92°01′04.40″E Community N/A – River 7.8
1.1% (+) 209 22.6 0.5 0.09 0.5 0.1 ND
Not tested
Not tested No odor Clear ND 178 148
C-1-03 13-Feb-12 Cox's Bazar Sadar Ghilenga Chander Para 21°26′10.77″N 92°01′05.53″E Community N/A 12 STW 7.0 800 112 25.3 ND ND 0.35 15 0.25 ND Iron
Little iron & amonia Clear ND 53 0
C-1-04 13-Feb-12 Cox's Bazar Ramu Fatay Khar Kul
Tessyapul 21°25′36.93″N 92°05′07.65″E Madrassa 1(50) 36.5 STW 7.2 250 49 25.7 ND ND 0.3 2 ND ND Tasteless Little iron Clear ND 0 0
C-1-05 13-Feb-12 Cox's Bazar Ramu Fatay Khar Kul
Tessyapul 21°25′36.74″N 92°05′09.17″E Madrassa 1(70) 91 DW 7.3 260 71 26.0 ND ND 0.2 1.2 ND ND Tasteless
Little amonia Clear ND 23 0
C-2-01 14-Feb-12 Cox's Bazar Ukhiya Raja Palong Kutupalong Pacchim Para 21°13′23.59″N 92°02′33.60″E
Shourav Sharma 10(50) 43 STW 6.1 101 116 25.7 ND ND 0.2 10 ND ND
Little iron Little iron Clear ND 30 0
C-2-02 14-Feb-12 Cox's Bazar Ukhiya Raja Palong Kutupalong 21°13′22.88″N 92°09′33.99″E
Suvodon Sharma 10(50) 33 STW 6.3 160 7 25.7 ND ND 0.3 9 ND ND
Little iron Little iron Clear ND 27 0
C-2-03 14-Feb-12 Cox's Bazar Ukhiya Raja Palong Kutupalong 21°13′19.30″N 92°09′34.31″E
Suvodon Sharma 5(50) – Pond 7.0 65 247 21.3 ND ND 0.1 ND ND
Not tested
Not tested No odor Not clear
Little turbidity 70 107
C-2-04 14-Feb-12 Cox's Bazar Ukhiya Raja Palong Kutupalong 21°13′19.97″N 92°09′37.41″E
Fakir Chandra Shil 4(20) 51.8 STW 6.3 166 12 25.0 ND ND 0.3 10 ND ND
Little iron
Little iron & amonia Clear ND 50 140
C-2-05 14-Feb-12 Cox's Bazar Ukhiya Raja Palong Kutupalong (Swarnopahar Purbo Para) 21°13′13.78″N 92°09′59.49″E
Gondung Khal N/A – River 7.0 70 261 23.5 ND ND 0.1 ND ND
Not tested
Not tested No odor Not clear
Little turbidity 76 122
C-2-08 14-Feb-12 Cox's Bazar Ukhiya Holodia Palong
Gura Mia Garage 21°17′53.90″N 92°05′50.74″E Community 10 15 STW 7.8 520 340 25.6 1 ND 0.1 0.5 ND ND Tasteless No odor Clear ND 1 0
C-2-09 14-Feb-12 Cox's Bazar Ukhiya Holodia Palong
Morissya 21°18′08.85″N 92°05′49.16″E
Zamir Hossain 2(10) 7 STW 5.4 139 329 23.8 0.2 ND 6 2 ND ND Tasteless
Little amonia Clear ND 14 0
C-2-10 14-Feb-12 Cox's Bazar Ukhiya Holodia Palong
Purbo Patabari 21°18′17.00″N 92°08′54.89″E Abul Kasem 3(15) 7 STW 5.9 138 70 25.0 ND ND 0.5 18 ND 0.025
Not tested Little iron Clear ND 12 0
C-3-01 15-Feb-12 Cox's Bazar Teknaf Bahar Chara Mata Vanga 20°59′06.56″N 92°12′10.48″E Community N/A – River 8.4 480 242 20.8 ND ND 0.05 ND ND
Not tested
Not tested No odor Clear ND 71 74
C-3-02 15-Feb-12 Cox's Bazar Teknaf Bahar Chara Mata Vanga 20°58′56.77″N 92°12′03.43″E Tajor Muluk 4(20) 8.5 DW 7.0 580 259 25.5 ND ND 0.1 ND ND
Not tested Tasteless No odor Clear ND 52 174
C-3-03 15-Feb-12 Cox's Bazar Teknaf Bahar Chara Marish Baniya 20°58′40.11″N 92°12′06.27″E Kasim Majhi 10(50) – Spring 7.0 660 119 23.6 2 ND 0.1 0.2 0.5
Not tested Tasteless No odor Clear ND 24 0
C-3-04 15-Feb-12 Cox's Bazar Teknaf Bahar Chara Marish Baniya 20°58′38.14″N 92°12′12.62″E
Nasir Uddin Chowdhury 3(15) 9 STW 7.2 580 157 26.1 5 0.01 0.05 ND ND ND
Not tested No odor Clear ND 4 0
C-3-05 15-Feb-12 Cox's Bazar Teknaf Bahar Chara Marish Baniya 20°58′33.52″N 92°12′10.51″E Community N/A – River 7.9 620 199 21.2 ND ND 0.05 ND ND
Not tested
Not tested No odor Clear ND 44 2
C-3-06 15-Feb-12 Cox's Bazar Teknaf Bahar Chara Marish Baniya 20°58′29.28″N 92°12′05.17″E Md. Idris 5(25) – Spring 7.7 1350 42 21.7 ND ND 0.05 ND ND
Not tested Taste salt No odor Clear ND 36 7
C-3-07 15-Feb-12 Cox's Bazar Teknaf Bahar Chara Marish Baniya 20°58′23.87″N 92°12′07.99″E Zinnat Ali 2(12) 12 DW 7.0 440 25 25.4 0.5 ND 0.1 3 ND ND
Little iron Little iron Clear ND 11 62
C-3-08 15-Feb-12 Cox's Bazar Teknaf Bahar Chara Marish Baniya 20°58′25.43″N 92°12′12.60″E Nur Hossain 2(10) – Spring 8.1 1450 60 27.5 ND ND 0.4 1.5 2
Not tested
Little iron
Little amonia Clear ND 9 0
C-3-09 15.2.2012 Cox's Bazar Cox's Bazar Paurshaba Kalatali 21°25′10.92″N 91°58′57.07″E Uni Resort 2(10) – DTW 7.9 650 60 25.8 ND ND ND ND ND ND Tastless No odder Clear ND 2 0