data collection survey on outer-ring fishing ports development...
TRANSCRIPT
Data Collection Survey on Outer-ring
Fishing Ports Development
in the Republic of Indonesia
FINAL REPORT
October 2010
Japan International Cooperation Agency
(JICA)
INTEM Consulting,Inc.A1P
JR
10-035
Data Collection Survey on Outer-ring Fishing Ports Development
in the Republic of Indonesia
FINAL REPORT
September 2010
Japan International Cooperation Agency
(JICA)
INTEM Consulting,Inc.

Preface
(挿入)

Map of Indonesia (Target Area)
①Teluk Awang
②Makassar
③Kupang
④Nunukan ⑤Bitung
⑦Tual
⑥Ternate

Currency and the exchange rate
IDR 1 = Yen 0.01044 (May 2010, JICA Foreign currency exchange rate)

Contents
Preface
Map of Indonesia (Target Area)
Currency and the exchange rate
List of abbreviations/acronyms
List of tables & figures
Executive summary
Chapter 1 Outline of the study
1.1Background ・・・・・・・・・・・・・・・・・ 1
1.1.1 General information of Indonesia ・・・・・・・・・・・・・・・・・ 1
1.1.2 Background of the study ・・・・・・・・・・・・・・・・・ 2
1.2 Purpose of the study ・・・・・・・・・・・・・・・・・ 3
1.3 Target areas of the study ・・・・・・・・・・・・・・・・・ 3
Chapter 2 Current status and issues of marine capture fisheries
2.1 Current status of the fisheries sector ・・・・・・・・・・・・・・・・・ 4
2.1.1 Overview of the sector ・・・・・・・・・・・・・・・・・ 4
2.1.2 Status and trends of the fishery production ・・・・・・・・・・・・・・・・・ 4
2.1.3 Fishery policy framework ・・・・・・・・・・・・・・・・・ 7
2.1.4 Investment from the private sector ・・・・・・・・・・・・・・・・・ 12
2.2 Current status of marine capture fisheries ・・・・・・・・・・・・・・・・・ 13
2.2.1 Status and trends of marine capture fishery production ・・・・・・・ 13
2.2.2 Distribution and consumption of marine fishery production ・・・ 16
2.2.3 Status of fisheries resources ・・・・・・・・・・・・・・・・・ 18
2.2.4 Fishery resource management measures ・・・ 20
2.3 Issues on marine capture fisheries and
countermeasures taken
・・・・・・・・・・・・・・・・・ 23
2.4 Other donors’ assistance ・・・・・・・・・・・・・・・・・ 24

Chapter 3 Current status of fishing port development
3.1 Administrative arrangement ・・・・・・・・・・・・・・・・ 25
3.2 Outer-ring fishing port (ORFP) development ・・・・・・・・・・・・・・・・ 30
3.2.1 ORFP development master plan ・・・・・・・・・・・・・・・・ 30
3.2.2 Road map of ORFP development ・・・・・・・・・・・・ 38
3.3 Issues to be addressed in implementing the ORFP
development plan
・・・・・・・・・・・・ 47
Chapter 4 Results of site surveys at the target fishing ports
4.1 Selection of the target fishing ports ・・・・・・・・・・・・・・ 52
4.2 Current situation of the target fishing ports ・・・・・・・・・・・・・・ 53
4.2.1 General information of the survey areas ・・・・・・・・・・・・・・ 53
4.2.2 Characteristics of the target fishing ports ・・・・・・・・・・・・・・ 56
4.3 A summary of the survey results ・・・・・・・・・・・・・・ 119
4.3.1 Site specific fishing port development plans and their issues ・・・・ 119
4.3.2 Necessary considerations in appraising the support for the
ORFP development
・・・・ 123
4.3.3 Conclusions of the site surveys ・・・・ 138
Chapter 5 Synthesis of the study results
5.1 Preliminary appraisal of ORFP development plan ・・・・・・・・・・・・ 141
5.2 Feasibility of ORFP development plan ・・・・・・・・・・・・ 148
5.3 Suggestions/recommendations on the ORFP development plan ・・・・ 150
5.4 Other remarks ・・・ 152
Attachment: Appendix A Results of the site surveys conducted by local consultant Appendix B List of materials referred

List of abbreviations/acronyms
ADB Asian Development Bank APBD Anggaran Pendapatan dan Belanja Daerah/ Local annual expenditure and
revenue budget APBN Anggaran Pendapatan dan Belanja Negara/ National annual expenditue and
revenue budget BAPPENAS Bidang Ekonomi, Keuangan, dan Industri dan Kantor Menteri Negara
Perencanaan Pembangunan Nasional / National Development Planning Board
CTI Coral Triangle Initiative on coral reefs, fisheries and food security DAK Dana Alokasi Khusus/ Special grant DAU Dana Allocasi Umum/ General revenue sharing DG Directorate General DGCF Directorate General of Capture Fisheries DKP Departemen Kelautan dan Perikanan/ Directorate General of Capture
Fisheries EEZ Exclusive economic zone EIA Environmental Impact Assessment FAD Fish Aggregating Devices FKPPS Forum Koordinasi Pengelolaan dan Pemanfaatan Sumberdaya Ikan/ National
Committee for Fish Stock Assessment FMA Fisheries Management Area GMP Good Manufacturing Practices IDB Inter-American Development Bank IPTEK Sentra Informasi Ilmu Pengetahuan dan Teknologi/ Technical Information
Centre IUU Illegal, Unreported, Unregulated Fishing KEPMENTAN Keputusan Menteri Pertanian/ Agricultural Ministerial Ordinance KKMB Konsultan Keuangan Mitra Bank/ Mitra Bank Financing Service
KKPE Kredit Ketahanan Pangan dan Energi/ Financing for Energy and Food Securing
KUB Kelompok Usaha Bersama/ Community Business Group KUD Koperasi Unit Desa/ Village Cooperation Society KUR Kuredit Usaha Rayat/ Community Business Financing LIPI Lembaga Ilmu Pengetahuan Indonesia/The Indonesian Institute of Sciences
LPPMHP Laboratorium Pengujian dan Pengawasan Mutu Hasil Perikanan/ Fishery Quality Control Inspection Laboratory
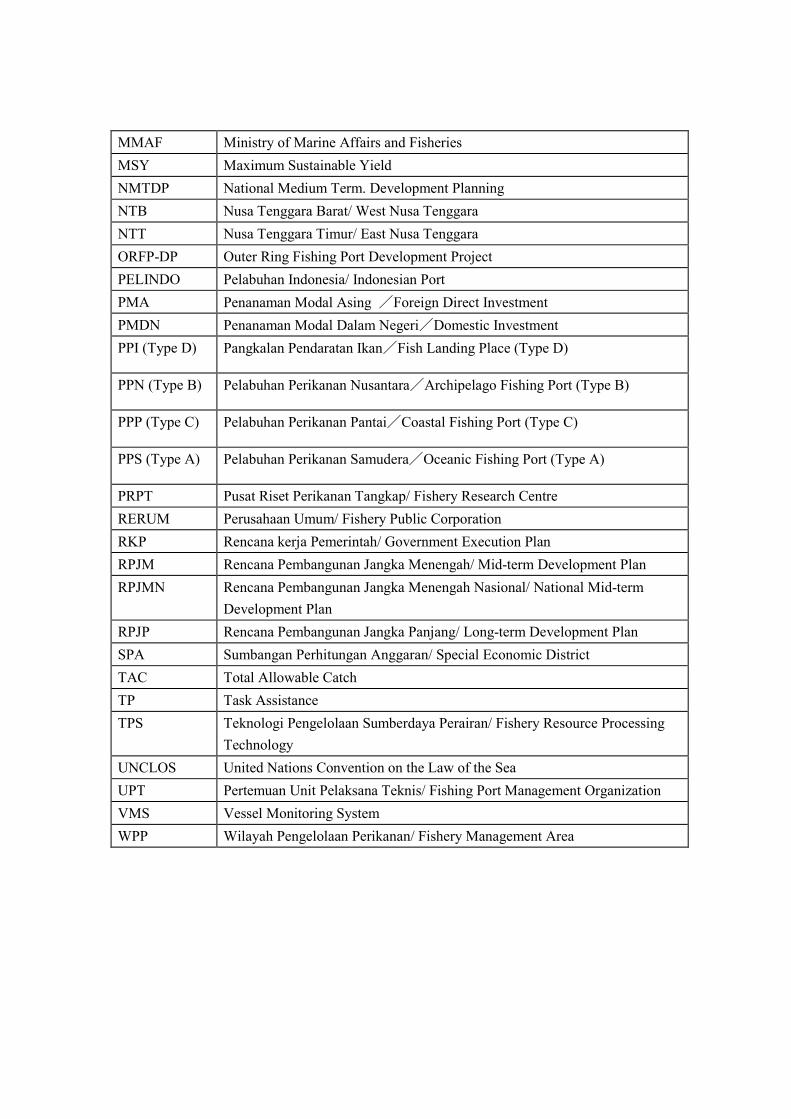
MMAF Ministry of Marine Affairs and Fisheries MSY Maximum Sustainable Yield NMTDP National Medium Term. Development Planning NTB Nusa Tenggara Barat/ West Nusa Tenggara NTT Nusa Tenggara Timur/ East Nusa Tenggara ORFP-DP Outer Ring Fishing Port Development Project PELINDO Pelabuhan Indonesia/ Indonesian Port PMA Penanaman Modal Asing /Foreign Direct Investment PMDN Penanaman Modal Dalam Negeri/Domestic Investment PPI (Type D) Pangkalan Pendaratan Ikan/Fish Landing Place (Type D)
PPN (Type B) Pelabuhan Perikanan Nusantara/Archipelago Fishing Port (Type B)
PPP (Type C) Pelabuhan Perikanan Pantai/Coastal Fishing Port (Type C)
PPS (Type A) Pelabuhan Perikanan Samudera/Oceanic Fishing Port (Type A)
PRPT Pusat Riset Perikanan Tangkap/ Fishery Research Centre RERUM Perusahaan Umum/ Fishery Public Corporation RKP Rencana kerja Pemerintah/ Government Execution Plan RPJM Rencana Pembangunan Jangka Menengah/ Mid-term Development Plan RPJMN Rencana Pembangunan Jangka Menengah Nasional/ National Mid-term
Development Plan RPJP Rencana Pembangunan Jangka Panjang/ Long-term Development Plan SPA Sumbangan Perhitungan Anggaran/ Special Economic District TAC Total Allowable Catch TP Task Assistance TPS Teknologi Pengelolaan Sumberdaya Perairan/ Fishery Resource Processing
Technology UNCLOS United Nations Convention on the Law of the Sea UPT Pertemuan Unit Pelaksana Teknis/ Fishing Port Management Organization VMS Vessel Monitoring System WPP Wilayah Pengelolaan Perikanan/ Fishery Management Area

List of tables and figures
Chapter Nos. Titles Page Chapter 1 Table 1.1-1 Basic data of Indonesia 1 Chapter 2 Table 2.1-1 Capture fishery production (2003-2008) 4
2.1-2 Number of fishers(marine and inland open water capture fishery)(2003-2008)
5
2.1-3 Number of fishing vessels and boats(Marine capture fisheries)(2003-2008)
5
2.1-4 Number of fish processors and fish distributors 6
2.1-5 Main indicators for measuring attainment of objectives in Mid-term Development Plan (2010-2014) of MMAF
8
2.1-6 Regional Fishery Organizations (RFOs), in which Indonesia participates
11
2.1-7 Situation of private investment in fisheries sector 2004-2008 12 2.2-1 Marine capture fishery production by major species(2003-2008) 13 2.2-2 Number of marine capture fishers(2003-2008) 14 2.2-3 Number of fish processing business units and fish processors 15 2.2-4 Number of certificate issued for fish processors 16
2.2-5 Volume of marine capture fishery production by fishing management area (2003-2008)
19
2.2-6 Trend of MSY in marine capture fisheries 19 2.2-7 MSY and TAC in each FMA 21
2.2-8 Comparison of catch and MSY, TAC in FMAs in Eastern and Western Indonesia
22
Fig. 2.2-1 Per-capita consumption of fishery products by province 17 2.2-2 Fishing Management Areas in Indonesia 18 Chapter 3 Table 3.1-1 MMAF Civil Servants, 2005-2009 25 3.1-2 Classifications of fishing port 26 3.1-3 Budget allocation of MMAF 27 3.1-4 Non Tax Revenue (PNBP) of MMAF in 2005-2009 29
3.2-1 Summary of outer-ring fishing port (ORFP) development master plan in each site
36
3.2-2 Cost estimation for ORFP development 39 3.2-3 Planning/development process of ORFP development 43 3.2-4 Progress of ORFP development in target survey areas 45 Fig. 3.1-1 Administrative structure of fishing ports 28 3.1-2 Facilities damaged in small PPIs 30 3.2-1 Location of selected survey sites 41 Chapter 4 Table 4.1-1 List of survey sites 52
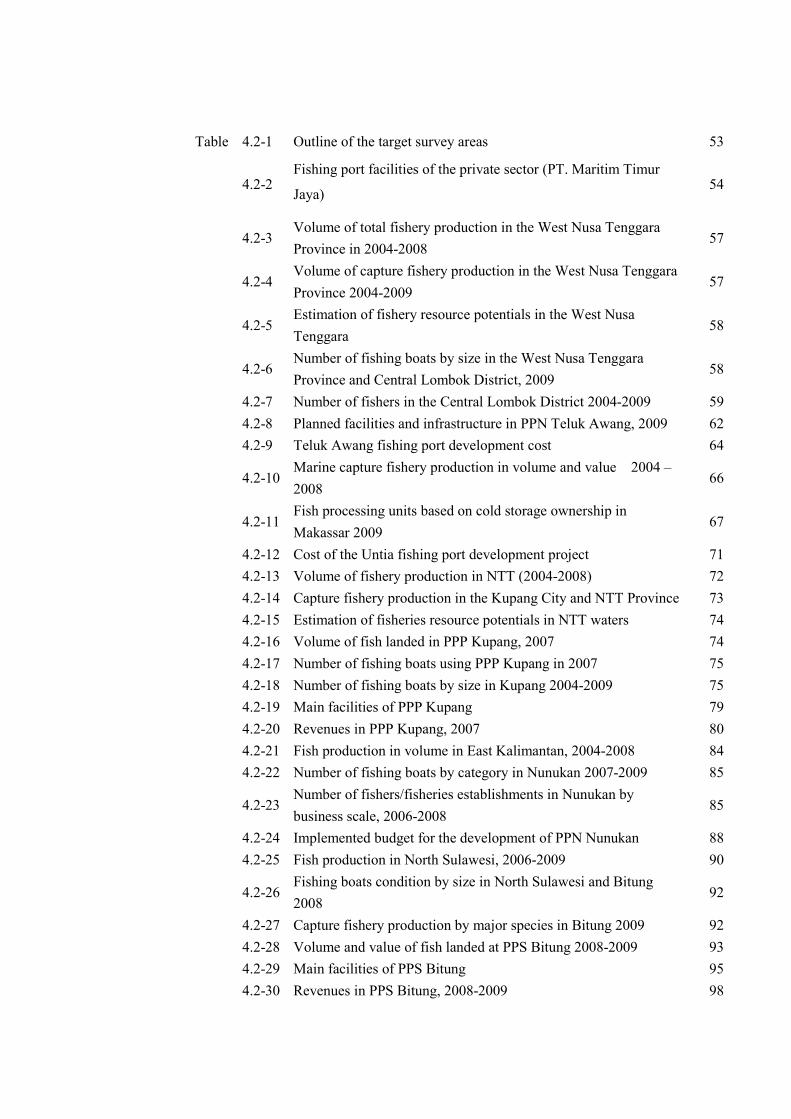
Table 4.2-1 Outline of the target survey areas 53
4.2-2 Fishing port facilities of the private sector (PT. Maritim Timur
Jaya) 54
4.2-3 Volume of total fishery production in the West Nusa Tenggara Province in 2004-2008
57
4.2-4 Volume of capture fishery production in the West Nusa Tenggara Province 2004-2009
57
4.2-5 Estimation of fishery resource potentials in the West Nusa Tenggara
58
4.2-6 Number of fishing boats by size in the West Nusa Tenggara Province and Central Lombok District, 2009
58
4.2-7 Number of fishers in the Central Lombok District 2004-2009 59 4.2-8 Planned facilities and infrastructure in PPN Teluk Awang, 2009 62 4.2-9 Teluk Awang fishing port development cost 64
4.2-10 Marine capture fishery production in volume and value 2004 – 2008
66
4.2-11 Fish processing units based on cold storage ownership in Makassar 2009
67
4.2-12 Cost of the Untia fishing port development project 71 4.2-13 Volume of fishery production in NTT (2004-2008) 72 4.2-14 Capture fishery production in the Kupang City and NTT Province 73 4.2-15 Estimation of fisheries resource potentials in NTT waters 74 4.2-16 Volume of fish landed in PPP Kupang, 2007 74 4.2-17 Number of fishing boats using PPP Kupang in 2007 75 4.2-18 Number of fishing boats by size in Kupang 2004-2009 75 4.2-19 Main facilities of PPP Kupang 79 4.2-20 Revenues in PPP Kupang, 2007 80 4.2-21 Fish production in volume in East Kalimantan, 2004-2008 84 4.2-22 Number of fishing boats by category in Nunukan 2007-2009 85
4.2-23 Number of fishers/fisheries establishments in Nunukan by business scale, 2006-2008
85
4.2-24 Implemented budget for the development of PPN Nunukan 88 4.2-25 Fish production in North Sulawesi, 2006-2009 90
4.2-26 Fishing boats condition by size in North Sulawesi and Bitung 2008
92
4.2-27 Capture fishery production by major species in Bitung 2009 92 4.2-28 Volume and value of fish landed at PPS Bitung 2008-2009 93 4.2-29 Main facilities of PPS Bitung 95 4.2-30 Revenues in PPS Bitung, 2008-2009 98

Table 4.2-31 Number of fishing boats using Bitung fishing port (5/19-5/20 ; by Survey team)
99
4.2-32 Frequency of vessel visits in PPS Bitung, 2008-2009 99 4.2-33 Required berth length of Bitung fishing port 100 4.2-34 Volume of fishery production by species in Ternate 2002 - 2007 103 4.2-35 List of facilities of PPN Ternate 106
4.2-36 Number of fishing boats using the PPN Ternate facilities 2008-2009
107
4.2-37 Volume and value of ice sold in PPN Ternate, 2008 - 2009 107 4.2-38 Ice blocks supplied by private ice making factories, 2008 - 2009 107 4.2-39 Revenues in PPN Ternate, 2008-2009 108 4.2-40 Required length of berth in Ternate fishing port 110 4.2-41 Cost estimation of PPN Ternate development 111 4.2-42 Volume of fishery production in Maluku Province, 2006-2008 112
4.2-43 Number of fishing boats in the Southeast Maluku District, including Tual City
113
4.2-44 Number of fishers in the Southeast Maluku District, including Tual City
114
4.2-45 Main facilities of PPN Tual 116 4.3-1 Survey results on the seven ORFP development sites 120
4.3-2 Summary of current situation for the seven ORFP development sites
124
Fig. 4.2-1 PT. Maritim Timur Jaya 54 4.2-2 Fish processors in Bitung 55 4.2-3 Administrative map of West Nusa Tenggara (NTB) Province 56
4.2-4 Local and inter-regional marketing & distribution of fishery products from Teluk Awang
60
4.2-5 Fisheries activities around Teluk Awang 61 4.2-6 PPN Teluk Awang development plan 63 4.2-7 Location of PPN Untia 65 4.2-8 Fisheries activities in Makassar 68 4.2-9 PPN Untia development plan 70 4.2-10 Current view of the construction site of PPN Untia 70 4.2-11 Nusa Tenggara Timur (NTT) Province 72 4.2-12 Fish marketing channels for inter-regional and export destinations 76 4.2-13 Summary of fishing activities in Kupang and in the region 78 4.2-14 Current conditions and development plan of PPN Kupang 82 4.2-15 Administrative map of East Kalimantan Province 83 4.2-16 Fresh fish marketing channels in Nunukan 86
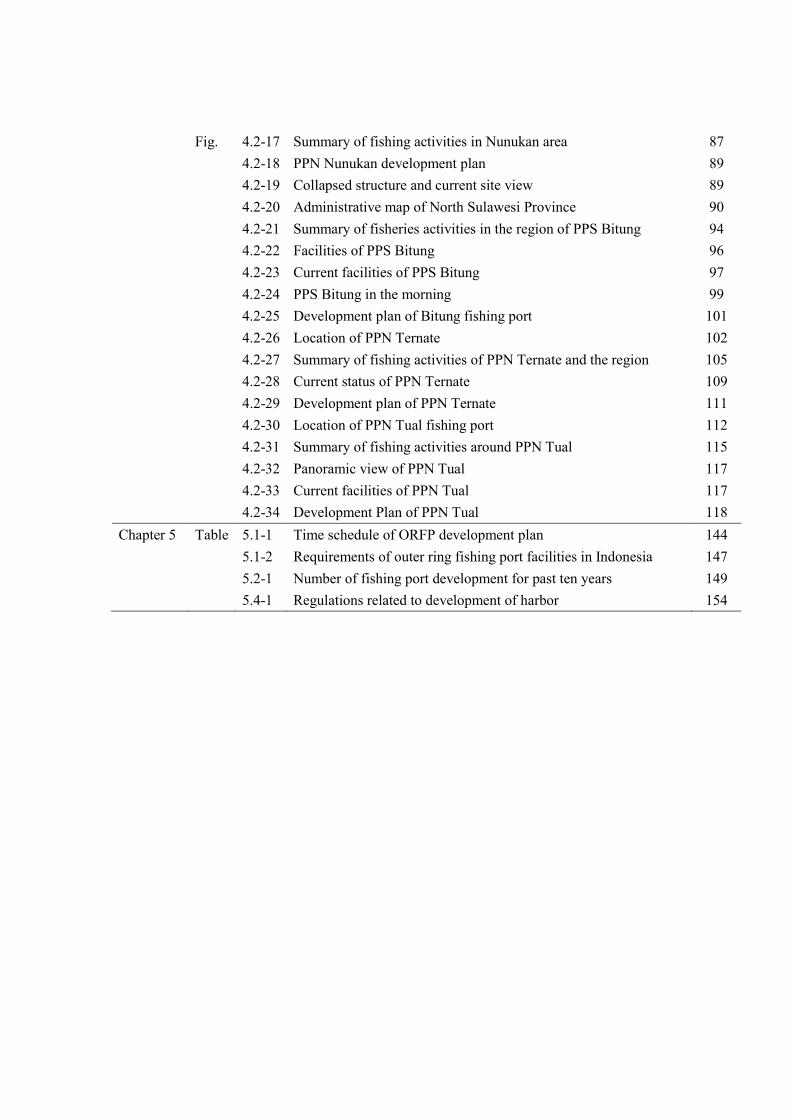
Fig. 4.2-17 Summary of fishing activities in Nunukan area 87 4.2-18 PPN Nunukan development plan 89 4.2-19 Collapsed structure and current site view 89 4.2-20 Administrative map of North Sulawesi Province 90 4.2-21 Summary of fisheries activities in the region of PPS Bitung 94 4.2-22 Facilities of PPS Bitung 96 4.2-23 Current facilities of PPS Bitung 97 4.2-24 PPS Bitung in the morning 99 4.2-25 Development plan of Bitung fishing port 101 4.2-26 Location of PPN Ternate 102 4.2-27 Summary of fishing activities of PPN Ternate and the region 105 4.2-28 Current status of PPN Ternate 109 4.2-29 Development plan of PPN Ternate 111 4.2-30 Location of PPN Tual fishing port 112 4.2-31 Summary of fishing activities around PPN Tual 115 4.2-32 Panoramic view of PPN Tual 117 4.2-33 Current facilities of PPN Tual 117 4.2-34 Development Plan of PPN Tual 118 Chapter 5 Table 5.1-1 Time schedule of ORFP development plan 144 5.1-2 Requirements of outer ring fishing port facilities in Indonesia 147 5.2-1 Number of fishing port development for past ten years 149 5.4-1 Regulations related to development of harbor 154

i
Executive summary
1. Outline of the study
1.1 Background of the study
The Republic of Indonesia (hereinafter referred to as “Indonesia”) has an abundant variety of
marine and fishery resources. Indonesia is one of the main fishing nations in the world with 2.74
million fishers (2.24 million marine capture fishers and 0.5 million inland open water capture fishers)
with about 5.2 million tons of capture fishery production (4.7 million of marine capture fisheries and
0.5 million tons of inland open water capture fisheries) in 2008. In addition, the development of
aquaculture has been remarkable. In 2008, the number of fish farmers was about 2.76 million and
production reached 3.85 million tons. Per capita consumption of fishery products in Indonesia has been
increasing from 23.95 kg in 2005 to 28.00 kg in 2008. Thus, fishery products are an important source of
good quality protein for Indonesian nationals. In marine capture fisheries, fishery resources tend to
decrease due to over fishing in western waters. On the other hand, fishery resources are kept in
relatively good condition in eastern water. However, in eastern Indonesia, the income of fishers is still
low because of a delay in basic infrastructure development, such as fishing ports, and improvement of
the fish distribution system, etc. To promote sustainable utilization of fishery resources in Indonesia, in
addition to improvement of the system and rules on fisheries management, it is important to promote
implementation of infrastructure development that is balanced regionally throughout this very large
territory. When the relevant parties examine support for the development of basic facilities of fishing
ports and functional facilities, such as storing and processing facilities for fishery products, it is
necessary to clarify the effectiveness and evaluation in implementing of the fishing port development,
and the priorities regarding assistance for the fishery sector from the aspect of supporting the sound
development of the fishery sector of Indonesia.
1.2 Purpose of the study
This study aims to collect the latest information on the current situation and issues affecting the
fishery sector as well as on fishing ports, and to examine the information to consider Japan’s aid
framework in the field of fishing port rehabilitation and renovation.
・Policy and programs of Indonesian government and trends of other donors’ assistance
・Support for sustainable development of the fishery sector in Indonesia
・Clarification of priorities in support of the fishery sector
・Confirmation of meaning and positioning of support for fishing port rehabilitation and/or renovation 1.3 Target areas of the study The target area of the study is the whole country of Indonesia from the aspect of information analysis. In the site survey, the team studied 7 outer-ring fishing port sites: Teluk Awang port (West
ii
Nusa Tenggara province), Makassar port (South Sulawesi province), Kupang port (East Nusa Tenggara province), Nunukan port (East Kalimantan province), Bitung port (North Sulawesi province), Ternate port (North Maluku province), and Tual port (Maluku province), all of which the Indonesian government expects to develop.
2. Current status and issues of marine capture fisheries
2.1 Current status of the fishery sector
Fishery production in Indonesia has increased slightly. It reached 9.05 million tons in 2008, 1.53
times that of the 5.91 million tons produced in 2003; it is the third largest in the world following China
and Peru. A brief breakdown is 5.20 million tons of capture fisheries (57%) and 3.85 million tons of
aquaculture (43%). The production of marine capture fisheries has been slightly increasing (7%) from
4.38 million tons in 2003 to 4.70 million tons in 2008, and inland open water capture fisheries
increased (62.5%) from 309 thousand tons in 2003 to 494 thousand tons in 2008. On the other hand,
marine aquaculture production increased 7.9 times from 249 thousand tons in 2003 to 1,966 thousand
tons in 2008, and brackish water aquaculture production increased 1.9 times and freshwater aquaculture
production increased 2.0 times in the same period, respectively. The increase in aquaculture production
is very obvious compared to capture fisheries production. Among the total production of marine
aquaculture, production of seaweed culture grew about 9.3 times from 230 thousand tons in 2003 to
2.14 million tons in 2008. The number of fishers involved in production in the fishery industry (marine
capture fisheries and inland open water fishery) is about 2.73 million in total. The number of inland
open water capture fishers is approximately 500 thousand. The number of fish processors increased
10.5% from 329,332 persons in 2005 to 363,980 persons in 2009. The import of fishery products
increased from 857,783 tons in 2003 to 911,674 tons in 2008. The value also increased from
US$1,643.542 million to US$2,699.683 million in the same period. The import of fishery products in
terms of quantity increased from 107,768 tons in 2003 to 280,179 tons in 2008 and in terms of value
increased from US$90.808 million to US$267.659 million during the same period. This is 2.6 times the
increase in quantity and 2.9 times the increase in value of imports1. Chilled and frozen fish was
imported the most with 83,984 tons in 2008. The share is 30% of the total. In a comparison of exports
and imports, exports exceed imports. However, the degree of increase for imports is bigger than that of
exports.
2.2 Current status of marine capture fisheries
Of the total of 9.05 million tons of annual fishery production for Indonesia in 2008, about 4.70
million tons (52%) were produced by marine capture fisheries. 330 thousand tons of scad was caught,
the most for a single species in the 4.22 million tons of production in 2008. About 300 thousand tons of
1 Import Statistics of Fishery Products 2008

iii
scad was caught in 2003, and this species recorded the highest production for the 6 years from 2003 to
2008, followed by about 300 thousand tons of skipjack, 250 thousand tons of Kunbun (a similar group
to horse mackerel), and 200 thousand tons of anchovy. Yellow-fin tuna, a major exporting product,
totaled about 100 thousand tons in 2008, which is 50 thousand tons less than that of 20032. Production
of shrimp is relatively stable with approximately 250 thousand tons. Large pelagic fish species
increased 1.4 times from 2003 to 2008. As of 2008, the number of marine capture fishers was about
2.24 million in the whole of Indonesia. 49.6% of them are full-time fishers.
Fish processing factories located in inland areas utilize catches that foreign fishing vessels caught
outside of the EEZ of Indonesia. There are three patterns seen in fish processing factories, namely,
Indonesian enterprises, joint ventures with foreign enterprises and foreign enterprises. MMAF promotes
the idea that Indonesian fishing vessels and boats catch the fish and then supply the catch to fish
processing factories associated with foreign enterprises3. Classification of processed fish products
described in the statistics for Indonesia consists of salted and dried fish, boiled fish, fermented fish
(berachan, peda, fish sauce), smoked fish, frozen fish, canned fish, and fish meal. In 2008, frozen fish
was produced the most with about 460 thousand tons, followed by salted and dried fish with about 450
thousand tons. These 2 items occupy around 75% of the total production of processed fish products4.
MSY (Maximum Sustainable Yield) is evaluated biologically by the work team composed of
LIPI (The Indonesian Institute of Sciences), the Marine fishery research bureau in MMAF, universities
and NGOs once every five years. 80% of MSY is set as TAC (Total Allowable Catch) in all Indonesian
waters. With regards to MSY, overexploitation exceeding MSY can be observed in WPP-RI571
(Malacca Strait/Andaman Sea) and WPP-RI714 (Toro Bay/Banda Sea), and the catch has been
excessive for the fishery resources to recover. Excessive fishing over TAC can be seen in
WPP-RI572+573 (West Sumatera, Indian Ocean+ South Java/South Nusa Tenggara/West Timor, Indian
Ocean) and WPP-RI712 (Java Sea) in addition to the above 2 fishing management areas.
Fishing Management Areas in Indonesia
(Source: Ministerial Decree of MMAF No. Per. 01/MEN2009 about Fishing Management Area of 2010)
2 Capture Fishery statistics of Indonesia 2008 3 Hearing from Directorate General of the fisheries processing circulation in MMAF 4 Capture Fishery Statistics of Indonesia 2008
iv
In Indonesia, a new system for fishery resources management has been introduced along with
progress in decentralization since 2000. The authority to manage fishery resources and capture fisheries
is shared among 3 different levels, namely, central government, province, and district/city. District/city
manages the area within 4 nautical miles from the coast, and province manages marine areas from 4
nautical miles up to 12 nautical miles. Central government is responsible for the management of fishing
operations in EEZ over 12 nautical miles and international waters.
As one of the fishery management measures, foreign fishing vessels and Indonesian fishing
vessels exceeding 100GT are obliged to be equipped with a Vessel Monitoring System (VMS). Fishing
vessels over 60GT and up to 100GT are to be provided with a transmitter, and fishing vessels smaller
than 60GT are to be provided with off-line VMS by MMAF5. According to MMAF, 3,500 fishing
vessels were equipped with VMS from 2003 until 2010; this number is about 80% of the total number
of fishing vessels over 100GT. As for fishing licenses, central government deals with fishing vessels
over 30GT, province with 10-30GT fishing vessels, and district/city with fishing vessels/boats smaller
than 10GT, respectively6. Other necessary operations are the surveillance and capture of IUU fishing
vessels/boats. The Navy, Marine Police, and DGMFRSC (DG of Marine & Fisheries Resources
Surveillance and Controlling) of MMAF have the power to do these operations. The Marine Police has
jurisdiction only in Indonesian waters, while DGMFRSC of MMAF controls not only Indonesian
waters but also the EEZ. These 3 parties collaborate with each other.
2.3 Issues on marine capture fisheries and countermeasures taken
Illegal, Unreported, Unregulated (IUU) fishing conducted by foreign fishing vessels, etc, has
been rampant outside of the 12-nautical-mile areas. Therefore, it is an urgent issue to strengthen the
MCS (monitoring, control and surveillance) system and utilize fishery resources effectively. As a
countermeasure to IUU fishing, MMAF is strengthening the surveillance of IUU fishing vessels using
VMS. The Minapolitan Development Plan in the National Mid-term Development Plan (2010-2014)
mentions some countermeasures in this field, which are at present ongoing. These countermeasures are
i) the improvement of the infrastructure for fish distribution and processing, ii) promotion of exports of
fishery products by supporting small-medium enterprises, iii) promotion of investment, iv) support for
formulation of small-medium business units in communities, v) development of financial institutions
for fishers’ organizations, vi) development of infrastructure in 100 small and archipelagic areas, and vii)
strengthening the capabilities of organizations and enterprises engaged in fish processing and
distribution. For exporting companies, MMAF obliges them to acquire international standards of
quality control such as HACCP and GMP and supports them financially from the national budget. The
method for collecting catch data, the foundation of fishery resources management, varies between
5 Indonesian Fisheries Book 2010 6 MMAF Directorate General of the Secretariat, Statistics information center
v
districts. Therefore, an unification of data collection standard is required. At present, each district sends
monthly the catch data to MMAF through the Internet. In each district, 3 members of the staff are
assigned to deal with fishery statistics on aquaculture, capture fisheries, and fish processing. They are
authorized to collect data from daily meetings with KUD (Village Cooperatives) under the Ministry of
Cooperatives and Small-Medium Enterprises, but in areas where KUD do not exist they conduct
sampling directly at fish markets and fish landing beaches. Moreover, their sampling frequency and
methods are not standardized. Therefore, the reliability of their information is doubtful. MMAF asks
experts on fishing management to check the data sent from provinces and districts twice a year.
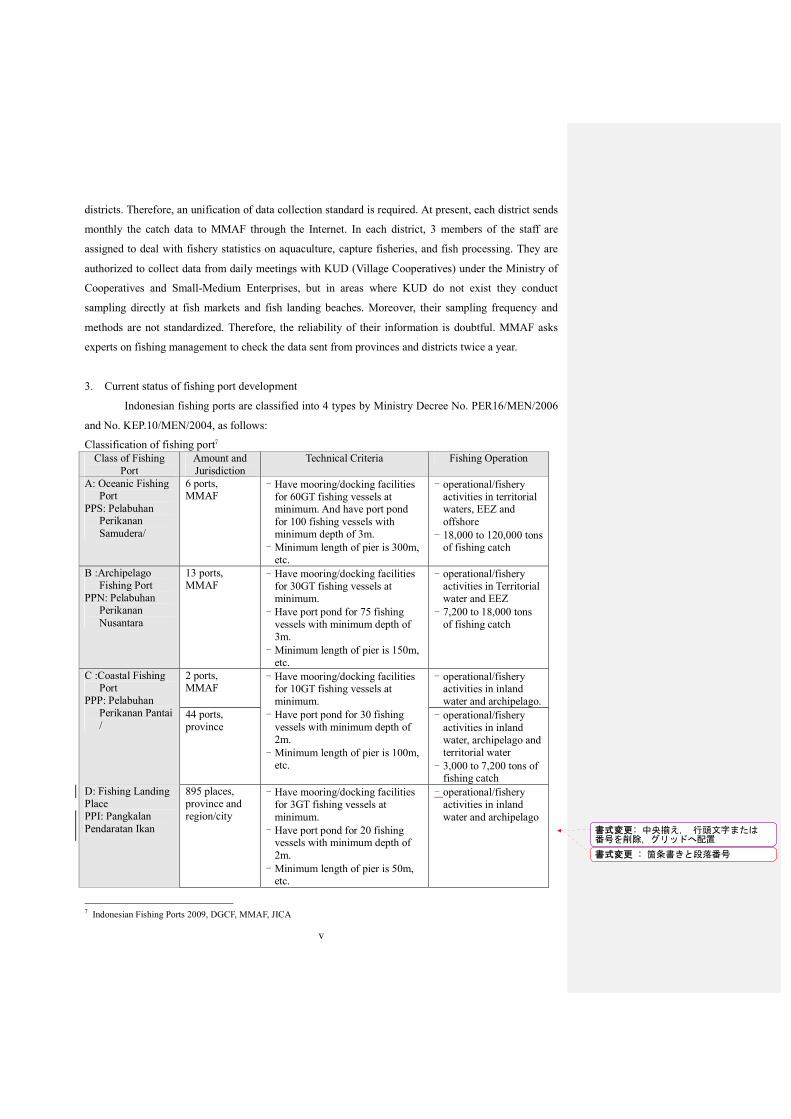
3. Current status of fishing port development
Indonesian fishing ports are classified into 4 types by Ministry Decree No. PER16/MEN/2006
and No. KEP.10/MEN/2004, as follows:
Classification of fishing port7 Class of Fishing
Port Amount and Jurisdiction
Technical Criteria Fishing Operation
A: Oceanic Fishing Port
PPS: Pelabuhan Perikanan Samudera/
6 ports, MMAF
- Have mooring/docking facilities for 60GT fishing vessels at minimum. And have port pond for 100 fishing vessels with minimum depth of 3m.
- Minimum length of pier is 300m, etc.
- operational/fishery activities in territorial waters, EEZ and offshore
- 18,000 to 120,000 tons of fishing catch
B :Archipelago Fishing Port
PPN: Pelabuhan Perikanan Nusantara
13 ports, MMAF
- Have mooring/docking facilities for 30GT fishing vessels at minimum.
- Have port pond for 75 fishing vessels with minimum depth of 3m.
- Minimum length of pier is 150m, etc.
- operational/fishery activities in Territorial water and EEZ
- 7,200 to 18,000 tons of fishing catch
C :Coastal Fishing Port
PPP: Pelabuhan Perikanan Pantai /
2 ports, MMAF
- Have mooring/docking facilities for 10GT fishing vessels at minimum.
- Have port pond for 30 fishing vessels with minimum depth of 2m.
- Minimum length of pier is 100m, etc.
- operational/fishery activities in inland water and archipelago.
44 ports, province
- operational/fishery activities in inland water, archipelago and territorial water
- 3,000 to 7,200 tons of fishing catch
D: Fishing Landing Place PPI: Pangkalan Pendaratan Ikan
895 places, province and region/city
- Have mooring/docking facilities for 3GT fishing vessels at minimum.
- Have port pond for 20 fishing vessels with minimum depth of 2m.
- Minimum length of pier is 50m, etc.
- operational/fishery activities in inland water and archipelago
7 Indonesian Fishing Ports 2009, DGCF, MMAF, JICA
書式変更: 中央揃え, 行頭文字または番号を削除, グリッドへ配置
書式変更 : 箇条書きと段落番号

vi
(Source: DG of Capture Fisheries, MMAF, 2009)
3.1 ORFP development master plan
The utilization rate of marine fishery resources in Indonesia is not the same between territories.
Some areas are over exploited and others are not utilized optimally. This disparity is related to the
development level of the fishing port facilities. In Indonesia, among 813 ports (as of 2004), most of the
fishing ports are small-scale PPI, and are located in Java, the east coast of Sumatra and the archipelago
coast, which makes up about 70% of the total. And only about 20% of the fishing ports are located in
the eastern part and outer ring area8. In connection with this deviation in fishing port distribution,
fisheries resources are considered that it is not optimally utilized in the outer ring area such as the
Indian Ocean (West Coast of Sumatra Is.), South China Sea, Arafura Sea, Sulawesi Sea and so on. It is
believed that there are underutilized resources in this area. However, this sparse fishing port location in
the outer ring area makes it difficult to monitor fishery resources and to control IUU fishing in the EEZ,
etc. Furthermore, the outer ring territory not only has a minimal amount of fishing port facilities, but
also the territory lags behind in economic and industrial growth. Thus, it is important to exploit the
underutilized resources of the outer ring areas not only by the fishery sector but also by other society-,
economy- and environment-related sectors, operating under the sustainable management principles.
Therefore, it becomes necessary to conduct a study to assess the future development of fishing ports in
the outer ring areas by examining location, development plans and phased construction. The study on
outer ring fishing port development for the master plan (Pe kerjaan Penyusunan Masterplan
Pengembangan Pelabuhan Perikanan di Lingkar Luar Wilayah Indonesia, Developmental Master Plan
Composition, Outer Ring Fishing Port of Indonesian Territory (CODE: SU-01), Dec.2004, Final
Report ; PT. Perentjana Djaja) was carried out in 2004. In the Outer Ring Fishing Port Development
Master Plan, 25 locations/sites in 20 provinces were selected to be developed from 813 fishing ports,
which were built by 2004.
3.2 Road map of ORFP development
In 2010, MMAF formulated the “ROAD MAP, OUTER RING FISHING PORTS
DEVELOPMENT, Pengembangan Pelabuhan Perikanan di Lingkar Luar Wilayah Indonesia, 2010,
DIRECTORATE GENERAL OF CAPTURE FISHERIES” which provides an overview of the ORFP
development plan, its current activities and step-by-step execution of the plan. The number of fishing
ports increased from 813 ports to 968 ports in 2010.
The outer ring fishing port development is planned to be implemented through the following
three stages.
Phase I: To locate the highest priority to eastern Indonesia and the border area. The development
8 Marine and Fishery statistics of Indonesia(DKP, 2007)

vii
study was carried out for 8 locations (Bitung, Merauke, Pengambengan, Nunukan, Ternate,
Teluk Awang, Kupang, Makassar) and drawing a detailed design for 6 locations and
implementation of development/improvement of the fishing ports for 4 locations were carried
out at a total estimated cost of 1.08 trillion IDR over 5 years.
Phase II: To complete the high priority locations and remaining locations in eastern Indonesia and to
start work in western Indonesia. The development study for 9 locations and the compiling of
the detailed design for 10 locations and implementation of development/improvement of the
fishing ports for 9 locations were carried out at a total estimated cost of 1.08 trillion IDR over
5.5 years.
Phase III: Phase III is the final stage of the ORFP Development that expands to fishing ports in
western Indonesia, with a total estimated cost of 3.05 trillion IDR over 5.5 years.
The proposal for the development of 8 fishing port that were selected in Phase-I was sent to
BAPPENAS in 2006, and it was regarded as a priority project in the Blue Book 2006-2009. The actions,
which have been carried out since 2004, are seen in the following table. In 2005, Untia fishing port
(Makassar) was added as ORFP, and the total number of ORFP became 26 locations.
Planning/ development process of ORFP development 2004 2005 2006 2007 2008 2009 2010
Outer Ring Fishing Port Province
Preparation, FS ; ⓐ Review ⓑ; Rehab./ Improv. of Jakarta Fishing Port;ⓓ Operational & Rehab./ Improv. of Fishing Port Facilities; ⓔ
Detail Design ; ⓐ Construction; ⓑ Operational & Rehab./ Improv. of Fishing Port Facilities; ⓔ
Proposals of Outer Ring Fishing Port to the Blue Book Proposal 2006-2009 Detail Design ; ⓐ Master Plan & Detail Design ; ⓑ Signing Aide Memoire ; ⓒ
Construction (TP) ; ⓐ Construction (DAK) ; ⓑ Construction (Deco Funds); ⓒ
Construction (TP) ; ⓐ Construction (Deco Funds); ⓒ Loan Agreement (IDB) ; ⓓ Operational & Rehab./ Improv. of Fishing Port Facilities; ⓔ
Construction (TP); ⓑ Construction (DAK); ⓒ Implementation of Development / IDB; ⓓ Operational & Rehab./ Improv. of Fishing Port Facilities; ⓔ
Construction (TP Province); ⓑ Construction (TP District); ⓒOperational & Rehab./ Improv. of Fishing Port Facilities; ⓓ Institutional Reform and detail design (IDB); ⓔ
Sabang Labuhan Haji
NAD
ⓔ
ⓔ
ⓑ
ⓒ; Construction
ⓒ; Construction
ⓒ; Construction
ⓒ; Construction
Belawan Sibloga
North Sumatra
ⓑ
ⓔ
ⓔ
ⓔ
ⓒ
ⓒ
ⓓ, ⓔ
ⓓ, ⓔ
ⓓ, ⓔ
ⓓ, ⓔ
ⓓ, ⓔ
ⓓ, ⓔ
Bungus West Sumatra ⓑ, ⓔ ⓔ
Review Master Plan ⓔ ⓔ ⓓ
Tarempa Riau Island
ⓐ, ⓒ; Construction
ⓒ; Construction
Pulau Baai Bengkulu ⓔ ⓔ ⓐ
ⓑ, ⓒ; Construction
ⓒ; Construction
ⓑ; Construction
ⓑ; Construction
Pemangkat West Kalimantan ⓑ, ⓔ ⓔ ⓔ ⓔ ⓓ
Nunukan East Kalimantan ⓐ
ⓑ;Construction Construction ⓐ;
Construction ⓐ;
Construction
Jakarta Jakarta ⓓ;JBIC Loan Phase-V,
ⓔ
D/D & Rehab./JICA Rehab. &
Improv./JICA Rehab. &
Improv./JICA Rehab. &
Improv./JICA
Pelabuhanratu
West Java ⓔ ⓔ ⓑ ⓔ ⓔ ⓓ

viii
Cilacap Central Java ⓔ ⓔ
Development / Improv. ⓔ ⓔ ⓓ
Sadeng DI Yogyakarta ⓔ
Prigi Pondokdadap
East Java ⓔ
ⓔ
ⓑ,ⓒ; Construction
ⓔ
ⓒ; Construction
ⓔ
ⓑ, ⓒ; Construction
ⓓ
ⓑ; Construction
Pengambengan
Bali ⓔ ⓔ ⓓ
Teluk Awang
West Nusa Tenggara ⓐ
ⓑ;Construction, ⓔ
Construction by Deco Funds for
NTB
ⓒ; Construction
ⓐ; Construction
ⓑ; Construction
ⓒ; Construction
Kupang East Nusa Tenggaara ⓐ
Bitung North Sulawesi
ⓑ; Constructio
n Review Design
Kwandang Gorontalo
ⓒ; Construction
ⓒ; Construction
ⓑ; Construction
ⓑ; Construction
Tual Maluku ⓔ ⓔ Reclamation etc. ⓔ ⓔ ⓓ
Ternate North Maluku ⓔ
Land Acquisition,
ⓔ ⓔ ⓓ
Merauke Biak
Papua West Papua ⓐ
ⓑ;Construction ⓐ
Construction by Deco Funds
ⓑ, ⓒ; Construction
ⓐ; Construction
ⓑ; Construction
ⓒ; Construction
Solong West Papua ⓑ
Makassar South Sulawesi ⓐ Construction
Note: Colored cells show the seven surveyed sites.
3.3 Issues to be addressed in implementing the ORFP development plan
① To optimize fishery resources exploitation
According to the strategic plan of DKP9, the fishing catch is expected to increase at a rate of
0.55% per year from 2005 to 2009. From this aspect, the reduction of the fishing catch owing to
attempts to stop over-fishing might be counterbalanced by IUU prevention measures and utilization of
unexploited resources. Thus, the 0.55% increase rate would be considered as a realistic target. For the
utilization of fishery resources under appropriate management, it is necessary to acquire the more
accurate information regarding fishing catch and the current status of resources in outer ring fishing
ports, and to improve the monitoring of ships. In this sense, it is important for the ORFP development
to work alongside related policies and measures on resource and fisheries management.
② International standard facilities
In most of the fishing ports, the ice and fresh water supply does not fully satisfy the demand. And
today, the fish processing industry requires international standard quality and hygiene for fish material
and its treatment. Thus, the improvement in ice/water supply and hygiene systems in fishing ports is
increasing in importance
③ Scale and contents of the facilities improvement plan
9 RENCANA STRATEGIS PEMBANGUNAN KELAUTAN DAN PERIKANAN TAHUN 2005 – 2009, DKP, 2005.

ix
From the point of view of spreading fishing activity throughout the outer ring territory, the
disposition of the planned sites would be geographically effective. However, as a delay caused by the
lack of funding has already been seen in the project, it is considered that the scale of this project would
be too ambitious for the government of Indonesia to complete with its own budget within the planning
period.
In the ORFP Master Plan, the fishing port classification and the size of the facilities to be
improved are based on the total allowable catch in the WPP fisheries management area, which each
fishing port shares. And the actual demand and conditions of each site such as resources, catch, fishing
boat, fishers, market, fish processing and distribution are not investigated in particular. Thus, it is
needed to investigate these aspects for the following detailed design and planning works. Concrete
development contents of individual fishing ports are entrusted to the detailed design and planning
works carried out after the master plan, and a concrete image has not yet been produced by the master
plan.
④ Distribution of fishery products to the outside regions
In terms of fishery product distribution toward the outside regions, it is important to have a reefer
container service, to be able to accommodate large carrying vessels in fishing ports, and to be able to
make use of an airline. Today, in Indonesia, a regular container service network has spread throughout
the territory and connects major commercial ports in each region even in the outer ring areas. This has
been developed through the improvement of container handling facilities in commercial ports by the
Indonesian government. Therefore, fishery products are already shipped by reefer containers from the
eastern outer ring territories. The regular container service network in the eastern area starts from
Surabaya to Makassar, and then spreads to more eastern territories along some major routes.
4. Results of site surveys at the target fishing ports
4.1 Selection of the target fishing ports
As a result of this survey on the seven selected outer ring fishing ports, the development plan of
each site is summarized in the following table. Here, in the site survey, SWOT analysis on the
development plan is carried out to properly take into account the characteristics, current situation and
problems of each site, based on discussions with those involved.

x
Survey results on the seven ORFP development sites Site Expected Users Scale of Facility Outcome Problems & Tasks
PPN Teluk Awang
145 sampan-type boats behind the fishing port and boats from two PPI on the eastern coast. It is not clear whether there will be a new entry of 30GT-class boat. In the province, there are 145 boats of 10~20GT class.
It is believed that some private companies are considering moving to the fishing port.
The reclaimed land is big enough at present. Two jetties for small boats and 30GT-class boats are planned. The length of the main jetty of maximum size but in the first stage it could be kept to a minimum requirement.
Small-scale fishers expect to enlarge their fishing boats so as to operate off the gulf of Ekas. Get close to the fishing grounds in the Indian Ocean for fishing boats which use the current PPI. Base for patrol boats to operate in the Indian Ocean.
Access road is very poor. Development of access road is needed in parallel with fishing port construction. Electricity is limited and lacking. Need to investigate expected users of the fishing port, and related measures. Delay caused by budget shortfall.
PPN Untia (Makassar)
In the province, there are 149 boats of 20GT and larger classes. In the Makassar area, all fishing boats are less than 10GT. It is not clear whether there will be a new entry of 30GT-class boats.
Currently, fishing boats use the two existing PPI, but they are not enough to satisfy demand. Demarcation for utilization of neighboring PPI is not clear.
Fishing port is planned to be located 600m offshore in order to keep its depth of 3m and to fulfill the requirements of PPN. This requires a large-scale breakwater and dredging.
To solve the shortage of mooring and handling facilities in current PPI. To improve hygiene condition and to be capable of meeting the requirements of fish processors. To make active use of the logistical advantage of the city.
Need to investigate expected users of the fishing port, and related measures. Delay caused by budget shortfall. Sedimentation in the port pond and around the fishing port.
PPP Kupang
Mainly used by medium to large class boats larger than 10GT. In 2009, there were 879 visits to PPP, and 100~140 monthly visits occurred in high season.
Fishing port users are well demarcated with other PPI.
It is not clear about the demand for land area.
In high season, the shortage of jetty space becomes serious. To breakup this congestion, a 2-to 3-fold extension of the jetty would be required. Thus, the development plan of the jetty is considered as correct. A port pond with enough depth is greatly needed, but not implemented in the development plan.
To solve the congestion of fishing boats in high season.
To shorten the waiting time to unload, and to improve fish quality.
To break up transshipment and to intensify the catching data collection and resources management.
Base for patrol boats.
Shortage of jetty makes fishers continue transshipment. Development of jetty is greatly needed.
Upgrading revetment around port basin and deepen it could improve port basin with enough depth.
PPN Nunukan
The outboard engine boat is dominant, along with inboard engine boats less than 5GT. It is not clear whether there will be a new entry of 30GT-class boat. Most of the fishers live in Sabatik Is. near to Nunukan, which is about one or two hours from the project site.
Minimum scale jetty is planned as PPN.
To be an inter-regional and export shipment base.
To intensify fishing data collection system and resource management.
To be a fishing base for border areas and support safe and stable fishing activities.
Base for patrol boats.
Need to investigate expected users of the fishing port, and related measures.
Effectiveness of administrative direction to Sebatik fishers to use new fishing port.
Inadequate execution work would cause foundation problems

xi
Survey results on the seven ORFP development sites (Continued) Site Expected Users Scale of Facility Outcome Problems & Tasks
PPS Bitung
PPS is used by both small-scale boats and large commercial fishing boats (21,000 visits per year).
Not only large boats but also small-scale fishers provide fish to processors.
The development plan for the jetty is correct based on the calculation of the current number of boats and visits by small boats.
And it would also be improved for large-scale boats, but some congestion caused by preparation work would occur.
To shorten the waiting time to unload, and to improve fish quality for both large-scale and small-scale fishing boats.
To halt additional private jetty enhancement and to consolidate fishing catch to the fishing port.
To provide hygienic conditions in the fishing port and to be capable of meeting processors’ requirements.
It is difficult to expand further from current development plan, because land space is limited.
Demarcation between neighboring Perikanan Nusantara.
The sun shade roof is working well. And further development might be considered to improve hygienic condition.
PPN Ternate
Demarcation for utilization of neighboring PPI is not clear. At present, there is no critical shortage of facilities.
The scale of the existing jetty is correct, compared to the required jetty length (160m) based on the calculation of the current number of boats and visits.
There is sufficient room for jetties to accept cargo ships through shortage of commercial port facilities. Thus the jetties would be capable of meeting demand from fishing boats.
Need to investigate expected users of the fishing port, and development plan.
Demarcation between neighboring PPI is to be investigated.
PPN Tual
Number of boat visits in 2009 was only 30 and no fish catch was landed at the fishing port. Currently, it is believed that large commercial fishing boats are using Ambon and Bitung fishing ports.
Before 2007, many large fishing boats, including foreign boats, entered PPN Tual. In these conditions, demand for fishing port facilities was high.
There is no special note.
The most important issue is to normalize current situation where there is little exploitation by fishing boats.
Inter-regional demarcation involving Ambon and Bitung about large fishing boats
xii
4.2 A summary of the survey results (at the target fishing ports)
In general, fishing port development planning should be based upon a proper spatial plan
designed by the public sector and the scale of infrastructure should be balanced with expected sizes and
numbers of fishing boats. Within the surveyed seven sites, Teluk Awang, Untia (Makassar) and
Nunukan are newly constructed fishing ports and construction work has already been started by the
Indonesian government’s budget. MMAF is making every effort to get the necessary budget for the
development of fishing ports. However, it takes time to obtain the budget and the short fall in the
budget, which is not enough for construction, produces a delay in fishing port development. In addition,
owing to the difficulties regarding supervision of construction work and technical difficulties, the
progress of fishing port development is not meeting the government’s expectation. Thus, the
government of Indonesia anticipates assistance from Japan, because Japan has considerable experience
in fishing port/port development with international high standards and precise technical management.
In fishing port development, unlimited coastal exploitation, which might impact coastal fisheries,
such as reclaiming mangrove swamps, should be prevented in terms of sustainable fisheries
development. Within the seven surveyed sites, PPN Nunukan is located near a mangrove swamp, there
is a lobster spawning ground off Awang bay in Teluk Awang, and Kupan City is making a considerable
effort to protect its coastal environment. These aspects should be taken into account in fishing port
development.
At every site, in order to consider assistance to the plan, it is necessary to assess comprehensive
benefits based on the analysis considering demand and supply, including detailed information and needs
of expected beneficiaries, supposed ways of uses, suitable scale and detail of the facilities based on the
above results. Particularly, the plans of newly constructed fishing ports should be carefully examined,
since; 1) the conditions and needs of the expected beneficiaries have not been investigated; 2) the
demarcation of neighboring PPI and the new fishing ports have not been clarified; and 3) the division of
the port users between neighboring PPI and new fishing ports has not been considered. Here, it would
be advisable in every ORFP site to investigate the expected benefits and to re-examine the detailed
plans.
5. Synthesis of the study results
5.1 Preliminary appraisal of ORFP development plan
(1) Relevance
The ORFP plan has an important mission to fulfill the increasing domestic demand for fish and
there is an issue that the contribution of the fishery sector to the national economy increases as
international demand for fishery products increases. Although the Indonesian government is expected to
meet these needs, Indonesian fishery production is almost reaching the upper limit from the point of
view of the availability of marine fishery resources (MSY: 6.4 million tons and TAC: 5.12 million tons).

xiii
As such any increment in total fishery production from now on cannot be expected in the marine
capture fisheries sector. However, the activities of the fishing fleet are not evenly conducted in the
domestic water areas and it can be said that utilization of resources is still low in some areas, so there
should be remaining rooms for further development. These areas are rather remote areas along the outer
ring of Indonesian territory, and most of them are underdeveloped. Therefore, it is thought that the
needs of fishing port development, which promote balanced utilization of fishery resources, are very
high. The ORFP-DP is a plan to contribute to the promotion of effective utilization of resources in the
underdeveloped areas within the EEZ, ensuring the safety of fishery industry operation in the marginal
areas of Indonesia and proper utilization of fishery resources, in addition to the eradication of the IUU
fishing through the provision of operation bases for national patrol vessels for monitoring, control and
surveillance of the EEZ areas. For that reason, the development needs of ORFP-DP to provide new
fishing ports meeting international standards in the Indonesian outer ring area are very high.
(2) Efficiency
Regarding the efficiency of this project, it is considered from the viewpoint of (1) output (2) time
frame and (3) project costs as shown below. Although they have anticipated financial assistance from
external sources (donors) with the implementation of the ORFP development plan of MMAF from the
beginning, they have developed the master plan of ORFP in 2004, and initiated their own efforts by
making the best use of whatever available budget (central, regional and extraordinary budget, etc.). The
project started by taking phased approach (one to three) regarding the 26 outer ring fishing ports with a
total project cost of 6,500 billion IDR (approx. 65 billion yen) in the implementation period of 8.5 years.
This is because they viewed that overseas assistance would take considerable time. Such effort is an
indication of the Indonesian government’s firm commitment on the ORFP-DP. However, it was
observed during the construction work in phase one that a steel pipe pile of the pier in Nunukan
collapsed because of heavy weather, and construction work slowed in Teluk Awang and Makassar
because of the delay in executing the project’s budget Similar problems may occur and this may further
delay the time of completion. Therefore, at present, completion is nowhere in sight, and it has to be
judged that effectiveness level of this plan is low.
These problems can be considered technical matters; but may also be attributed to the fact that
they cannot receive the support of overseas donors in a timely manner.
(3) Prospects for effectiveness
In order to produce a positive effect from fishing port development, good management of
facilities working in tandem with other relevant plans such as those for resources, production,
processing, circulation, retail and consumption (disposal) are vital.
As for effectiveness, judging from the construction progress situation, it is almost impossible to
xiv
hope for completion of construction of all the sites in phase 1 (nine places) with the original budget. In
case funding from overseas cannot be provided, phase 2 (9 sites in total comprising Sorong, Biak and
Kwandang in the east, which were not in phase 1, and six places in the west), and phase 3 (8 sites in the
west) started some construction work in 2007 and 2005, respectively, which influences the whole of the
ORFP development plan.
However, the development needs of the outer ring fishing ports are considerable, and this is the
project plan with emergency-like points such as the eradication of IUU fisheries, so ensuring promotion
of the plan is a priority.
5.2 Feasibility of ORFP development plan
(1) Technical ability
The Indonesian government has about 960 fishing ports throughout the country and makes considerable
effort in the development of fishing port infrastructure facilities especially in the rural areas for the
continuous utilization of fishery resources. The results show that about 370 fishing ports have
undergone development in the last ten years. The outer ring fishing ports will fall into the existing PPS
or PPN (classes A or B) according to the plan, and there are 6 places in class A and 13 places in class B
at present. Considering these points, it is judged that the technical ability regarding fishing port
development is sufficient. It is planned that the scale and specifications of ORFP-DP match
international standards, and it is necessary to implement the plan steadily taking into account the
experience gained in Jakarta fishing port (as a hub port of ORFP in the western area) where the bank of
a quay is presently being raised.
(2) Maintenance and management ability
Fishing port facilities in Indonesia are managed by two organizations at present namely UPT and
PERUM. However, the Directorate General of Capture Fisheries of MMAF (the fishing port bureau is
in charge) has responsibility for the completion of construction, and the central government has overall
implementation responsibility, although local governments (province, prefecture and city, etc.)
sometimes have responsibility due to the change of the source of project budget by site and by year.
The ORFP-DP is divided into three phases, and it is for the large-scale project to develop 26 fishing
ports throughout the country, which are required to comply with the international standards. The project
has already started with a total project cost of 6,500 billion IDR (about 65 billion yen) and an
implementation period of 8.5 years. In view of the overall scale of this large project, it cannot be simply
said that relevant authorities are capable of managing the project based on the fact that they have
successfully managed the past (rather smaller scale) fishing port development projects.. For this reason,
technical guidance especially focused on administration of the project is important as part of the
technical assistance.

xv
(3) Funding ability
As mentioned above, outer ring fishing port development has a goal of sustainable utilization of
fishery resources; in addition, this project has been approved as an operation of high urgency among
the fishery sector development plans in Indonesia. Although the Indonesian government has
anticipated assistance from overseas development partners (donors) for the implementation of this
program, it settled on the master plan in 2004 because of the urgency of the situation, and through
making the most use of its own budget (central, regional and extraordinary budget, etc.). This is
because overseas assistance takes time, and shows that the Indonesian government would like to
conduct the project autonomously with their own budget.
However, during the construction work, problems have been revealed such as the collapse of a
steel pipe pile of a pier during heavy weather, slowing down of construction work because of the delay
in allocating the project budget, and postponement of the completion date. In Teluk Awang, Nunukan
and Merauke, which are newly constructed fishing ports under phase 1, the budget has been allotted
annually since construction started in 2005; but the fact is that there is not enough money to be able to
finish within the period as originally scheduled. The situation is not clear whether or not the necessary
budget can be procured. Although the Indonesian government has started construction work with its
own budget through its own organization because of the necessity and urgency of this project, in terms
of the construction progress and management situation of phase 1, considerable delays have already
occurred.
(4) Necessity for close cooperation with related projects
For the outer ring fishing port development, it is important to carry out related plans such as fishing
boats building and distribution, and preparation of support facilities such as roads and bridges for fish
distribution in a timely manner. Close cooperation with other ministries and private enterprises is
essential to achieve the aims of the ORFP development plan, and there is a need to push related projects
of public infrastructure such as roads, and to attract private enterprises, for example, fishery
processing-related companies etc.
5.3 Suggestions/ recommendations on the ORFP development plan
There are a number of salient issues identified in the course of the study, which may require the
MMAF’s additional actions. The followings are suggestions/ recommendations drawn from the
synthesis of the study results
(1) Principles of facility development
The main point in the facility development project comes down to a simple question; “are they
actually used and how effectively are they utilized?” The facilities become obsolete over time, and
xvi
there is the possibility the useful life of the facilities is reduced even by half when maintenance is not
good. Hence, in ORFP-DP the most important point is to maintain the necessary quality (Q), and to
complete construction steadily within the given cost brackets (C) and for a fixed period (D).
(2) Re-evaluation of demand prediction/development strategies at each site
The size of fishing ports in the master plan has been determined simply based on estimated
available quantity of fishery resources in the area. The fishing port developed in such a way may likely
be over-sized as compared to the actual demand from the fishing industry in the area.
(3) Clarification of the responsibilities among relevant government agencies in the implementation of
the ORFP development plan
In the fishing ports under construction, there are several fishing ports where improvement work is
slow due to the lack of budget and delay in budget execution. In addition, it often occurs that
implementing agencies change several times, for example, province to regency, or regency to province,
in the course of construction. This may cause lack of management and confusion. It is necessary to
clarify the responsibility system for the project implementation before assistance is considered.
(4) Timely and coordinated implementation of supporting facility development
It was observed that some of the roads and bridges are remained non-functional in some of the
outer-ring fishing ports of Phase 1. It is important to improve the basic social infrastructure to keep
pace with outer-ring fishing port development in order to reinforce the distribution system for fishery
products.
(5) Clear demarcation of technical responsibilities when taking over development work
In every site, understanding comprehensive benefits, the project beneficiaries, and usage patterns
of the facilities is important. Investigation/analysis about assumed advantages must be done before the
support is considered. In the case where construction work on the facilities is under way, it is necessary
to analyze the prospective outcomes/benefits and to review the plan based on analysis of each site
raised in the ORFP development plan in order to clarify the demarcation of technical responsibilities
and to promote the project having a common understanding among stakeholders.
(6) Importance of the supervision of work
The supervision of work is important as there are problems such as loss of expected revenue
because of delay in the construction work, reduced profit owing to an increase in management and
security cost and so on.
(7) Necessity of the operation/management plan of the fishing port
Cooperation between the public and private sectors is important in such a way that public sector
investment is kept to a minimum and private sectors carry out the development as much as possible in
cooperation with public sectors. In this case, it is necessary to formulate an adequate management and
administration plan of the port.
xvii
5.4 Other remarks
(1) Environmental impact assessment (EIA)
For the construction of fishing ports, examination and evaluation of environmental influences
are carried out in accordance with the environmental law of Indonesia. Implementation responsibility of
the EIA lies with the MMAF.
(2) Private sector’s needs and projection of the demand for fish and fish products
The authorities need to pay due considerations on needs of private sectors such as importers,
consumers and so on taking principles of effective use of fishery resources into account.
Since this study is conducted mainly through the collection and analysis of existing information
and site surveys of 7 ports, it has only examined the outline of ORFP-DP, not the details of each fishing port. Therefore, for the thorough examination of the ORFP development plan, it is necessary to collect more detailed information through further investigation, to make clear the level of responsibility for construction work already completed within the framework of the project, and to discuss continuously the concrete implementation methods to ensure quality of each project.
1
Chapter 1 Outline of the study
1.1 Background
1.1.1 General information of Indonesia
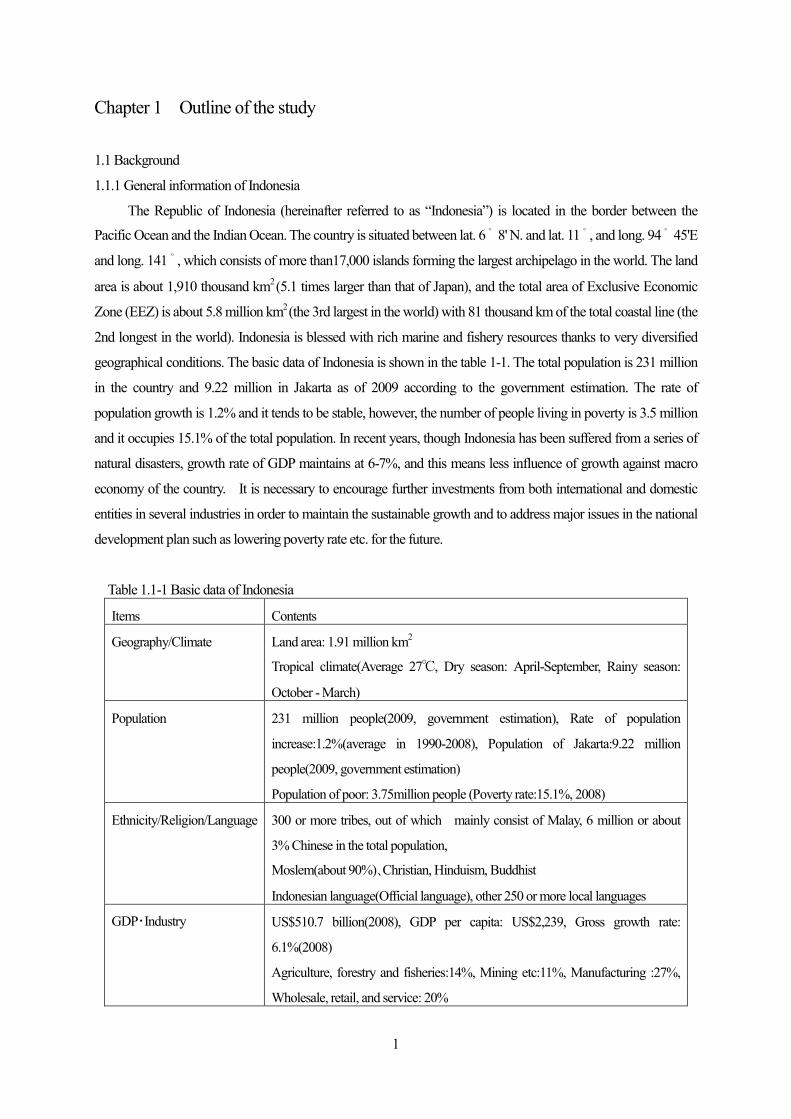
The Republic of Indonesia (hereinafter referred to as “Indonesia”) is located in the border between the
Pacific Ocean and the Indian Ocean. The country is situated between lat. 6 ゚ 8' N. and lat. 11 ,゚ and long. 94 ゚ 45'E
and long. 141 ,゚ which consists of more than17,000 islands forming the largest archipelago in the world. The land
area is about 1,910 thousand km2 (5.1 times larger than that of Japan), and the total area of Exclusive Economic
Zone (EEZ) is about 5.8 million km2 (the 3rd largest in the world) with 81 thousand km of the total coastal line (the
2nd longest in the world). Indonesia is blessed with rich marine and fishery resources thanks to very diversified
geographical conditions. The basic data of Indonesia is shown in the table 1-1. The total population is 231 million
in the country and 9.22 million in Jakarta as of 2009 according to the government estimation. The rate of
population growth is 1.2% and it tends to be stable, however, the number of people living in poverty is 3.5 million
and it occupies 15.1% of the total population. In recent years, though Indonesia has been suffered from a series of
natural disasters, growth rate of GDP maintains at 6-7%, and this means less influence of growth against macro
economy of the country. It is necessary to encourage further investments from both international and domestic
entities in several industries in order to maintain the sustainable growth and to address major issues in the national
development plan such as lowering poverty rate etc. for the future.
Table 1.1-1 Basic data of Indonesia
Items Contents
Geography/Climate Land area: 1.91 million km2
Tropical climate(Average 27℃, Dry season: April-September, Rainy season:
October - March)
Population 231 million people(2009, government estimation), Rate of population
increase:1.2%(average in 1990-2008), Population of Jakarta:9.22 million
people(2009, government estimation)
Population of poor: 3.75million people (Poverty rate:15.1%, 2008)
Ethnicity/Religion/Language 300 or more tribes, out of which mainly consist of Malay, 6 million or about
3% Chinese in the total population,
Moslem(about 90%)、Christian, Hinduism, Buddhist
Indonesian language(Official language), other 250 or more local languages
GDP・Industry US$510.7 billion(2008), GDP per capita: US$2,239, Gross growth rate:
6.1%(2008)
Agriculture, forestry and fisheries:14%, Mining etc:11%, Manufacturing :27%,
Wholesale, retail, and service: 20%

2
Work force/Unemployment
rate
Agriculture, forestry and fisheries:44%, Mining etc:1%, Manufacturing :12%,
Wholesale, retail, and service: 11%
Unemployment rate:8.46%(February, 2008)(high standard)
Export US$136.7 billion(2008), Export to Japan: US$ 27.7 billion(2008)
Import US$105.1 billion(2008), Import from Japan: US$ 15.1 billion(2008)
(Source: JETRO (J-FILE) Indonesia)
1.1.2 Background of the study
Indonesia is abundant to variety of marine and fishery resources. Indonesia is one of the major fishing
nations in the world with 2.74 million fishers (2.24 million of marine capture fishers and 0.5 million of inland open
water capture fishers) and with about 5.2 million tons of capture fisheries production (4.7 million of marine
capture fisheries and 0.5 million tons of inland open water capture fisheries) in 2008. In addition, development of
aquaculture is remarkable. In 2008, the number of fish farmers is about 2.76 million and the production reached
3.85 million tons. Per capita consumption of fishery products in Indonesia has been increasing from 23.95 kg in
2005 to 28.00 kg in 2008. Thus fishery products are an important source of high quality protein supply to
Indonesian nationals. Indonesia exported about 0.91 million tons of fishery products in 2008 and earned USD 2.7
billion. Fishery products constitute an important share of exporting products in the primary sector of Indonesia.
Marine waters of the country were initially divided into nine Fisheries Management Areas (FMA), which
was increased to ten in the end of 2006 by sub-dividing the Indian Ocean FMA into two at Sunda Sea Strait
located offshore area of Sumatera, Java, Bali, and Nusa Tenggara. Furthermore, the Sulawesi and Pacific Ocean
FMA was sub-divided into two areas at near Morotai Island located in the north of Halmahera Island in 2009,
which made the total number of FMAs eleven(Government Decree No.PER.01/MEN/2009) . Such changes are
meant for more manageable and effect management of fishery resources. Relevant laws and regulations were also
revised accordingly in order to strengthen management of fishing activities in the new FMAs and undertake
proper and sustainable utilization of fishery resources. In marine capture fisheries, fishery resources show an
apparent tend of decrease due mainly to over fishing in the Western water areas. On the other hand, fishery
resources in the Eastern water areas are considered to be relatively in good condition. However, in the Eastern
Indonesia, income levels of fishers are still low because of delayed development of basic infrastructure such as
fishing ports and fish distribution systems etc. To improve income of fishers, it is necessary to utilize more
varieties of fishery resources and to improve the quality of fishery products, which may suggest the needs for more
efficient fish loading at fishing ports, introduction of fair fish dealing systems, improvement of storage and
processing facilities, and establishment of fish distribution networks connected to consumption areas.
In addition, it is also important to ensure the quality of fishery products by improving hygienic standard of
fish handling in view of effective utilization of fishery resources. To attain the sustainable utilization of fishery
resources in Indonesia, the promotion of balanced infrastructure development is considered important in regions in
Indonesia’s vast landmass, adding to the improvement of systems and regulations on fisheries management.

3
When the relevant parties examine supports for the development of basic facilities of fishing ports and functional
facilities such as those for storing and processing of fishery products, it is necessary to clarify the effectiveness and
evaluation in implementing the fishing port development, and the priorities in the assistance of the fisheries sector
from the aspect of supporting sound development of the fisheries sector of Indonesia.
Based on the above understandings, the study examines issues through the review of the current situation of
the fisheries sector and the relevant policies. Also, the study clarifies the socio-economic situation and needs of
stakeholders in marine capture fisheries and private enterprises relevant to capture fisheries and fish processing in
order to predict the future of these parties and future trends regarding fishery resources. In addition, the study
collects and analyzes information on fishing port facilities.
1.2 Purpose of the study
This study aims to collect the latest information on current situation and issues affecting the fisheries sector
as well as fishing ports, and to examine the information to consider Japan’s aid framework in the field of fishing
port development.
・Policies and programs of the Indonesian government and trends in other donors’ assistance
・Support for sustainable development of fisheries sector in Indonesia
・Clarification of priorities in the support of the fisheries sector
・Confirmation of meaning and positioning of support for fishing port rehabilitation and/or renovation
1.3 Target areas of the study
The target areas of the study are the whole country of Indonesia from the aspect of information analysis. In
the site surveys, the team studies 7 outer-ring fishing port sites, namely, Teluk Awang port (West Nusa Tenggara
province), Makassar port (South Sulawesi province), Kupang port (East Nusa Tenggara province), Nunukan port
(East Kalimantan province), Bitung port (North Sulawesi province), Ternate port (North Maluku province), and
Tual port (Maluku province), which the Indonesian government expects to develop.

4
Chapter 2 Current status and issues of marine capture fisheries
2.1 Current status of the fisheries sector
2.1.1 Overview of the sector
Fishery production in Indonesia has been gradually increasing in recent years. It reached 9.05 million tons in
2008, 1.53 times the 5.91 million tons of 2003; it is the third largest in the world following China and Peru. The
industry is divided between 5.20 million tons for capture fisheries (57%) and 3.85 million tons for aquaculture
(43%). Aquaculture contributes greatly to the increase of recent fishery production, becoming 3.14 times in 2008
what it was 2003. Capture fishery seems to have remained at almost the same level, increasing 1.10 times between
2003 and 2008. This is because coastal communities including artisanal fishers have been shifting to seaweed
aquaculture from capture fishery, since local governments recommended seaweed aquaculture. However,
naturally harvested seaweed has been decreasing.
2.1.2 Status and trends of the fishery production
The following table shows that the production of marine capture fisheries has been increasing slightly (7%)
from 4.38 million tons in 2003 to 4.70 million tons in 2008, and that inland open water capture fisheries increased
(62.5%) from 309 thousand tons in 2003 to 494 thousand tons in 2008 On the other hand, marine aquaculture
production was 7.9 times higher, increasing from 249 thousand tons in 2003 to 1,966 thousand tons in 2008, and
brackish water aquaculture production increased 1.9 times and freshwater aquaculture production increased 2.0
times in the same period, respectively. The increase of aquaculture production is very clear compared to capture
fisheries production. Among marine aquaculture production, seaweed culture contributes significantly. The
production of cultured seaweed increased 6.4 times in the same period.
Table 2.1-1Capture fishery production (2003-2008) (Unit:tons)
2003 2004 2005 2006 2007 2008
Capture Fisheries
Marine
(Seaweed)
Inland water
4,691,796
4,383,103
(64,610)
308,693
4,651,121
4,320,241
(8,677)
330,880
4,705,869
4,408,499
(9,670)
297,307
4,806,112
4,512,191
(4,996)
293,921
5,044,737
4,73,280
(4,643)
310,457
5,196,328 (57%)
4,701,933
(2,917)
494,395
Aquaculture
Marine
Brackish water
Fresh water
1,224,192
249,242
501,977
472,973
1,468,610
420,919
559,612
488,079
2,163,674
890,074
643,975
629,625
2,682,597
1,365,918
629,610
687,069
3,193,565
1,509,528
933,833
750,204
3,855,200 (43%)
1,966,002
959,509
929,688
Total 5,915,988 6,119,731 6,869,543 7,488,709 8,238,302 9,051,528
(100%)
(Source: DG of Capture Fisheries & DG of Aquaculture, MMAF, 2009)
5
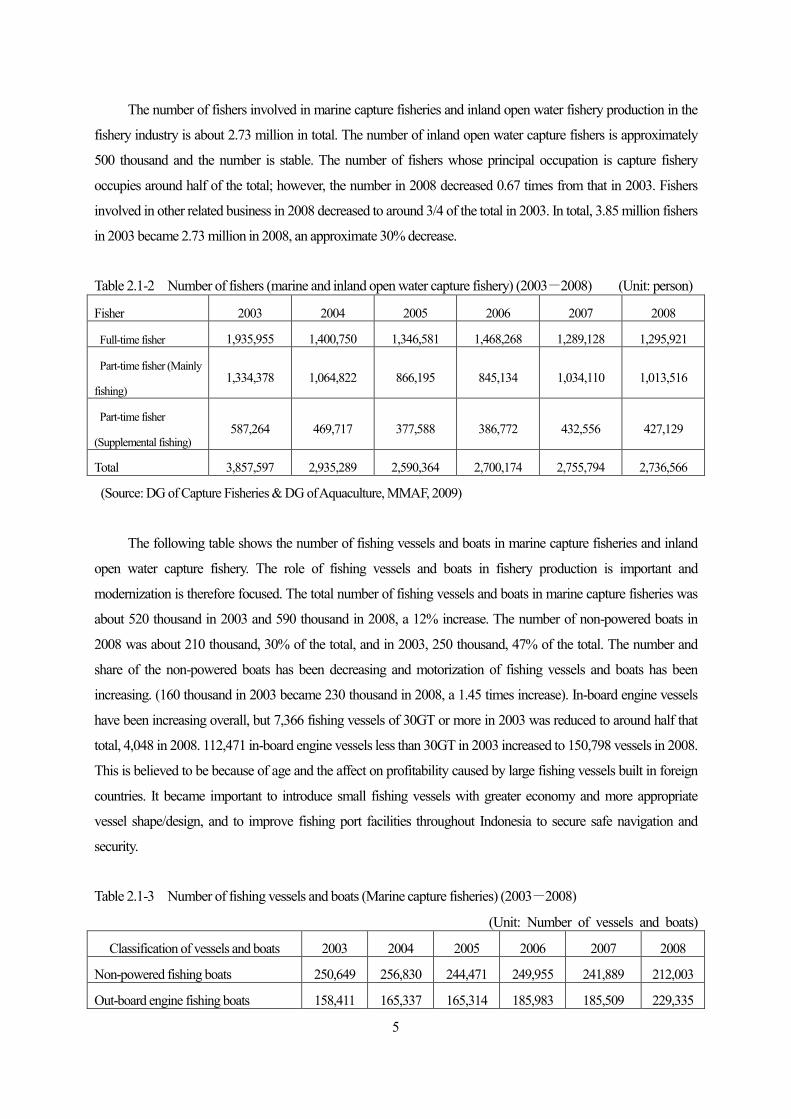
The number of fishers involved in marine capture fisheries and inland open water fishery production in the
fishery industry is about 2.73 million in total. The number of inland open water capture fishers is approximately
500 thousand and the number is stable. The number of fishers whose principal occupation is capture fishery
occupies around half of the total; however, the number in 2008 decreased 0.67 times from that in 2003. Fishers
involved in other related business in 2008 decreased to around 3/4 of the total in 2003. In total, 3.85 million fishers
in 2003 became 2.73 million in 2008, an approximate 30% decrease.
Table 2.1-2 Number of fishers (marine and inland open water capture fishery) (2003-2008) (Unit: person)
Fisher 2003 2004 2005 2006 2007 2008
Full-time fisher 1,935,955 1,400,750 1,346,581 1,468,268 1,289,128 1,295,921
Part-time fisher (Mainly
fishing) 1,334,378 1,064,822 866,195 845,134 1,034,110 1,013,516
Part-time fisher
(Supplemental fishing) 587,264 469,717 377,588 386,772 432,556 427,129
Total 3,857,597 2,935,289 2,590,364 2,700,174 2,755,794 2,736,566
(Source: DG of Capture Fisheries & DG of Aquaculture, MMAF, 2009)
The following table shows the number of fishing vessels and boats in marine capture fisheries and inland
open water capture fishery. The role of fishing vessels and boats in fishery production is important and
modernization is therefore focused. The total number of fishing vessels and boats in marine capture fisheries was
about 520 thousand in 2003 and 590 thousand in 2008, a 12% increase. The number of non-powered boats in
2008 was about 210 thousand, 30% of the total, and in 2003, 250 thousand, 47% of the total. The number and
share of the non-powered boats has been decreasing and motorization of fishing vessels and boats has been
increasing. (160 thousand in 2003 became 230 thousand in 2008, a 1.45 times increase). In-board engine vessels
have been increasing overall, but 7,366 fishing vessels of 30GT or more in 2003 was reduced to around half that
total, 4,048 in 2008. 112,471 in-board engine vessels less than 30GT in 2003 increased to 150,798 vessels in 2008.
This is believed to be because of age and the affect on profitability caused by large fishing vessels built in foreign
countries. It became important to introduce small fishing vessels with greater economy and more appropriate
vessel shape/design, and to improve fishing port facilities throughout Indonesia to secure safe navigation and
security.
Table 2.1-3 Number of fishing vessels and boats (Marine capture fisheries) (2003-2008)
(Unit: Number of vessels and boats)
Classification of vessels and boats 2003 2004 2005 2006 2007 2008
Non-powered fishing boats 250,649 256,830 244,471 249,955 241,889 212,003
Out-board engine fishing boats 158,411 165,337 165,314 185,983 185,509 229,335
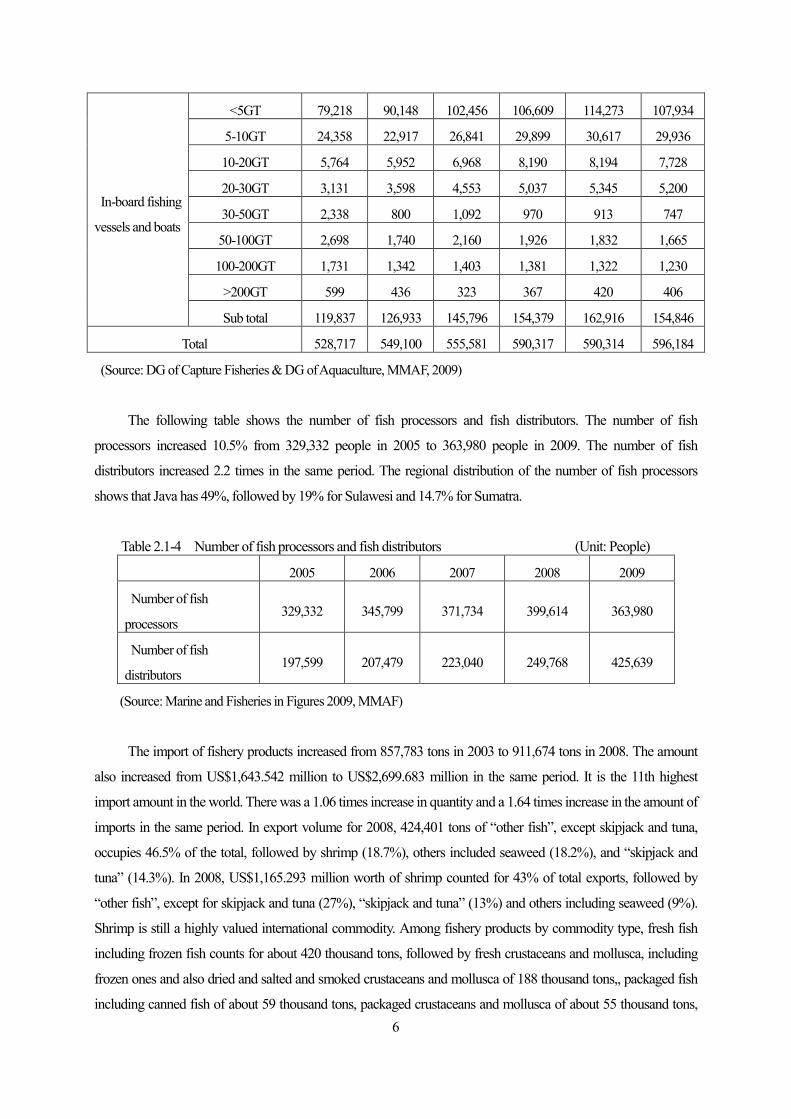
6
In-board fishing
vessels and boats
<5GT 79,218 90,148 102,456 106,609 114,273 107,934
5-10GT 24,358 22,917 26,841 29,899 30,617 29,936
10-20GT 5,764 5,952 6,968 8,190 8,194 7,728
20-30GT 3,131 3,598 4,553 5,037 5,345 5,200
30-50GT 2,338 800 1,092 970 913 747
50-100GT 2,698 1,740 2,160 1,926 1,832 1,665
100-200GT 1,731 1,342 1,403 1,381 1,322 1,230
>200GT 599 436 323 367 420 406
Sub total 119,837 126,933 145,796 154,379 162,916 154,846
Total 528,717 549,100 555,581 590,317 590,314 596,184
(Source: DG of Capture Fisheries & DG of Aquaculture, MMAF, 2009)
The following table shows the number of fish processors and fish distributors. The number of fish
processors increased 10.5% from 329,332 people in 2005 to 363,980 people in 2009. The number of fish
distributors increased 2.2 times in the same period. The regional distribution of the number of fish processors
shows that Java has 49%, followed by 19% for Sulawesi and 14.7% for Sumatra.
Table 2.1-4 Number of fish processors and fish distributors (Unit: People)
2005 2006 2007 2008 2009
Number of fish
processors 329,332 345,799 371,734 399,614 363,980
Number of fish
distributors 197,599 207,479 223,040 249,768 425,639
(Source: Marine and Fisheries in Figures 2009, MMAF)
The import of fishery products increased from 857,783 tons in 2003 to 911,674 tons in 2008. The amount
also increased from US$1,643.542 million to US$2,699.683 million in the same period. It is the 11th highest
import amount in the world. There was a 1.06 times increase in quantity and a 1.64 times increase in the amount of
imports in the same period. In export volume for 2008, 424,401 tons of “other fish”, except skipjack and tuna,
occupies 46.5% of the total, followed by shrimp (18.7%), others included seaweed (18.2%), and “skipjack and
tuna” (14.3%). In 2008, US$1,165.293 million worth of shrimp counted for 43% of total exports, followed by
“other fish”, except for skipjack and tuna (27%), “skipjack and tuna” (13%) and others including seaweed (9%).
Shrimp is still a highly valued international commodity. Among fishery products by commodity type, fresh fish
including frozen fish counts for about 420 thousand tons, followed by fresh crustaceans and mollusca, including
frozen ones and also dried and salted and smoked crustaceans and mollusca of 188 thousand tons,, packaged fish
including canned fish of about 59 thousand tons, packaged crustaceans and mollusca of about 55 thousand tons,

7
and dry and salted fish and smoked fish of about 28 thousand tons. The principal exporting destination is the USA
in both quantity and value totaling 139,128 tons, US$937.22 million, in 2008, followed by Japan with 117,182
tons, US$616.73 million, and the EU with 79,652 tons, US$324.45 million. Items by type regarding principal
destination is as follows: shrimp, USA with about 77 thousand tons, followed by Japan with about 40 thousand
tons; tuna, Japan with about 29 thousand tons, followed by the USA with 21 thousand tons; “other fish”, Japan
with about 38 thousand tons, followed by the USA with about 32 thousand tons. These figures are based on data
from 2008.
The import of fishery products increased from 107,768 tons in 2003 to 280,179 tons in 2008 in quantity and
increased in value from US$90.808 million to US$267.659 million during the same period. This is a 2.6 times
increase in quantity and a 2.9 times increase in value of imports. Chilled and frozen fish was imported the most
with 83,984 tons in 2008. This is 30% of the total. The secondary product is fish meal with 24% and the third is
other meals with 23%. In 2008, as for the import value, the principal is chilled and frozen fish at US$683.79
billion (26%), followed by other meals (23%) and fish meal (17%).
Comparing exports and imports, exports were greater. However, the degree of the increase of imports is
bigger than that of exports.
2.1.3 Fishery policy framework
(1) National mid-term development plan (2010-2014)
Six (6) objectives are laid out in the field of fishery in the current national mid-term development plan.
Community development and empowerment through programs on ecologically and economically sustainable
capture fishery and aquaculture for artisanal fishers and fish farmers in coastal and archipelagic areas:
· Adaptation to and alleviation of climate change in the marine and fisheries sector
· Improvement of quality of fishery products and income of artisanal fishers by marketing and promotion of
small and medium scale enterprises
· Development of infrastructure for marine and fishery resources and improvement of facility maintenance and
management
· Development of marine and capture fishery and monitoring of illegal fishing, and improvement of
surveillance systems
· Promotion of harmonization of accumulated experiences contributing to development of marine and capture
fishery and scientific technologies
(2) Mid-term development plan related to development of marine and fisheries (Strategic Plan 2010-2014)1
The strategic plan (2010-2014) sets out the following 4 policy objectives of the Ministry of Marine Affairs
and Fisheries for the coming 5 years after 2010 based on Government Ordinance No. 25 (National Development
Plan System) and Presidential Decree No. 5 (National Mid-Long-Term Development Plan 2010-2014) and aims
1 Strategic Plan of Ministry of Marine Affairs and Fisheries in 2010-2014

8
to be realized through 6 policy measures. The four policy objectives are as follows:
Pro Poor :Measures against poverty for persons related to the marine and fisheries sectors in the
socio-economic field
Pro Job :Measures against unemployment utilizing unused aquaculture potential, enlargement of opportunity
for industrialization through support for capital investment and guarantees
Pro Growth : Realization of development and growth in marine and fisheries sector, a pillar of the national
economy, by shifting to contemporary entrepreneurs from small business units through support for
the improvement of various infrastructure, industrialization and modernization
Pro Sustainability:Undertaking alleviation of and adaptation to global environmental issues as well as recovery
and conservation of the environment in marine, coastal and archipelagic areas
Six (6) policy measures under the 4 policy objectives are as follows:
① Minapolitan Development
② Entrepreneurship(Spirit of entrepreneur)
③ Networking
④ Technology and innovation
⑤ Support(measures against poverty)
⑥ Strengthening systems for community grouping
The following table shows the indicators for the objectives of this plan. The catch volume targets a 0.55%
annual increase, and aims to realize 5.5 million tons in 2014. The goal in 2014 is a 5.8% increase compared to 5.2
million tons in 2008. Aquaculture production targets a 33.19% increase annually and the goal in 2014 aims to
realize 16.89 million tons.
Table2.1-5 Main indicators for measuring attainment of objectives in Mid-term Development Plan (2010-2014)
of MMAF
Details
Goals Average
increase
(%/yr) 2010 2011 2012 2013 2014
ECONOMIC FUNCTION
Fisheries GDP Contribution to National GDP
(Without oil and gas) (%) 3.0 3.5 4.5 5.5 6.5 0.21
Fishery production (million tons) 10.76 12.26 14.86 18.49 22.39 20.16
· Capture Fisheries 5.38 5.41 5.44 5.47 5.50 0.55
· Aquaculture 5.38 6.85 9.42 13.02 16.89 33.19
The Export Value of Fishery Products (USD
Billion) 2.9 3.2 3.6 4.1 5.0 14.63
Fish Consumption (kg/capita/yr) 30.47 31.64 32.39 33.17 38.67 6.29

9
The Number of Fish Processing Units (Units)* 444 449 454 459 464 1.12
Fishermen/Fish Farmers Terms of Trade (FFT) 105 107 110 112 115 2.30
ENVIRONMENTAL FUNCTIONS
Area of Marine Conservation Region and Waters
(million ha)** 0.9 0.9 0.9 0.9 0.9 -
The Number of Small Islands Including the
Outermost Small Islands that Are Managed
(Island)***
20 55 60 50 20 -
Percentage of Water Areas that Are Free of IUU
Fishing (%) 62 75 82 91 100 12.79
*) The number of fish processing units (UPI), which will become the target for the relevant year **) Target area of marine conservation regions and waters for the relevant year ***) The Number of Small Islands Including the Outermost Small Islands which will become the target of management for the relevant year
The “Minapolitan” development plan in the above 6 policy measures aims for:
i) Improvement of productivity of capture fishery and fishery business and quality of fishery products
ii) Fair and impartial improvement of income of fishers, fish farmers and fish processors
iii) To develop areas appointed by Minapolitan to be a core of economic development in the surrounding areas and
to be a driving force for improvement of the economic environment of the residents
It is also stated to realize “Minapolitan” as a core for regional development giving priority to fishery
business in the potential areas for fishery development. The approach to realize “Minapolitan” is to establish a
system by improving the efficiency of resource utilization and to integrate production facilities and processes,
processing and distribution, and environmental management. The following are the concrete measures for the field
of fishery infrastructure.
i) Improvement of fishery infrastructures shall proceed, giving highest priority to 25 outer-ring fishing ports.
ii) 5,100-unit increase in fishing vessels and fishing equipment.
iii) Development of 541 areas for aquaculture (238 areas for freshwater aquaculture, 158 areas for mariculture, and
145 areas for brackish water aquaculture)
iv) Supply 69.7 billion seeds to meet demand
v) Implementation of improvement of infrastructure related to fish processing and distribution, namely
improvement of cold chain system, fish processing centers, and fishery clusters in the Minapolitan areas in the 33
provinces
vi) Promotion of exports by supporting small/medium enterprises, investment promotion, support for formulating
medium/small business units in communities, and development of financial institutions for fishers etc.
vii) Development of infrastructure in 100 small island and archipelagic areas, and strengthening the capabilities of

10
business organizations and companies working in fish processing and distribution
The Minapolitan Development Plan aims to improve 86 prioritized fishery core cities for regional
development throughout Indonesia. The improvement of outer-ring fishing ports will link with and meet the
Minapolitan Development Plan.
(3) Fishery law
A new fishery law which has the following 8 objectives was enacted in 2004.
· Obtaining foreign currency and enlargement of contribution to national finance through export of fishery
products
· Promotion of employment
· Increase of supply and consumption of fishery products as food stuffs
· Appropriateness of fishery resources management
· Improvement of productivity, quality and added value of fishery products and strengthening competitiveness
· Promotion of fish processing industry
· Optimization of fishery resources, areas for aquaculture, and environment for fishery resources
· Protection and management of zones for fishery resources, which are suitable for aquaculture
(4) Ministry Decree of MAFF related to capture fishery (No: PER.17/MEN/2006)
In 2006, (Marine Affairs and Fisheries Ministerial Decree, No: PER.17/MEN/2006, Concerning Capture
Fisheries) was enacted. The main points are as follows:
· Abolition of past licensing system and agency for foreign vessels
· Fishing licenses are only issued to Indonesian citizens and enterprises established under Indonesian law .
· Foreign investors and foreign enterprises investing in capture fishery are obliged to simultaneously establish a
fish processing company in Indonesia.
· Undertaking promotion of capture fishery business through revision of investment system for capture fishery
(5) Vision of Directorate General of Capture Fishery of MMAF
In order to optimally utilize marine and fishery resources, the Directorate General of Capture Fishery
(DGCF) of MMAF has a vision for “Stable, independent and sustainable capture fishery in Indonesia in 2020”.
The following are the objectives of the vision:
· Management of sustainable utilization of fishery resources
· Increase of fishers’ income and improvement of fishers’ social welfare
· Provision of fishing port facilities to improve both quantity and quality
· Empowerment of Indonesian fishing vessels and boats
· Promotion of effective and competitive fishing business

11
(6) Regional fishery organizations
The regional fishery organizations (RFOs) that Indonesia has joined are as shown in the next table.
Table2.1-6 Regional fishery organizations (RFOs), in which Indonesia participates
Name of organizations Main activities
SEAFDEC (South East Asia
Fisheries Development
Center)
SEAFDEC is an international organization established to contribute to the
promotion of fishery development in Southeast Asia; there are 11 member
nations in total (10 ASEAN countries and Japan). It deals with problems in the
international fishery field in Southeast Asia such as food security, fishing proof
system, small-scale fisheries, climatic change, subsidies, the execution of
UNCLOS (United Nations Convention on the Law of the Sea) and the global
economic transition, etc.
ATSEF (Arafura and Timor
Seas Experts Forum)
ATSEF is an experts’ forum in which the scientific research is promoted by
regional cooperation in the coastal nations of the Arafura Sea and the Timor sea.
It aims for the sustainable development of marine resources in this area. The
member countries are Australia, PNG, East Timor, and Indonesia.
NACA ( Network on
Aquaculture Center in Asia
and Pacific)
NACA is a network organization concerned with aquaculture in Asia and the
Pacific region, undertaking activities such as the interchange of personnel
between member countries, training on food safety, fair/profitable trade in
relation to the spread of selective breeding, problems related to hormones,
antibiotics and heavy metals, etc. The DG of Aquaculture of MMAF represents
Indonesia.
IOTC (Indian Ocean Tuna
Commission)
IOTC is a regional fishery organization working to secure tunas resource
conservation in the Indian Ocean and the optimal use of said resources;, there 27
member nations and 1 organization (EU) member. Indonesia joined in June
2007. In the 13th meeting held in Bali in 2009, it was agree that the EU could
postpone the prohibition of excessive catches of bigeye, yellowfin and Spanish
mackerel.
CCSBT (Commission for
the Conservation of Southern
Bluefin Tuna)
CCSBT is a regional fishery organization that aims to secure the conservation
and the optimal use of southern bluefin tuna resources; there are five member
countries: Japan, Australia, New Zealand, South Korea, and Indonesia. Indonesia
joined in April 2008.
(Source: Indonesian Fisheries Book 2010, and web sites, etc.)

12
2.1.4 Investment from the private sector
From 2004 to 2008, the fisheries sector was provided with IDR8.2 billion from Domestic Investment
(PMDN: Penanaman Modal Dalam Negeri) for 6 projects and US$71 million (IDR636 billion) from Foreign
Direct Investment (PMA: Penanaman Modal Asing)for 22 projects. The largest investment recorded for PMDN
was in 2005 and PMA in 2006. The total amount of investment for the fisheries sector is minimal (less than 1%)
compared to the total investment amount in all sectors of Indonesia.
Table 2.1-7 Situation of private investment in fisheries sector 2004-2008
Type
2004 2005 2006 2007 2008
Nu
mbe
r
Amount Nu
mbe
r
Amount Nu
mbe
r
Amount Nu
mbe
r
Amount Numb
er
Amount
Fisheries sector
Local capital (billion IDR) - - 4 4.9 1 0.2 1 3.1 0 0.0 Foreign capital (million USD) 2 5.3 7 5.8 5 32.8 5 24.7 3 2.4
All sectors Local capital (billion IDR) 130 15,409.4 214 30,665.0 164 20,788.4 159 34,878.7 106.0 8,496.6 Foreign capital (million USD) 546 4,602.3 909 8,914.6 867 5,977.0 603 7,305.2 544 10,380.6 Ratio of investment amount for fisheries sector
Local capital (%)
0.00 0.00 1.87 0.02 0.61 0.00 0.63 0.01 0.00 0.00
Foreign capital (%)
0.37 0.12 0.77 0.07 0.58 0.00 0.66 0.33 0.37 0.02
Source: Investment Coordinating Board (BKPM), 2008 Number: Number of Fixed business licenses issued Investment amount: The realization of investment (PMDN in billion Rupiah, PMA in million US$)
Large-scale fish processing industries have been developed in Makassar, Bitung, Ambon, and Tual in
Eastern Indonesia as private business activities in the fisheries sector. Frozen fish and canned products are
produced in Makassar and Tual, canned products in Katsuobushi and frozen fish in Bitung. Small-scale or
home-industry fish processing are major business entities in addition to the above areas. A number of fish
processors export to Taiwan and Australia and some export live fish.

13
2.2 Current status of marine capture fisheries
2.2.1 Status and trends of marine capture fishery production
(1) Production
Of the total of 9.05 million tons of annual fishery production in Indonesia in 2008, about 4.70 million tons
(52%) were produced by marine capture fisheries. However, the share of marine capture fishery production in total
fishery production has decreased from 75% in 1990. Meanwhile, mariculture and freshwater aquaculture has
increased drastically. The share of marine capture fisheries in the total production amount was about 60% in 2007.
330 thousand tons of scad was caught, out of a production total of 4.22 million tons in 2008, as a mono
species. About 300 thousand tons of scad was caught in 2003; this species recorded its highest production total in
the 6 years from 2003 to 2008, followed by about 300 thousand tons of skipjack, 250 thousand tons of Kunbun (a
group similar to horse mackerel), and 200 thousand tons of anchovy. About 100 thousand tons of Yellow-fin tuna,
a major exporting product, was caught in 2008, 50 thousand tons less than in 2003. Production of shrimp is
relatively stable at around 250 thousand tons. Large surface fish increased 1.4 times in 2008 compared to 2003.
Table 2.2-1 Marine capture fishery production by major species (2003-2008) (Unit: tons)
Major species 2003 2004 2005 2006 2007 2008
Tunas 151,926 176,996 183,144 159,404 191,558 194,173
Skipjack-tunas 208,626 233,319 252,232 277,388 301,531 296,769
Eastern little tuna 267,339 310,400 309,794 329,169 399,513 421,905
Other fish 3,157,465 3,112,018 3,246,770 3,293,729 3,340,120 3,308,788
Shrimp 240,438 245,913 208,539 227,164 258,976 236,922
Seaweed 64,610 8,677 9,670 4,996 4,643 2,917
Others 292,699 232,918 198,350 220,341 237,939 240,459
Total 4,383,103 4,320,241 4,408,499 4,512,191 4,734,280 4,701,933
(Source: DG of Capture Fisheries & DG of Aquaculture, MMAF, 2009)
Catch volume by type of fishing gear shows that purse-seine, with about 800 thousand tons of production, is
the highest, followed by about 530 thousand tons with drift gill net, and 420 thousand tons with fish net.
Production using these types of fishing gear has remained steady for the past 10 years. However, shrimp trawl has
been decreasing drastically. The catch volume in major fishing ports in 2007 totaled 46,492 tons in Ambon, 13,123
tons in Bitung, 21,865 tons in Kendari and 145,666 tons in Tual.
The production volume of fresh fish remains the highest, about 3.03 million tons, followed by 460 thousand
tons of frozen fish, 450 thousand tons of salted and dried fish, 140 thousand tons of boiled fish, and 65 thousand
tons of smoked fish. These numbers have tended to increase almost annually since 1999 when fishery production
started to be recorded in official statistics.
(2) Trend of fishers and private fishing enterprises

14
As of 2008, the number of marine capture fishers is about 2.24 million in the whole of Indonesia. 49.6% of
this total is full-time fishers. The number of marine capture fishers shows a 32% decrease from 2003 to 2008. In
the 6 years from 2003 to 2008, the number of full-time fishers has been decreasing. The number of part-time
fishers who engage principally in fishing decreased until 2006 but has increases after 2007. The number of
part-time fishers who engage in supplemental fishing decreased until 2005, but has increased after 2006.
Table 2.2-2 Number of marine capture fishers (2003-2008)
Marine capture fishers 2003 2004 2005 2006 2007 2008
Full-time fishers 1,729,671 1,182,604 1,145,653 1,293,530 1,095,399 1,111,069
Part-time fishers
(Part-time fishers
(Mainly fishing))
1,112,217 826,206 648,591 626,065 805,011 800,096
(Part-time fisher
(Supplemental fishing)) 469,933 337,972 263,742 283,817 331,557 328,902
Total 3,311,821 2,346,782 2,057,986 2,203,412 2,231,967 2,240,067
Several business units are considered as private marine capture fisheries enterprises. Statistical data
describes only fish processors and KUB2.
The number of fish processors is as follows:
2 An abbreviation for Kelompok Usaha Bersama, self-run organizations for fishers that are targeted as support groups of the MMAF. It is also defined as a unit for small-scale business.
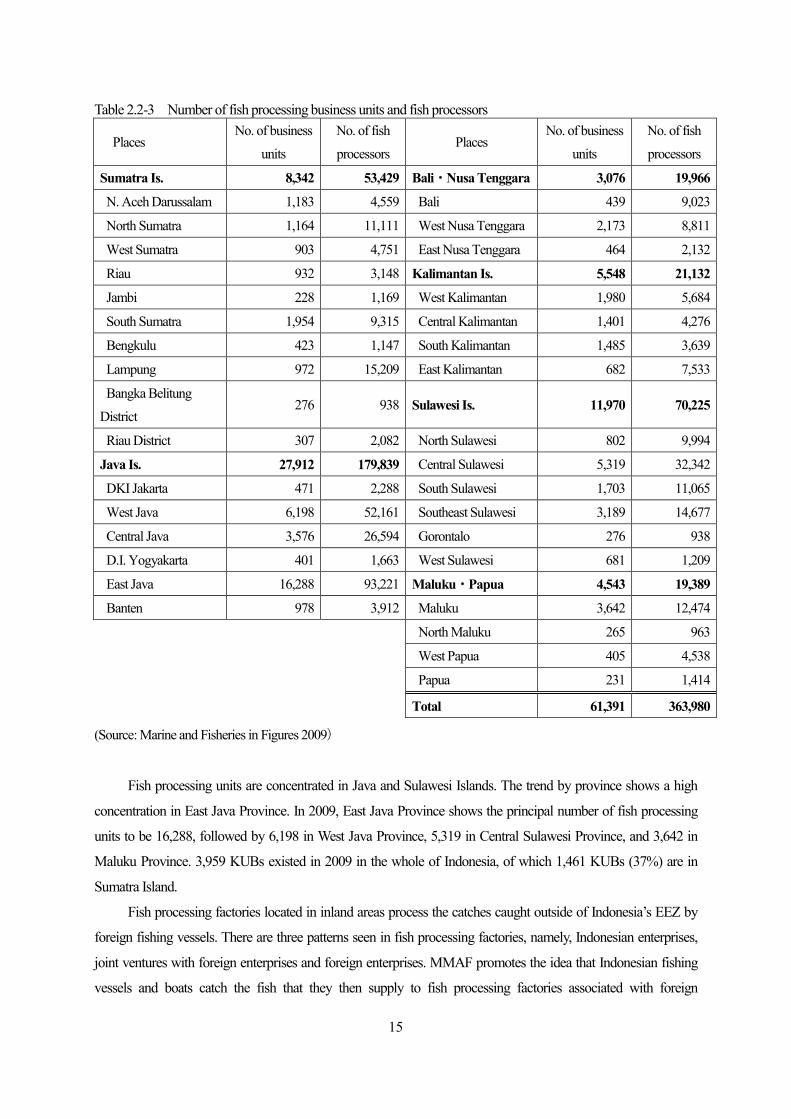
15
Table 2.2-3 Number of fish processing business units and fish processors
Places No. of business
units
No. of fish
processors Places
No. of business
units
No. of fish
processors
Sumatra Is. 8,342 53,429 Bali・Nusa Tenggara 3,076 19,966
N. Aceh Darussalam 1,183 4,559 Bali 439 9,023
North Sumatra 1,164 11,111 West Nusa Tenggara 2,173 8,811
West Sumatra 903 4,751 East Nusa Tenggara 464 2,132
Riau 932 3,148 Kalimantan Is. 5,548 21,132
Jambi 228 1,169 West Kalimantan 1,980 5,684
South Sumatra 1,954 9,315 Central Kalimantan 1,401 4,276
Bengkulu 423 1,147 South Kalimantan 1,485 3,639
Lampung 972 15,209 East Kalimantan 682 7,533
Bangka Belitung
District 276 938 Sulawesi Is. 11,970 70,225
Riau District 307 2,082 North Sulawesi 802 9,994
Java Is. 27,912 179,839 Central Sulawesi 5,319 32,342
DKI Jakarta 471 2,288 South Sulawesi 1,703 11,065
West Java 6,198 52,161 Southeast Sulawesi 3,189 14,677
Central Java 3,576 26,594 Gorontalo 276 938
D.I. Yogyakarta 401 1,663 West Sulawesi 681 1,209
East Java 16,288 93,221 Maluku・Papua 4,543 19,389
Banten 978 3,912 Maluku 3,642 12,474
North Maluku 265 963
West Papua 405 4,538
Papua 231 1,414
Total 61,391 363,980
(Source: Marine and Fisheries in Figures 2009)
Fish processing units are concentrated in Java and Sulawesi Islands. The trend by province shows a high
concentration in East Java Province. In 2009, East Java Province shows the principal number of fish processing
units to be 16,288, followed by 6,198 in West Java Province, 5,319 in Central Sulawesi Province, and 3,642 in
Maluku Province. 3,959 KUBs existed in 2009 in the whole of Indonesia, of which 1,461 KUBs (37%) are in
Sumatra Island.
Fish processing factories located in inland areas process the catches caught outside of Indonesia’s EEZ by
foreign fishing vessels. There are three patterns seen in fish processing factories, namely, Indonesian enterprises,
joint ventures with foreign enterprises and foreign enterprises. MMAF promotes the idea that Indonesian fishing
vessels and boats catch the fish that they then supply to fish processing factories associated with foreign

16
enterprises.
(3) Fish processing
The classification of processed fish products described in the statistics for Indonesia consists of salted and
dried fish, boiled fish, fermented fish (berachan, peda, fish sauce), smoked fish, frozen fish, canned fish, and fish
meal. In 2008, frozen fish was produced the most, about 460 thousand tons, followed by salted and dried fish,
about 450 thousand tons. These 2 items cover around 75% of the total production of processed fish products.
(4) Support system
MMAF issues a certificate of authorization for fish processors. The following table shows the number of
yearly certificate issuances. MMAF states that all exporting enterprises acquire HACCP and/or GMP (Good
Manufacturing Practice). MMAF covers the expenditures for this certification, such as inspection expenses,
instruction fees, and the handling charge for issuing the certificate, etc. Enterprises don’t need to pay for these
expenses. The annual budget for this is about IDR2.5 billion. Three levels have been introduced for HACCP
acquisition: C, B and A. The applicants must be certified as level A within 3 years. MMAF checks the levels
annually.
MMAF offers micro finance called KKMB (Konsultan Keuangan Mitra Bank: Financing Service of Mitra
Bank). The number of financing arrangements in 2009 was 917 loans totaling IDR3.845 billion. In addition to the
KKMB, the Directorate General of Marine, Coastal & Small Islands (DGMCSI) of MMAF implements other
microfinance projects such as KUR (Kredit Usaha Rayat) and KKPE(Kredit Ketahanan Pangan dan Energ: The
yearly interest is 6%, lower than KUR.)for KUB. KUR and KKPE target not only KUB but also KUD (Koperasi
Unit Desa) managed by the Ministry of Cooperatives and Small & Medium Enterprises.
2.2.2 Distribution and consumption of marine fishery production
Quantitative data on fish distribution in the domestic market of Indonesia does not exist. According to the
Directorate of Domestic Marketing (DDM) of the Directorate General of Fisheries Product Processing and
Marketing (DGFPPM) of MMAF, the data for 400 thousand consumers sampled in a survey in each province,
which is conducted annually by the National Bureau of Statistics, shows the trends for fish consumption by
species and province. The DDM, in 2008, explained that 85% of fishery products were consumed in Indonesia
Table 2.2-4 Number of certificate issued for fish processors
2005 2006 2007 2008 2009
48,624 43,732 44,572 48,202 39,432
(Source: Marine and Fisheries in Figures 2009)
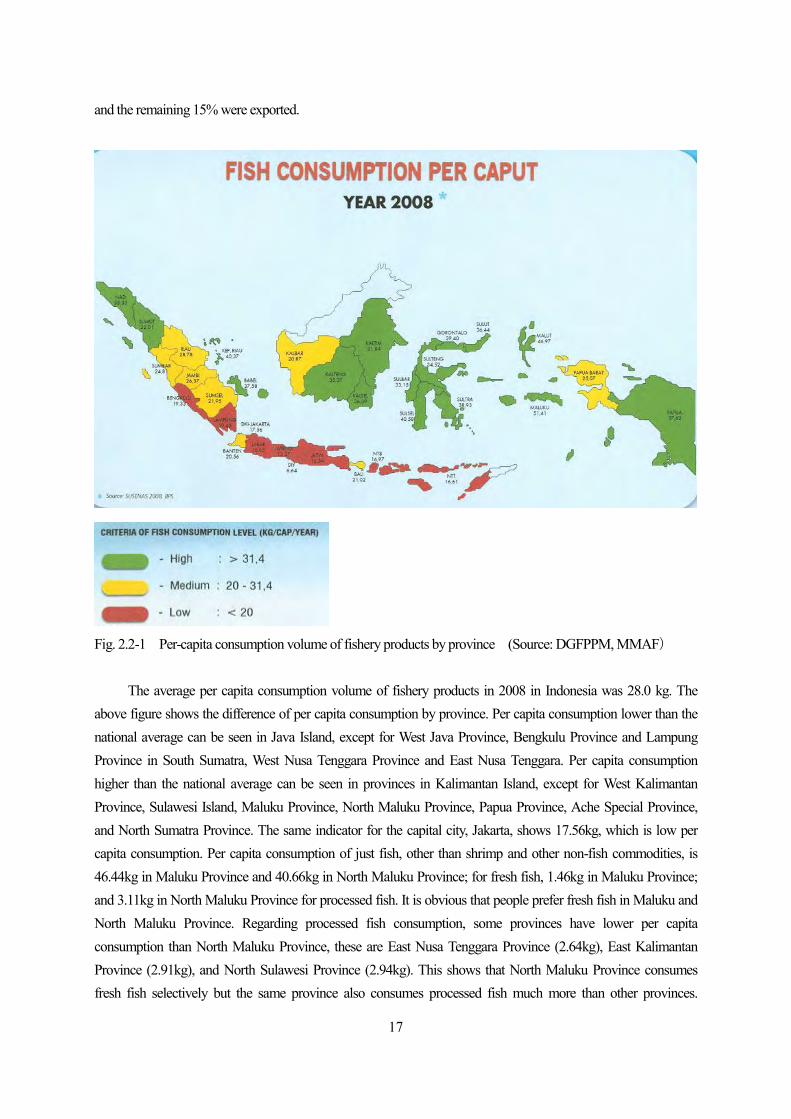
17
and the remaining 15% were exported.
Fig. 2.2-1 Per-capita consumption volume of fishery products by province (Source: DGFPPM, MMAF)
The average per capita consumption volume of fishery products in 2008 in Indonesia was 28.0 kg. The above figure shows the difference of per capita consumption by province. Per capita consumption lower than the national average can be seen in Java Island, except for West Java Province, Bengkulu Province and Lampung Province in South Sumatra, West Nusa Tenggara Province and East Nusa Tenggara. Per capita consumption higher than the national average can be seen in provinces in Kalimantan Island, except for West Kalimantan Province, Sulawesi Island, Maluku Province, North Maluku Province, Papua Province, Ache Special Province, and North Sumatra Province. The same indicator for the capital city, Jakarta, shows 17.56kg, which is low per capita consumption. Per capita consumption of just fish, other than shrimp and other non-fish commodities, is 46.44kg in Maluku Province and 40.66kg in North Maluku Province; for fresh fish, 1.46kg in Maluku Province; and 3.11kg in North Maluku Province for processed fish. It is obvious that people prefer fresh fish in Maluku and North Maluku Province. Regarding processed fish consumption, some provinces have lower per capita consumption than North Maluku Province, these are East Nusa Tenggara Province (2.64kg), East Kalimantan Province (2.91kg), and North Sulawesi Province (2.94kg). This shows that North Maluku Province consumes fresh fish selectively but the same province also consumes processed fish much more than other provinces.

18
Processed fish are consumed in large quantities in South Sulawesi Province (4.89kg) and West Nusa Tenggara Province (4.81kg).
2.2.3 Status of fisheries resources
MMAF monitors catches in each FMA of the 11 FMAs, since many factors such as a change in the natural
conditions, etc., affect the trends in fishery resources in marine capture fishery production. Yearly, 6.4 million tons
as MSY is biologically calculated and 5.12 million tons, 80% of MSY, is set as TAC in all Indonesian waters. The
number of FMA was 9 initially but changed to 10 in 2006. It was again reviewed and became 11 in 2009. Table
2.2-7 outlines the change of MSY from 9 FMAs and 11 FMAs after the review in 2009.
With regards to MSY, overexploitation exceeding MSY can be observed in WPP-RI571 (Malacca
Strait/Andaman Sea) and WPP-RI714 (Toro Bay/Banda Sea), and the catch is excessive for the recovery of
fishery resources. Excessive fishing over TAC can be seen in WPP-RI572+573 (West Sumatera, Indian Ocean +
South Java/South Nusa Tenggara/West Timor, Indian Ocean) and WPP-RI712 (Java Sea) in addition to the above
2 fishing management areas.
Fig. 2.2-2 Fishing Management Areas in Indonesia
(Source: Ministerial Decree of MMAF No. Per. 01/MEN2009 about Fishing Management Area of 2010)

19
Table 2.2-5 Volume of marine capture fishery production by fishing management area 2003-2008
(Source: DGCF, MMAF)
Table 2.2-6 describes outline of transition of MSY in 9 FMAs and 11 FMAs after a review in 2009. In the
table, KEPMENTAN means KEPUTUSAN MENTERI PERTANIAN (Minister Decree of MMAF), PRPT:
FKPPS (Forum) means KOMNASJISKAN (Office of National Committee for Fish Stock Assessment).
Table2.2-6 Trend of MSY in marine capture fisheries Unit: 1,000 tons
9&11 FMA (Code No.)
MSY (TAC=80%MSY)
1991
MSY
2001
MSY
1999KEPMENTAN
MSY
2006KEPMENTAN
MSY
PRPT: FKPPS2008
MSY
1-9 Total
(Catch comparison with 2008)
6,276.4
>4,701.9.
6,409.3
>4,701.9
6,258.3
>4,701.9
8,136.9
>4,701.9
4,016.0
<4,701.9
1 (WPP571) Malacca Strait &
Andaman Sea 239.2 276.0 239.2 300.9 597.5
2 (WPP711) Kalimata Strait,
Natua Sea & S. China 1,252.3 1,057.1 1,252.4 1,605.1 280.7
3 (WPP712) Java Sea 852.0 796.6 852.0 1,115.8 915.4
4 (WPP713) Makassar Sea,
Bone, Flores & Bali 679.4 929.7 678.6 658.6 494.7
5 (WPP714) Tolo Bay &
Banda Sea 248.4 278.0 248.4 245.4 311.9
6 (WPP715) Tomini, Maluku,
Halmahera, etc. 605.7 590.6 587.0 578.2 324.9
7 (WPP716&717) 690.4 632.8 691.4 1,047.5 154.0
7-1 (WPP716) Pacific &
Cendrawashi Bay - - - 636.8 83.2

20
7-2 (WPP717) - - - 410.8 70.8
8 (WPP718) 792.2 771.6 792.1 1,423.2 385.7
9 (WPP572&573)
Indian Ocean 916.7 1,076.9 917.5 1,162.2 551.2
9-1 (WPP572) Indian Ocean of
W. Sumatra & Sunda - - - 581.1 308.5
9-2 (WPP573) Indian Ocean of
S. Java, S.NT, Sawu & W.
Timor
- - - 581.1 242.7
(Source: DG of Capture Fisheries, MMAF, 2009, others)
2.2.4 Fishery resource management measures
Since 2000, in Indonesia, a new system for fishery resources management has been introduced and progress
has made in decentralization of power. The authority to manage fishery resources and capture fishery is shared
among 3 different levels: central government, province, and district/city. The district/city manages the area within
4 nautical miles of the coastal, the province manages marine areas from 4 nautical miles up to 12 nautical miles.
Central government is responsible for the management of fishing operations in EEZ over 12 nautical miles and
international waters. Due to progress being made in decentralization, some activities for the sustainable utilization
of fishery resources in the coastal zone among coastal small-scale fishers have been ongoing in some locations.
This fact means that the participatory and collaborative system for fishery resources management has become
common in some areas. In the suburbs of Likupang City in North Sulawesi Province, local fishers and fisheries
administration in the area cooperate with each other and ban fishing in some coral reef areas, the spawning ground
of bottom fish as well as the nursery ground of juveniles and fingerlings. The Directorate General of Marine &
Fisheries Resources Surveillance and Controlling (DGMFRSC) of MMAF states that fishing activity in the
outer-ring areas of Indonesia is minimal except the areas within 4 nautical miles of the coast and the areas from 4
nautical miles up to 12 nautical miles. The reasons are a shortage of modern fishing technology, lack of
improvement of infrastructure such as fishing ports, and a delay in the modernization of fishing
vessels/gears/methods and security countermeasures, etc. This allows for the continued illegal fishing by foreign
vessels.
One of the fishery management measures demands that foreign fishing vessels and Indonesian fishing
vessels exceeding 100GT are obliged to be equipped with a Vessel Monitoring System (VMS). Fishing vessels
over 60GT up to 100GT are to be provided with a transmitter, and fishing vessels smaller than 60GT are to be
provided with off-line type transmitter for VMS by MMAF. According to MMAF, 3,500 fishing vessels were
equipped with VMSs from 2003 to 2010; this number is about 80% of the total number of fishing vessels over
100GT. As for fishing licenses, central government deals with fishing vessels over 30GT, provinces with 10-30GT
fishing vessels, and districts/cites with fishing vessels/boats smaller than 10GT, respectively. Other necessary
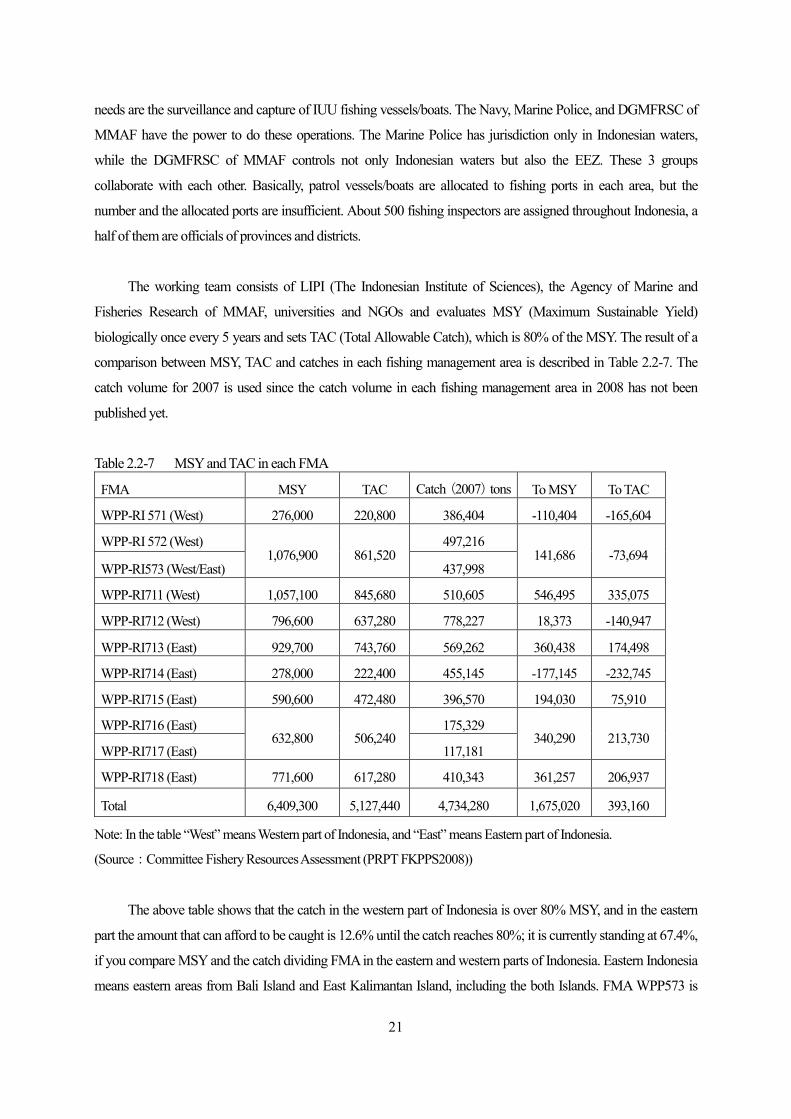
21
needs are the surveillance and capture of IUU fishing vessels/boats. The Navy, Marine Police, and DGMFRSC of
MMAF have the power to do these operations. The Marine Police has jurisdiction only in Indonesian waters,
while the DGMFRSC of MMAF controls not only Indonesian waters but also the EEZ. These 3 groups
collaborate with each other. Basically, patrol vessels/boats are allocated to fishing ports in each area, but the
number and the allocated ports are insufficient. About 500 fishing inspectors are assigned throughout Indonesia, a
half of them are officials of provinces and districts.
The working team consists of LIPI (The Indonesian Institute of Sciences), the Agency of Marine and
Fisheries Research of MMAF, universities and NGOs and evaluates MSY (Maximum Sustainable Yield)
biologically once every 5 years and sets TAC (Total Allowable Catch), which is 80% of the MSY. The result of a
comparison between MSY, TAC and catches in each fishing management area is described in Table 2.2-7. The
catch volume for 2007 is used since the catch volume in each fishing management area in 2008 has not been
published yet.
Table 2.2-7 MSY and TAC in each FMA
FMA MSY TAC Catch(2007)tons To MSY To TAC
WPP-RI 571 (West) 276,000 220,800 386,404 -110,404 -165,604
WPP-RI 572 (West) 1,076,900 861,520
497,216 141,686 -73,694
WPP-RI573 (West/East) 437,998
WPP-RI711 (West) 1,057,100 845,680 510,605 546,495 335,075
WPP-RI712 (West) 796,600 637,280 778,227 18,373 -140,947
WPP-RI713 (East) 929,700 743,760 569,262 360,438 174,498
WPP-RI714 (East) 278,000 222,400 455,145 -177,145 -232,745
WPP-RI715 (East) 590,600 472,480 396,570 194,030 75,910
WPP-RI716 (East) 632,800 506,240
175,329 340,290 213,730
WPP-RI717 (East) 117,181
WPP-RI718 (East) 771,600 617,280 410,343 361,257 206,937
Total 6,409,300 5,127,440 4,734,280 1,675,020 393,160
Note: In the table “West” means Western part of Indonesia, and “East” means Eastern part of Indonesia.
(Source:Committee Fishery Resources Assessment (PRPT FKPPS2008))
The above table shows that the catch in the western part of Indonesia is over 80% MSY, and in the eastern
part the amount that can afford to be caught is 12.6% until the catch reaches 80%; it is currently standing at 67.4%,
if you compare MSY and the catch dividing FMA in the eastern and western parts of Indonesia. Eastern Indonesia
means eastern areas from Bali Island and East Kalimantan Island, including the both Islands. FMA WPP573 is
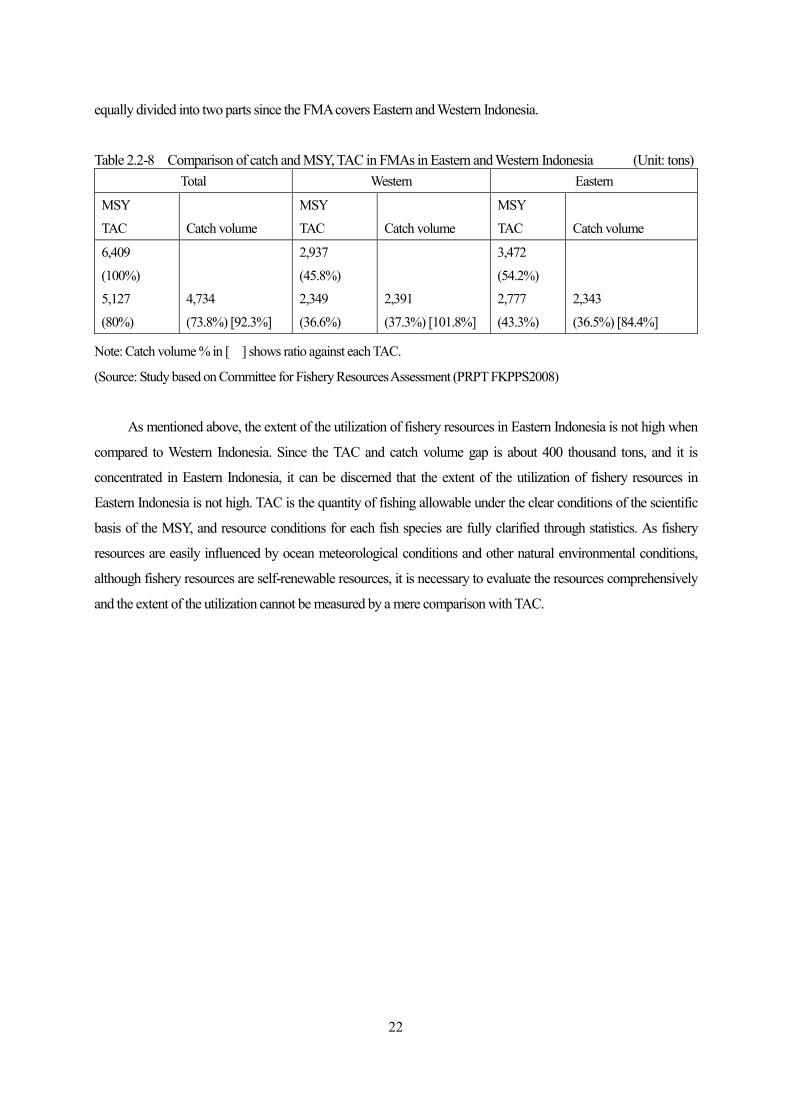
22
equally divided into two parts since the FMA covers Eastern and Western Indonesia.
Table 2.2-8 Comparison of catch and MSY, TAC in FMAs in Eastern and Western Indonesia (Unit: tons) Total Western Eastern
MSY
TAC
Catch volume
MSY
TAC
Catch volume
MSY
TAC
Catch volume
6,409
(100%)
5,127
(80%)
4,734
(73.8%) [92.3%]
2,937
(45.8%)
2,349
(36.6%)
2,391
(37.3%) [101.8%]
3,472
(54.2%)
2,777
(43.3%)
2,343
(36.5%) [84.4%]
Note: Catch volume % in [ ] shows ratio against each TAC.
(Source: Study based on Committee for Fishery Resources Assessment (PRPT FKPPS2008)
As mentioned above, the extent of the utilization of fishery resources in Eastern Indonesia is not high when
compared to Western Indonesia. Since the TAC and catch volume gap is about 400 thousand tons, and it is
concentrated in Eastern Indonesia, it can be discerned that the extent of the utilization of fishery resources in
Eastern Indonesia is not high. TAC is the quantity of fishing allowable under the clear conditions of the scientific
basis of the MSY, and resource conditions for each fish species are fully clarified through statistics. As fishery
resources are easily influenced by ocean meteorological conditions and other natural environmental conditions,
although fishery resources are self-renewable resources, it is necessary to evaluate the resources comprehensively
and the extent of the utilization cannot be measured by a mere comparison with TAC.

23
2.3 Issues on marine capture fisheries and countermeasures taken
(1) Production
Fishers tend to concentrate their fishing activities within 12 nautical miles of their base. This is due to the
lack of advanced fishing technology, etc. Illegal, Unreported, Unregulated (IUU) fishing activities by foreign
fishing vessels, etc, has been rampant outside of the 12-nautical-mile areas. Therefore, it is an urgent issue to
strengthen the MCS (monitoring, control and surveillance) system and utilize fishery resources effectively. As a
countermeasure to IUU fishing, MMAF is implementing strengthened surveillance of IUU fishing vessels using
VMS. MMAF has set up a monitoring room in the Ministry for supervising fishing vessels and has been
improving the development of IUU countermeasures by examining information sent to the monitoring room in
real time and cooperating with relevant bases where patrol vessels/boats are stationed.
“A plan for building 1,000 fishing vessels” is also examined for sustainable utilization of unused fishery
resources. A sum of IDR150 million is planned to be allocated for 5 years from 2010. This plan is considered to be
of great importance, together with fishing port improvement. The concept of increasing the number of fishing
vessels aims for the undertaking of effective utilization of fishery resources in the areas where fishers have not
fully developed fishing and the areas outside of the 12-nautical-mile line in order to utilize unused fishery
resources. The modernization of fishing vessels/boats improves navigation and the safety of fishers while at sea
especially those changing their areas of operation.
(2) Fish distribution and consumption
The Minapolitan Development Plan in the National Mid-term Development Plan (2010-2014) mentions
some countermeasures in this field, which are ongoing. These include i) the improvement of infrastructures for
fish distribution and processing, ii) promotion of the export of fishery products by supporting small-medium
enterprises, iii) promotion of investment, iv) support for formulation of small-medium business units in
communities, v) development of financial institutions for fishers’ organizations, vi) development of infrastructures
in 100 small and archipelagic areas, and vii) strengthening the capabilities of organizations and enterprises
engaged in fish processing and distribution.
For exporting companies, MMAF requires them to acquire an international standard of quality control such
as HACCP and GMP, and supports the necessary expenses from the national budget.
(3) Fishery resources management
The method for collecting catch data, the basis of fishery resources management, varies between districts.
Therefore, an unification of data collection standard is required. At present, each district sends the catch data
monthly to MMAF through the Internet. In each district, 3 staff works on fishery statistics regarding aquaculture,
capture fishery, and fish processing. They collect data on a daily basis from KUD, working under the Ministry of
Cooperatives and Small-Medium Enterprises, but where KUD does not operate they conduct direct sampling at
fish markets and fish landing beaches. However, their sampling frequency and method are not standardized.

24
Therefore, the information’s validity is somewhat doubtful. MMAF asks experts on fishing management to check
the data sent from provinces and districts twice a year.
The appropriate management and sustainable utilization of fishery resources in adjacent waters is a core
purpose of UNCLOS 1982. Therefore, the policy on fishery resources management of any country must be
economically realistic for the fishery industry and must be socially and politically acceptable in Indonesia as well
as overseas. It is therefore more important to promote the strengthening of fishery resources management on the
basis of scientific data.
2.4 Other donors’ assistance
An example of other donors’ assistance programs for the improvement of infrastructure, such as fishing port
facilities, is the Kendari Fishing Port Construction of ADB, which was completed in 2000.
Other bilateral assistance projects in the fisheries sector in Indonesia are diverse. Cooperating countries include
China, India, Iran, Japan, Kenya, Korea, Norway, PNG, Philippines, Sweden and the USA in the fields of
aquaculture, fish processing, fishery resources management, and water environment conservation, etc.
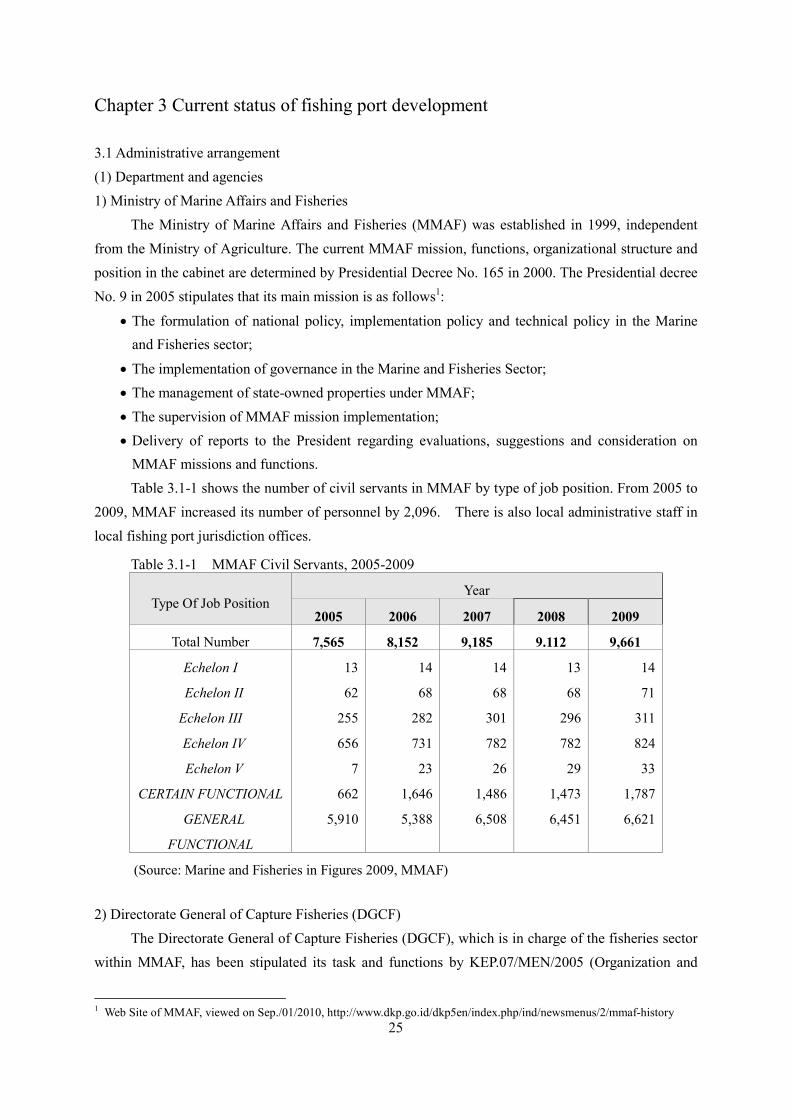
25
Chapter 3 Current status of fishing port development
3.1 Administrative arrangement (1) Department and agencies 1) Ministry of Marine Affairs and Fisheries
The Ministry of Marine Affairs and Fisheries (MMAF) was established in 1999, independent from the Ministry of Agriculture. The current MMAF mission, functions, organizational structure and position in the cabinet are determined by Presidential Decree No. 165 in 2000. The Presidential decree No. 9 in 2005 stipulates that its main mission is as follows1:
· The formulation of national policy, implementation policy and technical policy in the Marine and Fisheries sector;
· The implementation of governance in the Marine and Fisheries Sector; · The management of state-owned properties under MMAF; · The supervision of MMAF mission implementation; · Delivery of reports to the President regarding evaluations, suggestions and consideration on
MMAF missions and functions. Table 3.1-1 shows the number of civil servants in MMAF by type of job position. From 2005 to
2009, MMAF increased its number of personnel by 2,096. There is also local administrative staff in local fishing port jurisdiction offices.
Table 3.1-1 MMAF Civil Servants, 2005-2009
Type Of Job Position Year
2005 2006 2007 2008 2009
Total Number 7,565 8,152 9,185 9.112 9,661
Echelon I
Echelon II
Echelon III
Echelon IV
Echelon V
CERTAIN FUNCTIONAL
GENERAL
FUNCTIONAL
13
62
255
656
7
662
5,910
14
68
282
731
23
1,646
5,388
14
68
301
782
26
1,486
6,508
13
68
296
782
29
1,473
6,451
14
71
311
824
33
1,787
6,621
(Source: Marine and Fisheries in Figures 2009, MMAF)
2) Directorate General of Capture Fisheries (DGCF) The Directorate General of Capture Fisheries (DGCF), which is in charge of the fisheries sector
within MMAF, has been stipulated its task and functions by KEP.07/MEN/2005 (Organization and
1 Web Site of MMAF, viewed on Sep./01/2010, http://www.dkp.go.id/dkp5en/index.php/ind/newsmenus/2/mmaf-history

26
Working Management of Ministry of Marine Affairs and Fisheries), and they are as follows2: Main Duty: To compose and conduct the policies and technical standardization in Capture Fisheries Functions:
· To prepare the policies of MMAF concerning capture fisheries · To conduct the policies of capture fisheries according to regulations · To compose standards, norms, guidelines, criteria, and procedures in capture fisheries · To provide technical assistance and evaluation on capture fisheries · To conduct administration tasks in DGCF.
In relation to the management of fishing ports, DGCF mandates the tasks and functions of Directorate of Fishing Port, as follows:
· Revitalization of fishing ports · Outer Ring Fishing Port Development · Fishing port/fish landing center development, particularly in eastern areas · Fishing Port Information Centre development related to marine and fisheries information
system
· Human resources enhancement for fishing port/fish landing centers (2) Fishing port classification
Indonesian fishing ports are classified into 4 types by Ministry Decree No. PER16/MEN/2006 and No. KEP.10/MEN/2004 as follows:
Table 3.1-2 Classification of fishing port 3 Class of Fishing
Port Amount and Jurisdiction
Technical Criteria Fishing Operation
A: Oceanic Fishing Port
PPS: Pelabuhan Perikanan Samudera/
6 ports, MMAF
- Have mooring/docking facilities for 60GT fishing vessels at minimum. And have port pond for 100 fishing vessels with minimum depth of 3m.
- Minimum length of pier is 300m, etc.
- operational/fisheries activities in Territorial water, EEZ and offshore
- 18,000 to 120,000 tons of fishing catch
B: Archipelago Fishing Port
PPN: Pelabuhan Perikanan Nusantara
13 ports, MMAF
- Have mooring/docking facilities for 30GT fishing vessels at minimum.
- Have port pond for 75 fishing vessels with minimum depth of 3m.
- Minimum length of pier is 150m, etc.
- operational/fisheries activities in Territorial water and EEZ
- 7,200 to 18,000 tons of fishing catch
C: Coastal Fishing Port
PPP: Pelabuhan Perikanan Pantai /
2 ports, MMAF
- Have mooring/docking facilities for 10GT fishing vessels at minimum.
- Have port pond for 30 fishing vessels with minimum depth of
- operational/fisheries activities in inland water and archipelago.
44 ports, province
- operational/fisheries activities in inland
2 Indonesian Fishing Ports 2009, DGCF, MMAF, JICA 3 Indonesian Fishing Ports 2009, DGCF,MMAF,JICA

27
2m. - Minimum length of pier is 100m,
etc.
water, archipelago and territorial water
- 3,000 to 7,200 tons of fishing catch
D: Fishing Landing Place PPI: Pangkalan Pendaratan Ikan
895 places, province and regency/city
- Have mooring/docking facilities for 3GT fishing vessels at minimum.
- Have port pond for 20 fishing vessels with minimum depth of 2m.
- Minimum length of pier is 50m, etc.
- operational/fisheries activities in inland water and archipelago
(Source: DG of Capture Fisheries, MMAF, 2009)
(3) Budget for fishing port development Until 2004, MMAF had developed 5 PPS (Oceanic Fishing Port), 11 PPN (Archipelago Fishing
Port), 16 PPP (Coastal Fishing Port) and 168 PPI (Fish Landing Place) through APBN funds, while 400 PPI had been developed through APBD funds. On the northern coast of Java Island, 7 PPP and 38 PPI had been developed by APBN, and about 160 PPI had been developed by APBD.
In 2010, the number of Indonesian fishing ports reached 968, with 6 PPS, 13 PPN, 45 PPP, 902 PPI and 2 private fishing ports. Here, the development of PPI was carried out by APBD Murni and TP, the development of PPP was carried out by APBD Provinsi and TP, the development of PPN and PPS was carried out by APBN/APBD Provinsi/TP/DAK.
APBN : Government budget
APBD Murni : Local government budget
APBD Provinsi: Provincial government budget
TP : Task Assistance fund
Deco : Deconcentration fund
DAK : Special Allocation Fund from Ministry of Finance The budget allocation of MMAF is shown in the following table4.
Table 3.1-3 Budget allocation of MMAF, unit: billion IDR
Year Increasing Rate (%)
2005 2006 2007 2008 2009 2005
-2009 2008
-2009 MMAF Total 2,449.833 3,012.629 3,271.871 3,019.138 3,447.594 9.51 14.19
-Rupiah Murni 1,938.480 2,470.766 2,747.311 2,485.535 2,748.649 9.93 10.59
-PHLN 511.353 541.863 524.560 533.603 663.820 7.23 24.40
-Rupiah Murni Pendamping
- - - - 3.457 - -
4 Kelautan dan Perikanan dalam Angka 2009, (Marine and Fisheries in Figures 2009), Kementerian Kelautan dan Perikanan, (Ministry of Marine Affairs and Fisheries), pp-8.
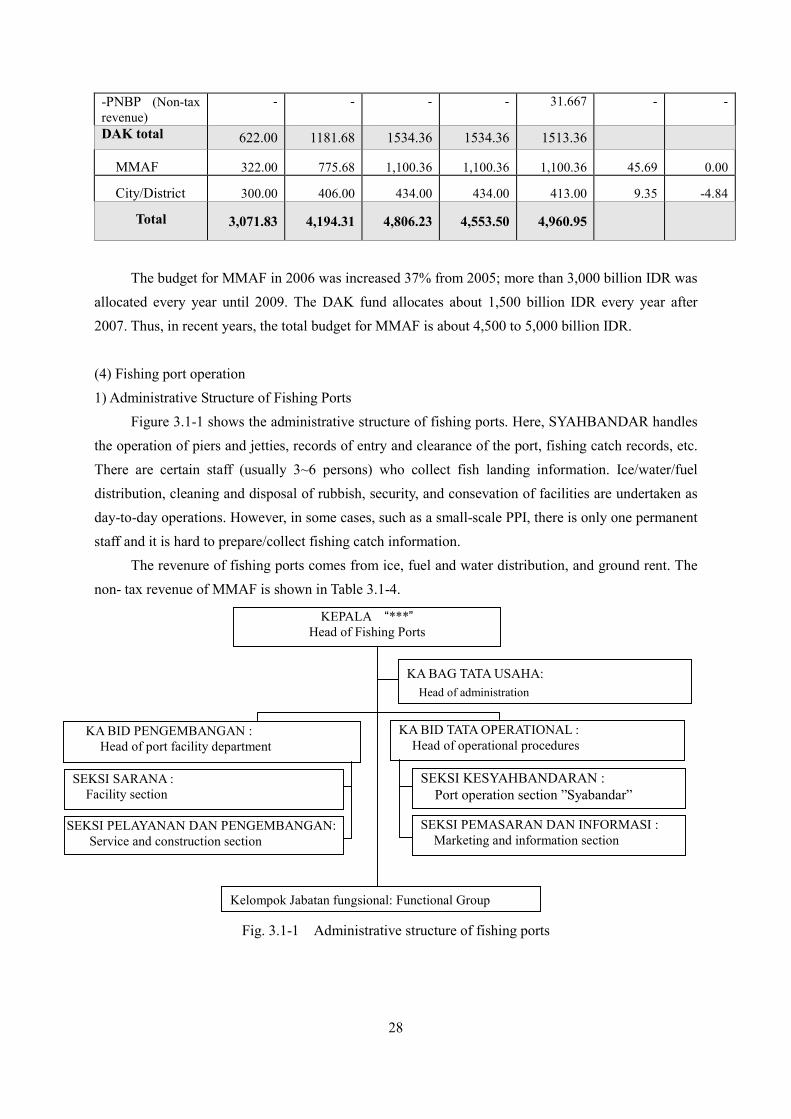
28
-PNBP (Non-tax revenue)
- - - - 31.667 - -
DAK total 622.00 1181.68 1534.36 1534.36 1513.36
MMAF 322.00 775.68 1,100.36 1,100.36 1,100.36 45.69 0.00
City/District 300.00 406.00 434.00 434.00 413.00 9.35 -4.84
Total 3,071.83 4,194.31 4,806.23 4,553.50 4,960.95
The budget for MMAF in 2006 was increased 37% from 2005; more than 3,000 billion IDR was
allocated every year until 2009. The DAK fund allocates about 1,500 billion IDR every year after 2007. Thus, in recent years, the total budget for MMAF is about 4,500 to 5,000 billion IDR. (4) Fishing port operation 1) Administrative Structure of Fishing Ports
Figure 3.1-1 shows the administrative structure of fishing ports. Here, SYAHBANDAR handles the operation of piers and jetties, records of entry and clearance of the port, fishing catch records, etc. There are certain staff (usually 3~6 persons) who collect fish landing information. Ice/water/fuel distribution, cleaning and disposal of rubbish, security, and consevation of facilities are undertaken as day-to-day operations. However, in some cases, such as a small-scale PPI, there is only one permanent staff and it is hard to prepare/collect fishing catch information.
The revenure of fishing ports comes from ice, fuel and water distribution, and ground rent. The non- tax revenue of MMAF is shown in Table 3.1-4.
Fig. 3.1-1 Administrative structure of fishing ports
KEPALA “***” Head of Fishing Ports
KA BID PENGEMBANGAN : Head of port facility department
KA BID TATA OPERATIONAL : Head of operational procedures
KA BAG TATA USAHA: Head of administration
Kelompok Jabatan fungsional: Functional Group
SEKSI KESYAHBANDARAN : Port operation section ”Syabandar”
SEKSI PEMASARAN DAN INFORMASI : Marketing and information section
SEKSI PELAYANAN DAN PENGEMBANGAN: Service and construction section
SEKSI SARANA : Facility section
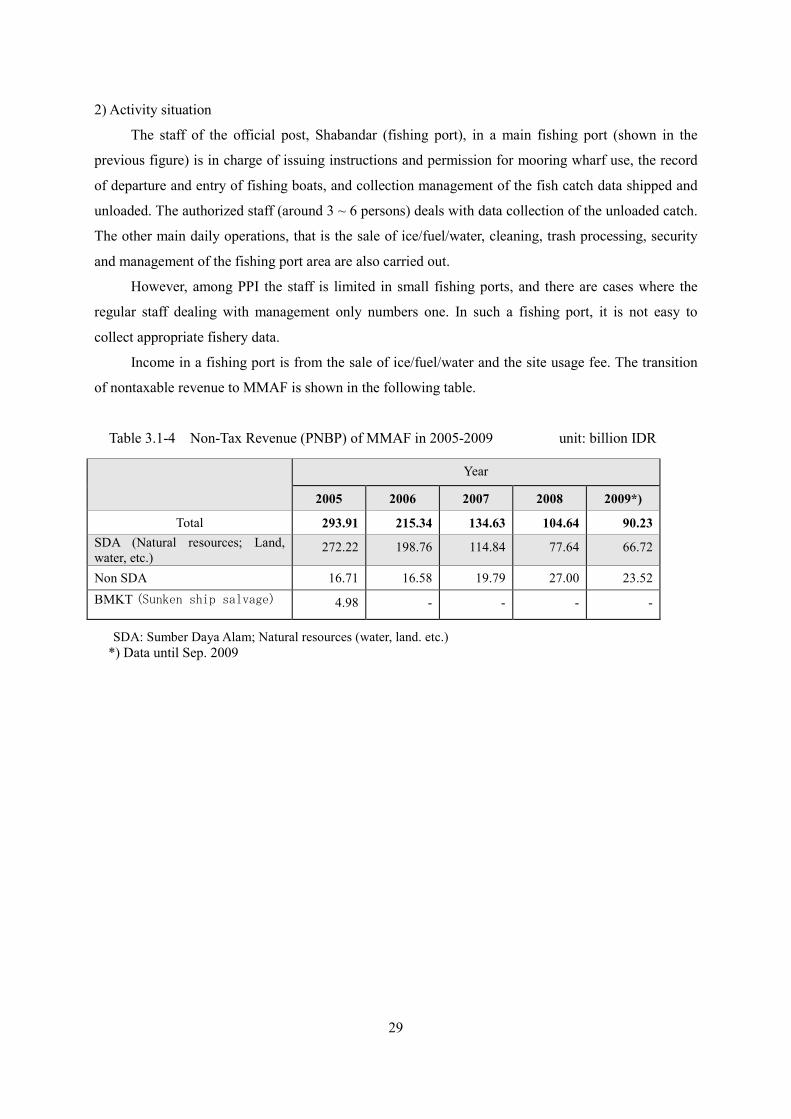
29
2) Activity situation
The staff of the official post, Shabandar (fishing port), in a main fishing port (shown in the
previous figure) is in charge of issuing instructions and permission for mooring wharf use, the record
of departure and entry of fishing boats, and collection management of the fish catch data shipped and
unloaded. The authorized staff (around 3 ~ 6 persons) deals with data collection of the unloaded catch.
The other main daily operations, that is the sale of ice/fuel/water, cleaning, trash processing, security
and management of the fishing port area are also carried out.
However, among PPI the staff is limited in small fishing ports, and there are cases where the
regular staff dealing with management only numbers one. In such a fishing port, it is not easy to
collect appropriate fishery data.
Income in a fishing port is from the sale of ice/fuel/water and the site usage fee. The transition
of nontaxable revenue to MMAF is shown in the following table.
Table 3.1-4 Non-Tax Revenue (PNBP) of MMAF in 2005-2009 unit: billion IDR
SDA: Sumber Daya Alam; Natural resources (water, land. etc.) *) Data until Sep. 2009
Year
2005 2006 2007 2008 2009*)
Total 293.91 215.34 134.63 104.64 90.23 SDA (Natural resources; Land, water, etc.)
272.22 198.76 114.84 77.64 66.72
Non SDA 16.71 16.58 19.79 27.00 23.52 BMKT (Sunken ship salvage) 4.98 - - - -

30
3) Maintenance and management of fishing ports
There is not enough budget for the conservation and maintenance of fishing port facilities in
most of the fishing ports, so most of the facilities are untouched after their initial construction. Thus,
many of the aged facilities have deteriorated, especially in small PPI. Through this survey, the
deterioration of pavements on jetties and quays, collapsed wooden jetties, poor drainage and insanitary
conditions, collapsed auction halls, and disabled ice-making machinery are seen in many small PPI.
Upper Left : PPI Tanjun Luar5(degraded pavement)
Upper Right: PPI Sebatik6(collapsed wooden jetty)
Left : PPI Rajawari7(insanitary conditions)
Fig. 3.1-2 Facilities damaged in small PPIs
On the other hand, in fishing ports classified into PPP/PPN/PPS on this survey, most of the facilities were maintained and were in good condition, thus working properly. In PPS Bitung, in 2000, an unsanitary apron pavement was improved by upgrading the pavement, developing a sunshade roof and developing an auction hall.
3.2 Outer-ring fishing port (ORFP) development
3.2.1 ORFP development master plan
(1) Study of ORFP development Master Plan, 2004
1) Background of the Study In the development of the fisheries sector, which is recognized as a part of the economic
5 West Nusa Tenggara, , 2010/04/21, Fig. 5.2-2 6 Sebatik Is. in East Kalimantan, 2010/05/13, Fig.5.2-10 7 Makassar in South Sulawesi, 2010/04/30, Fig. 5.2-4

31
progress of Indonesia, the improvement of the livelihood of capture fishers and aquaculture fishers is one of the most important objectives. There are adequate resources in the field of Indonesian fisheries to meet this objective. However, regarding whether fishing production can be maintained or increased, the utilization rate of marine fishery resources in Indonesia is not equivalent between territories. Some areas are over exploited and others are not optimally utilized. This disparity is related to the development level of the fishing port facilities. In Indonesia, most of the fishing ports are small-scale PPI, and are located in Java, the east coast of Sumatra and the archipelago coast, which makes up about 70% of the total. Only about 20% of the fishing ports are located in the eastern part and outer ring area8.
In connection with this deviation of fishing port distribution, fishery resources are considered not to be optimally utilized in the outer ring area such as the Indian Ocean (West Coast of Sumatra Island), South China Sea, Arafura Sea, Sulawesi Sea and so on, even when taking into consideration the IUU fishing from other countries. It is considered that there are underutilized resources in this area. However, the widespread location of fishing ports in the outer ring area makes it difficult to monitor fishery resources and fishing activity in the EEZ, etc. Furthermore, the outer ring territory not only has a minimal amount of fishing port facilities, but also the territory lags behind in terms of economic and industrial growth.
Thus, it is important to exploit the underutilized resources of the outer ring area not only through the fisheries sector but also through social, economic-related and environmental forces, operating under the sustainable management principle. This development requires fishing port facilities in the outer ring area as a stronghold for capture fisheries and fishery business as well. The fishing ports in the outer ring area are expected to have an important role in improving functional relations between fishing and aquaculture, improving rural economic activity, supporting the growth of small- and large- scale fishing in parallel, and supporting the implementation of fishing production centers. Furthermore, fishing ports in border territories can play an important role in border security and prevention of IUU fishing by other countries.
The Government of Indonesia had built 813 fishing ports by the year 2004. However, many PPI,
which is the dominant type of the 4 types of fishing port, have various problems such as insufficient
quantity and low quality of mooring facilities and lack of ice/water/fuel. The information concerning
the conditions (such as fishery resources, fishing and fisheries, social, economic, borders and political)
of each site, which vary widely, is not comprehensive enough.
Therefore, it becomes necessary to conduct a study to assess the future development of fishing
ports in the outer ring area by examining the location, development plans and phased construction. The
study on the outer ring fishing port development master plan (Pe kerjaan Penyusunan Masterplan
Pengembangan Pelabuhan Perikanan di Lingkar Luar Wilayah Indonesia, Developmental Master
Plan Composition, Outer Ring Fishing Port of Indonesian Territory (CODE: SU-01), Dec. 2004, Final
8 Marine and Fishery statistics of Indonesia(DKP, 2007)
32
Report ; PT. Perentjana Djaja) was carried out in 2004.
Meanwhile, prior to this study, MMAF had carried out a study on each fishing management
territory to provide several growth centers. The areas selected to be growth centers are expected to
become strongholds for capture fisheries not only in their specific areas but also to be engines for
adjacent areas, through the development of fisheries sectors and by support from various policies and
measures. Through this policy, selected areas will be guaranteed to receive support from central and
regional governments through the development of infrastructure and facilities and other measures, and
from stakeholders as well. The study on the outer ring fishing port development master plan was
carried out based on the results of this former study.
2) Objectives of the plan
The objectives of this study are as follows:
· To evaluate the availability, functionality and adequacy of fish landing bases and fishing ports
in the outer ring territory of Indonesia.
· To determine fishing port development locations and their alternatives in the outer ring
territory considering fishery resource availability, fishing techniques, local economy and social
conditions.
· To examine and study fish landing base/fishing port development plans which can serve
optimally according to the national main plan.
· To study operational relations between the existing fishing ports and planned outer ring fishing
ports.
From a series of investigations, this study aims to report on:
· Obtaining regional policy on fishing management especially on capture fisheries.
· Recommendation of fish landing bases and fishing ports to develop, including fishing port
type/classification, location and facilities.
· Designing a master plan and realization steps for the development of fish landing bases/fishing
ports in the outer ring territory.
3) Scope of work
In accordance with the above objectives, the scope of the work done in the study in 2004 is as
follows:
i) Examination of outer-ring territory:
· Identifying all the fish landing bases and fishing ports in the outer ring territory.
· Survey and evaluation of functions, availability and adequacy of above fish landing
bases/fishing ports.
· To study the outer ring fishing port development policy and location referring to four main

33
elements, namely fishery resource conditions, fishers concentration and location, accessibility
to landing both from sea and land, and market conditions for capture fishery business, and in
addition, social and economical aspects, and regional/central government policy as well.
ii) Information gathering for selected sites:
· Current status of capture fisheries in each WPP fishery area and resource conditions.
· Natural conditions, local economy, fishing port/facilities condition, capture fisheries, fishers,
and fishing boats, in 25 selected locations for outer ring fishing port development. Clarifying
the problems with fishing ports.
iii) Objectives of outer-ring fishing port (ORFP) development:
· Optimizing fishery resources, reducing IUU and losses, creating new growth, international
standard facilities, fishing port network, fishing port hierarchies.
iv) Master plan of outer-ring fishing port (ORFP) development:
· Potential of capture fisheries.
· Objectives and development plan of outer ring fishing port.
· Short-term and long-term targets, site conditions, resource conditions in 25 outer ring fishing
port development sites.
· Hierarchies of each fishing port by estimated maximum available fishing catch.
v) Priority of outer-ring fishing port (ORFP) development sites:
· To evaluate the priority of each development site by considering natural condition, territory
development, potential of fishery, aspect for reducing conflict.
(2) Summary of outer-ring fishing port (ORFP) development Master Plan
A series of investigations was carried out and following results were reported by Pe kerjaan
Penyusunan Masterplan Pengembangan Pelabuhan Perikanan di Lingkar Luar Wilayah Indonesia
(Developmental Master Plan Composition, Outer Ring Fishing Port of Indonesian Territory (CODE:
SU-01), Dec. 2004, Final Report ; PT. Perentjana Djaja) in 2004.
1) Objectives and main policies
Objectives and main policies of the outer ring fishing port development are submitted as
follows:
i) Optimizing fishery resources: To exploit fishery resources in the EEZ9 and high seas by
improving fishing port facilities and operation management, and develop outer ring territory.
ii) Regional cooperation: Outer ring fishing ports to become special check points and new growth
centers in the territory by intensifying fishery resources management in under-exploited waters.
iii) Reducing IUU and losses: Outer ring fishing ports will intensify the control of foreign flagged
9 Exclusive Economic Zone, (Indonesian: ZEEI, Zona Ekonomi Eksklusif Indonesia)

34
ships which operate in the surrounding waters and will reduce the losses which are estimated to
be about 4~6 billion USD.
Illegal transactions such as the transshipment of fishing catch is widespread in Indonesian waters,
and it threatens resources management, lessens not only tax revenues but also fish prices, and
become an obstacle for the development of the fisheries sector. This occurs because of the limited
fishing boat capacity of Indonesian fishers, and lack of infrastructure for fishery product
marketing. Furthermore, many foreign ships, which operate in Indonesian waters, land their catch
at foreign ports due to the lack of landing, marketing and processing facilities in Indonesia. The
outer ring fishing ports plan to provide adequate facilities for foreign ships to land their catch.
iv) Creating new growth: Since the focused areas are close to fishing grounds dominated by
foreign ships, the development is expected to create new employment with skilled labor to meet
global market demands, and reduce cheap migrant labor.
v) International standard facilities: In order to increase the competitiveness of fishery products in
the international market, to have adequate facilities to meet international demand and quality
standards is a major criterion. For example, in tuna export, the capacity of 100 to 200GT fishing
boats is said to be the most economical for exporting. Thus, the outer ring fishing ports must be
capable of handling these ships and have a cold storage capacity of 100-200 tons. This could also
reduce transshipment activity. In order to provide high-quality fishing catch, the further supply
capacity of ice and fresh water is also needed. Thus, the following infrastructure and facilities will
be needed for outer ring fishing ports.
- Port basin and berth that can accommodate mother ships and container ships of 6,000 GT for
export fishing ports.
- Facilities which can accommodate 100-200GT boats to transfer catches to export fishing
ports in feeder fishing ports.
- Administration offices and business offices, ice factory, cold storage, etc.
- Cranes and forklifts.
- Shopping centers to support fishery activities.
- Industrial estates and associated infrastructure (electricity, water supply, communication
tools, waste treatment plant, etc.)
- Access roads, neighborhood roads and other supporting facilities.
- Export service facilities, such as quarantine centers and quality test centers.
vi) Fishing port network: In the development of outer ring fishing ports, their function is
classified as feeder ports and exporting ports, and linkage between the present fishing ports and
outer ring fishing ports will be built to achieve synergistic operations.
vii) Hierarchies of fishing ports: Outer ring fishing port classification will follow the existing
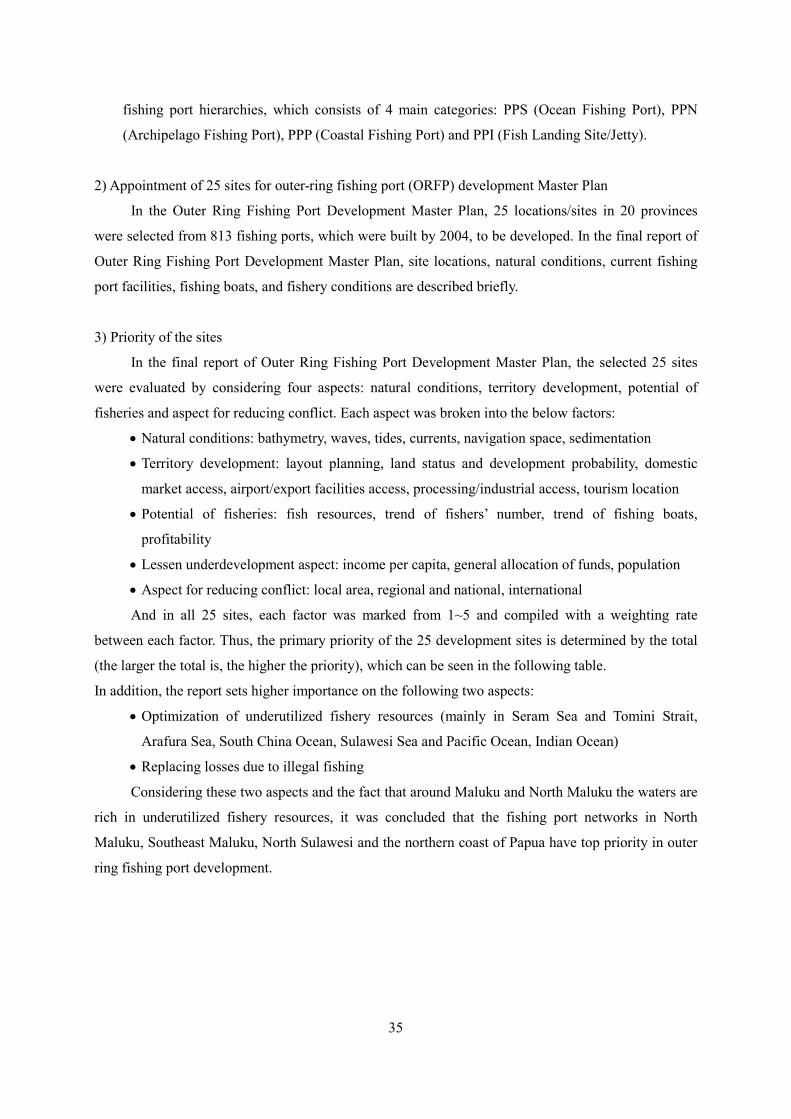
35
fishing port hierarchies, which consists of 4 main categories: PPS (Ocean Fishing Port), PPN
(Archipelago Fishing Port), PPP (Coastal Fishing Port) and PPI (Fish Landing Site/Jetty).
2) Appointment of 25 sites for outer-ring fishing port (ORFP) development Master Plan
In the Outer Ring Fishing Port Development Master Plan, 25 locations/sites in 20 provinces
were selected from 813 fishing ports, which were built by 2004, to be developed. In the final report of
Outer Ring Fishing Port Development Master Plan, site locations, natural conditions, current fishing
port facilities, fishing boats, and fishery conditions are described briefly.
3) Priority of the sites
In the final report of Outer Ring Fishing Port Development Master Plan, the selected 25 sites
were evaluated by considering four aspects: natural conditions, territory development, potential of
fisheries and aspect for reducing conflict. Each aspect was broken into the below factors:
· Natural conditions: bathymetry, waves, tides, currents, navigation space, sedimentation
· Territory development: layout planning, land status and development probability, domestic
market access, airport/export facilities access, processing/industrial access, tourism location
· Potential of fisheries: fish resources, trend of fishers’ number, trend of fishing boats,
profitability
· Lessen underdevelopment aspect: income per capita, general allocation of funds, population
· Aspect for reducing conflict: local area, regional and national, international
And in all 25 sites, each factor was marked from 1~5 and compiled with a weighting rate
between each factor. Thus, the primary priority of the 25 development sites is determined by the total
(the larger the total is, the higher the priority), which can be seen in the following table.
In addition, the report sets higher importance on the following two aspects:
· Optimization of underutilized fishery resources (mainly in Seram Sea and Tomini Strait,
Arafura Sea, South China Ocean, Sulawesi Sea and Pacific Ocean, Indian Ocean)
· Replacing losses due to illegal fishing
Considering these two aspects and the fact that around Maluku and North Maluku the waters are
rich in underutilized fishery resources, it was concluded that the fishing port networks in North
Maluku, Southeast Maluku, North Sulawesi and the northern coast of Papua have top priority in outer
ring fishing port development.

36
Table 3.2-1 Summary of outer-ring fishing port (ORFP) development master plan in each site
No. Name of fishing port Provinces Type Total
Score Rank Fishing catch Status Short-Term Target Notes Catch(t) Trend
1 Sabang Nanggroe Aceh Darussalam
PPI 72 1 1,808 +3.7% Feeder 200GT class facility Ice factory, cold storage
Catch exceeds capacity of 1500t, but no upgrade of fishing port.
2 Bitung North Sulawesi PPS 70 2
61,452 (2010) +9.42% Export Ice factory, cold storage Catch is overestimated. (including
adjacent PPIs)
3 Nunukan East Kalimantan - 67 3
1,000t/year (assumed)
Feederー
200GT class facility, Patrol ships and navy ships
New site. Users and fishery conditions not studied yet.
4 Labuhan Haji PPI 65 4 3,650? (increasing, no individual data) Feeder 200GT class facility Problems in transporting fishing catch
5 Perigi East Java PPN 65 5 10,000->40,000 Feeder Ice factory, cold storage, Expansion of port capacity
Problems on fish catch data and future estimation.
6 Tual Maluku PPN 64 6 56,000 ~82,672;-4.6% Export Ice factory, cold storage Catch exceeds capacity of 8,000t, but no
upgrade of fishing port.
7 Bungus West Sumatra PPS 64 7 2,833 -0.5% Feeder Ice factory, cold storage,
move fish industry Low activity, port is not used appropriately in spite of PPS.
8 Biak West Papua PPI 61 8 9,507 →584 ton in 2003 Export Ice factory, cold storage Sharp decrease in tuna/skip jack fishing
boats.
9 Pelabuhan Ratu West Java PPN 60 9 2,890 -3.0% Export (by air) Ice factory, cold storage Facilities have enough room for planned
catch.
10 Sibloga North Sumatra PPN 60 10 1,403 +0.79% Feeder Relocation, 200GT class
facility Unable to use fishing port for 30GT fishing boats which operate in this area.
11 Kupang East Nusa Tenggara PPP 60 11 2,267 +1.9% Export Ice factory, cold storage Actual condition of shortage of facilities is
not recognized
12 Tarempa Riau Island PPP 59 12 1,588 -1.6% Feeder 200GT class dredging, upgrading facilities
Catch and demand from fishing boats are both struggling after law-related operation activity.
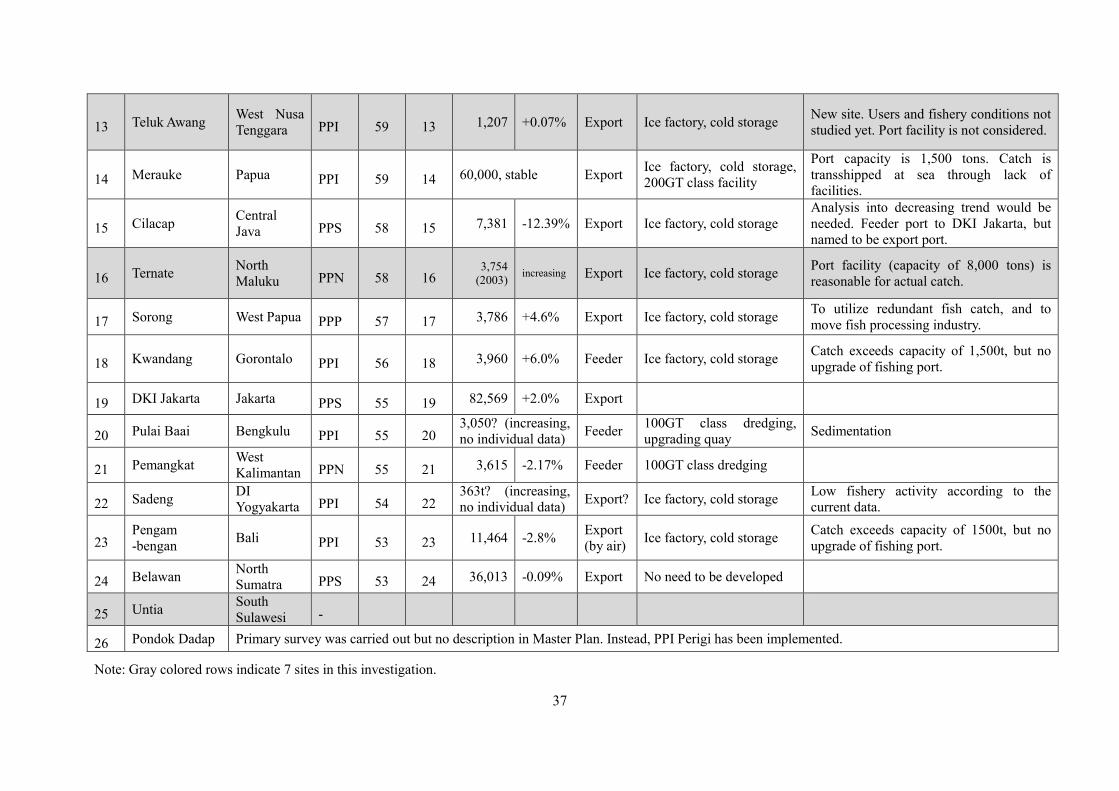
37
13 Teluk Awang West Nusa Tenggara PPI 59 13 1,207 +0.07% Export Ice factory, cold storage New site. Users and fishery conditions not
studied yet. Port facility is not considered.
14 Merauke Papua PPI 59 14 60,000, stable Export Ice factory, cold storage, 200GT class facility
Port capacity is 1,500 tons. Catch is transshipped at sea through lack of facilities.
15 Cilacap Central Java PPS 58 15 7,381 -12.39% Export Ice factory, cold storage
Analysis into decreasing trend would be needed. Feeder port to DKI Jakarta, but named to be export port.
16 Ternate North Maluku PPN 58 16
3,754 (2003) increasing Export Ice factory, cold storage Port facility (capacity of 8,000 tons) is
reasonable for actual catch.
17 Sorong West Papua PPP 57 17 3,786 +4.6% Export Ice factory, cold storage To utilize redundant fish catch, and to move fish processing industry.
18 Kwandang Gorontalo PPI 56 18 3,960 +6.0% Feeder Ice factory, cold storage Catch exceeds capacity of 1,500t, but no upgrade of fishing port.
19 DKI Jakarta Jakarta PPS 55 19 82,569 +2.0% Export
20 Pulai Baai Bengkulu PPI 55 20 3,050? (increasing, no individual data) Feeder 100GT class dredging,
upgrading quay Sedimentation
21 Pemangkat West Kalimantan PPN 55 21 3,615 -2.17% Feeder 100GT class dredging
22 Sadeng DI Yogyakarta PPI 54 22
363t? (increasing, no individual data) Export? Ice factory, cold storage Low fishery activity according to the
current data.
23 Pengam -bengan Bali PPI 53 23 11,464 -2.8% Export
(by air) Ice factory, cold storage Catch exceeds capacity of 1500t, but no upgrade of fishing port.
24 Belawan North Sumatra PPS 53 24 36,013 -0.09% Export No need to be developed
25 Untia South Sulawesi -
26 Pondok Dadap Primary survey was carried out but no description in Master Plan. Instead, PPI Perigi has been implemented.
Note: Gray colored rows indicate 7 sites in this investigation.

38
3.2.2 Road map of ORFP development
In 2010, MMAF has formulated the “ROAD MAP, OUTER RING FISHING PORTS
DEVELOPMENT, Pengembangan Pelabuhan Perikanan di Lingkar Luar Wilayah Indonesia, 2010,
DIRECTORATE GENERAL OF CAPTURE FISHERIES”, which provides an overview of the ORFP
development plan, its ongoing status, current activity and step-by-step execution of the plan. The
number of fishing port has increased from 813 to 968 in 2010.
(1) Execution plan of ORFP development
In the road map, the implementation process of ORFP development is divided into the following
three processes.
i) Master plan (2004)
The master plan outlines the direction and measures needed, so that the fishing ports that spread
throughout the outer ring territory could form a synergistic network, and provide benefits to those
involved and prosperity for the fishers.
ii) Selection of development site (2004)
In the final report of the Master Plan10, there is no description about the process for selecting the
development site. On the other hand, according to the road map, the site selection was carried out in
line with the master plan by considering the following aspects:
· The site will not create friction with local fishers or the community.
· Backing of high-technology industries.
· Having competitive potential and advantages to attract foreign fishing fleets.
· Accountable for biological, environmental, technological, social and economical aspects.
· Adequate access from land, sea and air.
· Good local facilities and infrastructure support.
· Complying with national master plan.
iii) Feasibility study and detail design
Based on the master plan, the concept of ORFP development will be followed up by a feasibility
study on technical, environmental, economic, financial and social investigations. Then, a detailed
design, including an engineering-related design, will be the guideline for implementing physical
construction.
10 Pe kerjaan Penyusunan Masterplan Pengembangan Pelabuhan Perikanan di Lingkar Luar Wilayah Indonesia (Developmental Master Plan Composition, Outer Ring Fishing Port of Indonesian Territory (CODE: SU-01), Dec. 2004, Final Report; PT. Perentjana Djaja) in 2004.

39
(2) Expected impacts
The expected impacts in ORFP development are as follows:
· Creating new employment, especially from foreign investment
· Creating a spread effect on the Indonesian macro and micro economy
· Countering the economic losses caused by IUU fishing and using fishing ports abroad (It is
estimated that 1~1.5 million tons of IUU fishing causes losses of about 3~4.5 billion IDR.)
· Increasing foreign exchange and economic impact through fish exports from ORFP, expecting
3 billion USD from 1.0 million tons of catch in ORFP in total.
· Improvement of fishing vessel services
· National security/secure territorial areas
· Security for fishers
· Optimizing the enforcement of the “Code of Conduct for Responsible Fisheries”
· Development of areas and even spread of marine affairs and fisheries development
(3) Cost estimation on ORFP development
The budget plan for the implementation of ORFP, which was estimated on the basis of the
Master Plan, can be seen in the following table. The budget amount for 25 sites is estimated at 6,500
billion IDR, excluding Untia/Makassar. This amount includes development study works (site selection,
feasibility study and master plan of fishing ports), detail design and supervision, construction and
improvement of fishing port facilities that comply with international standards, improvement of
capabilities of human resources, and monitoring and evaluation of the program.
As the funds needed are considerable, the government of Indonesia expects the source of
financing, besides from the National Expenditure Budget, to come from foreign aid funds (loans and
grants). Generally, the process of securing foreign funding would require a relatively long time period;
for the time being, the funding is expected to come under the budget of Task Assistance (TP),
Deconcentration Fund (Deco Fund), Special Allocation Funds (DAK) and local budgets as well.
Table 3.2-2 Cost estimation for outer ring fishing ports (ORFP) development
No. Name of fishing port Provinces Type of existing
port
Proposed type
Cost Estimation (IDR Billion)
1 Sabang Labuhan Haji
NAD PPI PPI
PPS PPN
368 245
2 Belawan Sibloga
North Sumatra PPS PPN
PPS PPN
245 307
3 Bungus West Sumatra PPS PPS 184 4 Tarempa Riau Island PPP PPN 307 5 Pulai Baai Bengkulu PPI PPN 245 6 Pemangkat West Kalimantan PPN PPN 245 7 Nunukan East Kalimantan - PPN 245 8 DKI Jakarta Jakarta PPS PPS 184
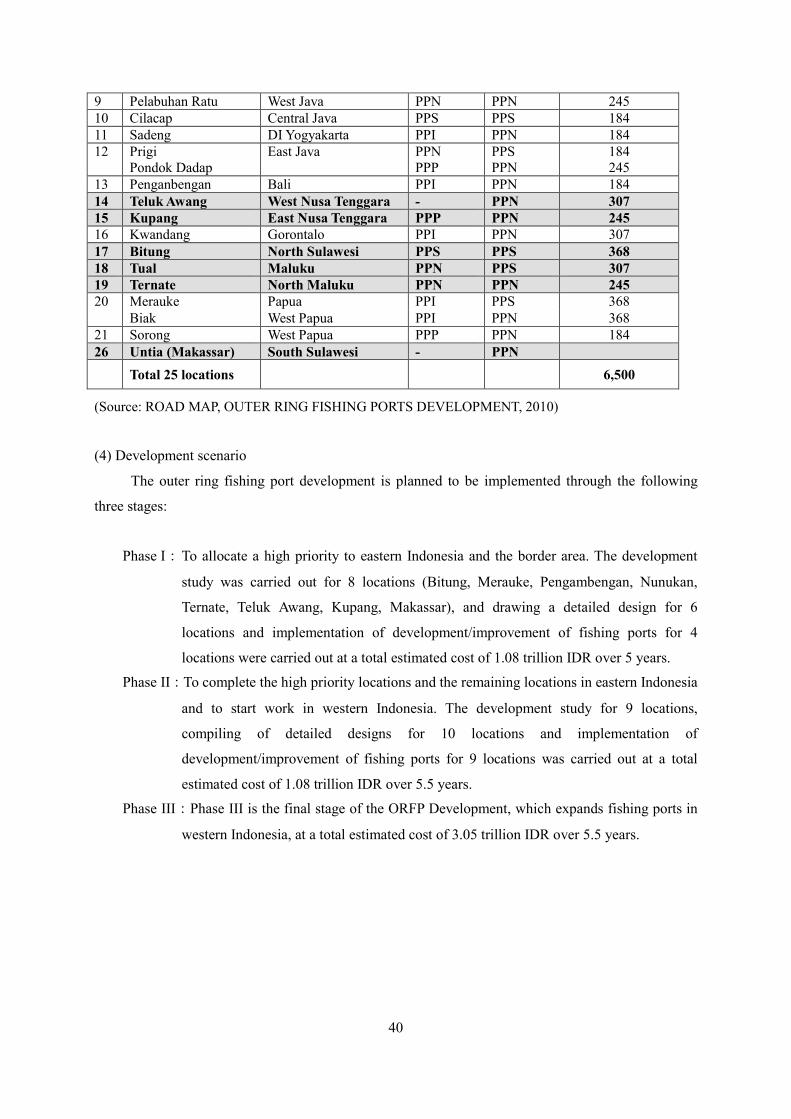
40
9 Pelabuhan Ratu West Java PPN PPN 245 10 Cilacap Central Java PPS PPS 184 11 Sadeng DI Yogyakarta PPI PPN 184 12 Prigi
Pondok Dadap East Java PPN
PPP PPS PPN
184 245
13 Penganbengan Bali PPI PPN 184 14 Teluk Awang West Nusa Tenggara - PPN 307 15 Kupang East Nusa Tenggara PPP PPN 245 16 Kwandang Gorontalo PPI PPN 307 17 Bitung North Sulawesi PPS PPS 368 18 Tual Maluku PPN PPS 307 19 Ternate North Maluku PPN PPN 245 20 Merauke Papua PPI PPS 368
Biak West Papua PPI PPN 368 21 Sorong West Papua PPP PPN 184 26 Untia (Makassar) South Sulawesi - PPN Total 25 locations 6,500
(Source: ROAD MAP, OUTER RING FISHING PORTS DEVELOPMENT, 2010)
(4) Development scenario
The outer ring fishing port development is planned to be implemented through the following
three stages:
Phase I: To allocate a high priority to eastern Indonesia and the border area. The development
study was carried out for 8 locations (Bitung, Merauke, Pengambengan, Nunukan,
Ternate, Teluk Awang, Kupang, Makassar), and drawing a detailed design for 6
locations and implementation of development/improvement of fishing ports for 4
locations were carried out at a total estimated cost of 1.08 trillion IDR over 5 years.
Phase II:To complete the high priority locations and the remaining locations in eastern Indonesia
and to start work in western Indonesia. The development study for 9 locations,
compiling of detailed designs for 10 locations and implementation of
development/improvement of fishing ports for 9 locations was carried out at a total
estimated cost of 1.08 trillion IDR over 5.5 years.
Phase III:Phase III is the final stage of the ORFP Development, which expands fishing ports in
western Indonesia, at a total estimated cost of 3.05 trillion IDR over 5.5 years.
41
Fig. 3.2-1 Location of selected survey sites
(Source: ROAD MAP, OUTER RING FISHING PORTS DEVELOPMENT, 2010)
The proposal for the development of 8 fishing ports selected in Phase-I were sent to
BAPPENAS in 2006; it was regarded as a priority project in the Blue Book 2006-2009. Measures,
which have been carried out from 2004, are seen in the following table. In 2005, Untia fishing port
(Makassar) was added as an ORFP, making 26 locations in total.
(5) Progression of ORFP development In the Phase-I period, construction work has started in 12 of the outer ring fishing ports.
Construction work in the Jakarta Fishing Port was carried out with the assistance of a JICA Loan. In the Belawan Fishing Port and Sibloga Fishing Port, detailed design work was carried out with the assistance of an IDB Loan.
Within the seven fishing ports that are the subject of this investigation, construction work has started in the three new fishing ports of Teliuk Awang, Nunukan and Untia/Makassar, and one existing fishing port, Bitung. In the Teluk Awang Fishing Port, detailed design work was carried out in 2004, and construction work started in 2005. At present, land reclamation, trestles for bunkers and small boat jetties, common lodging, kiosks, small houses for fuel stations and gates have already been completed.
In the Nunukan Fishing Port, detailed design work was carried out in 2004, and construction work started in 2005. From 2004 to 2008, 13.8 billion IDR of the budget was allocated, while 245 billion IDR will be required to cover the total project costs. However, a contractor bungled a job, and
42
recovery work is being carried out by the same contractor. In the Untia Fishing Port, a review of the project and detailed design work were carried out in
2005, and construction work started from 2006. From 2005 to 2009, 19.3 billion IDR of budget was allocated, while 364 billion IDR will be required to cover the total project costs. At present, reclamation of roads and two-thirds of the trestle for access to the offshore fishing port facilities has been completed.
In the Bitung Fishing Port, a 6m quay (pile-supported jetty) was constructed in 2002; the auction hall, sun shade roof, apron pavement and stair landing quay were constructed in 2004; and one hectare of land was then reclaimed. Work on the access jetty and completion of the periphery of the reclaimed land (revetment/quay) is currently under way in 2010. Completion of the new jetty is expected in 2012.
The progress of ORFP Development is shown in the following tables.
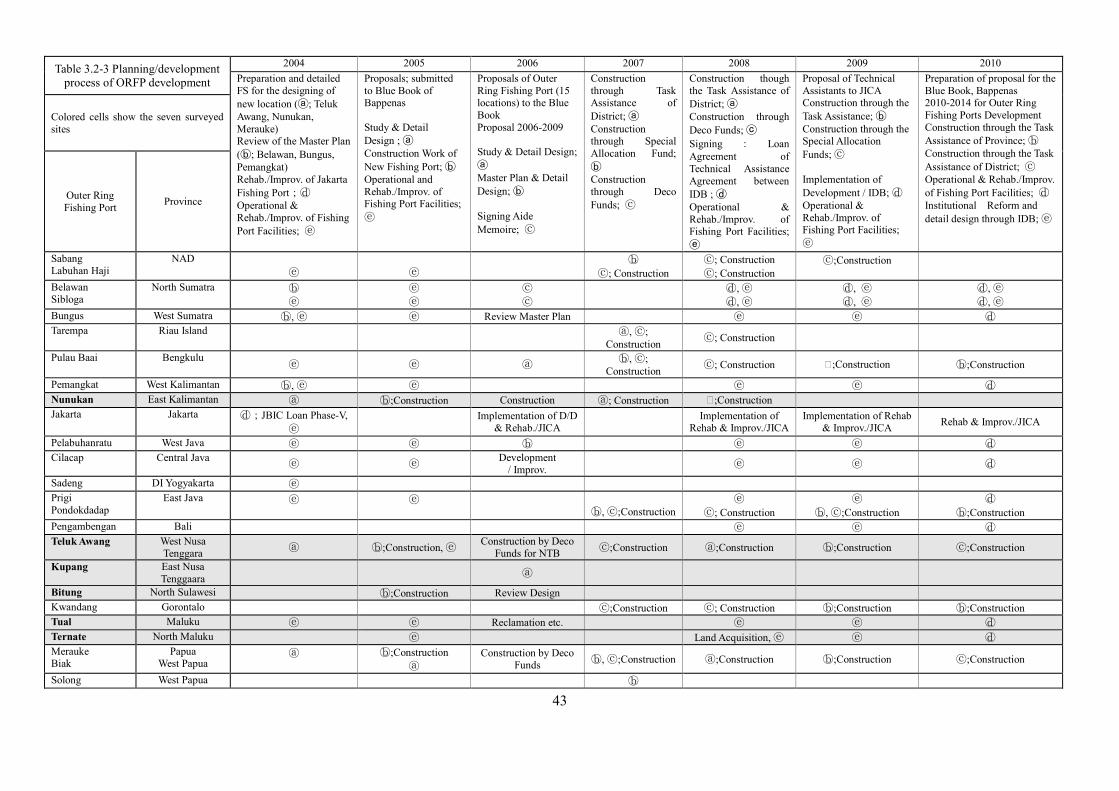
43
Table 3.2-3 Planning/development process of ORFP development
2004 2005 2006 2007 2008 2009 2010 Preparation and detailed FS for the designing of new location (ⓐ; Teluk Awang, Nunukan, Merauke) Review of the Master Plan (ⓑ; Belawan, Bungus, Pemangkat) Rehab./Improv. of Jakarta Fishing Port;ⓓ Operational & Rehab./Improv. of Fishing Port Facilities; ⓔ
Proposals; submitted to Blue Book of Bappenas Study & Detail Design ; ⓐ Construction Work of New Fishing Port; ⓑ Operational and Rehab./Improv. of Fishing Port Facilities; ⓔ
Proposals of Outer Ring Fishing Port (15 locations) to the Blue Book Proposal 2006-2009 Study & Detail Design; ⓐ Master Plan & Detail Design; ⓑ Signing Aide Memoire; ⓒ
Construction through Task Assistance of District; ⓐ Construction through Special Allocation Fund; ⓑ Construction through Deco Funds; ⓒ
Construction though the Task Assistance of District; ⓐ Construction through Deco Funds; ⓒ Signing : Loan Agreement of Technical Assistance Agreement between IDB ; ⓓ Operational & Rehab./Improv. of Fishing Port Facilities; ⓔ
Proposal of Technical Assistants to JICA Construction through the Task Assistance; ⓑ Construction through the Special Allocation Funds; ⓒ Implementation of Development / IDB; ⓓ Operational & Rehab./Improv. of Fishing Port Facilities; ⓔ
Preparation of proposal for the Blue Book, Bappenas 2010-2014 for Outer Ring Fishing Ports Development Construction through the Task Assistance of Province; ⓑ Construction through the Task Assistance of District; ⓒ Operational & Rehab./Improv. of Fishing Port Facilities; ⓓ Institutional Reform and detail design through IDB; ⓔ
Colored cells show the seven surveyed sites
Outer Ring Fishing Port Province
Sabang Labuhan Haji
NAD ⓔ
ⓔ ⓑ
ⓒ; Construction ⓒ; Construction ⓒ; Construction
ⓒ;Construction
Belawan Sibloga
North Sumatra ⓑ ⓔ
ⓔ ⓔ
ⓒ ⓒ
ⓓ, ⓔ ⓓ, ⓔ
ⓓ, ⓔ ⓓ, ⓔ
ⓓ, ⓔ ⓓ, ⓔ
Bungus West Sumatra ⓑ, ⓔ ⓔ Review Master Plan ⓔ ⓔ ⓓ Tarempa Riau Island ⓐ, ⓒ;
Construction ⓒ; Construction
Pulau Baai Bengkulu ⓔ ⓔ ⓐ ⓑ, ⓒ;
Construction ⓒ; Construction ⓑ;Construction ⓑ;Construction
Pemangkat West Kalimantan ⓑ, ⓔ ⓔ ⓔ ⓔ ⓓ Nunukan East Kalimantan ⓐ ⓑ;Construction Construction ⓐ; Construction ⓑ;Construction Jakarta Jakarta ⓓ;JBIC Loan Phase-V,
ⓔ Implementation of D/D
& Rehab./JICA Implementation of Rehab & Improv./JICA
Implementation of Rehab & Improv./JICA Rehab & Improv./JICA
Pelabuhanratu West Java ⓔ ⓔ ⓑ ⓔ ⓔ ⓓ Cilacap Central Java
ⓔ ⓔ Development / Improv. ⓔ ⓔ ⓓ
Sadeng DI Yogyakarta ⓔ Prigi Pondokdadap
East Java ⓔ
ⓔ
ⓑ, ⓒ;Construction ⓔ
ⓒ; Construction ⓔ
ⓑ, ⓒ;Construction ⓓ
ⓑ;Construction Pengambengan Bali ⓔ ⓔ ⓓ Teluk Awang West Nusa
Tenggara ⓐ ⓑ;Construction, ⓔ Construction by Deco Funds for NTB ⓒ;Construction ⓐ;Construction ⓑ;Construction ⓒ;Construction
Kupang East Nusa Tenggaara ⓐ
Bitung North Sulawesi ⓑ;Construction Review Design Kwandang Gorontalo ⓒ;Construction ⓒ; Construction ⓑ;Construction ⓑ;Construction Tual Maluku ⓔ ⓔ Reclamation etc. ⓔ ⓔ ⓓ Ternate North Maluku ⓔ Land Acquisition, ⓔ ⓔ ⓓ Merauke Biak
Papua West Papua
ⓐ
ⓑ;Construction ⓐ
Construction by Deco Funds ⓑ, ⓒ;Construction ⓐ;Construction ⓑ;Construction ⓒ;Construction
Solong West Papua ⓑ

44
Untia/Makassar South Sulawesi ⓐ Construction

45
Table 3.2-4 Progress of ORFP development in target survey areas 2004 2005 2006 2007 2008 2009 2010
Bitung 2002 : Jetty(-1m×149m) Construction
2004 : Apron pavement, Auction Hall, Shade, Water supply, APBN, Lighting etc. through DAC
Review of Design /Deco Fund
Review Master Plan and Engineering Detail Design of Jetty (APBN/DIPA)
Construction (APBN): Apron Pavement for new reclaimed area (4.5 billion). Trestle×185m (14 billion)
2011-2012:
Jetty×150m (27 billion)
Kupang 1977:4.7ha, Jetty 2000: 70 Billion
IDR for Reclamation, Jetty, Auction Hall, etc.
2001: Transferred to the Province
~2005: Jetty (substitute for the development of commercial port)
Study & Detail Design
FAO: Cool Box ×20
Makassar Study & Detail Design
Transferred to Province Development started
Strategic Plan Transferred to Kota
Transferred to Province Construction

46
Nunukan Preparation & FS/Detail Engineering Design; 448mil IDR/APBD Murn
Pile Driving (0.5m×12m, n=61); 863mil IDR, APBD Murni
Reclamation of 50*60m ; 2,373 mil IDR, APBN
Construction works by Nunukan District : Land acquisition 50ha, Access road 1.5km
Reclamation : Deco,
APBN 2,438mil IDR Fishers’ Housing 55unit/Ccross sectoral fund
Pile driving (n=120);1,349mil IDR, APBD Provinsi
Pile driving (n=102) 2,600mil IDR/APBD Provinsi
Quay wall; 2,230mil
IDR/APBN(TP)
Construction works : Pile Driving; n=35etc.,1,463mil IDR, APBD Provinsi
Construction works : Quay wall; 2,700mil IDR, DAK,
Teluk Awang
Preparation & FS/Design
Construction works by Dcon. Fund
Construction works by Dcon. Fund
Construction works Construction works by Task Assistance
Construction works by Task Assistance of District
Ternate 1980-1993: wooden jetty was rebuilt as RC Jetty
1993-1996: T-shape Jetty
2003: Expansion of the Jetty
Rehabilitation & Improvement: New Jetty
Rehabilitation & Improvement
Land acquisition Rehabilitation & Improvement
Rehabilitation & Improvement
Rehabilitation & Improvement
Tual Rehabilitation & Improvement
Rehabilitation & Improvement
Review of Master Plan Detail Design, EIA Land Reclamation
Rehabilitation & Improvement
Rehabilitation & Improvement
Rehabilitation & Improvement
Rehabilitation & Improvement

47
3.3 Issues to be addressed in implementing the ORFP development plan
(1) Characteristics of ORFP development plan
The ORFP Development Master Plan, formed in 2004, provides a brief description of current
facilities, fishing catch estimation, fishing port classification, sorting port type as either a feeder or
export port, and a short summery of the development direction of the 25 selected ORFP development
sites. In the case of export fishing ports, 6,000GT-class fishing boats or container ships are expected to
enter. Other ORFPs are determined as feeder ports, which are expected to be capable of dealing with
100-200GT-class fishing boats and carrying boats.
The fishing port classification is determined by the maximum allowable catch based on
estimated fishery resources in the WPP fisheries management area, which each fishing port shares.
Then the size of the facilities and improvement measures are determined in accordance with this
fishing port classification. Thus, the planned fishing port class and development scale tend to overtake
the current demand and activities.
The specific plan for each site then undergoes detailed design and examination work, so that the
specific image of each ORFP could not be seen in the master plan. The examination of the detailed
plans has started at all eight sites selected by Phase-I activities.
(2) Review on the ORFP development plan
1) Objective of ORFP development Master Plan
i) To optimize fishery resources exploitation
Assuming that the fishery resources estimation in each WPP fisheries management area is
correct, there might be an enough room in the underutilized resources in the outer ring area. And it is
considered that the ORFP policy to utilize these resources in an optimum manner through the
development of ORFP with resources management and fisheries management could attain some
positive results. According to the strategic plan of DKP11, the fishing catch is expected to increase at a
rate of 0.55% per year from 2005 to 2009. In this regard, the reduction of fishing catch caused by
attempts to halt over-fishing might be counterbalanced by IUU repression measures and utilization of
underutilized resources. Thus, the 0.55% increasing rate would be considered as a realistic target.
On the other hand, information quality for fishery resources conditions at present is not capable
of producing collective estimates of fishery resources. Therefore, intensifying resource surveillance
and upgrading data/information such as fishing catch and CPUE, would be needed in parallel with
ORFP measures. Here, ORFP is expected to play the role of fishery information center. For that
purpose, measures to let all the fishing boats and fishers use the fishing ports and provide actual
11 RENCANA STRATEGIS PEMBANGUNAN KELAUTAN DAN PERIKANAN TAHUN 2005 – 2009, DKP, 2005.
48
fishing data have to be implemented.
The management process for fishing catch and fishery resources has been introduced through
the fishing license system. Here, the fishing license is issued by fishing operation area that is from
shore to less than 4 miles, 4-12 miles, 12 miles to EEZ, and EEZ. However, at present, it seems that
the system has not progressed to the stage of managing license issuance through feedback from the
information of fishing catch and current status of resources. Thus, it is important for the ORFP
development to work together with related policies and measures on resource and fisheries
management
ii) Reducing IUU and catch losses
Newly constructed fishing ports can help with the utilization of patrol boats in the outer ring
territory. In order to control IUU fishing, it would be important to enhance the surveillance system and
patrol boats in parallel.
iii) Creating new growth
The ORFP Development Master Plan aims to enhance regional improvements through
accommodating large-scale foreign fishing vessels. However, many of the selected sites have not
accommodated foreign ships before, and current demands from foreign ships in each territory are not
investigated in the master plan. Actually, the local fishers and their fishing boats might be the main
users in the early stages of development. At this point, it is important to investigate actual demands
from fishers and fishing boats in the following detailed design and planning stage.
iv) International standard facilities
Even in export fishing ports in ORFP, only a limited number of sites have accommodated large
carry vessels before. Therefore, the actual development plan and detailed design would be best to
consider private sector trends and conditions in each location, and not be trapped into standardized,
uniform measures for every site.
Today, major commercial ports in each region have already started container services which
correspond to the national container network system. Thus, it is practical to use this service for the
transportation of fishery products. On the other hand, as fishing vessels and carry boats of 100-200GT
are actively operating in Indonesian waters, it is reasonable to consider improving fishing port
facilities to accommodate these vessels considering their current status and trend.
In most of the fishing ports, the ice and fresh water supply does not fully satisfy the demand.
Today, the fish processing industry requires international standard quality and hygiene for fish material
and its treatment. Thus, improvement in the ice/water supply and hygiene system in fishing ports is
increasing in importance.
2) Selection of ORFP development site
49
The study report of ORFP Master Plan does not describe the process of how it selected 25 sites.
However, the selected 25 sites are spread out to the outer ring territory at appropriate intervals. It is
considered that most of them are major bases in each region, or that they are expected to have
potential to be major bases. Thus, from the point of view of dispersing fishing activity throughout the
outer ring territory, this site distribution would be effective.
The budget amount for the 25 sites is estimated as 6,500 billion IDR, excluding Untia/Makassar.
However, progress at the 8 sites selected for phase-I development has been delayed owing to the lack
of funding. In fact, BAPPENAS is expecting 900 billion IDR from foreign funding to complete this
project. Thus, it is considered that the scale of this project means the government of Indonesia cannot
complete it within its own budget and within the allotted planning period.
3) Review of ORFP development plan
i) Future estimation of fishing catch
At each site, the future fishing catch is roughly estimated. However, the fishing catch data used
in the ORFP Master Plan is not good for a precise estimation. In addition, in the estimation process
using liner prediction analysis, a large gust change is not excluded. Thus, it should be noted that this
fishing catch estimation has a fair degree of deviation. Since this fishing catch factor is used for
determining improvements in fish landing facilities, it is important to investigate the actual condition
and expected fishing catch at the next stage of development.
ii) Fishing port classification and scale of facilities
In the ORFP Master Plan, the fishing port classification and the size of the facilities to be
improved are based on the total allowable catch of the WPP fisheries management area, which each
fishing port shares. And the actual demands and conditions of each site, such as resources, catch,
fishing boats, fishers, market, fish processing and distribution are not particularly investigated. Thus,
there is the need to investigate these aspects in the following detailed design and planning works.
iii) Users of fishing port
Since facility improvement planning is carried out in the above manner, the actual users of each
fishing port are not clearly considered in the Master Plan. Especially in the case of newly constructed
fishing ports, problems might occur in their reasonableness. Furthermore, demarcation for utilization,
users and objectives against neighboring PPI is not clear. Thus, it is of concern that the objectives,
functions and stakeholders might overlap between neighboring fishing ports. On the other hand, in the
Bitung fishing port plan, the actual fishers and fishing boats, which are expected to use the fishing port,
are investigated in the detailed design taking into consideration the previous detailed design which was
carried out by JICA.
50
4) Distribution of fishery products toward the outside of the region
The oceanic fishing ports (PPS) and archipelago fishing ports (PPN) are expected to help
transfer fishing catch and processed fish activities toward the outside of the region. In terms of fishery
product distribution toward the outer region, it is important to have a reefer container service to be
able to accommodate large carry vessels in the fishing ports, and to be able to use airline services. In
addition, access roads to commercial ports, which have regular container services, airports and major
industrial areas for fish processing are also needed.
Today, in Indonesia, a regular container service network spread throughout the country and
connects major commercial ports in each region, even in the outer ring area. This has been developed
through the improvement of container handling facilities in commercial ports by the Indonesian
government. Therefore, fishery products are already shipped by reefer containers from the eastern
outer ring territories. The regular container service network in the eastern area starts from Surabaya to
Makassar, and then spreads to the eastern territories along some major lines. Makassar is playing the
role of a major transit port to the eastern area. The container export network starts mainly from
Surabaya and partly from Makassar, then to Singapore and Hong Kong, working as an international
hub in Asian waters. Then containers are transported to Japan, EU, the USA and other countries.
Recently, in huge consuming regions like Jakarta and Bali, and southeastern countries, the
demand for live fish has been increasing. These live fish are mainly transported by air. Thus, the air
cargo service for fishery products would increase in importance.
5) Budget and project implementation
In some fishing ports the development work has been delayed owing to the lack of funding. For
example, in certain sites, the annual budget is not enough for the construction of the main facilities
such as jetties, so only small back-up facilities could be developed; the development scale and total
budget is so large that it will take many years to complete; to save on costs, construction has been
carried out without consulting expert engineers and as a result critical problems have occurred at the
facilities. In addition, repeated jurisdiction-related changes might cause mix ups and the crossing of
paths during the implementation of the project.
Thus, a lot of attention is needed as regards the budget and implementation policies to carry out
the project.
6) Expected benefits from ORFP development
It is expected that benefits will appear as a result of the development of outer ring fishing ports.
The possible benefits are as follows:
i) It is expected that ORFP will become the basis for utilizing fishing catch in the eastern waters of
Indonesia, which exceeds local consumption, and to provide the catch to huge consuming
51
regions in western Indonesia.
ii) In newly constructed sites, the development is expected to provide a consolidated base for
landing, handling, preparing and cold storage, thus becoming a regional center for fishery and
shipping bases for the outer region. As for small-scale fishers, their catch is usually bought
directly by a middleman once onshore. The development is expected to defuse this one-sided
market feature by enabling the fishers to sell their catch in the fishing port market.
iii) To meet the quality requirements from processors by handling the fishing catch under hygienic
conditions in the fishing port.
iv) MMAF has already developed an Internet system to collect fish catch data from every fishing
port. However, in many sites, fishing ports are not capable of dealing with fishers’ and fishing
boat’s demands, so some are transshipping catches to large boats offshore and some are landing
and selling to the middleman directly. This situation makes it difficult to collect actual fishing
catch data. Outer ring fishing ports could improve this situation and become a basis for more
accurate fishing catch data.
v) To raise fishery information accuracy and simultaneously enhance fishery resources
management through license issuance to fishers and fishing boats.
vi) Outer ring fishing ports could be the base for fishing activities in border areas and play an
important role in border security and prevention of IUU by other countries.
However, in order to achieve these benefits, the following are necessary:
- Each development plan should take into account local demands and various site conditions.
- Related policies and measures should be implemented together with ORFP development.
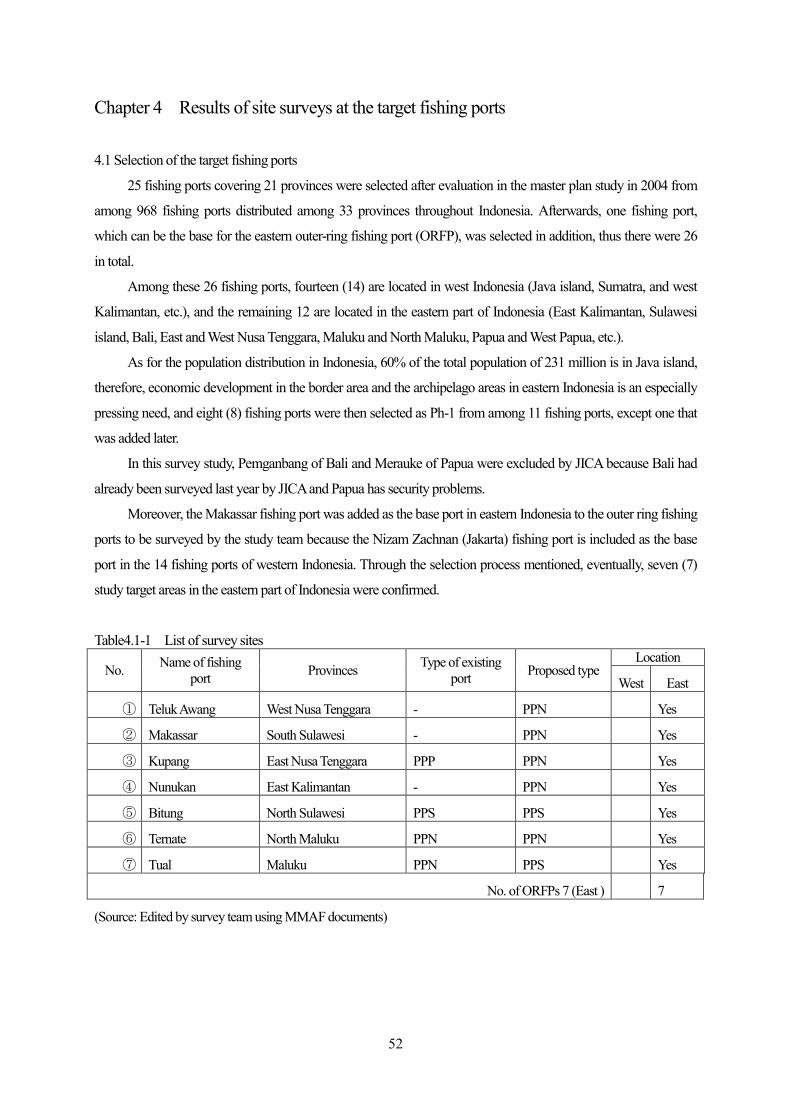
52
Chapter 4 Results of site surveys at the target fishing ports
4.1 Selection of the target fishing ports
25 fishing ports covering 21 provinces were selected after evaluation in the master plan study in 2004 from
among 968 fishing ports distributed among 33 provinces throughout Indonesia. Afterwards, one fishing port,
which can be the base for the eastern outer-ring fishing port (ORFP), was selected in addition, thus there were 26
in total.
Among these 26 fishing ports, fourteen (14) are located in west Indonesia (Java island, Sumatra, and west
Kalimantan, etc.), and the remaining 12 are located in the eastern part of Indonesia (East Kalimantan, Sulawesi
island, Bali, East and West Nusa Tenggara, Maluku and North Maluku, Papua and West Papua, etc.).
As for the population distribution in Indonesia, 60% of the total population of 231 million is in Java island,
therefore, economic development in the border area and the archipelago areas in eastern Indonesia is an especially
pressing need, and eight (8) fishing ports were then selected as Ph-1 from among 11 fishing ports, except one that
was added later.
In this survey study, Pemganbang of Bali and Merauke of Papua were excluded by JICA because Bali had
already been surveyed last year by JICA and Papua has security problems.
Moreover, the Makassar fishing port was added as the base port in eastern Indonesia to the outer ring fishing
ports to be surveyed by the study team because the Nizam Zachnan (Jakarta) fishing port is included as the base
port in the 14 fishing ports of western Indonesia. Through the selection process mentioned, eventually, seven (7)
study target areas in the eastern part of Indonesia were confirmed.
Table4.1-1 List of survey sites
No. Name of fishing port Provinces Type of existing
port Proposed type Location
West East
① Teluk Awang West Nusa Tenggara - PPN Yes
② Makassar South Sulawesi - PPN Yes
③ Kupang East Nusa Tenggara PPP PPN Yes
④ Nunukan East Kalimantan - PPN Yes
⑤ Bitung North Sulawesi PPS PPS Yes
⑥ Ternate North Maluku PPN PPN Yes
⑦ Tual Maluku PPN PPS Yes
No. of ORFPs 7 (East ) 7
(Source: Edited by survey team using MMAF documents)
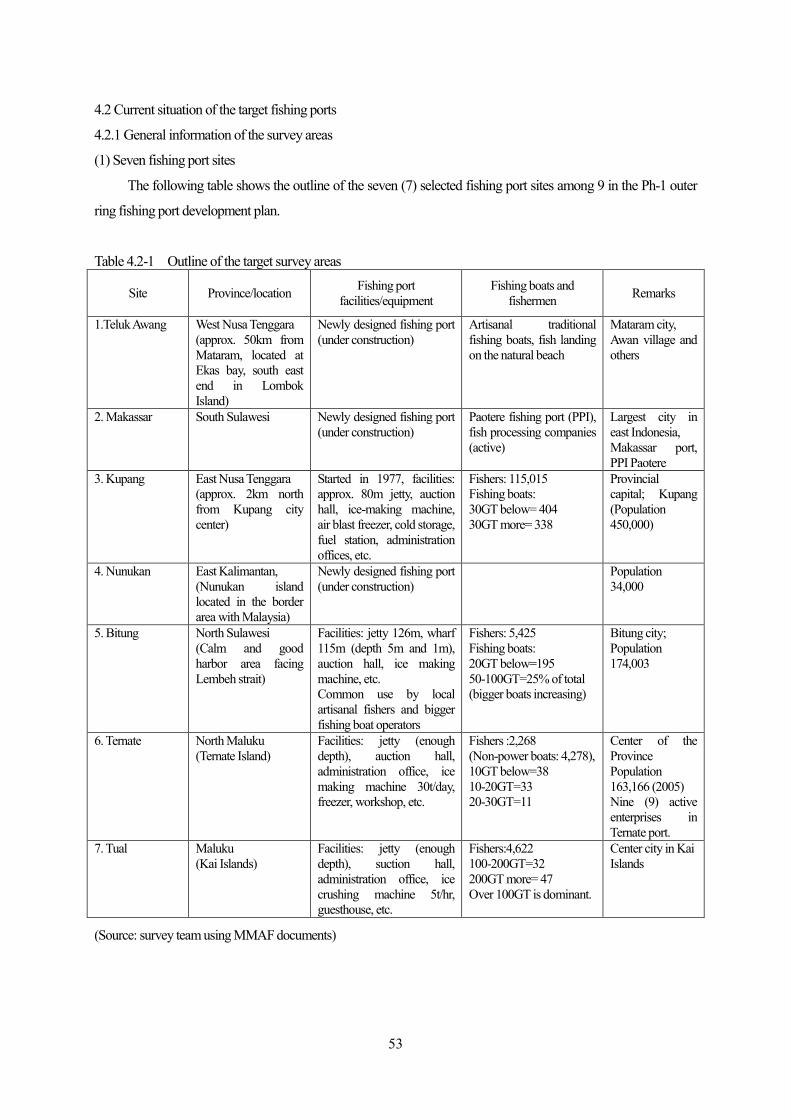
53
4.2 Current situation of the target fishing ports
4.2.1 General information of the survey areas
(1) Seven fishing port sites
The following table shows the outline of the seven (7) selected fishing port sites among 9 in the Ph-1 outer
ring fishing port development plan.
Table 4.2-1 Outline of the target survey areas
Site
Province/location Fishing port facilities/equipment
Fishing boats and fishermen Remarks
1.Teluk Awang West Nusa Tenggara (approx. 50km from Mataram, located at Ekas bay, south east end in Lombok Island)
Newly designed fishing port (under construction)
Artisanal traditional fishing boats, fish landing on the natural beach
Mataram city, Awan village and others
2. Makassar South Sulawesi Newly designed fishing port (under construction)
Paotere fishing port (PPI), fish processing companies (active)
Largest city in east Indonesia, Makassar port, PPI Paotere
3. Kupang East Nusa Tenggara (approx. 2km north from Kupang city center)
Started in 1977, facilities: approx. 80m jetty, auction hall, ice-making machine, air blast freezer, cold storage, fuel station, administration offices, etc.
Fishers: 115,015 Fishing boats: 30GT below= 404 30GT more= 338
Provincial capital; Kupang (Population 450,000)
4. Nunukan East Kalimantan, (Nunukan island located in the border area with Malaysia)
Newly designed fishing port (under construction)
Population 34,000
5. Bitung North Sulawesi (Calm and good harbor area facing Lembeh strait)
Facilities: jetty 126m, wharf 115m (depth 5m and 1m), auction hall, ice making machine, etc. Common use by local artisanal fishers and bigger fishing boat operators
Fishers: 5,425 Fishing boats: 20GT below=195 50-100GT=25% of total (bigger boats increasing)
Bitung city; Population 174,003
6. Ternate North Maluku (Ternate Island)
Facilities: jetty (enough depth), auction hall, administration office, ice making machine 30t/day, freezer, workshop, etc.
Fishers :2,268 (Non-power boats: 4,278), 10GT below=38 10-20GT=33 20-30GT=11
Center of the Province Population 163,166 (2005) Nine (9) active enterprises in Ternate port.
7. Tual Maluku (Kai Islands)
Facilities: jetty (enough depth), suction hall, administration office, ice crushing machine 5t/hr, guesthouse, etc.
Fishers:4,622 100-200GT=32 200GT more= 47 Over 100GT is dominant.
Center city in Kai Islands
(Source: survey team using MMAF documents)

54
(2) Private fishing port facilities
1) Tual
In Tual (North Maluku province), one foreign investment company (PT. Maritim Timur Jaya) owns a large
fishery complex with a quay for large fishing vessels, a processing factory and cold storage. The company owns
140 ha of land in Tual and is conducting fishery business.
Table 4.2-2 Fishing port facilities of the private sector (PT. Maritim Timur Jaya)
Quay 330m×13m, depth of water6~9m
Electric Power Plant 4×1,140kwh
Fuel Tank 500kl×3
Cold Storage for Block Ice 500 tons+700 tons (2 rooms)
Cold Storage 1,500 tons(375 tons×4 rooms)
250 tons×2 rooms
Ice Making Plant 200 tons/day
Processing Factory 2,040m2, Filet Processing, etc., 100 tons/day
Fig. 4.2-1 PT. Maritim Timur Jaya (upper left: http://www.kimi-mtj.com/, upper right: Google Earth, lower photos: Tual City Presentation)
Electric Power Plant Quay and Ice loading plant
Development Plan Mooring facilities & processing factories
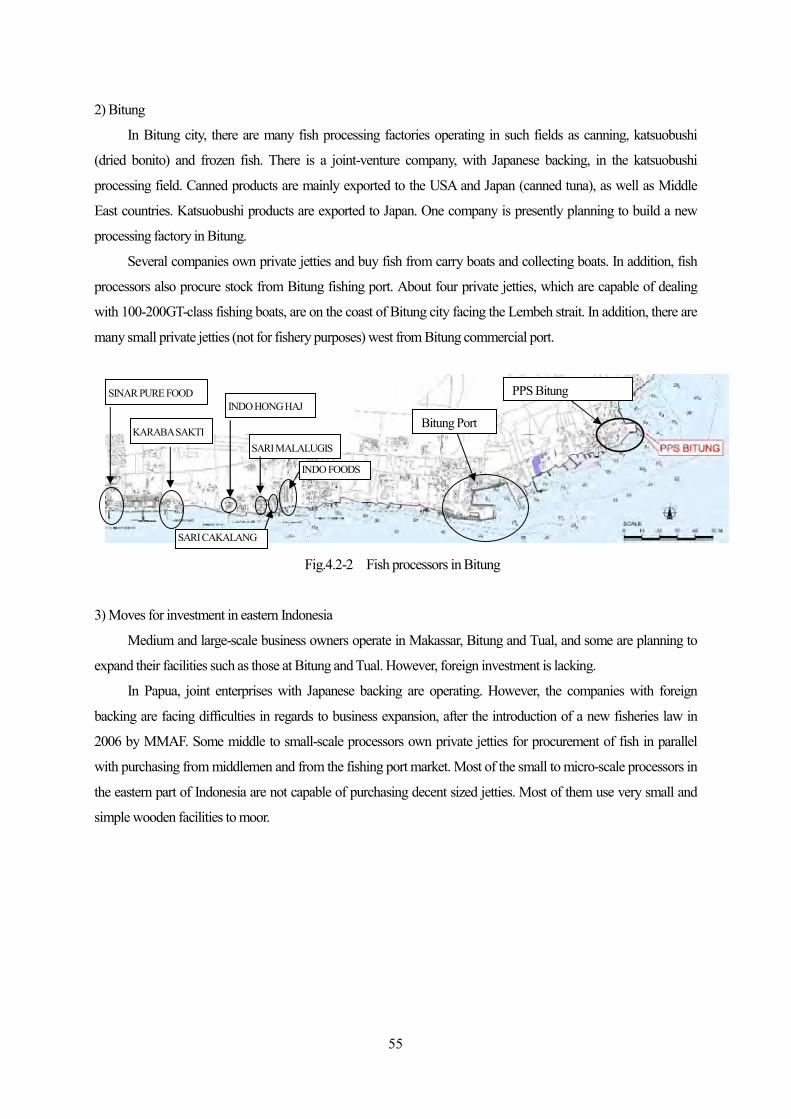
55
2) Bitung
In Bitung city, there are many fish processing factories operating in such fields as canning, katsuobushi
(dried bonito) and frozen fish. There is a joint-venture company, with Japanese backing, in the katsuobushi
processing field. Canned products are mainly exported to the USA and Japan (canned tuna), as well as Middle
East countries. Katsuobushi products are exported to Japan. One company is presently planning to build a new
processing factory in Bitung.
Several companies own private jetties and buy fish from carry boats and collecting boats. In addition, fish
processors also procure stock from Bitung fishing port. About four private jetties, which are capable of dealing
with 100-200GT-class fishing boats, are on the coast of Bitung city facing the Lembeh strait. In addition, there are
many small private jetties (not for fishery purposes) west from Bitung commercial port.
Fig.4.2-2 Fish processors in Bitung
3) Moves for investment in eastern Indonesia
Medium and large-scale business owners operate in Makassar, Bitung and Tual, and some are planning to
expand their facilities such as those at Bitung and Tual. However, foreign investment is lacking.
In Papua, joint enterprises with Japanese backing are operating. However, the companies with foreign
backing are facing difficulties in regards to business expansion, after the introduction of a new fisheries law in
2006 by MMAF. Some middle to small-scale processors own private jetties for procurement of fish in parallel
with purchasing from middlemen and from the fishing port market. Most of the small to micro-scale processors in
the eastern part of Indonesia are not capable of purchasing decent sized jetties. Most of them use very small and
simple wooden facilities to moor.
SINAR PURE FOOD
KARABA SAKTI
INDO HONG HAJ
SARI MALALUGIS
SARI CAKALANG
INDO FOODS
Bitung Port
PPS Bitung

56
4.2.2 Characteristics of the target fishing ports
(1) TELUK AWANG
① Teluk Awang Region
The Teluk Awang Fishing Port is located in Lombok Island and administratively located in Pujut Sub
District, Central Lombok District, West Nusa Tenggara Province. West Nusa Tenggara province is composed of
Lombok Island, Sumbawa Island and 282 smaller islands with a total area of 49,312.19km2. This province is
bordered by the Flores Sea to the north, the Indian Ocean to the south, Lombok Strait and Bali Province to the
west, and Sape Strait and East Nusa Tenggara Province to the east. (Statistics of West Nusa Tenggara Province,
2009)
Based on the data of the National Economic and Social Survey 2008, the population of West Nusa Tenggara
is 4,363,756. Generally, the population in West Nusa Tenggara grows at an average rate of 1.66 % per year. The
data shows that the highest number of people is in East Lombok District (1,068,486), while Central Lombok is the
second (844,105).
Fig. 4.2-3 Administrative map of West Nusa Tenggara (NTB) Province (Edited by survey team)
② Outline of Fisheries in the Province
Fisheries production in West Nusa Tenggara is shown in the following table. In 2008, total fishery
production was 188,368 tons, while capture fisheries totaled 101,746 tons (53%) and aquaculture fisheries
production was 89,389 tons (47%). Fishery production in Central Lombok District was 1,173 tons in 20081. In
capture fisheries, pelagic fish such as sardines, mackerels and Spanish mackerels are the dominant species by
volume.
1 Annual Report of Marine Affairs and Fisheries Service of NTB Province, 2009
Teluk Awang
Mataram
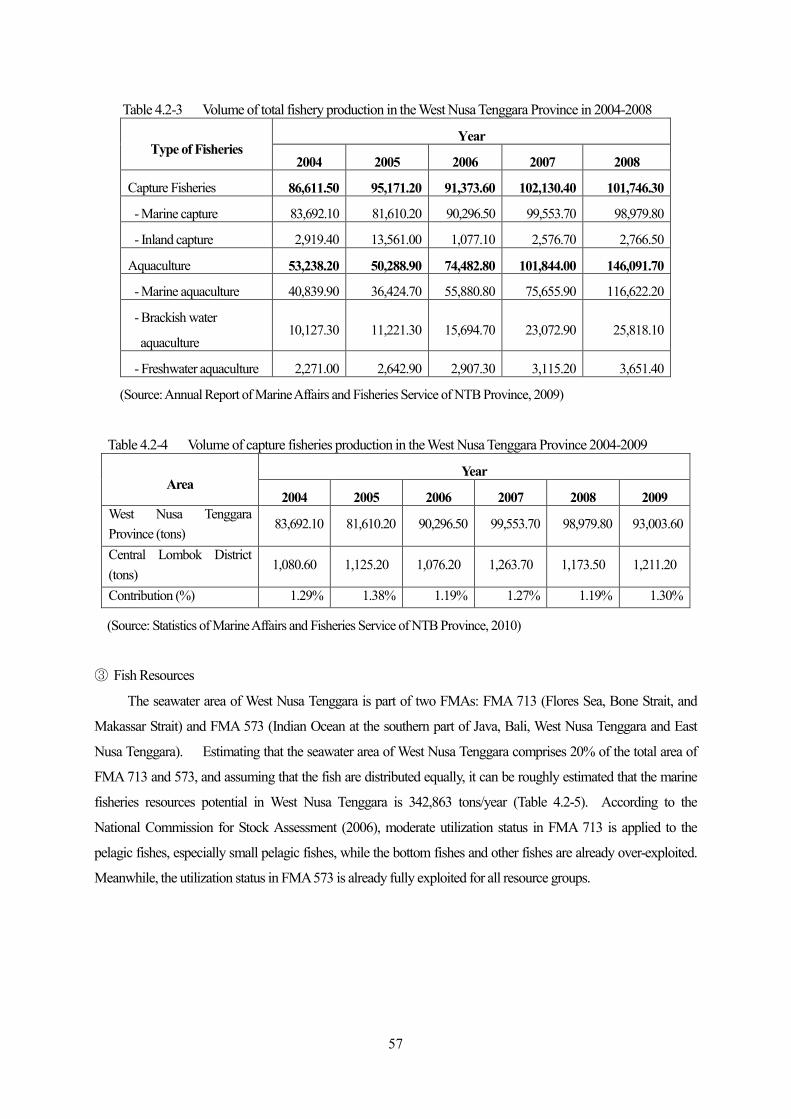
57
Table 4.2-3 Volume of total fishery production in the West Nusa Tenggara Province in 2004-2008
Type of Fisheries Year
2004 2005 2006 2007 2008
Capture Fisheries 86,611.50 95,171.20 91,373.60 102,130.40 101,746.30
- Marine capture 83,692.10 81,610.20 90,296.50 99,553.70 98,979.80
- Inland capture 2,919.40 13,561.00 1,077.10 2,576.70 2,766.50
Aquaculture 53,238.20 50,288.90 74,482.80 101,844.00 146,091.70
- Marine aquaculture 40,839.90 36,424.70 55,880.80 75,655.90 116,622.20
- Brackish water
aquaculture 10,127.30 11,221.30 15,694.70 23,072.90 25,818.10
- Freshwater aquaculture 2,271.00 2,642.90 2,907.30 3,115.20 3,651.40
(Source: Annual Report of Marine Affairs and Fisheries Service of NTB Province, 2009)
Table 4.2-4 Volume of capture fisheries production in the West Nusa Tenggara Province 2004-2009
Area Year
2004 2005 2006 2007 2008 2009 West Nusa Tenggara Province (tons)
83,692.10 81,610.20 90,296.50 99,553.70 98,979.80 93,003.60
Central Lombok District (tons)
1,080.60 1,125.20 1,076.20 1,263.70 1,173.50 1,211.20
Contribution (%) 1.29% 1.38% 1.19% 1.27% 1.19% 1.30%
(Source: Statistics of Marine Affairs and Fisheries Service of NTB Province, 2010)
③ Fish Resources
The seawater area of West Nusa Tenggara is part of two FMAs: FMA 713 (Flores Sea, Bone Strait, and
Makassar Strait) and FMA 573 (Indian Ocean at the southern part of Java, Bali, West Nusa Tenggara and East
Nusa Tenggara). Estimating that the seawater area of West Nusa Tenggara comprises 20% of the total area of
FMA 713 and 573, and assuming that the fish are distributed equally, it can be roughly estimated that the marine
fisheries resources potential in West Nusa Tenggara is 342,863 tons/year (Table 4.2-5). According to the
National Commission for Stock Assessment (2006), moderate utilization status in FMA 713 is applied to the
pelagic fishes, especially small pelagic fishes, while the bottom fishes and other fishes are already over-exploited.
Meanwhile, the utilization status in FMA 573 is already fully exploited for all resource groups.

58
Table 4.2-5 Estimation of fishery resource potentials in the West Nusa Tenggara
Fisheries Resources Group
Fisheries Resource Potential (tons/year) Total
Estimated Fisheries Resource Potential
FMA 713 FMA 573 20% x Total (tons/year)
Large pelagic 193,600 193,130 386,730 77,346
Small pelagic 605,440 263,285 868,725 173,745
Bottom fishes 333,350 67,565 400,915 80,183
Others 43,480 14,465 57,945 11,589
Total 1,175,870 538,445 1,714,315 342,863
(Source: National Commission for Stock Assessment)
④ Summary of Fisheries sector
The most dominant types of fishing gear in NTB are the hand line with FAD (Fish Aggregating Devices),
troll line, pole and line, purse seine, boat seine, lift net, and set bottom long line, etc. While the most dominant
types of fishing gear in Teluk Awang are the hand line, troll line, gill net and portable trap, etc.
The total number of fishing boats in NTB province is 19,264; out-board motor boats make up 58%,
non-powered boats 26%, and less than 10GT inboard motor boats 16%. Within Central Lombok District, there
are 788 fishing boats; outboard motor boats make up 76% of the total and inboard motor boats only 7%. It is said
that the modernization of fishing boats is not proceeding2. Since Teluk Awang is a traditional small-scale fishing
village, most of the fishing boats, 145 in total, are small sampan-type wooden boats. However, some fishers are
starting to upgrade their boats to FRP boats.
Table 4.2-6 Number of fishing boats by size in the West Nusa Tenggara Province and Central Lombok District,
2009 Type of Vessel West Nusa Tenggara Central Lombok
Total 19,264 788
Non-powered boat
Sub total 4,995 184 Jukung 3,177 13
Board boat
Small 1,306 81 Medium 461 90 Large 51 -
Outboard motor boat 11,132 597
Inboard motor boat
Sub total 3,137 7
Vessel size
< 5 GT 2,096 3 5-10 GT 896 4
10-20 GT 145 - 20-30 GT - - 30-50 GT - -
(Source: Statistics of Marine Affairs and Fisheries Service of NTB Province, 2010)
2 Statistics of Marine Affairs and Fisheries Service of NTB Province
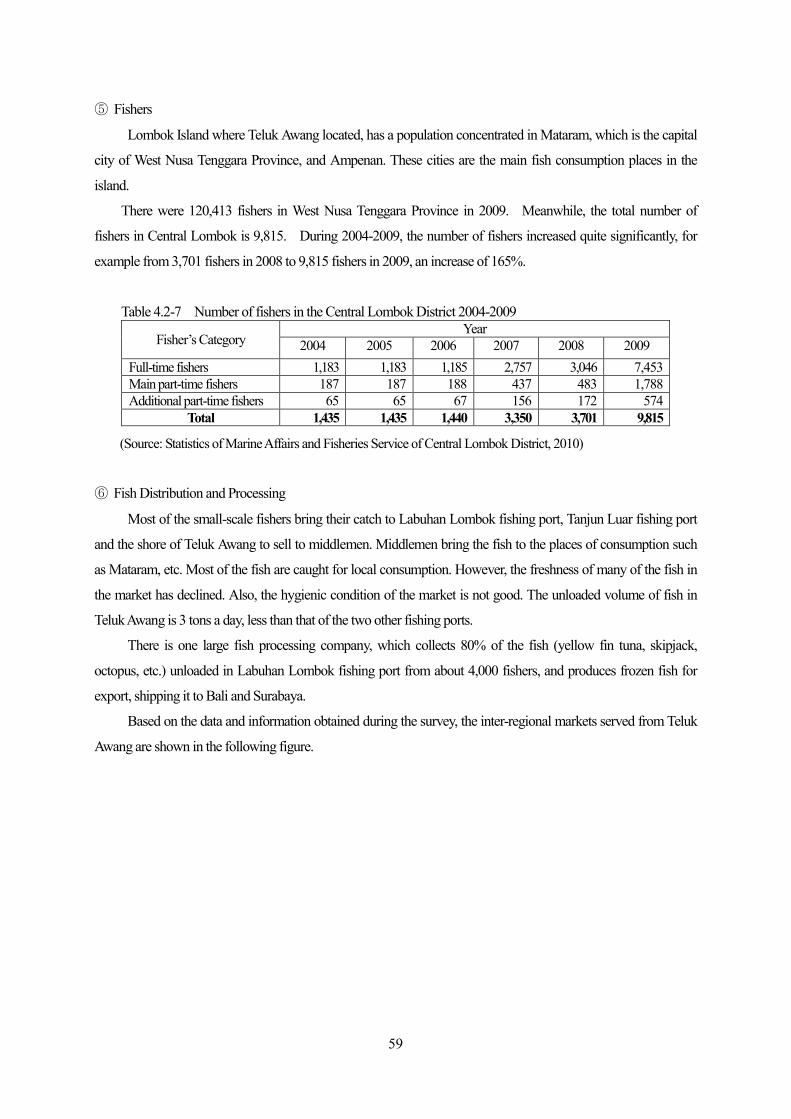
59
⑤ Fishers
Lombok Island where Teluk Awang located, has a population concentrated in Mataram, which is the capital
city of West Nusa Tenggara Province, and Ampenan. These cities are the main fish consumption places in the
island.
There were 120,413 fishers in West Nusa Tenggara Province in 2009. Meanwhile, the total number of
fishers in Central Lombok is 9,815. During 2004-2009, the number of fishers increased quite significantly, for
example from 3,701 fishers in 2008 to 9,815 fishers in 2009, an increase of 165%.
Table 4.2-7 Number of fishers in the Central Lombok District 2004-2009
Fisher’s Category Year
2004 2005 2006 2007 2008 2009 Full-time fishers 1,183 1,183 1,185 2,757 3,046 7,453 Main part-time fishers 187 187 188 437 483 1,788 Additional part-time fishers 65 65 67 156 172 574
Total 1,435 1,435 1,440 3,350 3,701 9,815
(Source: Statistics of Marine Affairs and Fisheries Service of Central Lombok District, 2010)
⑥ Fish Distribution and Processing
Most of the small-scale fishers bring their catch to Labuhan Lombok fishing port, Tanjun Luar fishing port
and the shore of Teluk Awang to sell to middlemen. Middlemen bring the fish to the places of consumption such
as Mataram, etc. Most of the fish are caught for local consumption. However, the freshness of many of the fish in
the market has declined. Also, the hygienic condition of the market is not good. The unloaded volume of fish in
Teluk Awang is 3 tons a day, less than that of the two other fishing ports.
There is one large fish processing company, which collects 80% of the fish (yellow fin tuna, skipjack,
octopus, etc.) unloaded in Labuhan Lombok fishing port from about 4,000 fishers, and produces frozen fish for
export, shipping it to Bali and Surabaya.
Based on the data and information obtained during the survey, the inter-regional markets served from Teluk
Awang are shown in the following figure.
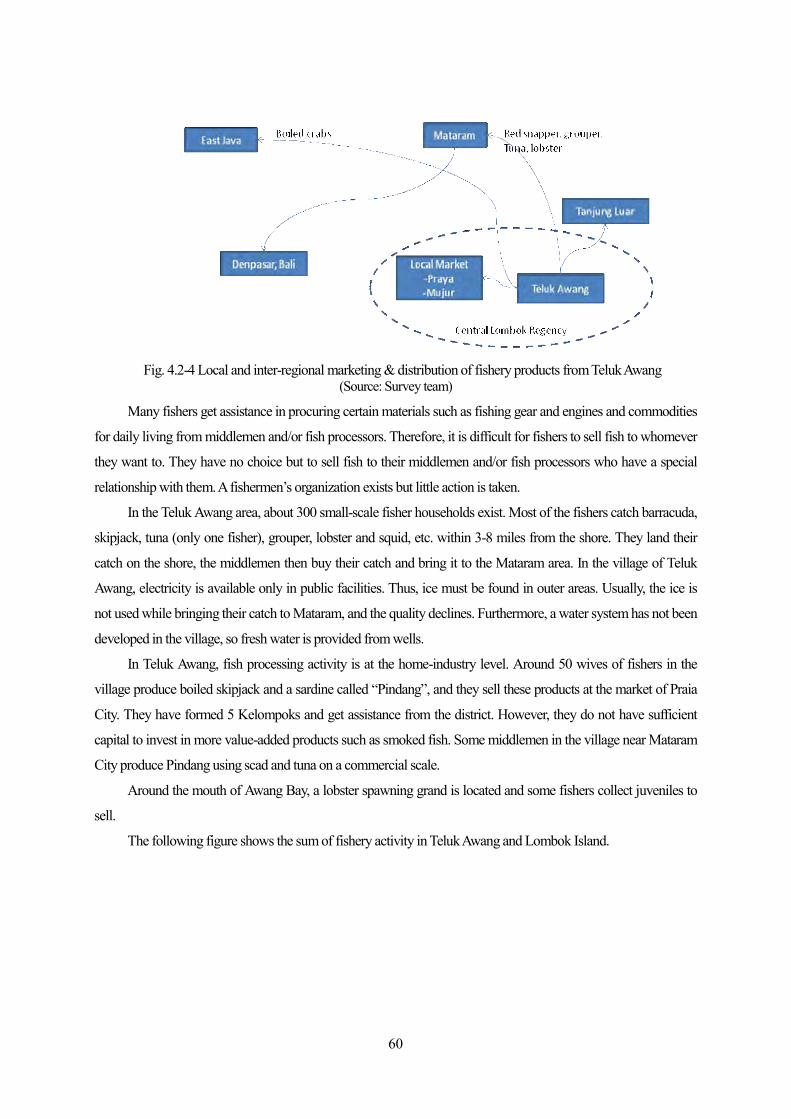
60
Fig. 4.2-4 Local and inter-regional marketing & distribution of fishery products from Teluk Awang (Source: Survey team)
Many fishers get assistance in procuring certain materials such as fishing gear and engines and commodities
for daily living from middlemen and/or fish processors. Therefore, it is difficult for fishers to sell fish to whomever
they want to. They have no choice but to sell fish to their middlemen and/or fish processors who have a special
relationship with them. A fishermen’s organization exists but little action is taken.
In the Teluk Awang area, about 300 small-scale fisher households exist. Most of the fishers catch barracuda,
skipjack, tuna (only one fisher), grouper, lobster and squid, etc. within 3-8 miles from the shore. They land their
catch on the shore, the middlemen then buy their catch and bring it to the Mataram area. In the village of Teluk
Awang, electricity is available only in public facilities. Thus, ice must be found in outer areas. Usually, the ice is
not used while bringing their catch to Mataram, and the quality declines. Furthermore, a water system has not been
developed in the village, so fresh water is provided from wells.
In Teluk Awang, fish processing activity is at the home-industry level. Around 50 wives of fishers in the
village produce boiled skipjack and a sardine called “Pindang”, and they sell these products at the market of Praia
City. They have formed 5 Kelompoks and get assistance from the district. However, they do not have sufficient
capital to invest in more value-added products such as smoked fish. Some middlemen in the village near Mataram
City produce Pindang using scad and tuna on a commercial scale.
Around the mouth of Awang Bay, a lobster spawning grand is located and some fishers collect juveniles to
sell.
The following figure shows the sum of fishery activity in Teluk Awang and Lombok Island.

61
Fig.4.2-5 Fisheries activities around Teluk Awang (Source: Survey team)
PPP. Labuhan Lombok 200boats (<10GT) 2,900ton/year
Damaged two bridges
PP. Teluk Awang
Tuna(fresh)
Fish Processer Buys 80% of catch
Road security
Waiting for road construction (12.5km)
Intl. airport under construction
PPI. Tanjung Luar 100boats(<5GT) 4,000ton/year
Electricity
Bari
Fishing ground is only within3~ 8 miles offshore (small boats only)
Block Ice
Open Market
Market in the Mataram City
Java (Banyuwangi?)
frozen: Skipjack, Tuna etc to Surabaya
80% of catch from Sulawesi (mainly) & Kalimantan
shark small pelagic, demarsal
Catch from Indian Ocean is expected PPN. Teluk Awang
PPI. Labuhan Lombok
Airport

62
⑦ Fishing Port Development
Teluk Awang fishing port is locating in the southeast part of Lombok Island, facing Awang Bay, which is
located on the south side of Ekas Bay, about 30km south from the capital city, Praya, and 65km west from
Mataram city.
Originally, there were no fishing port facilities in Teluk Awang; this is a new fishing port development. The
following figure shows the development plan for PPN Teluk Awang.
In 2004, the detail design for PPN Teluk Awang was carried out and construction work started in 2005. In
2006 and 2007, development work was carried out under the control of the provincial office, then it was handed
over to the district (kabupaten) in 2008. The main facilities are reclaimed land (6ha) and the revetment, the main
jetty (length: 145m + 205m, depth: 3m), a sub jetty for fuel and small boats, auction hall, meeting hall, and
accommodation. The following table shows the current completed facilities.
Table 4.2-8 Planned facilities and infrastructure in PPN Teluk Awang, 2009 No Facilities Size Remarks
1 Port Area 60,000 m2 Reclamation of sea area, planned to be 90,000 m2
2 Trestle 301 m2 To be built in 2005 3 Tallud/Revetment with rock pile m To be built in 2005 - 2009 4 PPN Administrator Office 240 m2 To be built in 2009 5 Fisher’s Meeting Room 120 m2 To be built in 2009 6 Gas Station / Fuel Depot 120 m2 To be built in 2007 7 Gateway m2 To be built in 2009 8 Wall Fence m To be built in 2009 9 Guard Post 18 m2 To be built in 2009 10 Net Storage Place 550 m2 To be built in 2009
(Source: PPN Teluk Awang Annual Report, 2009)
The budget is from the government as APBN. According to the detail design, 23 billion IDR is required
to complete the planned works, 31% of which has already been completed. The budget for 2010 work is 3.0
billion IDR, but it’s not enough for the construction of the main jetty, which requires 25 billion IDR to build. Thus,
the completion of work on the revetment and other small-scale projects are planned to be carried out in 2010. The
following table shows the estimated cost of this fishing port development project.
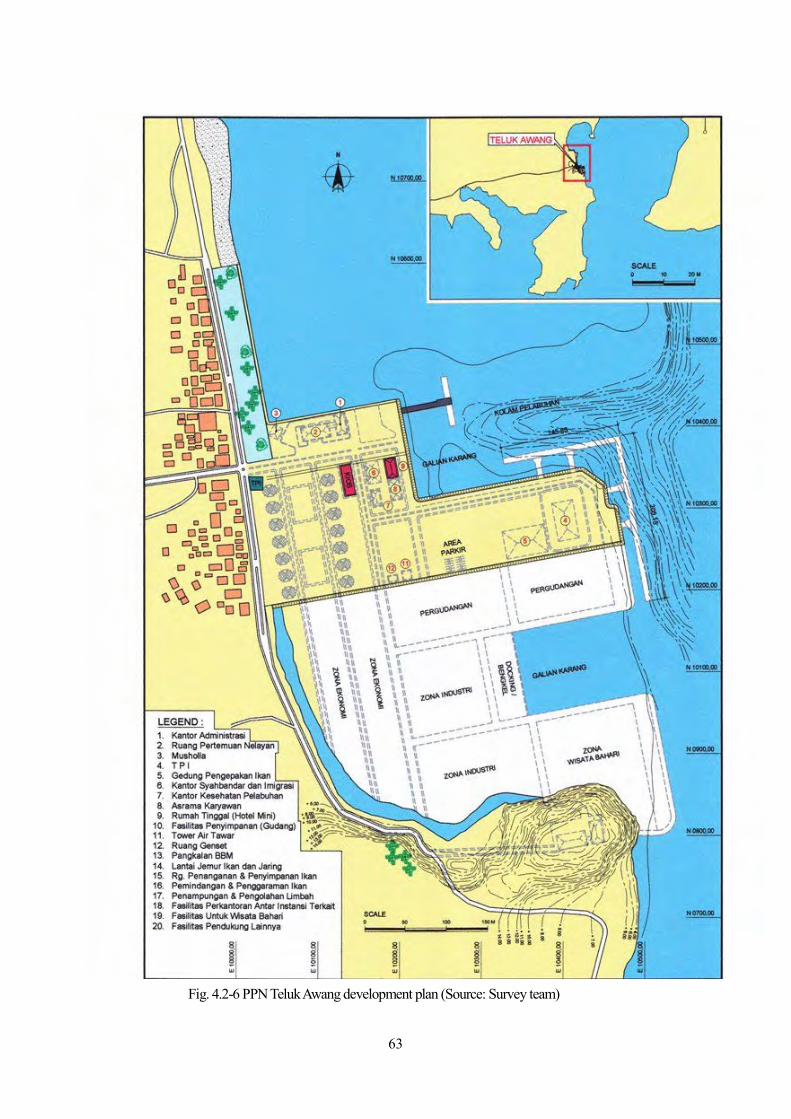
63
Fig. 4.2-6 PPN Teluk Awang development plan (Source: Survey team)

64
Table 4.2-9 Teluk Awang fishing port development cost
Annual Development Plan Cost (IDR)
Phase-1(2005-2012)Total Cost 49,825,478,000 2005 3,537,000,000 Access road, Revetment (10,000m2), Trestle Consulting
2006 4,000,000,000 Land reclamation (10,000m2), Revetment (land: 26,250m2), Fece Consulting
2007 3,660,000,000 Land reclamation (26,250m2, Revetment (6,300m2) Consulting, Project organizer
2008 3,744,831,000 Land reclamation, Revetment (10,800m2), South area land reclamation (16,259m2) Consulting
2009 6,500,000,000 Land reclamation (27,091m2), Revetment (6,650m2), Facilities: Gate, Guard post, Fence Administration office, Meeting hall, Working space Review design of Trestle and Jetty , Consulting, Project organizer
2010 2,000,000,000 Revetment (south area), Land reclamation (7,830m2), Consulting, Project organizer
2011 12,500,000,000 Superstructure of trestle (130m2), Superstructure of jetty (1,062m2), etc 2012 13,883,647,000 Superstructure of trestle (130m2), Superstructure of jetty (874m2), etc. Facilities: kiosk (180m2), Fishers’ rest stop (300m2), Work shop (80m2), Fuel supply, Ice factory, Cold storage (36m2), Sports field (400m2), paved road (5,326.99m2), etc.
Phase-1 (2013-2014) Total Cost 66,760,014,000
2013 32,339,732,000 Sheet piling, Land reclamation (90,000m2), Fence Consulting, Project organizer
2014 34,420,282,000 Superstructure of trestle (120m2), Quay (1,600m2) Facilities: Processing plant, Fish handling space, Paved road, Parking (8,000m2), Navigation office, Administration office, Street light, Sports ground, Consulting, Project organizer

65
(2) UNTIA (MAKASSAR)
① Makassar Region
The Untia Fishing Port site is located 10 km north from the city of Makassar, which is the capital of South
Sulawesi province. The city of Makassar is the largest city east from Surabaya and is a center of transportation and
logistics. The population of Makassar is about 1,130 thousand. Untia is located near Desa Nelayan, south west
from the Kima area, which is the industrial complex of the city.
Fig. 4.2-7 Location of PPN Untia (Source: Edited by Study team)
② Fishery of South Sulawesi
The fisheries subsector in South Sulawesi is dominated by marine capture fisheries. The most dominant fish
are tuna, skipjack, baby tuna, and several pelagic fish. The regions that contributed the most to fish production in
South Sulawesi are Bone, Bulukumba, Sinjai, Palopo and Makassar. Generally, the fish catches landed in South
Sulawesi are consumed locally, while the rest is distributed through the inter regional and export marketing
channel.
Fish production in Makassar is focused in two marketing locations: PPI Paotere and PPI Rajawali. However,
those fishing port facilities are aged, lacking in sanitation, and do not have enough scale for current activities. The
main fishing ground is Makassar Strait (FMA:WPP713). The fishing catch in Makassar City was about 16,000
tons in 2009. In Makassar, there has been a notable increase recently in fish processing companies and middle to
small-scale processors.
Paotere Fishing Port is managed by the Makassar City and Fishery Cooperative. However, the cooperative
is an organization of profit-oriented businessmen and the main members are middlemen. About 1,000 fishers live
in 13 islands located offshore of Makassar City and about 420 fishers live in a village located near Paotere Fishing
Port. Their main fishing methods are gill net, purse-seine and bagan fishing.
In addition, the state-managed shipyard, which is capable of handling cargo ships and ferry boats as well as
Untia/Makassar

66
fishing boats, is operating in Makassar.
Table 4.2-10 Marine capture fisheries production in volume and value 2004 – 2008 Year Volume (Ton) Proportion (%) Value (x 1,000IDR.) Proportion (%) 2004 2005 2006 2007 2008
13,589.1 20,337.0 15,559.6 15,670.6 15,827.5
33.18
30.70 0.71 0.99
25,044.638 45,957.965 47,193.740 71,768.105 88,643.564
45.51 2.62
34.24 19.04
(Source: Strategic Planning 2010 -2014; Marine, Fisheries, and Husbandry Agency of Makassar)
③ Characteristics of Fisheries sector
Most of the fishers are small-scale fishers. No small-scale fishers unload fish directly at the fishing port. The
majority of the fishers get assistance from middlemen and they have difficulty in changing their dependency on
these middlemen. Many fishers entrust fish collectors to sell the fish. Thus, since there are many intermediate
stakeholders in fish distribution between fishers and end consumers, the income of fishers is low and their quality
of daily life is deemed to be bad in general. Many fish collectors have debts with boat owners and their business
scale seems to be small.
Generally, the vessels carrying fish to Makassar are not fishing boats, but collecting boats (perahu jolor) that
collect fish from other islands or at sea. The dominant types of fishing gear in Makassar are varied, such as
gillnet, long line, hand line and purse seine. These types of gear are operated within relatively small vessels.
The abovementioned types of gear generally do not have a significant contribution to fish production in PPI
Paotere. The fish landed in PPI Paotere is mostly (80%) obtained from purse seine fishers from East Kalimantan,
South Sulawesi and the adjacent sea of Surabaya. Types of fish landed in PPI Paotere are scad, baby tuna,
snapper, and grouper.
The quantity of the fish unloaded is 30-40 tons a day. If the fish is unsold on the day of unloading, it is put
on sale the next day at a cheaper price. The remains are processed as feed for poultry farming and therefore there is
no fish waste.
④ Fish Distribution and Processing
The city of Makassar is a logistics center for eastern Indonesia. The port in Makassar has a container
handling yard and a core airport, making the terminal extremely competitive. Recently, many fishery products
from eastern Indonesia are transported by container services to Surabaya and Jakarta via Makassar, contributing to
the expansion of the container network in eastern Indonesia.
The distribution of fish is dealt with in the traditional OTC (over the counter) manner, led by middlemen,
while the fishers remain in a vulnerable position. The fish distribution structure in Makassar is not simple as there
are complications for stakeholders from fishers, fish collectors (Jolor), middlemen, retailers, and fish processors.
However, fish processors regularly quote from a fish price list.

67
There are varieties of fish processors from large-scale processing companies, which supply fishery products
to overseas and/or domestic big markets, to home industries, which produce mainly dried and salted products.
There are about 30 cold storage facilities and almost the same number of fish exporters in Makassar. However,
only 50% of the capacity of their cold storage is operating because of the lack of materials.
Table 4.2-11 Fish processing units based on cold storage ownership in Makassar 2009 No Company Name Capacity
( Tons ) Type of Product Market Destination
1 PT. Citra Arisco Mina 200 Frozen shrimp Japan, Thailand, Taiwan, the Netherlands
2 PT. South Suco 750 Frozen shrimp The Netherlands, Thailand, the USA, Italy, China, Germany, South Korea, Belgium, Vietnam, Hong Kong
3 PT. Wahyu Pradana Bina Mulia
100 Frozen shrimp Japan, Thailand, the Netherlands, France, Belgium
4 PT. Multi Monodon Indonesia 150 Frozen shrimp Japan, France, Taiwan, China 5 PT. Mitra Kartika Sejati 300 Frozen shrimp Japan, the USA, the Netherlands,
Thailand 6 PT. Sinto Mas Mulia 100 Frozen shrimp Hong Kong 7 PT. Perikanan Samudra Besar 50 Fresh/Frozen Fish Singapore, Taiwan, Korea, Japan 8 PT. Dataran Bosowa 100 Frozen shrimp Japan 9 PT. Amal Jaya Puskopal 50 Frozen Fish Japan, Korea 10 PT. Prasadasanya Mukti 50 Frozen Tuna Singapore, Hong Kong, Japan, the
USA 11 PT. Sinar Graha 50 Frozen Fish Singapore, Hong Kong 12 PT. Marina Seafood Prosesor 40 Fresh/Frozen Fish Australia 13 CV. Chen Wood Fishery 50 Fresh/Frozen
Fish/Frozen shrimp Korea, Singapore, Japan
14 PT. Bogatama Marinusa 300 Fresh/Frozen Fish/Frozen shrimp
Japan
15 PT. Nuansa Cipta Magello 50 Canned Crabs Makassar 16 PT. Mega Pratama Indo 100 Fresh/Frozen Tuna Japan 17 PT. Prima Indo Tuna 100 Fresh/Frozen Tuna Japan 18 PT. Prima Bahari Inti Lestari 150 Fresh/Frozen Fish Singapore 19 PT. Parlevliet Praba Seafood 50 Fresh/Frozen Tuna Japan 20 PT. Hacho Bumi Abadi 200 Frozen shrimp Korea 21 PT. Maju Indah Jaya Marine 100 Frozen shrimp Japan 22 PT. Sea Fresh Internasional 100 Fresh/Frozen Tuna Japan
(Source: Strategic Planning 2010 -2014; Marine, Fisheries, and Husbandry Agency of Makassar)
Most of the fish processors are located in the KIMA industrial area, which is located in a suburb of
Makassar, near Untia. Fish and shrimp processors buy materials unloaded at Paotere Fishing Port through
large-scale middlemen, and ship the products to Surabaya or Jakarta by reefer containers. These products are
exported to the USA, EU and Japan via Singapore. These exporting processors acquire international hygiene
standards such as HACCP. The quality of the fish catch is mainly controlled by the usage of ice.
There are also live fish traders who send the fish to Hong Kong by air. Some fresh yellowfin tuna are
transported by air from Bitung, etc. to Makassar.

68
Processors who make dried and salted fish buy numerous fish species for their raw materials, which takes
around 3 days after unloading at Paotere Fishing Port, at cheap prices and sell the final products at higher prices.
The following figure shows the sum of fisheries activity in the Makassar area.
Fig. 4.2-8 Fisheries activities in Makassar (Source: Survey team)
PPN. Untia
PPI. Paotere
Rajawari Fish Market
Kima Industrial area
Tuna from Bitung by air
Cultured shrimp
From Tual, Bitung
Container to Sby & Jkt
Port of Makassar
Carry boat from adjacent islands
From Bitung
Container to Sby & Jkt
By air
USA; Snapper, yellow fin, sepallapot, shrimp EU; sepallapot, shrimp
69
⑤ Fishing Port Development
The Untia fishing port is located in the Untia area, about 10km north of the existing PPI Patere. There was
no fishing port facility in Untia before, and this is a new fishing port development. Here, the Untia fishing port was
added to the ORFP as the base port in eastern Indonesia to the outer ring fishing ports, because the Nizam Zachnan
(Jakarta) fishing port is included as the base port in the 14 fishing ports of western Indonesia.
At present, reclamation of the access road has been completed and the pile-supported trestle is under
construction as in project phase-1. Phase-2 and phase-3 projects are expected to begin. However, vertical piles are
poking out from the seabed at a height of about several meters. If these piles are not embedded enough into the
seabed, the piles cannot work as an independent entity against horizontal forces, as required in the structural design.
This should be noted.
The following figure shows the development plan of PPN Untia. The main facilities are reclaimed land of
300m×250m, reclaimed road of 50m, trestle of 200m (pile supported), reclaimed road of 460m, breakwater of
3,763m, dredging of 265,000m3, complex road and drainage, electricity, auction hall, cold storage, fuel supply and
water supply.
The location of this PPN is in a very shallow lagoon area. Thus, the reclaimed land, which provides
functional facility space and the quay, is to be located about 500m offshore, and is connected by the trestle and
reclaimed road to the land. The breakwater protects the anchor basin and quay from waves and sedimentation
from the outer area. Even then, the anchor basin has to be dredged.
In 2005, the detail design and review of PPN Untia was carried out, and concluded that an amount of 364
billion IDR would be required for the completion of the project. Within this total, 317 billion IDR was for civil
works. In 2006, the jurisdiction of the fishing port was handed over to provincial office, and the development
project was started. Then in 2008, the jurisdiction was returned to the city of Makassar, but in 2009, it was
handed over to the province again. In the same year, construction work started. From 2006 until 2009, APBN of
16.78 billion IDR and APBD of 2.3 billion IDR were granted for this project. Based on this budget, the revetment,
reclaimed road, box culvert for drainage and pile-supported trestle measuring 175m were constructed.
In 2010, it is planned to construct the rest of the pile-supported trestle (L=75m) through APBN of 4.88
billion IDR to complete the first stage of the development. In the development plan, since the quay and
anchoring basin are not completed yet, it is expected that small fishing vessels will use the trestle for unloading
work only during high tide.

70
Fig. 4.2-9 PPN Untia development plan (Source: Survey team)
Fig. 4.2-10 Current view of the construction site of PPN Untia (Source: Survey team)
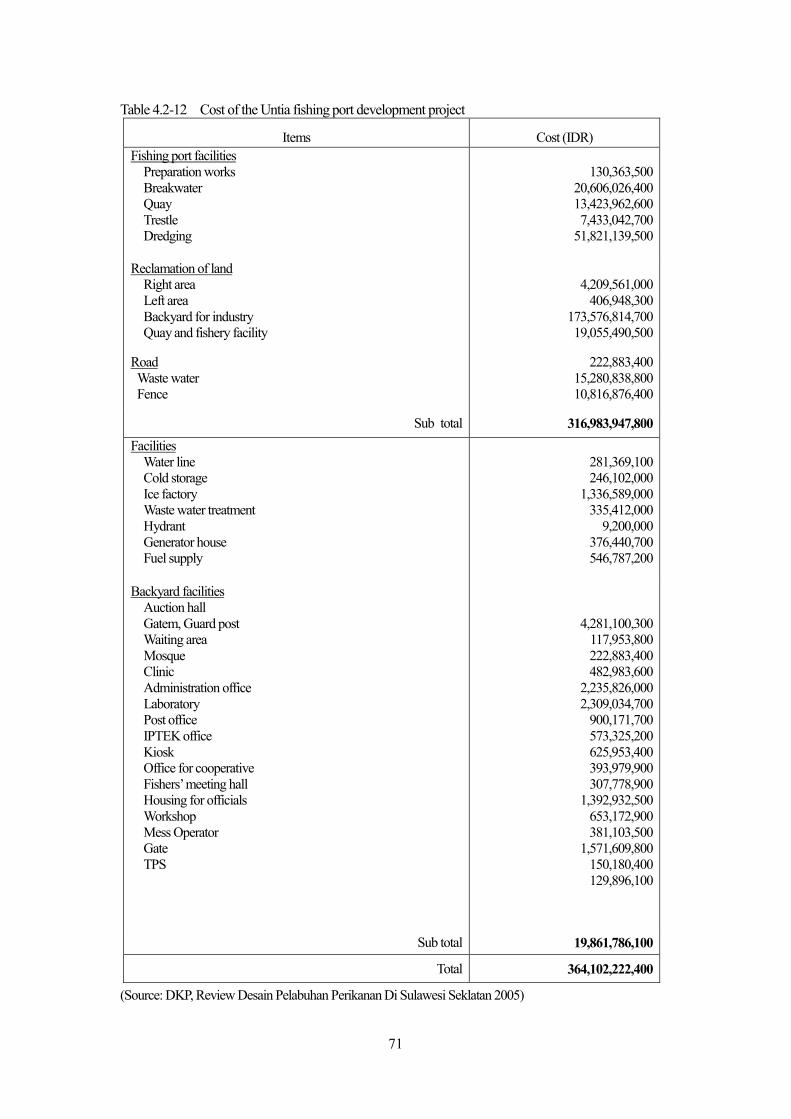
71
Table 4.2-12 Cost of the Untia fishing port development project
Items Cost (IDR) Fishing port facilities
Preparation works Breakwater Quay Trestle Dredging
130,363,500
20,606,026,400 13,423,962,600 7,433,042,700
51,821,139,500
Reclamation of land Right area Left area Backyard for industry Quay and fishery facility
4,209,561,000
406,948,300 173,576,814,700 19,055,490,500
Road Waste water Fence
222,883,400 15,280,838,800 10,816,876,400
Sub total 316,983,947,800 Facilities Water line Cold storage
Ice factory Waste water treatment Hydrant Generator house
Fuel supply
281,369,100 246,102,000
1,336,589,000 335,412,000
9,200,000 376,440,700 546,787,200
Backyard facilities Auction hall Gatem, Guard post Waiting area Mosque Clinic Administration office Laboratory
Post office IPTEK office Kiosk Office for cooperative Fishers’ meeting hall Housing for officials Workshop Mess Operator Gate TPS
4,281,100,300 117,953,800 222,883,400 482,983,600
2,235,826,000 2,309,034,700
900,171,700 573,325,200 625,953,400 393,979,900 307,778,900
1,392,932,500 653,172,900 381,103,500
1,571,609,800 150,180,400 129,896,100
Sub total 19,861,786,100
Total 364,102,222,400
(Source: DKP, Review Desain Pelabuhan Perikanan Di Sulawesi Seklatan 2005)
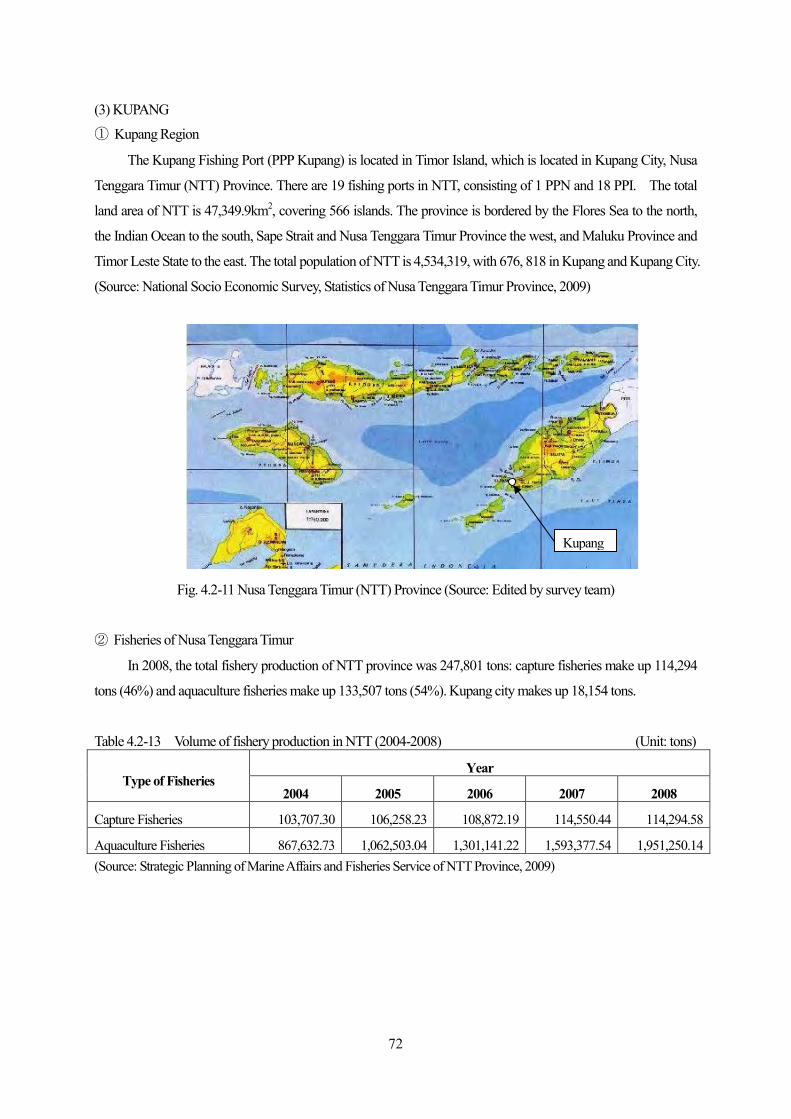
72
(3) KUPANG
① Kupang Region
The Kupang Fishing Port (PPP Kupang) is located in Timor Island, which is located in Kupang City, Nusa
Tenggara Timur (NTT) Province. There are 19 fishing ports in NTT, consisting of 1 PPN and 18 PPI. The total
land area of NTT is 47,349.9km2, covering 566 islands. The province is bordered by the Flores Sea to the north,
the Indian Ocean to the south, Sape Strait and Nusa Tenggara Timur Province the west, and Maluku Province and
Timor Leste State to the east. The total population of NTT is 4,534,319, with 676, 818 in Kupang and Kupang City.
(Source: National Socio Economic Survey, Statistics of Nusa Tenggara Timur Province, 2009)
Fig. 4.2-11 Nusa Tenggara Timur (NTT) Province (Source: Edited by survey team)
② Fisheries of Nusa Tenggara Timur
In 2008, the total fishery production of NTT province was 247,801 tons: capture fisheries make up 114,294
tons (46%) and aquaculture fisheries make up 133,507 tons (54%). Kupang city makes up 18,154 tons.
Table 4.2-13 Volume of fishery production in NTT (2004-2008) (Unit: tons)
Type of Fisheries Year
2004 2005 2006 2007 2008
Capture Fisheries 103,707.30 106,258.23 108,872.19 114,550.44 114,294.58
Aquaculture Fisheries 867,632.73 1,062,503.04 1,301,141.22 1,593,377.54 1,951,250.14 (Source: Strategic Planning of Marine Affairs and Fisheries Service of NTT Province, 2009)
Kupang

73
Table 4.2-14 Capture fisheries production in the Kupang City and NTT Province (Unit: tons)
Area Year
2004 2005 2006 2007 2008 NTT Province 103,707.30 106,258.23 108,872.19 114,550.44 114,294.58 Kupang City 18,153.00 25,184.10 15,725.00 17,289.90 18,154.40 PPP Kupang - - - - 5,612.16
(Source: Strategic Planning of Marine Affairs and Fisheries Service of NTT Province, 2009,
Statistics of Marine Affairs and Fisheries Service of Kupang Municipality, 2010,
and Annual Report of Kupang Fishing Port, 2009)
The Port of Kupang adjacent to the PPP Kupang is controlled by PELINDO-III and serves as a logistic base
in this region. In this commercial port, the container wharf and container yard were developed through Japanese
government assistance at the same time as the Port of Bitung in 2005. Thanks to this expansion program, the
handling of container cargoes is increasing. The fishery products that are unloaded and processed in the PPP
Kupang also use this container service, mainly for reefer containers. There are many flights to major cities in Java
from Kupang airport.
There are 8 PPI in the province and one in Kupang city (PPI Oeba). Most of the small-scale fishers unload
their catch at PPI Oeba and its adjacent beach (mainly this adjacent beach). Fishing boats, which are larger than
10GT, are not able to enter the PPI Oeba where there is a center for small-scale fishers.
The unloaded fish are transported to some markets in Kupang city. PPP Kupang and PPI Oeba are under the
control of the province, while Oesapa is under the control of Kupang city.
There is a new project plan (ECO PORT PROJECT) by the city office to develop a fisheries complex with a
new PPI, market, tourism area and processing industry on the coast of Kupang city, which is taken into account by
MINAPOLITAN.
③ Fishery Resources
Based on the Fisheries Management Area (FMA) issued by Ministry of Marine Affairs and Fisheries
(MMAF), the sea area of NTT is part of FMA 713 (Flores Sea, Bone Bay, and Makassar Strait) and FMA 573
(Indian Ocean in the south part of Java, Bali, and NTT). According to the National Commission for Stock
Assessment (PRPT FKPPS2008), both of the FMAs have marine fisheries potential of 494,700 tons/year (FMA
713) and 242,700 tons/year (FMA 573).
If it is assumed that the seawater area of NTT is around 20% of the total area of FMA 713 and 573, also, if it
is assumed that the fish are distributed evenly, it can be roughly estimated that the marine fishery resources
potential of NTT is 342,863 tons/year, consisting of large pelagic fishes (77,346 tons/year), small pelagic fishes
(173,345 tons/year), bottom fishes (80,183 tons/year) and others (coral fishes, lobster, etc.) of 11,589 tons/year.

74
Table 4.2-15 Estimation of fishery resources potentials in NTT waters
Fishery Resources Group
Fishery Resource Potential (tons/year) Total
Estimated Fishery Resources Potential
FMA 713 FMA 573 20% x Total (tons/year) Large Pelagic Fishes 193,600 193,130 386,730 77,346 Small Pelagic Fishes 605,440 263,285 868,725 173,745 Bottom Fishes 333,350 67,565 400,915 80,183 Others 43,480 14,465 57,945 11,589
Total 1,175,870 538,445 1,714,315 342,863 (Source: National Commission for Stock Assessment)
④ Fisheries in Kupang
The most dominant types of fishing gear in NTT are hand line, troll line, gillnet, pole and line, purse seine,
boat seine, lift net, and set bottom long line. While the most dominant types of fishing gear in Kupang are hand
line, set bottom long line, boat seine, pole and line, gill net, and lift net. The fishing technology in Kupang is
relatively advanced, with the exception of hand line usage. The main fishing grounds are the Indian Ocean for
snapper and grouper, and Flores Islands, Sabu Sea and Suma Island waters for small tuna and skipjack.
In Kupang fishing port, tuna and skipjack are mainly unloaded. In 2007, 879 fishing boats entered the
fishing port, while long line fishing boats and hand line fishing boats made up 58%3.
Table 4.2-16 Volume of fish landed in PPP Kupang, 2007
(Source: PPP Kupang Annual Report, 2007)
3 PPP Kupang Annual Report, 2007
Tuna and Skipjacksnapper, grouper
and other shrimp Amount ofkg kg kg kg
1 January 31,250 164,704 1,184 197,138 2 February 12,302 145,897 - 158,199 3 March 28,500 103,868 2,630 134,998 4 A p ri l 11,150 116,614 85 127,849 5 May 7,795 702,444 290 710,529 6 June 22,540 571,041 978 594,559 7 July - 350,859 2,616 353,475 8 August 6,050 487,528 350 493,928 9 September 53,573 343,038 - 396,611 10 October 545,300 551,820 - 1,097,120 11 November 742,340 457,171 130 1,199,641 12 December 177,135 353,812 911 531,858
Total 1,637,935 4,348,796 9,174 5,995,905
NO MONTH
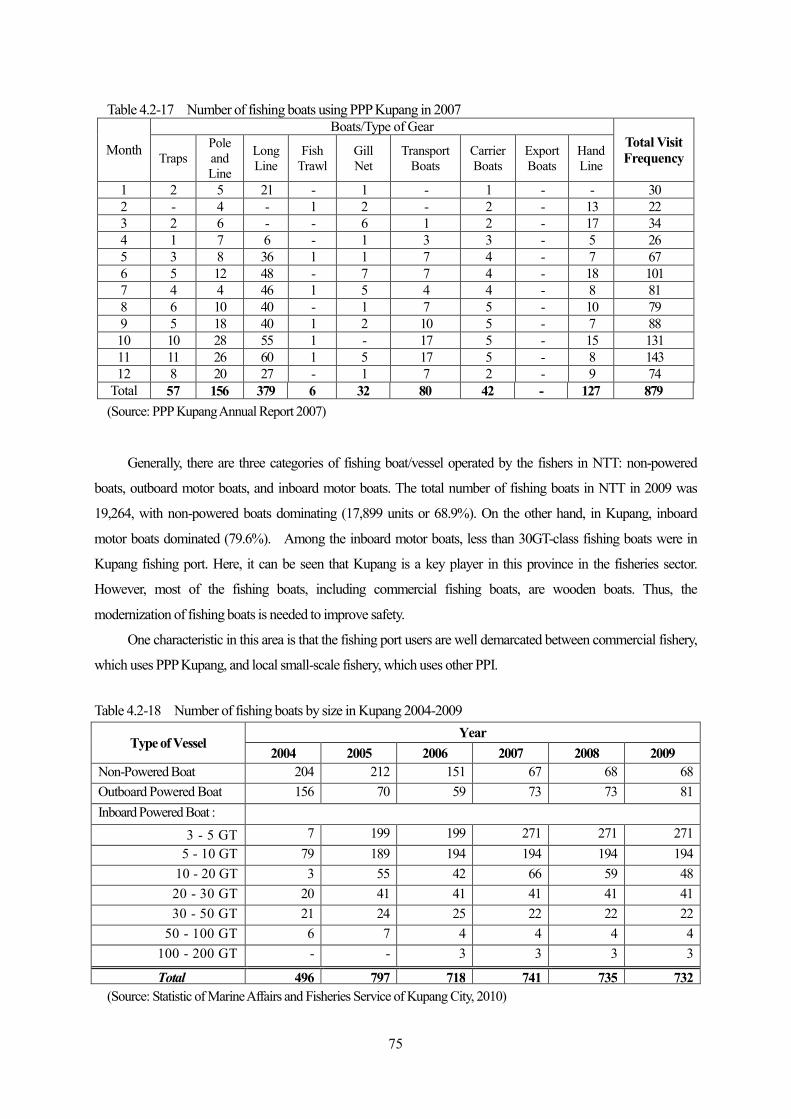
75
Table 4.2-17 Number of fishing boats using PPP Kupang in 2007
Month
Boats/Type of Gear Total Visit Frequency Traps
Pole and Line
Long Line
Fish Trawl
Gill Net
Transport Boats
Carrier Boats
Export Boats
Hand Line
1 2 5 21 - 1 - 1 - - 30 2 - 4 - 1 2 - 2 - 13 22 3 2 6 - - 6 1 2 - 17 34 4 1 7 6 - 1 3 3 - 5 26 5 3 8 36 1 1 7 4 - 7 67 6 5 12 48 - 7 7 4 - 18 101 7 4 4 46 1 5 4 4 - 8 81 8 6 10 40 - 1 7 5 - 10 79 9 5 18 40 1 2 10 5 - 7 88 10 10 28 55 1 - 17 5 - 15 131 11 11 26 60 1 5 17 5 - 8 143 12 8 20 27 - 1 7 2 - 9 74
Total 57 156 379 6 32 80 42 - 127 879 (Source: PPP Kupang Annual Report 2007)
Generally, there are three categories of fishing boat/vessel operated by the fishers in NTT: non-powered
boats, outboard motor boats, and inboard motor boats. The total number of fishing boats in NTT in 2009 was
19,264, with non-powered boats dominating (17,899 units or 68.9%). On the other hand, in Kupang, inboard
motor boats dominated (79.6%). Among the inboard motor boats, less than 30GT-class fishing boats were in
Kupang fishing port. Here, it can be seen that Kupang is a key player in this province in the fisheries sector.
However, most of the fishing boats, including commercial fishing boats, are wooden boats. Thus, the
modernization of fishing boats is needed to improve safety.
One characteristic in this area is that the fishing port users are well demarcated between commercial fishery,
which uses PPP Kupang, and local small-scale fishery, which uses other PPI.
Table 4.2-18 Number of fishing boats by size in Kupang 2004-2009
Type of Vessel Year
2004 2005 2006 2007 2008 2009 Non-Powered Boat 204 212 151 67 68 68 Outboard Powered Boat 156 70 59 73 73 81 Inboard Powered Boat :
3 - 5 GT 7 199 199 271 271 271 5 - 10 GT 79 189 194 194 194 194
10 - 20 GT 3 55 42 66 59 48 20 - 30 GT 20 41 41 41 41 41 30 - 50 GT 21 24 25 22 22 22
50 - 100 GT 6 7 4 4 4 4 100 - 200 GT - - 3 3 3 3
Total 496 797 718 741 735 732 (Source: Statistic of Marine Affairs and Fisheries Service of Kupang City, 2010)
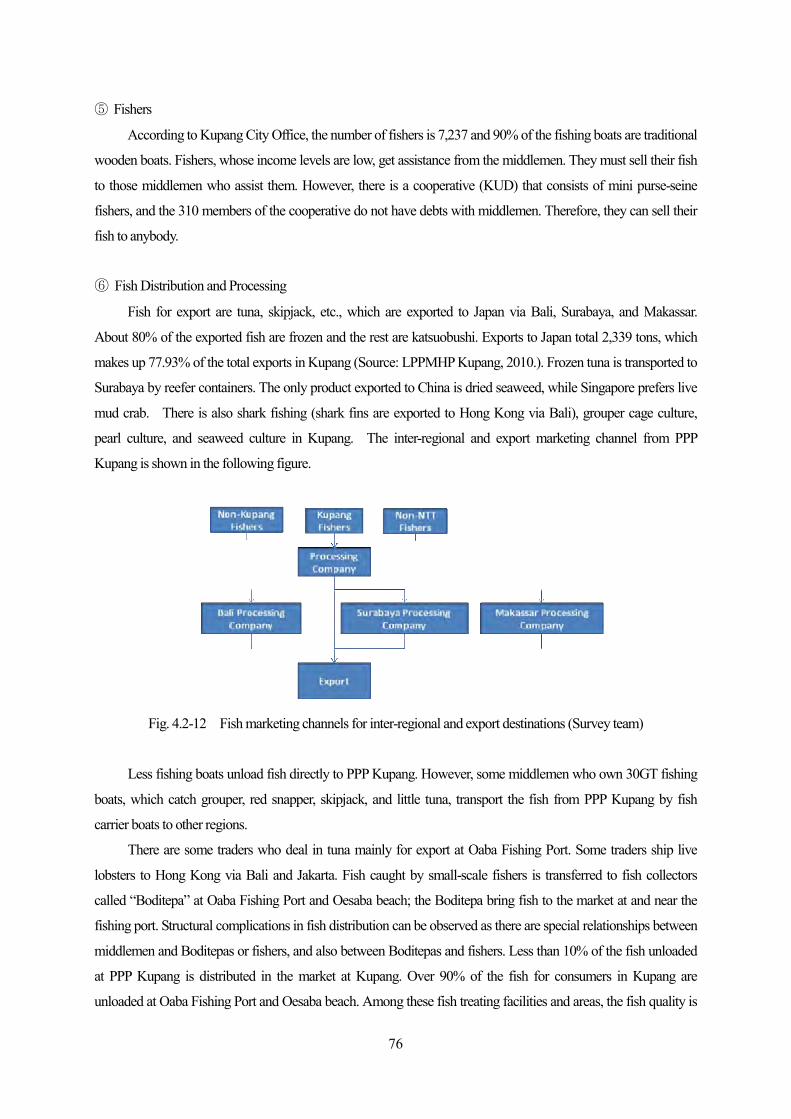
76
⑤ Fishers
According to Kupang City Office, the number of fishers is 7,237 and 90% of the fishing boats are traditional
wooden boats. Fishers, whose income levels are low, get assistance from the middlemen. They must sell their fish
to those middlemen who assist them. However, there is a cooperative (KUD) that consists of mini purse-seine
fishers, and the 310 members of the cooperative do not have debts with middlemen. Therefore, they can sell their
fish to anybody.
⑥ Fish Distribution and Processing
Fish for export are tuna, skipjack, etc., which are exported to Japan via Bali, Surabaya, and Makassar.
About 80% of the exported fish are frozen and the rest are katsuobushi. Exports to Japan total 2,339 tons, which
makes up 77.93% of the total exports in Kupang (Source: LPPMHP Kupang, 2010.). Frozen tuna is transported to
Surabaya by reefer containers. The only product exported to China is dried seaweed, while Singapore prefers live
mud crab. There is also shark fishing (shark fins are exported to Hong Kong via Bali), grouper cage culture,
pearl culture, and seaweed culture in Kupang. The inter-regional and export marketing channel from PPP
Kupang is shown in the following figure.
Fig. 4.2-12 Fish marketing channels for inter-regional and export destinations (Survey team)
Less fishing boats unload fish directly to PPP Kupang. However, some middlemen who own 30GT fishing
boats, which catch grouper, red snapper, skipjack, and little tuna, transport the fish from PPP Kupang by fish
carrier boats to other regions.
There are some traders who deal in tuna mainly for export at Oaba Fishing Port. Some traders ship live
lobsters to Hong Kong via Bali and Jakarta. Fish caught by small-scale fishers is transferred to fish collectors
called “Boditepa” at Oaba Fishing Port and Oesaba beach; the Boditepa bring fish to the market at and near the
fishing port. Structural complications in fish distribution can be observed as there are special relationships between
middlemen and Boditepas or fishers, and also between Boditepas and fishers. Less than 10% of the fish unloaded
at PPP Kupang is distributed in the market at Kupang. Over 90% of the fish for consumers in Kupang are
unloaded at Oaba Fishing Port and Oesaba beach. Among these fish treating facilities and areas, the fish quality is

77
maintained by ice, but usually, hygiene conditions are not good.
One of the dominant products in Kupang is loin tuna (yellow fin). The fishes larger than 40 kg will be sold
as a whole, while the fishes smaller than 40 kg will be processed into loin tuna. Loin tuna and whole tuna (for
sashimi) are sold to the exporting companies in Bali and they are transported by airplane. Another type of modern
fish processing in Kupang is frozen fish. There are two companies producing frozen fish. Both of them have
processing facilities in PPP Tenau-Kupang. The product is mainly sold to a processing company in Surabaya.
In addition, there is a women’s Kelompok, which produces smoked jerky of Jack trevallies and sells it to
Java. The production volume is very limited.
The following figure shows the sum of fisheries activity in the Kupang area.

78
Fig. 4.2-13 Summary of fishing activities in Kupang and in the region (Source: Survey team)
PPP. Kupang : 400t/day, 30GT; hand line Tuna, 20-30GT; hand line/long line, tuna/skipjack 10-30GT; purse seine, ~10GT; gill net, hand line, trolling, mini purse seine
the Port of Kupang : In 2009 : 46,600TEU, reefer (40ft)×138 box
PPI. Oeba: small scale fishermen
Eco Port Project (PPI) -> MINAPOLITAN
Container: Bari ; Tuna Makassar ; shark fin, sea
cucumber, seaweed Surabaya ; skipjack,
snapper, grouper airport
Bari: tune, Snapper & grouper (live, iced), live lobster
Carry boat; ~105GT
Bari
Fishing boat (30GT)×12, hand line tuna
Demarsal, for export, 30GT
PPI. Tabolong
To Mks, Sby
Surabaya, Bari (carry boat): Skip Jack,Snapper,Grouper,Tuna, Baby Tuna

79
⑦ Fishing Port development
The ORFP development in Kupang is to upgrade the fishing port classification from PPP (Type-C) to PPN
(Type-B). The jurisdiction of PPP Kupang was handed over to the province from central government in 2001
along with the decentralization agenda. Within the fishing port area, there are a katsuobushi factory, ice factories
and cold storage facilities. The development plan aims to promote processing companies by improving the
mooring capacity and land area. However, on the east side of the PPP is located the commercial port of
PELINDO-III; therefore, reclaiming the west side area of the PPP is considered in the development plan.
Furthermore, according to the large seasonal variation in fishing activities, it would be important to investigate the
size and specification of the facilities, cost, and profitability of the development project, and alternatives as well.
Table 4.2-19 Main facilities of PPP Kupang Facilities Dimension Note
Land 5,220ha
① Jetty-1 4m Pile supported
② Jetty-2 1m Pile supported, for less than 10GT boats
③ Revetment
Road 2,550m2
Port basin 10,500m2 For less than 10GT boats
④
⑤ Auction hall
⑥ Processor (delayed)
⑦ Ice factory 50t/day, block ice 25kg CV NELAYAN HIDUP MAKMUR
⑧ Cold storage PT TSPN
⑨ Cold storage, ice factory CV IMMANUEL
⑩ KIOSK
⑪ Workshop
Generator 200KVA
⑫ Cold storage PT. TSPN
⑬ Fisherman’s meeting hall 125m2
⑭ Katsuobushi factory PT. SANANA INDONESIA
⑮ PPP administration office
⑯ Water tank
(Source: PPP Kupang)
In Kupang fishing port, freshwater is obtained from the Kupang Drinking Water Company and PPP owns
two units of artesian wells owned by PPP Kupang, with a total volume of 5.2 liters/second. The freshwater is

80
provided to fishing boats, ice factories, fish traders and for other usage. Local government revenues during 2007 in
PPP Kupang can be seen in the following table.
Table 4.2-20 Revenues in PPP Kupang, 2007
NO. Source of Income Amount of Income (IDR)
1 Rent on the officers’ house 4,200,000 2 Rent for fishermen’s lodge 4,960,000 3 Water service charges 93,733,500 4 Fees for workshops 3,015,000 5 Fees for building rent 5.700.000 6 Fees for land rent 61,950,000 7 Cost of arrival at the port 7,020,000 8 Mooring fees 6,312,950 9 Levies on moored boats 9,962,550 10 Levy on ships’ documents 30,095,000
Total 226,949,000
(Source: PPP Kupang Annual Report 2007)
⑧ Summary of the Development Plan
Summary
The main objective of the development plan is to break up congestion at the main jetty caused by
30GT-class fishing boatss, and to expand the land for fishing/processing-related activities. Thus, the current
development plan consists of land reclamation at the south side of PPP, a quay for 30GT fishing boats on the
offshore side of the reclaimed land, and a dockyard on the north side of the anchoring basin. This detail design was
carried out in 2006 by MMAF. (PEKERJAAN: STUDI DAN DETAIL DESAIN, PEMBANGUNAN
PELABUHAN PERIKANAN KUPANG, NUSA TENGGARA TIMUR, FINAL REPORT)
Jetty Size Estimation
According to the survey, 4 to 5 days are required for 10 boats to complete a series of operations at the main
jetty. Thus, if more than 10 fishing boats entered the fishing port, the boats are forced to wait until their turn when
the jetty becomes vacant, which causes a huge problem.
Since 2005, in order to avoid this wasting of time and bottlenecks at the jetty, many fishing boats have been
transferring their catches to registered carry boats in the fishing ground, and the carry boats have been transporting
their catches directly to the final landing places. These carry boats declare their catch to the PPP Kupang. This
operation is conducted only in the high season. In other periods, fishing boats unload at PPP Kupang and the carry
boats load at PPP Kupang as well.
Based on the frequency of fishing boat visits in the fishing port and the number of fishing boats by type, the

81
number of fishing boat s by type in high season (November, 143 fishing boats to enter) are estimated as follows:
20-30GT: hand line by 8, pole and line by 26, long line by 60
1~10GT: gill net by 5, 1~5GT ; trap by 11, Larger than 50 GT ; carry boat by 9
Assume the available factor of the jetty is 85%, and boats, which are larger than 20GT, use the main jetty.
Each boats need to use the jetty for 24 hours (among 10 boats, 2 boats uses the jetty at the same time, for 5 days in
total), and carry boats require 48 hours. Then, applying the current jetty length as one berth unit:
In-service period = 30 days×0.85 = 25.5 days/month,
Number of 30GT-class boats = 8+26+60 = 94 boats
Total required jetty units by month
For 30GT class = 94×24/24×1/2 = 47 jetty units
For carry boats = 9 × 2 = 18 jetty units
Total required jetty unit = (47+18) × 1/25.5 = 2.5 jetty units
Thus, excluding concentration, there is demand nearly three times the scale of the current jetty.

82
Fig. 4.2-14 Current conditions and development plan of PPN Kupang (Source: Survey team)
a:
a:
b:
b: c:
c:
d:
d:
The Port of Kupang (PELINDO III
New reclamation
Ice Factory
Main Jetty
Sub jetty
New Dock yard; (reclamation)
New Quay;150m

83
(4) NUNUKAN
① Nunukan Region
The Nunukan Fishing Port is located in Nunukan Island and administratively located in Nunukan
Sub-district, Nunukan District, East Kalimantan Province. This province borders Malaysia to the North,
and the Sulawesi Sea and Makassar Strait to the East.
The population of East Kalimantan was 3,094,700. The major cities in East Kalimantan are
Samarinda, Balikpapan, Tarakan and Bontang City, with populations of 603 thousand, 507 thousand, 184
thousand and 134 thousand, respectively. (Source: Statistics of East Kalimantan Province, 2009)
Fig. 4.2-15 Administrative map of East Kalimantan Province (Edited by Survey team)
② Fisheries in East Kalimantan
In 2008, the total fishery production volume in East Kalimantan Province was 183,898.20 tons,
consisting of capture fisheries of 128,415.70 tons (69.83%) and aquaculture of 55,482.50 tons (30.17%).
The proportion shows that capture fisheries dominated production volume. Fishery production in
Nunukan District was 4,607 tons in the same year.4
4 Statistics of East Kalimantan Province, 2009
PPN Nunukan
Tawao
Sebatik Island

84
Table 4.2-21 Fishery production in volume in East Kalimantan, 2004-2008
Type of Fisheries Year
2004 2005 2006 2007 2008 Capture Fisheries 126,805.6 130,284.4 114,690.0 127,586.6 128,415.7 - Marine capture 94,277.8 99,691.8 87,526.8 91,783.5 91,992.2 - Inland capture 32,527.8 30,592.6 27,163.2 35.803.1 36,423.5 Aquaculture 39,681.1 46,330.4 41,447.2 48,787.6 55,482.5 - Marine aquaculture 55.1 153.5 1,745.0 397.4 570.7 - Brackish water
aquaculture 22,765.7 26,978.2 21,828.2 27,305.0 29,793,5
- Freshwater aquaculture 16,860.3 19,198.7 17,874.0 21,085.2 25,118.3
(Source: Statistics of East Kalimantan Province, 2009)
③ Fishery resources
There are two main sea areas in this province: the Sulawesi Sea and Makassar Strait. Based on the
Fisheries Management Area (FMA) appointed by MMAF, the Sulawesi Sea is a part of FMA 716, while
the Makassar Strait is a part of FMA 713. According to the National Commission for Stock Assessment
(PRPT FKPPS2008), each of these FMAs posesses fishery resources potential that amount to 494,700
tons/year (FMA 713) and 83,200 tons/year (FMA 716).
④ Fisheries in Nunukan
The most dominant types of fishing gear used by fishers in East Kalimantan Province are hand line,
portable trap, gill net, lift net, boat seine, and purse seine. While the most dominant types of fishing
gear in Nunukan are gill net, portable trap, lift net, and hand line. The fishers in Nunukan still use
relatively simple fishing technology on a small to medium scale.
Generally, there are three categories of boats/vessels operated by fishers in East Kalimantan:
non-powered boats, outboard motor boats, and inboard motor boats. In 2008, the total number of fishing
boats in East Kalimantan was 30,221, dominated by 21,542 inboard motor boats (71.28%). In Nunukan,
outboard motor boats dominated (88.77%).
A number of fishers quit capture fisheries and changed to seaweed aquaculture in Nunukan due to
the dissemination of Nunukan District’s policy in 2008. Only a few fishers continue capture fisheries in
Nunukan at present. The fishing ground is the coastal areas between Tarakan and Nunukan.
There are 1,874 fishers in Nunukan district and around 1,000 fishers live in Sebatik Island facing
Nunukan. Their main fishing methods are scoop net, gill net, angling, long line, etc.
Some fishers in Sebatik get assistance from middlemen in Tarakan. They must unload their fish at
Tarakan. The middlemen in Tarakan transport the fish to Tawau by their boats. Most of the fishing boats
are traditional wooden boats built by boat builder in Sebatik.
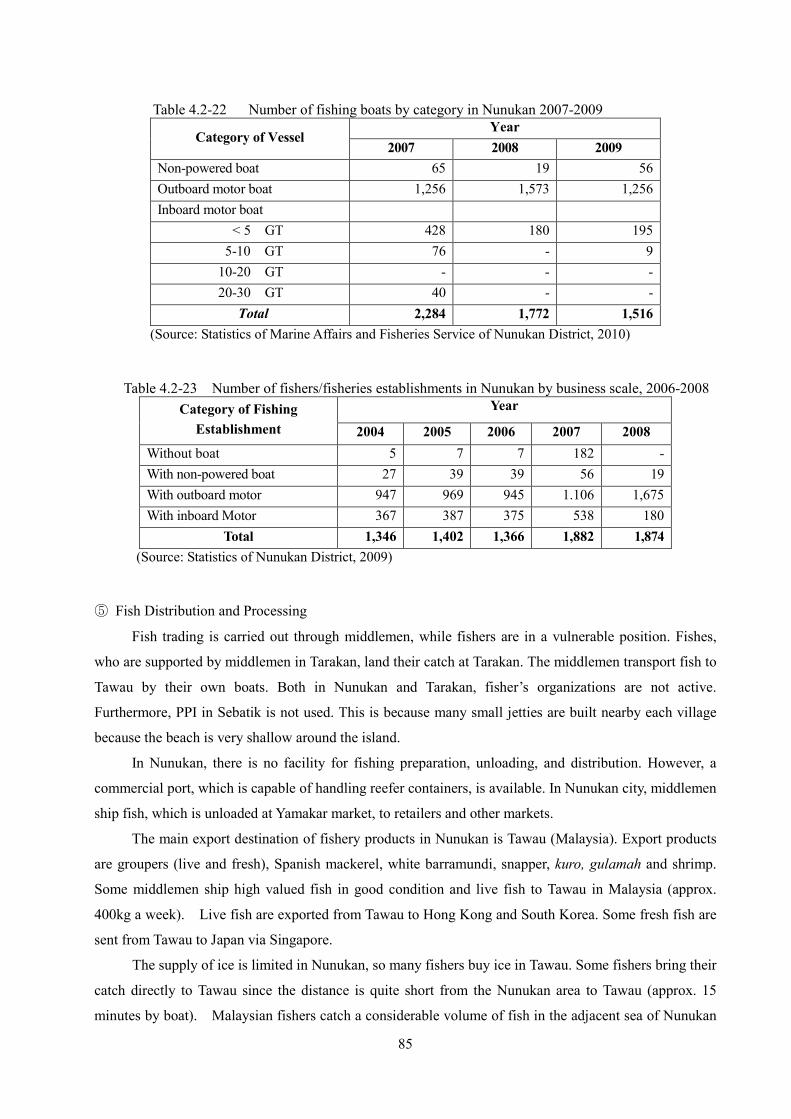
85
Table 4.2-22 Number of fishing boats by category in Nunukan 2007-2009
Category of Vessel Year
2007 2008 2009 Non-powered boat 65 19 56 Outboard motor boat 1,256 1,573 1,256 Inboard motor boat
< 5 GT 428 180 195 5-10 GT 76 - 9
10-20 GT - - - 20-30 GT 40 - -
Total 2,284 1,772 1,516 (Source: Statistics of Marine Affairs and Fisheries Service of Nunukan District, 2010)
Table 4.2-23 Number of fishers/fisheries establishments in Nunukan by business scale, 2006-2008 Category of Fishing
Establishment
Year
2004 2005 2006 2007 2008 Without boat 5 7 7 182 - With non-powered boat 27 39 39 56 19 With outboard motor 947 969 945 1.106 1,675 With inboard Motor 367 387 375 538 180
Total 1,346 1,402 1,366 1,882 1,874 (Source: Statistics of Nunukan District, 2009)
⑤ Fish Distribution and Processing
Fish trading is carried out through middlemen, while fishers are in a vulnerable position. Fishes,
who are supported by middlemen in Tarakan, land their catch at Tarakan. The middlemen transport fish to
Tawau by their own boats. Both in Nunukan and Tarakan, fisher’s organizations are not active.
Furthermore, PPI in Sebatik is not used. This is because many small jetties are built nearby each village
because the beach is very shallow around the island.
In Nunukan, there is no facility for fishing preparation, unloading, and distribution. However, a
commercial port, which is capable of handling reefer containers, is available. In Nunukan city, middlemen
ship fish, which is unloaded at Yamakar market, to retailers and other markets.
The main export destination of fishery products in Nunukan is Tawau (Malaysia). Export products
are groupers (live and fresh), Spanish mackerel, white barramundi, snapper, kuro, gulamah and shrimp.
Some middlemen ship high valued fish in good condition and live fish to Tawau in Malaysia (approx.
400kg a week). Live fish are exported from Tawau to Hong Kong and South Korea. Some fresh fish are
sent from Tawau to Japan via Singapore.
The supply of ice is limited in Nunukan, so many fishers buy ice in Tawau. Some fishers bring their
catch directly to Tawau since the distance is quite short from the Nunukan area to Tawau (approx. 15
minutes by boat). Malaysian fishers catch a considerable volume of fish in the adjacent sea of Nunukan

86
by using larger fishing vessels, and they bring the catch to Tawau. Some fish are brought to Yamakar
market in Nunukan from Tawau, although the fish is originally brought to Tawau from the Nunukan area.
There are 8 exporters dealing with frozen fish and a number of middlemen in Tarakan who support
fisheries in Sebatik island near Nunukan. Thus, inter-regional trade and the export of fishery products in
Nunukan are carried out through these middleman in Nunukan and Tarakan.
The fisheries marketing channel in Nunukan is shown in the following figure.
Fig. 4.2-16 Fresh fish marketing channels in Nunukan (Source: Survey team)
Tarakan is a base for fish distribution in East Kalimantan Province and many fishery products are
sent to Singapore via Balikpapan from Tarakan. Around 70 middlemen in Tarakan buy fish from fishers
near Nunukan and ship them to Tawau. One of the biggest middlemen ships about 100 tons of fish a
month to Tawau. A fish processing company of Tarakan produces 200-300 tons of frozen shrimp in a
month and the same company exports to Japan and other countries via Surabaya and Singapore. The
volume of fish distribution between Tarakan and Tawau in a month is estimated at approximately 400-500
tons. The annual exporting volume of frozen fishery products from the 8 exporting companies in Tarakan
is 10,800 tons. Most of this is shrimp.
Nunukan District consists of 5 sub-districts and has a wide area. However, most of the lands are
mangrove swamps and therefore very little economic activity is observed. Seaweed from the farming
disseminated to Nunukan in 2009 is collected by shippers through middlemen in Nunukan; it is then
exported overseas via Makassar and Surabaya. Some middlemen in Sebatik Island support fishers in the
same island and ship fish directly to Tawau.
At present there is no fish processing industry that is able to provide value added products in
Nunukan except for a small processing factory of milkfish. There are some fishers who provide shrimp
powder and small, dried fish. The shrimp powder is made by knocking a cloth bag, which is filled with
dried shrimp, on a wooden anvil. This has become an important income source for fishers.
The following figure summarizes fishing activities around PPP Nunukan.

87
Fig. 4.2-17 Summary of fishing activities in Nunukan area (Source: Survey team)
⑥ Fishing Port Development
Previously, there was no fishing port in Nunukan; this is a new construction. At present, access
road construction and land reclamation of the mangrove coast have been completed as the first stage of
development. Now, the rehabilitation work on the access jetty is under way.
The development of PPN (Type B) as one of the outer ring fishing ports is positioned as a strategic center
Tawau
Mensapa housing
Jamakar
Port Baru
Tanjung
PPN. Nunukan
Airport
Pasar Mamolo
Container (20ft) : to Sby, 3 calls/month, (6 calls planned), reefer ; started
Bulk Cargo : 4~5 calls/month, Mks/Sby, Cement etc, Tawau ; daily, import(crushed stone)
Live grouper, Frozen ;~300kg/week
From Jamakar : frozen(iced) fish (snapper, grouper, burrow,,,), 400-800kg/week
To Tarakan
Nunukan-Tawau daily, crushed stone(import), etc.
90% of catch goes to Tawau ; kakap, sunagin, shrimp
10% of catch Tongkol,
Malaysian fishing boat (purse seine), mainly IUU

88
for new economic growth and as a core at the development of the bordering areas. However, most of the
capture fisheries of Nunukan is turning to seaweed aquaculture and the market is dependent on fishing
activities of fishers in Sabatik Island next to Nunukan. It is important to control the increase of the loss of
outgoing fishery resources by strengthening regulations of IUU fishing. Development of outer ring
fishing ports as a core for fisheries management and fishery resources management is a very important
issue for this goal.
The development plan for PPN Nunukan Fishing Port can be seen in the following figure. The
main facilities are the jetty (100m×14m, 5m deep), trestle (110m), pier (110m) and revetment. As can
be seen in the following table, the detail design was carried out in 2004 and construction then started.
Then until 2008, the construction work had continued and a part of the trestle was constructed. Up to now,
about 22 billion IDR has been invested.
Table 4.2-24 Implemented budget for the development of PPN Nunukan
(Source Nunukan District)

89
Fig. 4.2-18 PPN Nunukan development plan (Source: Nunukan district)
However, because of shoddy pile driving workmanship, the piles fell over and the superstructure
collapsed. Currently, reconstruction work is under way at the contractor’s expense.
Fig. 4.2-19 Collapsed structure and current site view (Source: Survey team)

90
(5) BITUNG
① Bitung Region
The Bitung Fishing Port is located in Aertembaga Sub District, Bitung City, North Sulawesi
Province. This province is bordered by the Sulawesi Sea, the Republic of the Philippines, and the
Pacific Ocean to the north and the Maluku Sea to the east. The area of Sulawesi Utara Province includes
11 regions, 4 cities and 286 islands. The population in Sulawesi Utara according to data from 2008 was
2,208,000; the cities of Manado and Bitung had populations of 273,000 and 586,000, respectively, in
2008 (National Socio Economic Survey (Statistics of Sulawesi Utara Province, 2009).
Fig. 4.2-20 Administrative map of North Sulawesi Province (Edited by Survey team)
② Fisheries in North Sulawesi
2008 fishery production in North Sulawesi was 237,506 tons, comprised of capture fisheries of
208,643 tons (88%) and aquaculture of 28,863 tons (12%). The number suggests that fishery production
in North Sulawesi is still dominated by capture fisheries. Capture fisheries development in North
Sulawesi during 2006 - 2009 generally increased by 2.17% annually. Bitung totaled 139,029 tons, which
made up 67% of North Sulawesi in 20095.
Table 4.2-25 Fishery production in North Sulawesi, 2006-2009 Type of Fisheries Year
(ton) 2006 2007 2008 2009 Capture Fisheries 195,904.50 187,595.20 206,112.60 208,643.00 Aquaculture Fisheries 14,575.40 15,684.40 23,519.50 28,863.30
TOTAL 210,479.90 203,279.60 229,632.10 237,506.30 (Source: Annual Report of Marine Affair and Fisheries Service of North Sulawesi Province, 2010)
5 Source: Annual Report of Marine Affairs and Fisheries Service of North Sulawesi Province, 2010
PPS Bitung
91
North Sulawesi province has 13 PPIs. Around Bitung, 4 are to be found: PPI Kalijengki and PPI
Tumumpa in Manado, PPI Likupang in the north, and PPI Kema 15km south from Bitung.
③ Fishery Resources
Based on the Fisheries Management Area (FMA) issued by MMAF, the sea surrounding North
Sulawesi is part of two FMAs, namely FMA 715 (Seram Sea, Maluku Sea and Tomini Bay) and FMA 716
(Sulawesi Sea, Halmahera Sea and the Pacific Ocean). According to the National Commission of Stock
Assessment (PRPT FKPPS2008), both of the FMAs have a total marine fisheries potential of 324,900
tons/year (FMA 715) and 83,200 tons/year (FMA 716).
The main fishing grounds are widely spread: Toro Bay, Banda Sea (FMA: WPP714), Tomini Bay,
Maluku Sea, etc.(FMA: WPP715), Sulawesi Sea, etc. (FMA: WPP716) and Cendra Bay, Pacific Ocean
(FMA: WPP717). From the aspect of fishery resources management, users of PPS Bitung share fishery
resources with Maluku and West Papua Province, and with the Philippines in the Sulawesi Sea. Therefore,
controlling IUU fishing becomes a big issue. At present, fishery patrol boats reside at the fishing port and
have regular clamp downs; therefore, IUU fishing is decreasing. Bitung City also has a small patrol boat.
④ Fisheries in Bitung
There were 98,922 fishers in North Sulawesi in 2008. The most fishers reside in Manado, while the
least fishers reside in Bitung (5,324 fishers). There are fishers’ organizations but they are not active.
There are several dominant types of fishing gear in North Sulawesi, such as troll line, hand line,
drift gill net, set gill net, purse seine, lift net, tuna long line, drift long line, set bottom long line, and pole
and line. While the dominant types of fishing gear in Bitung are troll line, set gill net, pole and line, tuna
long line, purse seine, and drift gill net. Generally, the fishers in Bitung already use advanced types of
fishing gear in medium-scale business. The main fishing grounds are South Halmahera, Ceram and North
Sulawesi.
Generally, there are three types of fishing boat/vessel operated by fishers in North Sulawesi:
non-powered boats, outboard motor boats and inboard motor boats. The total number of fishing boats in
North Sulawesi in 2009 was 23,135; the dominant type was the outboard motor boat, totaling 15,484
(66.9%). Based on the size, the dominant boat is below 10GT (99%). Middle and large-scale fishing
boats are mainly found in Bitung. Most of the local fishing boats are wooden, while commercial fishing
boats are steel. There is a shipbuilding yard, which is a branch of an enterprise in Makassar.

92
Table 4.2-26 Fishing boats condition by size in North Sulawesi and Bitung 2008 Vessel Category North Sulawesi Bitung
Total 23,135 2,369
Non- powered
boat
Sub total 6,989 272 Jukung 6,653 272
Board Vessel
Small 336 0 Medium 0 0 Large 0 0
Outboard Motor Boat 15,484 1,822
Powered boat
Sub total 662 275
Vessel Size
< 5 GT 249 10 5-10 GT 121 14
10-20 GT 111 95 20-30 GT 50 35 30-50 GT 58 50
50-100 GT 32 30 100-200 GT 20 20 200-300 GT 21 21
(Source: Statistics of Marine Affairs and Fisheries Service of North Sulawesi Province, 2010)
Most of the fishers own their fishing boats and are not dependent on middlemen. This is the same
situation for fishers in Manado. There are also a number of fishers who become partners of big fish
processing companies on a contract basis and who are hired by vessel owners that supply fish to those
fish processing companies. There seem to be few number of individual small-scale fishers who operate
alone.
Kema Fishing Port is located 5km south of Bitung, where lots of fishers operate mini purse-seine
fishing boats through cooperation with lighting boats. They mainly catch scad. A fishing village, located
10km north of Bitung, has about 4,000 fishers operate gill net and bagan fishing. The fishers there unload
fish mainly in Bitung Fishing Port.
Table 4.2-27 Capture fisheries production by major species in Bitung 2009
No. Fish Species Production
(ton/year) Local Name International Name Genus/Species 1 Cakalang Skipjack Katsuwonus pelamis 61,364.8 2 Layang Scad Decapterus spp 22,452.1 3 Tongkol abu-abu Longtail tuna Thunnus tonggol 16,555.4 4 Albakora Albacore tuna Thunnus alalunga 15,313.5 5 Madidihang Yellow fin tuna Thunnus albacares 14,419.3 6 Tuna Mata Besar Big eye tuna Thunnus obesus 12,611.7
(Source: Statistic of Marine Affairs and Fisheries Service of North Sulawesi Province, 2010)

93
VOLUME VALUE VOLUME VALUE(Ton) ( Rp ) (Ton) ( Rp )
1 January 889,62 5.887.488.000 1.251,00 17.179.264.000 2 February 1.095,38 7.585.164.500 675,78 7.388.195.000 3 March 1.150,88 9.788.335.000 900,72 9.750.932.000 4 A p ri l 1.286,15 10.873.797.500 1.203,55 13.290.281.000 5 May 613,17 40.062.606.378 1.099,36 12.318.746.000 6 June 991,95 15.507.392.000 1.215,56 16.080.871.000 7 July 982,51 9.755.440.750 1.144,71 14.663.206.000 8 August 2.566,67 29.157.725.150 1.280,87 15.951.833.000 9 September 1.594,84 16.934.217.755 1.920,12 23.976.602.000 10 October 1.319,07 15.315.159.320 1.915,41 19.394.913.000 11 November 1.694,00 12.676.121.180 1.347,50 14.323.494.789 12 Desember 936,16 9.384.890.000 1.644,23 21.042.398.950
AMOUNT OF 15.120,40 182.928.337.533 15.598,81 185.360.736.739
Year of 2008 Year of 2009NO MONTH
The volume of fish landed in PPS Bitung and sales values are shown in the following table. Here,
14.09 tons of fish is landed every day on average.
Table 4.2-28 Volume and value of fish landed at PPS Bitung 2008-2009
(Source: Annual Report of PPS Bitung of year 2009)
⑤ Fish Distribution and Processing
Fishery products exported from Bitung are mainly transported by reefer containers through Jakarta,
Surabaya and Makassar. They reach their destination countries via Singapore. Some are exported to Japan
via General Santos in the Philippines. There are also many supplies shipped to large consumption cities
like Jakarta in Indonesia. Some commodities such as tuna loin and fresh tuna are shipped to Bali by air
from Manado.
Though the status of Bitung Fishing Port is PPS, small-scale boats also utilize the fishing port.
Direct dealings between fishers and middlemen and between fishers and retailers are conducted at the port.
There are also many fishers who sell fish to fish processing companies under a special contract base.
A total of 45 processors (6 canning factories, 3 sashimi plants, a katsuobushi factory, and frozen
food factories) are located in the Bitung area. Many of these private enterprises own their jetties and
undertake unloading activities with about 400 tons a day in total.
In Bitung, there is a large canning factory, which produces 85 tons of canned yellow fin tuna daily
and exports this to Japan. Fishery products quality control such as HACCP, ice utilization, and frozen
storage, etc., is widely installed among processing companies here. Residuum from processing factories
are processed in a fishmeal factory; therefore, almost 100% of the raw materials are utilized.
Fish unloaded in Bitung Fishing Port are brought to 6 consumer markets in the city, since there is
no fish market function in the fishing port. Industrially important fish species unloaded in Bitung are tuna,

94
skipjack, and scad. Pelagic fish are also distributed from Bitung to Manado and bottom fish are supplied
from Likupan to Bitung.
The following figure summarizes fisheries activities in the region and PPS Bitung.
Fig. 4.2-21 Summary of fisheries activities in the region of PPS Bitung (Source: Survey team)
PPS.Bitung 400t/day, 22,000t/year
Port of Bitung 46,600TEU(2009) reefer ;138TEU(2009)
Container :4 calls/month Sby-Tte-Btg-(Luwuk)- Mks-Sby Tuna, Merauke
Airport
Bari by air Tuna loin
Bacan Is., Mangole Is., Obi Is.,
Container
PPI. Likupang
Fishing boat; 30GT, 80-100GT
Carry boat; 80-100GT,
Fishermen lives along the Lembeh strait
Talaud Is.
Fishing boat; 30GT, 80-100GT
Carry boat; 80-100GT
PPI. Kema
Project Plan
Fishing Ground
Container To Mks-Sby
Kendari
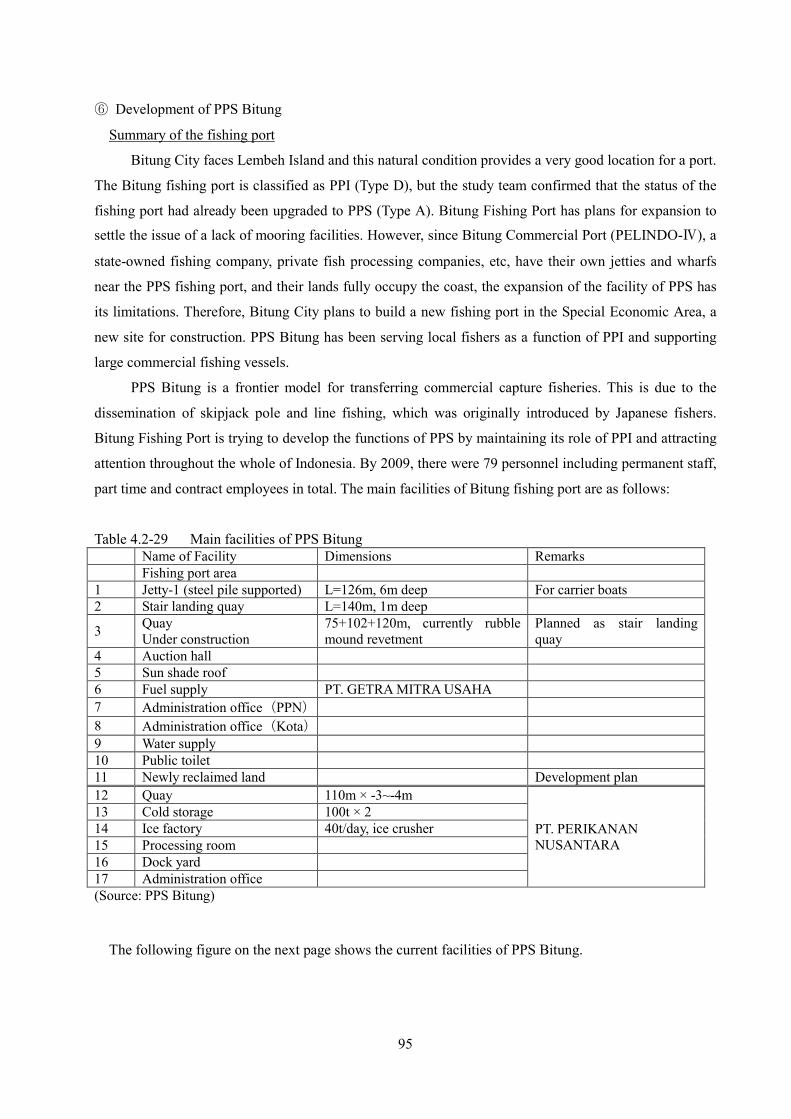
95
⑥ Development of PPS Bitung
Summary of the fishing port
Bitung City faces Lembeh Island and this natural condition provides a very good location for a port.
The Bitung fishing port is classified as PPI (Type D), but the study team confirmed that the status of the
fishing port had already been upgraded to PPS (Type A). Bitung Fishing Port has plans for expansion to
settle the issue of a lack of mooring facilities. However, since Bitung Commercial Port (PELINDO-Ⅳ), a
state-owned fishing company, private fish processing companies, etc, have their own jetties and wharfs
near the PPS fishing port, and their lands fully occupy the coast, the expansion of the facility of PPS has
its limitations. Therefore, Bitung City plans to build a new fishing port in the Special Economic Area, a
new site for construction. PPS Bitung has been serving local fishers as a function of PPI and supporting
large commercial fishing vessels.
PPS Bitung is a frontier model for transferring commercial capture fisheries. This is due to the
dissemination of skipjack pole and line fishing, which was originally introduced by Japanese fishers.
Bitung Fishing Port is trying to develop the functions of PPS by maintaining its role of PPI and attracting
attention throughout the whole of Indonesia. By 2009, there were 79 personnel including permanent staff,
part time and contract employees in total. The main facilities of Bitung fishing port are as follows:
Table 4.2-29 Main facilities of PPS Bitung Name of Facility Dimensions Remarks Fishing port area 1 Jetty-1 (steel pile supported) L=126m, 6m deep For carrier boats 2 Stair landing quay L=140m, 1m deep
3 Quay Under construction
75+102+120m, currently rubble mound revetment
Planned as stair landing quay
4 Auction hall 5 Sun shade roof 6 Fuel supply PT. GETRA MITRA USAHA 7 Administration office(PPN) 8 Administration office(Kota) 9 Water supply 10 Public toilet 11 Newly reclaimed land Development plan 12 Quay 110m × -3~-4m
PT. PERIKANAN NUSANTARA
13 Cold storage 100t × 2 14 Ice factory 40t/day, ice crusher 15 Processing room 16 Dock yard 17 Administration office (Source: PPS Bitung)
The following figure on the next page shows the current facilities of PPS Bitung.

96
Fig. 4.2-22 Facilities of PPS Bitung (Source: Survey team)
a: -6m Jetty
b:-1m Stair landing wharf
c: Sun Shade & Auction Hall
d: Reclaimed Land
e: PT Perikanan Nusantara
a
b
c
d
e: PT Perikanan Nusantara
Cold storage:100t×2 Ice Factory: 40t/day
-3m×110m wharf Fish Factory: Tuna loin
Slipway and Repair yard
Fish Processing Factory : 45~47 factories Katsuo-bushi; 8, Tuna Sashimi; 3, Canning; 5(tuna, skipjack) Frozen; many(tuna, skipjack, squid, Muroaji, etc)
Fish material ; unloading private jetties, or buying form supplier who buys fish at PPS.
Transportation : reefer container, container,
The Port of Bitung
Pt Perikanan Nusantara
a
b
c
d
Cold storage:100t×2 Ice Factory: 40t/day
-3m×110m wharf Fish Factory: Tuna loin
Slipway and Repair yard
a: -6m Jetty
b:-1m Stair landing wharf
c: Sun Shade & Auction Hall
d: Reclaimed Land
e: PT Perikanan Nusantara

97
Fig. 4.2-23 Current facilities of PPS Bitung (Source: PPS Bitung)
(The number in the figure is relevant with that of the above table)
Deposit Non-Tax State Revenues of PPS Bitung are shown in the following table. The ice blocks
are supplied from several ice factories managed by private companies outside of PPS Bitung6.
6 PPS Bitung Annual Report 2009
2
1
3
3
3
4
5
6
7
8
9 10
16
17
13
12
14 15
11
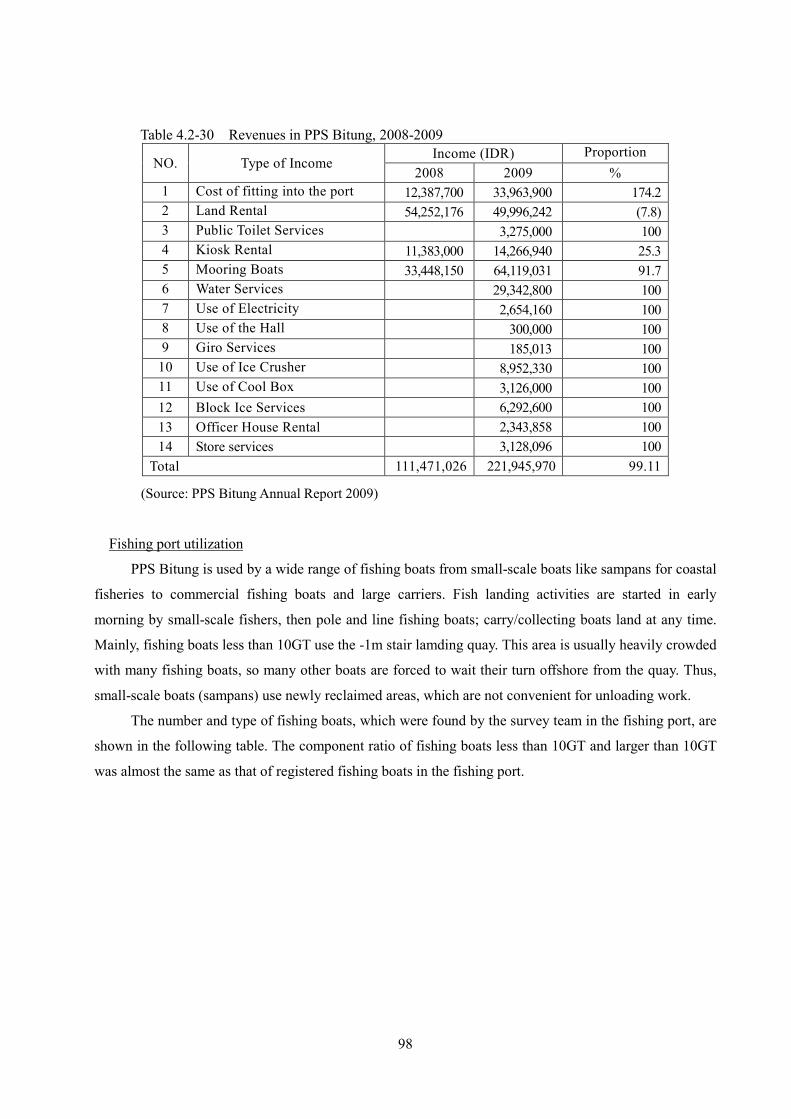
98
Table 4.2-30 Revenues in PPS Bitung, 2008-2009
NO. Type of Income Income (IDR) Proportion
2008 2009 % 1 Cost of fitting into the port 12,387,700 33,963,900 174.2 2 Land Rental 54,252,176 49,996,242 (7.8) 3 Public Toilet Services 3,275,000 100 4 Kiosk Rental 11,383,000 14,266,940 25.3 5 Mooring Boats 33,448,150 64,119,031 91.7 6 Water Services 29,342,800 100 7 Use of Electricity 2,654,160 100 8 Use of the Hall 300,000 100 9 Giro Services 185,013 100
10 Use of Ice Crusher 8,952,330 100 11 Use of Cool Box 3,126,000 100 12 Block Ice Services 6,292,600 100 13 Officer House Rental 2,343,858 100 14 Store services 3,128,096 100
Total 111,471,026 221,945,970 99.11
(Source: PPS Bitung Annual Report 2009)
Fishing port utilization
PPS Bitung is used by a wide range of fishing boats from small-scale boats like sampans for coastal
fisheries to commercial fishing boats and large carriers. Fish landing activities are started in early
morning by small-scale fishers, then pole and line fishing boats; carry/collecting boats land at any time.
Mainly, fishing boats less than 10GT use the -1m stair lamding quay. This area is usually heavily crowded
with many fishing boats, so many other boats are forced to wait their turn offshore from the quay. Thus,
small-scale boats (sampans) use newly reclaimed areas, which are not convenient for unloading work.
The number and type of fishing boats, which were found by the survey team in the fishing port, are
shown in the following table. The component ratio of fishing boats less than 10GT and larger than 10GT
was almost the same as that of registered fishing boats in the fishing port.
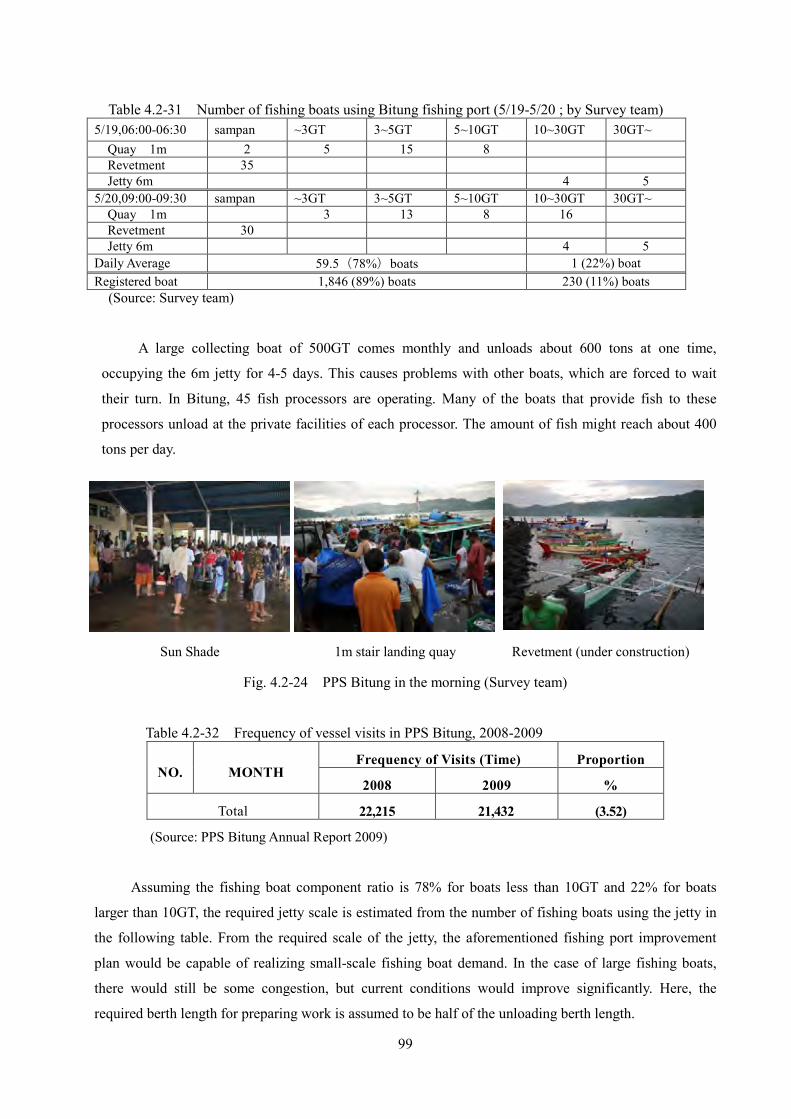
99
Table 4.2-31 Number of fishing boats using Bitung fishing port (5/19-5/20 ; by Survey team) 5/19,06:00-06:30 sampan ~3GT 3~5GT 5~10GT 10~30GT 30GT~
Quay 1m 2 5 15 8 Revetment 35 Jetty 6m 4 5
5/20,09:00-09:30 sampan ~3GT 3~5GT 5~10GT 10~30GT 30GT~ Quay 1m 3 13 8 16 Revetment 30 Jetty 6m 4 5
Daily Average 59.5(78%)boats 1 (22%) boat Registered boat 1,846 (89%) boats 230 (11%) boats
(Source: Survey team)
A large collecting boat of 500GT comes monthly and unloads about 600 tons at one time,
occupying the 6m jetty for 4-5 days. This causes problems with other boats, which are forced to wait
their turn. In Bitung, 45 fish processors are operating. Many of the boats that provide fish to these
processors unload at the private facilities of each processor. The amount of fish might reach about 400
tons per day.
Sun Shade 1m stair landing quay Revetment (under construction)
Fig. 4.2-24 PPS Bitung in the morning (Survey team)
Table 4.2-32 Frequency of vessel visits in PPS Bitung, 2008-2009
NO. MONTH Frequency of Visits (Time) Proportion
2008 2009 %
Total 22,215 21,432 (3.52)
(Source: PPS Bitung Annual Report 2009)
Assuming the fishing boat component ratio is 78% for boats less than 10GT and 22% for boats
larger than 10GT, the required jetty scale is estimated from the number of fishing boats using the jetty in
the following table. From the required scale of the jetty, the aforementioned fishing port improvement
plan would be capable of realizing small-scale fishing boat demand. In the case of large fishing boats,
there would still be some congestion, but current conditions would improve significantly. Here, the
required berth length for preparing work is assumed to be half of the unloading berth length.
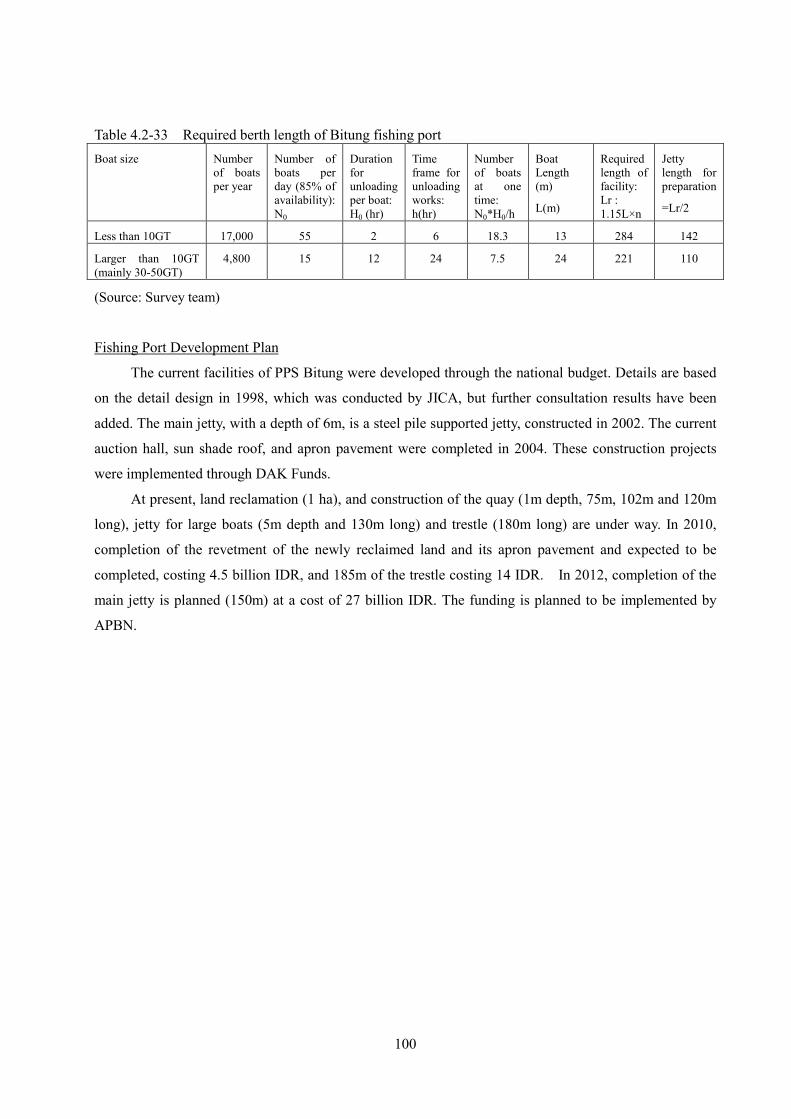
100
Table 4.2-33 Required berth length of Bitung fishing port Boat size Number
of boats per year
Number of boats per day (85% of availability): N0
Duration for unloading per boat: H0 (hr)
Time frame for unloading works: h(hr)
Number of boats at one time: N0*H0/h
Boat Length (m)
L(m)
Required length of facility: Lr : 1.15L×n
Jetty length for preparation
=Lr/2
Less than 10GT 17,000 55 2 6 18.3 13 284 142
Larger than 10GT (mainly 30-50GT)
4,800 15 12 24 7.5 24 221 110
(Source: Survey team)
Fishing Port Development Plan
The current facilities of PPS Bitung were developed through the national budget. Details are based
on the detail design in 1998, which was conducted by JICA, but further consultation results have been
added. The main jetty, with a depth of 6m, is a steel pile supported jetty, constructed in 2002. The current
auction hall, sun shade roof, and apron pavement were completed in 2004. These construction projects
were implemented through DAK Funds.
At present, land reclamation (1 ha), and construction of the quay (1m depth, 75m, 102m and 120m
long), jetty for large boats (5m depth and 130m long) and trestle (180m long) are under way. In 2010,
completion of the revetment of the newly reclaimed land and its apron pavement and expected to be
completed, costing 4.5 billion IDR, and 185m of the trestle costing 14 IDR. In 2012, completion of the
main jetty is planned (150m) at a cost of 27 billion IDR. The funding is planned to be implemented by
APBN.
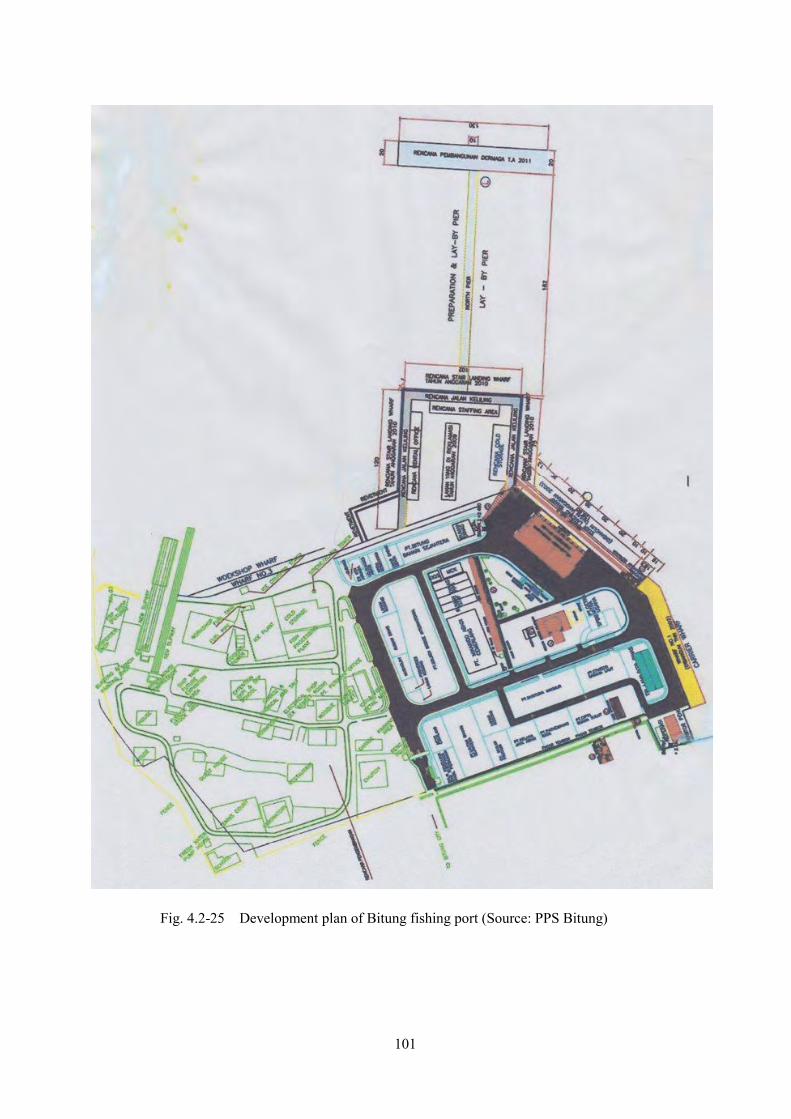
101
Fig. 4.2-25 Development plan of Bitung fishing port (Source: PPS Bitung)

102
(6) TERNATE
① North Maluku Region
The PPN Ternate Fishing Port is located on the eastern coast of Ternate Island, which is south of
Harmahera Island in North Maluku province. The capital city of the province is Sofifi; however, Ternate
is the center for social and economic activity in the province. Ternate Island is about 10km from north to
south, and 8km from east to west, with a population of about 95 thousand.
Fig. 4.2-26 Location of PPN Ternate (Edited by Survey team)
② Fisheries in North Maluku
Fisheries activity in North Maluku is dominated by capture fisheries, driven by the locals who
prefer marine fishes. The dominating species in North Maluku fishery production are skipjack, scad, tuna,
baby tuna, and black trevally. However, the so-called “other species” (including small pelagics) are
insignificant in volume. Since pole and line fishing are deeply rooted in the region, small-scale
commercial fishing is well established here. Fishing vessels/boats are mainly pole and liners and
purse-seiners. Some FRP fishing vessels/boats can be observed. Generally, the fish are consumed locally.
There are three places to land captured fish in Ternate city: PPN Ternate, PPI Dufadufa and the
market. The scale of activity is not clearly different between these three, but the main place is PPN
Ternate. In addition, there are three PPI in Tidore Island.
The fishing grounds are widely spread, such as the Sulawesi Sea, etc. (FMA: WPP716), Cendra
Bay and the Pacific Ocean (FMA: WPP717) and so on. For fishery resources management, it is an
important issue to control the operations of fishing vessels/boats that come from other areas, since Ternate
is located in a center with considerable potential for marine development.

103
③ Fisheries in Ternate
Similar to North Maluku Province, Ternate fishery production is also dominated by capture
fisheries. The main targets are mostly pelagic fishes, such as tuna, skipjack, scad, black trevallies, and
baby tuna. The most dominant bottom fishes are groupers and snapper. The most dominant types of
fishing gear in Ternate are beach seine, purse seine, drift gill net, and set gill net. Pelagic fishes are
usually caught using purse seine and drift gill net, while the other types of gear are used for bottom fishes.
Pelagic fish dominates (almost 83%) the total catch in Ternate. The main fish landing base is PPN
Ternate. In PPN Ternate fish are transported from other areas such as Tidore.
Table 4.2-34 Volume of fishery production by species in Ternate 2002 - 2007
Fish Species Ton / Year 2002 2003 2004 2005 2006 2007
Tuna/Skipjack Trevallies Fusilier Fishes Baby Tuna Goldstripe Sardinella Snapper/Grouper Beak Fish Mackerel Squid Others
3,315 1,364 315 441 258 462 381 265 15 641
5,013.66 1,022.21 341.20
1,302.80 50.58 218.29 146.35 295.87 127.30
1,479.97
5,038.73 1,027.32 342.91
1,309.31 50.83
219.38 147.08 297.35 127.94
1,487.37
5,074.00 1,034.51 345.31
1,318.48 51.19
220.92 148.11 299.43 128.84
1,497.78
5,682.88 1,158.65 368.75
1,476.70 57.33
247.43 165.88 326.96 144.31
1,667.51
6,308.00 1,286.10 409.31
1,639.03 63.64
274.65 184.13 362.93 160.18
1,850.94
T o t a l 7,457 9,998.23 10,048.22 10,118.57 11,296.4 12,538.89
(Source: Ternate City)
Fish are mainly transported by carry boats (15-20GT), and from 10GT fishing boats using mini
purse seine. Some fish are carried by ferry from Baban Island, which take 5 hours. To transport the fish to
PPN Ternate, fishers usually use collecting boats. The fishing boats do not come to PPN so often, except
for docking, maintenance and repair. Most of the collecting boats are owned by fishers, but some of them
belong to middlemen who operate the boats by themselves.
15 tons of fish a day are unloaded at Ternate Fishing Port and 5 tons of fish a day at Dfadfa Beach
to satisfy the demand for fish by the 200,000 people of Ternate City. Many of fish are caught near
adjacent area of Ternate. However, in the same sea area, there are also many fish that are caught by
fishing boats that come from Bitung and are unloaded at Bitung. Tuna and skipjack are the main species
caught in the area. Skipjack is caught a lot near the Bacan Island area. Mini purse seine fishing boats
(mainly 10GT) go to Bacan Island to catch mackerel, baby tuna and anchovy. Catches are landed by carry
boats at PPN. Pole and line fishing boats (mainly 30GT) catch skipjack and transfer their catch to carry
boats in the fishing ground. Carry boats land their catch at Bitung because of the stable prices there.
Hand line fishing boats come from the Philippines and land one-third of the time at Ternate, and the rest
goes to the Philippines (General Santos) illegally.

104
④ Fish Distribution and Processing
One company in Ternate ships tuna loin to Jakarta by reefer container for export. There is a regular
container service between Surabaya and Ternate port (PELINDO IV), and fishery products are transported
to Surabaya by reefer containers.
Fish unloaded at the port are consigned to a substitute boat owner called a “Pelaksana” to sell, she
decides on the fish price by negotiating with retailers and middlemen named “Dibodibo”. Fish is
distributed through negotiated transactions (OTC) mainly done by women. Most of the fish unloaded are
for consumers and only a part of the fish are used as materials in fish processing. The people of Ternate
areas require freshness in their fishery products. However, hygiene in the fishing ports and fish markets is
not good and needs to be improved. Especially the facilities for drainage, which easily becomes
bottlenecked.
Fishers don’t have special relationships with middlemen. Many fishers are employed by vessel owners
and engage in skipjack fishing and purse-seine fishing. There are fishers’ organizations but they are not
active.
In most cases, purse-seine fishing boats ask collecting boats to unload fish to save time and labor. The
catch is mainly unloaded at Ternate and Tidore fishing ports. Because of the limited market scale in
Ternate and Tidore, an oversupply of fish can easily occur and fishers face difficulties selling their catch.
Thus, fishers are sometimes forced to stop fishing in such cases.
Processing factories for smoked scad and frozen fish are in the area of PPN Ternate. These factories
ship their products to Jakarta. There are few processors and middlemen in Ternate. There are individuals
and Kelompok who produce and sell fish sauce made from yellow fin tuna and/or scad. The products
are distributed only in the city since production volume is limited. In Maitara Island, there is a smoked
skipjack producer who sells the products in Ternate City.
The following figure summarizes fishing activities of the PPN Ternate and the region.

105
Fig. 4.2-27 Summary of fishing activities of PPN Ternate and the region (Source: Survey team)
PPN.Ternate (Bastiong) 5,000t/year boat visit ≈5000
Port of Ternate 4,500TEU/month reefer ;20-30TEU/month
PPI.Dufadufa (Kota); 5ton/day, Market
Tuna / Hand line Demarsal fish
PPI. Goto just completed
Pembut(Phililines) : Lands one third times to Ternate / two times to Philippines illegally
Container :5~8calls/month Sby-Tte-Btg-(Luwuk)- Mks-Sby Tuna loin, Merauke 24ton/month?
Airport
PPI. Tomolou
PPI. Soasio, Pasar Lama
Most of the fishers live in Tidore Is. Skipjack, Ikan Layang, Squid, Tuna/baby Tuna
Skipjack
Container
IUU
Ternate
From Bacan Is. By Ferry
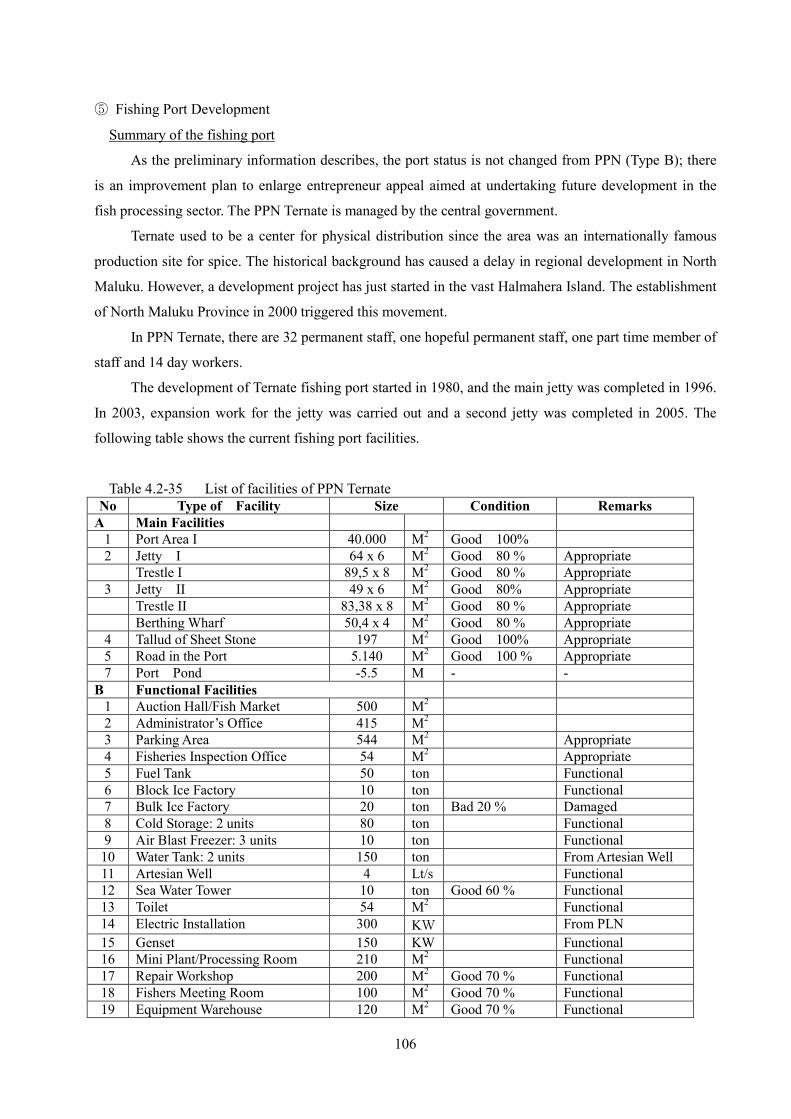
106
⑤ Fishing Port Development
Summary of the fishing port
As the preliminary information describes, the port status is not changed from PPN (Type B); there
is an improvement plan to enlarge entrepreneur appeal aimed at undertaking future development in the
fish processing sector. The PPN Ternate is managed by the central government.
Ternate used to be a center for physical distribution since the area was an internationally famous
production site for spice. The historical background has caused a delay in regional development in North
Maluku. However, a development project has just started in the vast Halmahera Island. The establishment
of North Maluku Province in 2000 triggered this movement.
In PPN Ternate, there are 32 permanent staff, one hopeful permanent staff, one part time member of
staff and 14 day workers.
The development of Ternate fishing port started in 1980, and the main jetty was completed in 1996.
In 2003, expansion work for the jetty was carried out and a second jetty was completed in 2005. The
following table shows the current fishing port facilities.
Table 4.2-35 List of facilities of PPN Ternate No Type of Facility Size Condition Remarks
A Main Facilities 1 Port Area I 40.000 M2 Good 100% 2 Jetty I 64 x 6 M2 Good 80 % Appropriate Trestle I 89,5 x 8 M2 Good 80 % Appropriate
3 Jetty II 49 x 6 M2 Good 80% Appropriate Trestle II 83,38 x 8 M2 Good 80 % Appropriate Berthing Wharf 50,4 x 4 M2 Good 80 % Appropriate 4 Tallud of Sheet Stone 197 M2 Good 100% Appropriate 5 Road in the Port 5.140 M2 Good 100 % Appropriate 7 Port Pond -5.5 M - -
B Functional Facilities 1 Auction Hall/Fish Market 500 M2 2 Administrator’s Office 415 M2 3 Parking Area 544 M2 Appropriate 4 Fisheries Inspection Office 54 M2 Appropriate 5 Fuel Tank 50 ton Functional 6 Block Ice Factory 10 ton Functional 7 Bulk Ice Factory 20 ton Bad 20 % Damaged 8 Cold Storage: 2 units 80 ton Functional 9 Air Blast Freezer: 3 units 10 ton Functional
10 Water Tank: 2 units 150 ton From Artesian Well 11 Artesian Well 4 Lt/s Functional 12 Sea Water Tower 10 ton Good 60 % Functional 13 Toilet 54 M2 Functional 14 Electric Installation 300 KW From PLN 15 Genset 150 KW Functional 16 Mini Plant/Processing Room 210 M2 Functional 17 Repair Workshop 200 M2 Good 70 % Functional 18 Fishers Meeting Room 100 M2 Good 70 % Functional 19 Equipment Warehouse 120 M2 Good 70 % Functional

107
No Type of Facility Size Condition Remarks 20 Drying Net Place 500 M2 Good 70 % Functional
C Supporting Facilities 1 Officer House 2 Unit Good 70 % Functional 2 Operator House 8 Unit Good 70 % Functional 3 Mosque/Islamic Prayer House 100 M2 Functional 4 Wall fence 500 M Appropriate 5 Guard house: 2 units 18 x 2 M2 Functional 6 Pawnshop 42 M2 Rental 7 Laboratorium of Fish Quality 200 M2 Not Efficient 8 Tennis Court 1 unit Functional
D Industrial Company in PPN Ternate 1 PT. Mitra Nelayan Mandiri 1. Block Ice Factory 20 ton 2. Reefer Container 20ft 2 unit 3. Fishing Vessels 6GT 50 unit
2 PT. Dwi Poli Perkasa 1. Air Blast Freezer 3 ton 2. Cold Storage: 2 units 100 ton
3 PT. Era Mandiri Cemerlang Tuna Loin Processing 150 M2
4 CV. Fiberglass Perkasa Shipbuilding yard 1,000 M2
5 UD. Hermanto 6 UD. Agus 7 UD. Irwan
(Source: PPN Ternate)
Table 4.2-36 Number of fishing boats using the PPN Ternate facilities 2008-2009 2008 2009
Visiting vessels 5,770 4,363
(Source: Annual Report of PPN Ternate, 2009)
The number of vessels visiting the PPN Ternate was 4,363 in 2009, which can be seen in the above
table. The ice production from ice factories in PPN Ternate was 337 tons, and block ice production from a
private factory was 5,630 tons in 2009.
Table 4.2-37 Volume and value of ice sold in PPN Ternate, 2008 - 2009
Year of 2008 Year of 2009
VOL (Ton) VALUE (IDR) VOL (Ton) VALUE (IDR) Amount 409 92,480,000 337 84,287,500
(Source: Annual Report of PPN Ternate, 2009)
Table 4.2-38 Ice blocks supplied by private ice making factories, 2008 - 2009 YEAR OF 2008 YEAR OF 2009 VOL (Ton) VALUE (IDR) VOL (Ton) VALUE (IDR)
Amount 5,467 1,858,780,000 5,630 1,463,800,000
(Source: Annual Report of PPN Ternate, 2009)

108
The income of PPN Ternate during the last two years can be seen in the following table.
Table 4.2-39 Revenues in PPN Ternate, 2008-2009 RECEPTION RECEPTION
NO. TYPE OF INCOME (IDR.) (IDR.) 2008 2009
I. GENERAL RECEPTION 29,364,562 8,711,091 1. Officer House Rental 3,614,941 3,516,480 2. The return of the remaining
contract 25,749,621 5,192,500
II. FUNCTIONAL RECEPTION 449,012,790 459,527,988 1. Workshop Services 22,255,000 28,930,000 2. Sales of Water 61,514,500 65,168,374 3. Sales of Ice 92,480,000 84,287,500 4. Cold Storage Rental 54,500,000 58,000,000 5. Cool Box Rental 2,760,000 2,300,000 6. Parking Charges 20,905,000 23,583,000 7. Tank Rental 1,905,000 1,140,000 8. Land Rental 4,423,300 11,035,354 9. Toilets Rent 14,642,000 14,925,000 10. Storage Rental 11,875,000 9,029,000 11. Stacking Places Rental 2,384,000 2,023,000 12. Mooring Services > 10 GT 69,582,000 72,453,000 13. Mooring Services < 10 GT 20,811,000 21,509,000 14. Electric Services 62,723,990 59,075,760 15. Fish Sales Place Rental 6,252,000 6,069,000 Amount of I + II 478,377,352 468,235,075
(Source: Annual Report of PPN Ternate, 2009)
The current condition of the fishing port facilities is shown in the following figures.
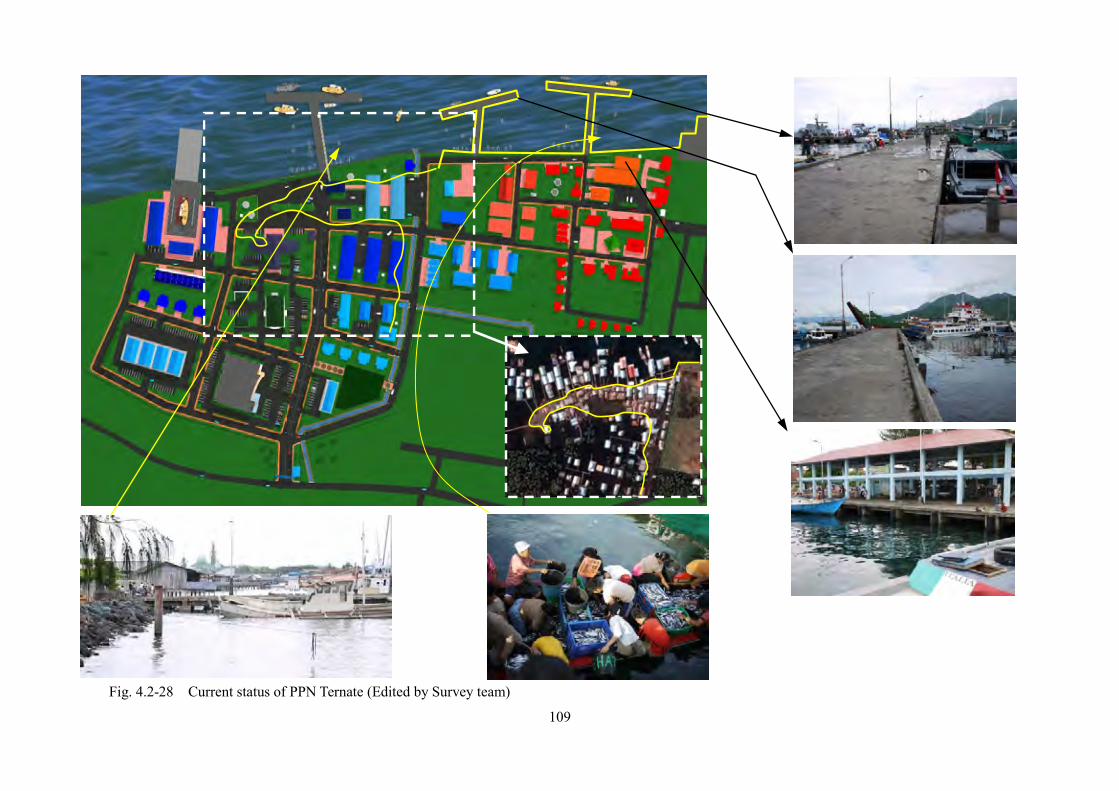
109
Fig. 4.2-28 Current status of PPN Ternate (Edited by Survey team)
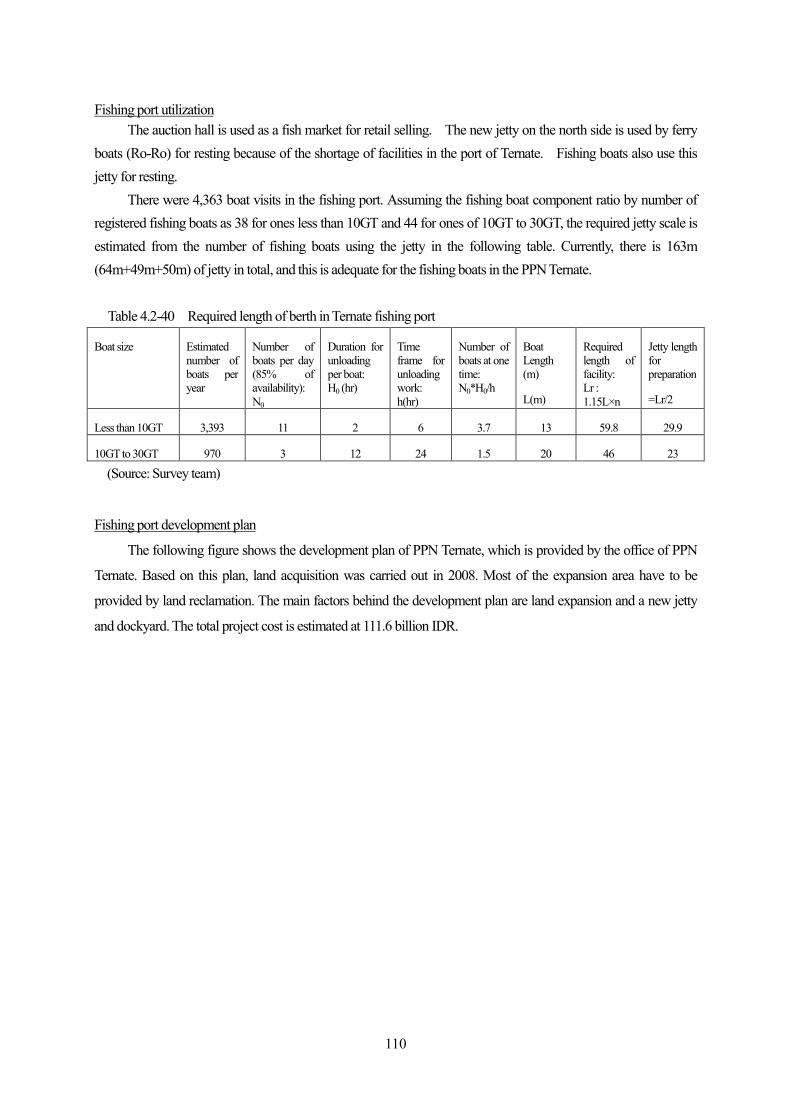
110
Fishing port utilization The auction hall is used as a fish market for retail selling. The new jetty on the north side is used by ferry
boats (Ro-Ro) for resting because of the shortage of facilities in the port of Ternate. Fishing boats also use this jetty for resting.
There were 4,363 boat visits in the fishing port. Assuming the fishing boat component ratio by number of registered fishing boats as 38 for ones less than 10GT and 44 for ones of 10GT to 30GT, the required jetty scale is estimated from the number of fishing boats using the jetty in the following table. Currently, there is 163m (64m+49m+50m) of jetty in total, and this is adequate for the fishing boats in the PPN Ternate.
Table 4.2-40 Required length of berth in Ternate fishing port
Boat size Estimated number of boats per year
Number of boats per day (85% of availability): N0
Duration for unloading per boat: H0 (hr)
Time frame for unloading work: h(hr)
Number of boats at one time: N0*H0/h
Boat Length (m)
L(m)
Required length of facility: Lr : 1.15L×n
Jetty length for preparation
=Lr/2
Less than 10GT 3,393 11 2 6 3.7 13 59.8 29.9
10GT to 30GT 970 3 12 24 1.5 20 46 23
(Source: Survey team)
Fishing port development plan
The following figure shows the development plan of PPN Ternate, which is provided by the office of PPN
Ternate. Based on this plan, land acquisition was carried out in 2008. Most of the expansion area have to be
provided by land reclamation. The main factors behind the development plan are land expansion and a new jetty
and dockyard. The total project cost is estimated at 111.6 billion IDR.

111
Fig. 4.2-29 Development plan of PPN Ternate (Edited by Survey team)
Table 4.2-41 Cost estimation of PPN Ternate development Annual task Cost (IDR) Remarks
Total Cost 111,622,970,130 2011 43,232,851,350
Detail design Engineering design of revetment Land reclamation Revetment construction
Drainage Repair of cold storage, etc.
500,000,000 100,000,000
32,914,385,350 5,206,398,000 1,344,833,000
245,000m3
2012 8,886,749,021 Road works Administration office Gate Guard post Park
4,083,596,022 3,643,942,998
475,458,000 248,752,000 435,000,000
9,028m2 With 2 floors760m2
42m2
2013 6,303,056,009 Road pavement Parking Water tank Fuel tank Electricity Fuel supply
978,056,009 325,000,000 425,000,000 875,000,000
2,500,000,000 1,200,000,000
4,288m2
2014 53,200,313,750 Jetty Access jetty Kiosk Auction hall Warehouse
34,400,000,000 15,750,000,000
585,000,000 1,272,420,000 1,192,893,000
800m2 450m2 150m2 320m2 300m2
(Source: PPN Ternate)

112
(7) TUAL
① Maluku Region The PPN Tual fishing port is located in Tual City, Maluku Province, which covers 632 islands. This
province is bordered by North Maluku Province to the north, Timor Leste and Australia State to the south, Southeast Sulawesi and Central Sulawesi Province to the west, and West Papua Province to the east. There are 10 fishing ports in Maluku Province, consisting of 2 type-B ports (PPN) and 8 type-D ports (PPI).
The total population of Maluku is 1,440,014. The population is concentrated in Central Maluku (25.62%), Ambon (19.53%) and the west part of Seram (11.04%). (Statistics of Maluku Province, 2009)
Fig. 4.2-30 Location of PPN Tual fishing port (Edited by Survey team)
② Fishery in Maluku Region
There are two PPN and eight PPI in Maluku Province. Tual is in the Kei Islands located southeast of
Ambon, the capital city of Maluku Province.
The fishery production volume in 2008 amounted to 403,081 tons, consisting of capture fisheries which produced
384,543 tons (95.40%), and aquaculture, which produced 18,537 tons (4.60%). The capture fisheries sector is
still dominating total fishery production volume. The most dominating types of fishing gear used by the fishers
in Maluku Province are boat seine, purse seine, gillnet, lift net, drift long line, set bottom long line, troll line, and
hand line.
Table 4.2-42 Volume of fishery production in Maluku Province, 2006-2008
Type of Fisheries Year
2006 2007 2008
Capture Fisheries 488,090.6 491,550.7 384,543.9
- Marine capture 488,090.6 491,550.7 384,543.9
- Inland capture - - -
Aquaculture 3,592.1 17,824,2 18,537.1
- Marine aquaculture 2,992.7 17,569.3 18,270.9
PPN Tual

113
Type of Fisheries Year
2006 2007 2008
- Brackish water aquaculture 482.4 121.3 126,2
- Freshwater Aquaculture 117.0 133.6 140.0 (Source: Statistics of Maluku Province, 2009)
③ Fishery Resources
The provincial borders are all surrounded by sea. The seawater area of Maluku consists of three main seas:
the Banda Sea, Ceram Sea, and Arafura Sea. According to the National Commission for Stock Assessment
(PRPT FKPPS2008), the three FMAs possess the fishery resources potential amounting to 311,900 tons/year
(FMA 714), 324,900 tons/year (FMA 715), and 385,700 tons/year (FMA 718).
Assuming that the total area of seawater in Maluku consists of 100% FMA 714, 20% FMA 715, and 30%
FMA 718, and assuming that the fish are distributed equally, it is roughly estimated that the fishery resources
potential in Maluku Province amounts to 627,579 tons/year.
④ Fisheries in Tual
The fishery resources are rich in marine areas near the site, and therefore private fishing companies are
highly interested in the areas. A large-scale private fishing complex and local small-scale fishers are active in
marine capture fisheries.
The most dominant types of fishing gear in Southeast Maluku District, including Tual City, are hand line,
purse seine, drift gill net, and portable trap. The targets are bottom fish and squid, and in Bagan it is anchovy.
Though seaweed culture has increased in Tual, fishers have been continuing capture fisheries. Fishers live
mainly on the western coast of Kai Kecil Island; around 5,000 fishers are there. A total of 14 fisher’s Kelompoks
and 72 seaweed farmer’s Kelompoks exist, and Tual City provides provisional and technical support to these
groups. Some fishers make contracts with large-scale middlemen. Their boats are 4-5GT. Generally, small-scale
fishers are dominant in Tual.
Generally, there are three types of fishing boats/vessels operated by Maluku fishers, namely non-powered
boats, outboard motor boats, and inboard motor boats. The total number of fishing boats in Southeast Maluku,
including Tual, in 2008 was 5,101 and the dominating type was non-powered boats, amounting to 4,352 (85.3%).
Table4.2-43 Number of fishing boats in the Southeast Maluku District, including Tual City
Category of Vessel Year
2005 2006 2007 2008
With non-powered boat 2,093 7,535 5,351 4,352 With outboard motor 167 505 906 701
With inboard motor 170 228 153 48
Total 2,330 8,268 6,410 5,101 (Source: Statistics of Southeast Maluku District, 2010)

114
Bipolarization has been proceeding between local traditional fishing boats and large commercial fishing
vessels. The number of fishing vessels utilizing Tual fishing port has decreased drastically since 2007. In 2009,
only 30 boats used the fishing port. According to the interviews, there was an inspection by the authorities to the
fishing port area to check for IUU fishing, and port users seem to be still sensitive about the incident.
There were 38,666 fishers in Maluku Province in 2008. The number of fishers in Southeast Maluku
District, including Tual City, is shown in the following table.
Table 4.2-44 Number of fishers in the Southeast Maluku District, including Tual City
Year Number of Fishers Number of Fishers’
Groups
2005 15,475 553
2006 15,600 575
2007 15,675 625
2008 8,384 764
(Source: Statistics of Southeast Maluku District, 2009)
⑤ Fish Distribution and Processing
Small-scale fishers can sell their fish to anybody who offers a better price since they are not generally bound
by middlemen. There are many fishers who make contracts with middlemen to ship fish to Surabaya.
In Tual, one big company, which owns fishing vessels and fish carrier vessels, exports directly to China by
using its own vessels. There are fish suppliers for large-consumption cities and regions such as Jakarta and Bali,
small-scale capture fisheries for local markets, seaweed culture, and pearl culture in addition to the
abovementioned big company.
The port of Tual (managed by the Ministry), which is located 3 km from the center of Tual city, provides
cargo and container services, as well as ferry services. Fishery products are transported by large-scale
middlemen to Surabaya using reefer containers without entering Ambon . They buy fish mainly from small-
scale fishers.
Foreign vessels from Thailand, Korea, and Taiwan, which used to utilize Tual Fishing Port before 2007,
have never returned. At present, large fishing boats and carry boats have changed their landing base to PPS Bitun
and/or PPN Ambon. On the other hand, the carry boats which are chartered by processors come to load fish
every 3-4 months and carry the fish to Taiwan.
Fishery products, which are consumed locally by 100,000 people in Central Maluku District and 60,000
people in Tual City, are unloaded at the markets of Ohojan and Langur by small-scale fishers. Usually,
middlemen lead the fish dealing. Fish fillet and frozen fish are the main processed fish at this site. Using ice is
popular to keep the catches fresh. Middlemen know how to maintain the quality of the fish from their individual
experience.
Small to middle-scale frozen fish processors mainly buy fish from small-scale fishers directly. There are
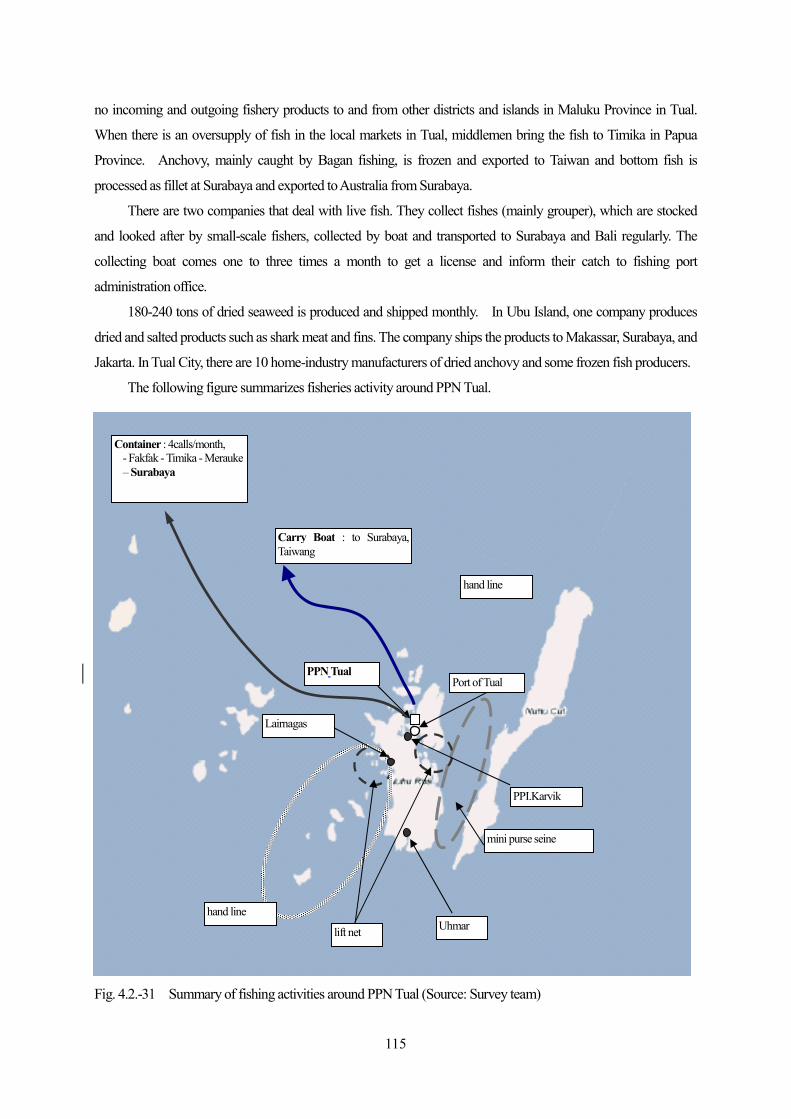
115
no incoming and outgoing fishery products to and from other districts and islands in Maluku Province in Tual.
When there is an oversupply of fish in the local markets in Tual, middlemen bring the fish to Timika in Papua
Province. Anchovy, mainly caught by Bagan fishing, is frozen and exported to Taiwan and bottom fish is
processed as fillet at Surabaya and exported to Australia from Surabaya.
There are two companies that deal with live fish. They collect fishes (mainly grouper), which are stocked
and looked after by small-scale fishers, collected by boat and transported to Surabaya and Bali regularly. The
collecting boat comes one to three times a month to get a license and inform their catch to fishing port
administration office.
180-240 tons of dried seaweed is produced and shipped monthly. In Ubu Island, one company produces
dried and salted products such as shark meat and fins. The company ships the products to Makassar, Surabaya, and
Jakarta. In Tual City, there are 10 home-industry manufacturers of dried anchovy and some frozen fish producers.
The following figure summarizes fisheries activity around PPN Tual.
Fig. 4.2.-31 Summary of fishing activities around PPN Tual (Source: Survey team)
hand line
PPN Tual
Lairnagas
mini purse seine
hand line
lift net
PPI.Karvik
Port of Tual
Uhmar
Carry Boat : to Surabaya, Taiwang
Container : 4calls/month, - Fakfak - Timika - Merauke – Surabaya

116
⑥ Fishing Port Development
The development plan is to upgrade PPN Fishing Port (Type B) to PPS Fishing Port (Type A) as the
preliminary information describes. The central government manages the port. Since the plan for the upgrading
exists, the land had already been secured. The property of airport, which used by private air carrier at present, is the
Air Force of Indonesia. Thus , a new airport is now being constructed. Also, the commercial port is not managed
by a state-owned port company and is directly controlled by the central government. It is one of the characteristics
of Tual areas to see the supporting system under the direct control of the central government.
The administrative authority of PPN Tual employs 46 people, consisting of 26 permanent employees, and
20 temporary employees.
The main facilities of Tual fishing port are as follows:
Table 4.2-45 Main facilities of PPN Tual Name of Facility Dimension Remarks
Fishing port area 11ha, 5ha is used Field 10ha 1 RC Jetty L=136m, A=1,056 m2,
6-10m deep
Trestle 306m2 2 POS Jetty Complex road 9,819m2 3 Fuel supply 5 Navigation tower 1 unit 4, 6 Fuel supply PT. GETRA MITRA USAHA, 135m3 7 Water supply 1 unit 8, 9 Fuel supply PT. NINI GERHANA 10 Water tank 1 unit 11 Auction hall (TPI) PT. PUSAKA BAHARI, 450m2 12 Net repair/ Workshop PT. PUSAKA BAHARI, 450m2 13 Workshop 34m2 14 Public Toilet 15, 16 Electricity 40KVA、108m2 17 Laboratory m2 18 Meeting house 591m2 19 Administration house 550m2 20 MESS KALEBUH 21 Shop 22 Housing
(Source: Survey team)

117
Fig. 4.2-32 Panoramic view of PPN Tual (Source: Survey team)
Fig. 4.2-33 Current facilities of PPN Tual (Source: Survey team)
① ② ③
① Patrol boat, ② seized Korean boat, ③ stopped boats (by business failure)

118
In 2007, in response to the shortage of jetties and improvement of the ability for fish handling, the development plan was discussed. The main items were a jetty of 300m, repair dock, land expansion and ice factory.
Fig. 4.2-34 Development Plan of PPN Tual (Source: PPN Tual)

119
4.3 A summary of the survey results
4.3.1 Site specific fishing port development plans and their issues
(1) Development plan of seven (7) sites
As a result of this survey on the seven selected outer ring fishing ports, the development plan of each site are
summarized in the following table. Here, in the site survey, SWOT analysis on the development plan was carried
out to take into consideration the characteristics, current situation and problems of each site properly, based on
discussions with those involved. However, details of the SWOT analysis were left out since they were used as one
of the investigative approaches; the results are reflected in the following table.
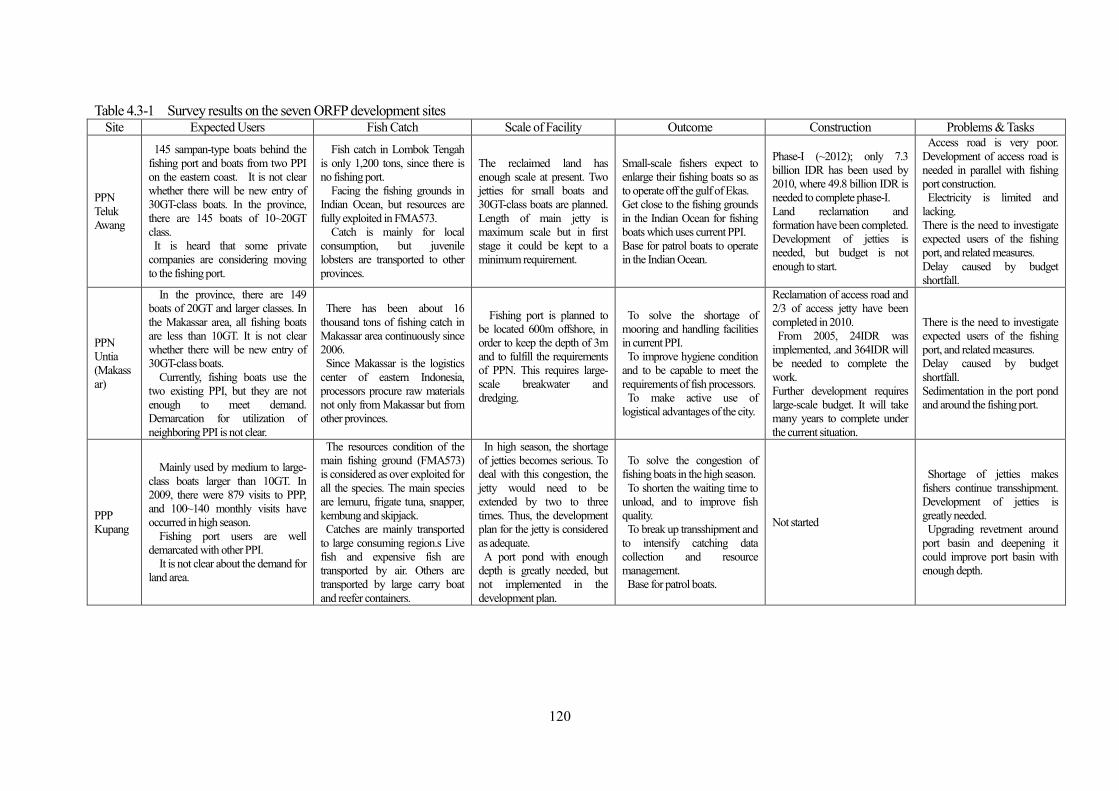
120
Table 4.3-1 Survey results on the seven ORFP development sites Site Expected Users Fish Catch Scale of Facility Outcome Construction Problems & Tasks
PPN Teluk Awang
145 sampan-type boats behind the fishing port and boats from two PPI on the eastern coast. It is not clear whether there will be new entry of 30GT-class boats. In the province, there are 145 boats of 10~20GT class. It is heard that some private
companies are considering moving to the fishing port.
Fish catch in Lombok Tengah is only 1,200 tons, since there is no fishing port.
Facing the fishing grounds in Indian Ocean, but resources are fully exploited in FMA573.
Catch is mainly for local consumption, but juvenile lobsters are transported to other provinces.
The reclaimed land has enough scale at present. Two jetties for small boats and 30GT-class boats are planned. Length of main jetty is maximum scale but in first stage it could be kept to a minimum requirement.
Small-scale fishers expect to enlarge their fishing boats so as to operate off the gulf of Ekas. Get close to the fishing grounds in the Indian Ocean for fishing boats which uses current PPI. Base for patrol boats to operate in the Indian Ocean.
Phase-I (~2012); only 7.3 billion IDR has been used by 2010, where 49.8 billion IDR is needed to complete phase-I. Land reclamation and formation have been completed. Development of jetties is needed, but budget is not enough to start.
Access road is very poor. Development of access road is needed in parallel with fishing port construction. Electricity is limited and lacking. There is the need to investigate expected users of the fishing port, and related measures. Delay caused by budget shortfall.
PPN Untia (Makassar)
In the province, there are 149 boats of 20GT and larger classes. In the Makassar area, all fishing boats are less than 10GT. It is not clear whether there will be new entry of 30GT-class boats.
Currently, fishing boats use the two existing PPI, but they are not enough to meet demand. Demarcation for utilization of neighboring PPI is not clear.
There has been about 16 thousand tons of fishing catch in Makassar area continuously since 2006. Since Makassar is the logistics
center of eastern Indonesia, processors procure raw materials not only from Makassar but from other provinces.
Fishing port is planned to be located 600m offshore, in order to keep the depth of 3m and to fulfill the requirements of PPN. This requires large- scale breakwater and dredging.
To solve the shortage of mooring and handling facilities in current PPI. To improve hygiene condition and to be capable to meet the requirements of fish processors. To make active use of logistical advantages of the city.
Reclamation of access road and 2/3 of access jetty have been completed in 2010. From 2005, 24IDR was implemented, .and 364IDR will be needed to complete the work. Further development requires large-scale budget. It will take many years to complete under the current situation.
There is the need to investigate expected users of the fishing port, and related measures. Delay caused by budget shortfall. Sedimentation in the port pond and around the fishing port.
PPP Kupang
Mainly used by medium to large- class boats larger than 10GT. In 2009, there were 879 visits to PPP, and 100~140 monthly visits have occurred in high season.
Fishing port users are well demarcated with other PPI.
It is not clear about the demand for land area.
The resources condition of the main fishing ground (FMA573) is considered as over exploited for all the species. The main species are lemuru, frigate tuna, snapper, kembung and skipjack. Catches are mainly transported
to large consuming region.s Live fish and expensive fish are transported by air. Others are transported by large carry boat and reefer containers.
In high season, the shortage of jetties becomes serious. To deal with this congestion, the jetty would need to be extended by two to three times. Thus, the development plan for the jetty is considered as adequate. A port pond with enough depth is greatly needed, but not implemented in the development plan.
To solve the congestion of fishing boats in the high season. To shorten the waiting time to
unload, and to improve fish quality. To break up transshipment and
to intensify catching data collection and resource management. Base for patrol boats.
Not started
Shortage of jetties makes fishers continue transshipment. Development of jetties is greatly needed. Upgrading revetment around
port basin and deepening it could improve port basin with enough depth.

121
Continued from Table 4.3-1 Survey results on the seven ORFP development sites Site Expected Users Fish Catch Scale of Facility Outcome Construction Problems & Tasks
PPN Nunukan
Outboard engine boats are dominant, as well as inboard engine boats less than 5GT. It is not clear whether there will be a new entry of 30GT-class boats. Most of the fishers live in Sabatik Is. near Nunukan, which is about one or two hours from the project site.
The resources condition of main fishing ground (FMA716) is considered as over exploited in regards to large pelagic fish, and others are unknown. Since the main target species is anchovy here, resource would still be available. Most of catches are for outer regions such as Tarakan and Tawau.
Minimum scale jetty is planned as PPN.
To be an inter-regional and export shipment base. To intensify fishing data collection system and resource management. To be a fishing base for border
area and support safe and stable fishing activities. Base for patrol boats.
Construction work started in 2005. But trouble occurred in construction of the trestle. Recovery work is under way at present. Modification of the development plan is being investigated at present (T-shape jetty to be arranged into another shape.)
There is the need to investigate expected users of the fishing port, and related measures. Effectiveness of administrative direction for Sebatik fishers to use new fishing port. Inadequate execution work would cause foundation problems
PPS Bitung
PPS is used by both small-scale boats and large commercial fishing boats (21,000 visits per year). Not only large boats but also
small-scale fishers provide fish to processors.
Skipjack and scad are dominant and tuna (long tail, albacore, yellow fin, big eye) comes next. Many other species are caught as well. The resource condition of Celebes Sea (FMA716), it is considered as overexploited for large pelagic fish, and others are unknown. In the Maluk Sea (FMA715), large pelagic fish are over exploited and others are moderate.
The development plan for the jetty is adequate, compared to the required jetty length based on the calculation of the current number of boats and visits for small boats. And it would be also improved for large-scale boats, but some congestion for preparing for development work would occur.
To shorten the waiting time to unload, and to improve fish quality for both large-scale and small-scale fishing boats. To halter additional private
jetty enhancement and to consolidate fishing catch at the fishing port. To provide hygienic conditions in the fishing port and to be capable of meeting processors’ requirements.
Construction already started. Land reclamation will be completed in 2010. And continuous construction work on the jetty is planned to be completed in 2012 with 27 billion IDR of APBN.
It is difficult to expand further from current development plan, because land space is limited. Demarcation between neighboring Perikanan Nusantara. The sun shade roof is working
well. And further development might be considered to improve hygienic conditions.
PPN Ternate
Demarcation for utilization of neighboring PPI is not clear. At present, there is no critical shortage of facilities.
Skip jack, tuna and scad are the dominant species. Share the fishing ground in the Molucca Sea with Bitung. Catches are transported by chartered carry boats and reefer containers.
The scale of existing jetty is adequate, compared to the required jetty length (160m) based on the calculation of the current number of boats and visits.
There is a sufficient room for jetties to accept cargo ships but a shortage of commercial port facilities. Thus, the jetties would be capable of handling fishing boats.
Total cost for the development is estimated at 111.6 billion IDR. Land acquisition is completed. But there is no prospect for the commencement of construction.
There is the need to investigate expected users of the fishing port, and development plan. Demarcation between neighboring PPI is to be investigated.
PPN Tual
Number of boat visits in 2009 was only 30 and no fish catch was landed on the fishing port. Currently, it is supposed that large commercial fishing boats are using Ambon and Bitung fishing ports.
Commercial fishery is keen on the resources in the region. There is one large company undertaking fishing and processing with a large fishery complex base in Tual.
Before 2007, many large fishing boats including foreign boats entered PPN Tual. Under these conditions, demand for fishing port facilities was high.
There is land for expansion. But there is no prospect for the commencement of construction.
The most important issue is to normalize the current situation that there is little exploitation by fishing boats. Inter-regional demarcation against Ambon and Bitung about large fishing boats

122
(2) Review of the ORFP development plan at seven (7) sites
1) Appointment of Outer Ring Fishing Ports for Development
① There were some comments in the interview about the basis of selection for the seven Outer Ring
Fishing Ports and the objectives, and that the idea was not shared comprehensively within MMAF for
example,“Untia could not be recognized as ORFP because of its location in the archipelago.”, “PPI
Morotai should be selected as ORFP instead of Ternate.” However, MMAF confirmed that the current
policy of ORFP development will not be changed.
② About Untia/Makassar fishing port, the basis behind its selection for ORFP is to develop a
stronghold fishing port in Makassar, which is a logistics and economic gateway in the eastern part of
Indonesia, similar to the Jakarta fishing port. Thus, it would be required to assess it from a different
point of view from other ORFP.
③ There has been no fish landing activity since 2008 in PPN Tual fishing port because of the incident
in late 2007. ORFP development should be discussed resolving this situation.
2) Planning of the Development of Each Fishing Port
① Classification of fishing ports is determined by the maximum allowable resources to utilize. The
size and dimensions of each facility are determined not by the current utilization and future demand,
current situation and outlook of fisheries sectors, but mainly by the definition of PPN and PPS.
Therefore, the scale of planned facilities tends to exceed current and also future demands.
② Especially in the case of new fishing port development (Teluk Awang, Nunukan, Untia), it has not
been discussed specifically about the users of the facilities. Therefore, problems might occur regarding
usefulness.
③ In Nunukan, which is a newly constructed fishing port, it is said that the government will force the
fishers in Sebatik to utilize the new fishing port through administrative directions. The effectiveness
and affect of this measure should be carefully considered.
④ Demarcation for utilization of neighboring PPI is not clear in Untia and Ternate. And information
sharing is not enough between the parties involved. Thus, it is a concern that the objectives, function
and stakeholders might overlap between neighboring fishing ports.
⑤ It is important to clear the way to develop an access road and electricity supply to Awang village.
3) Implementation of the Development Plan
① A shortage of funding has delayed the project in some fishing ports. In Teluk Awang, the
administrative office is not able to start construction of the main facilities such as the jetty, instead, only
the construction of small facilities has been carried out in recent years. In Untia, it will take a long time
to complete the main facilities because of their large-scale under the current funding situation.
② Because of the shortage of funding, construction in Nunukan was carried out without consulting
123
experts, resulting in serious problems in the construction work.
③ Repeated jurisdiction-related handovers might cause mix ups and a crossing of paths during the
implementation of the project.
4.3.2 Necessary considerations in appraising the support for the ORFP development
The study team examined items to be considered for supports based on the following “Table
4.3-2. List of 7 sites conditions”. Those items are ①Fitness of natural conditions, ②Posibbility of
fishery business development, ③Remote areas(boarder areas, archipelagic areas etc.),④Potential for
the regional development, ⑤Possibility of alleviation of threatening on conflict and peace & order, ⑥
Issues.
Results of the examination describes in the order of (1)Teluk Awang, (2)Makassar, (3)Kupang,
(4)Nunukan, (5)Bitung, (6)Ternate, and (7)Tual in the following page.
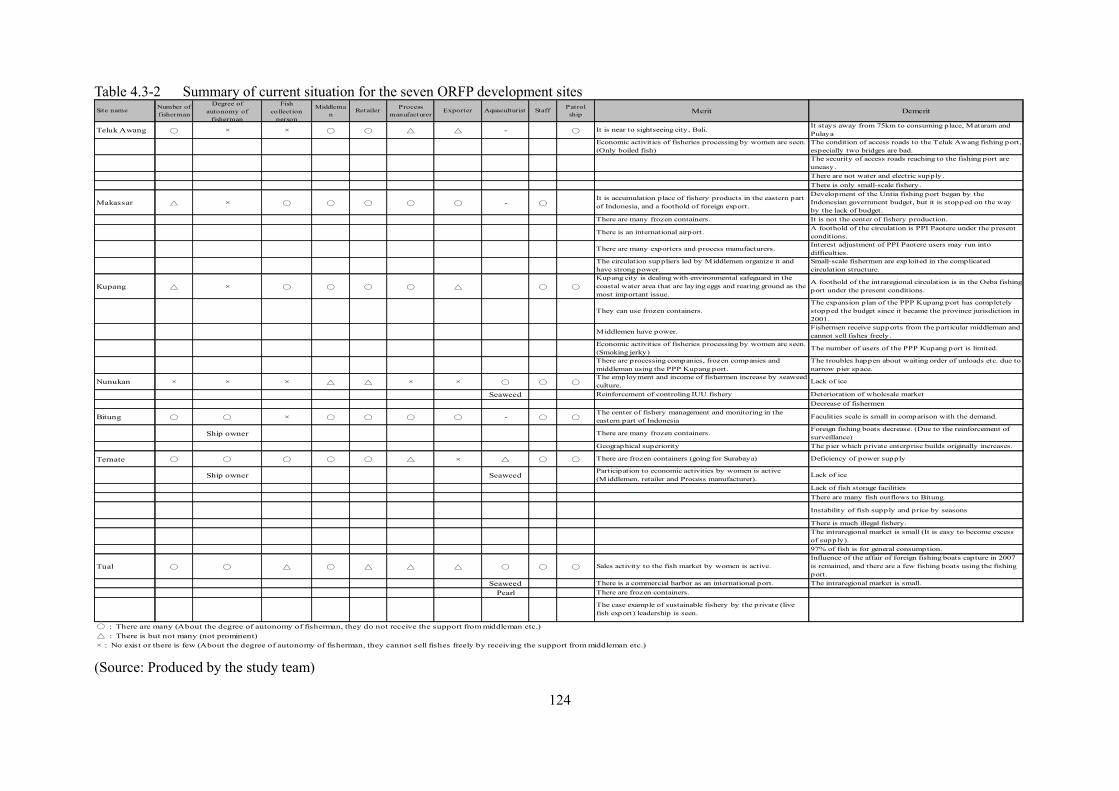
124
Table 4.3-2 Summary of current situation for the seven ORFP development sites Site name Number of
fisherman
Degree ofautonomy of
fisherman
Fishcollect ion
person
Middleman
Retailer Processmanufacturer
Exporter Aquaculturist Staff Patrolship Merit Demerit
Teluk Awang ○ × × ○ ○ △ △ - ○ It is near to sightseeing city, Bali.It stays away from 75km to consuming place, Mataram andPulaya
Economic activities of fisheries processing by women are seen.(Only boiled fish)
The condition of access roads to the Teluk Awang fishing port,especially two bridges are bad.The security of access roads reaching to the fishing port areuneasy.There are not water and electric supply.There is only small-scale fishery.
Makassar △ × ○ ○ ○ ○ ○ - ○It is accumulation place of fishery products in the eastern partof Indonesia, and a foothold of foreign export.
Development of the Untia fishing port began by theIndonesian government budget, but it is stopped on the wayby the lack of budget.
There are many frozen containers. It is not the center of fishery production.
There is an international airport. A foothold of the circulation is PPI Paotere under the presentconditions.
There are many exporters and process manufacturers.Interest adjustment of PPI Paotere users may run intodifficulties.
The circulation suppliers led by Middlemen organize it andhave strong power.
Small-scale fishermen are exploited in the complicatedcirculation structure.
Kupang △ × ○ ○ ○ ○ △ ○ ○
Kupang city is dealing with environmental safeguard in thecoastal water area that are laying eggs and rearing ground as themost important issue.
A foothold of the intraregional circulation is in the Oeba fishingport under the present conditions.
They can use frozen containers.The expansion plan of the PPP Kupang port has completelystopped the budget since it became the province jurisdiction in2001.
Middlemen have power.Fishermen receive supports from the particular middleman andcannot sell fishes freely.
Economic activities of fisheries processing by women are seen.(Smoking jerky)
The number of users of the PPP Kupang port is limited.
There are processing companies, frozen companies andmiddleman using the PPP Kupang port.
The troubles happen about waiting order of unloads etc. due tonarrow pier space.
Nunukan × × × △ △ × × ○ ○ ○The employment and income of fishermen increase by seaweedculture.
Lack of ice
Seaweed Reinforcement of controling IUU fishery Deterioration of wholesale marketDecrease of fishermen
Bitung ○ ○ × ○ ○ ○ ○ - ○ ○The center of fishery management and monitoring in theeastern part of Indonesia
Faculities scale is small in comparison with the demand.
Ship owner There are many frozen containers.Foreign fishing boats decrease. (Due to the reinforcement ofsurveillance)
Geographical superiority The pier which private enterprise builds originally increases.
Ternate ○ ○ ○ ○ ○ △ × △ ○ ○ There are frozen containers (going for Surabaya) Deficiency of power supply
Ship owner SeaweedParticipation to economic activities by women is active(Middlemen, retailer and Process manufacturer).
Lack of ice
Lack of fish storage facilitiesThere are many fish outflows to Bitung.
Instability of fish supply and price by seasons
There is much illegal fishery.The intraregional market is small (It is easy to become excessof supply).97% of fish is for general consumption.
Tual ○ ○ △ ○ △ △ △ ○ ○ ○ Sales activity to the fish market by women is active.Influence of the affair of foreign fishing boats capture in 2007is remained, and there are a few fishing boats using the fishingport.
Seaweed There is a commercial harbor as an international port. The intraregional market is small.Pearl There are frozen containers.
The case example of sustainable fishery by the private (livefish export) leadership is seen.
○:There are many (About the degree of autonomy of fisherman, they do not receive the support from middleman etc.)△:There is but not many (not prominent)×:No exist or there is few (About the degree of autonomy of fisherman, they cannot sell fishes freely by receiving the support from middleman etc.) (Source: Produced by the study team)
125
The criteria that should be considered upon examination of priorities for support of the selection of
outer-ring fishing ports are described below.
Criteria that should be considered upon examination
①Appropriateness of natural conditions, ②Possibility of fishery business development, ③Remote areas
(boarder areas, archipelagic areas, etc.), ④Potential for regional development, ⑤Possibility of alleviation of
threat to peace and social order, ⑥Issues.
(1) Teluk Awang
①Appropriateness of natural conditions
1) Natural conditions
Wave conditions: The location is inside Awang Bay. The western side of Ekas Bay connects to the Indian Ocean.
Waves from the Indian Ocean have little impact; therefore the fishing port is sufficient in calm conditions.
Topography and water depth: Since the location is in a reef-shaped lagoon, the mooring facility is positioned
off-shore in order to secure a water depth of 3m. There is no large river near by. The beach bottom profile is
medium sandy and good for foundation. A cape extending to the south of the fishing port might prevent the
invasion of sand from the south side and outflow of sand from the nearest points of the fishing port. No negative
signs were observed such as a change of erosion or sedimentation of neighboring beaches caused by land
reclamation of the fishing port.
Water quality: At present, only household effluence from Awang village could be a negative environmental
factor in the neighboring sea area. Since the village is small, the transparency of marine water there is currently
very good. Generally, when the fishing port is in use, drainage water is generated from fish stock rooms on vessels,
water used to wash the quays, fish handling facilities, and drainage from primary processing and washing of the
catch, etc. It doesn’t appear that this site has suffered too badly from such problems in comparison to the other
existing fishing ports. Seaweed culture exists in Ekas Bay. Therefore, it is important to consider how to treat
drainage from the fishing port over the long term in order to prevent deterioration in the water quality. It is
important to monitor the sanitary environment near the fishing port if the authorities are going to consider the
fishing port as tourism resource in the future.
2) Geographical conditions
Transportation: At present, 2 roads lead to the site. The roads, which connect with Prya, the capital city, and
Mataram via Kuta village on the south coast of Lombok Island, are in poor condition between Kuta village and the
site due to bad construction. Two poorly built bridges near the site on the route north to Prya need to be repaired. It
takes about 3 hours by car to reach Mataram.
Distribution: There is a regular ferry service from Mataram to Bali Island, a major consumption area.
Construction of a new airport is planned between Prya and Kuta village. When the new airport is in operation,
owing to its proximity to the fishing port, the handling of live fish is expected to increase. However, transportation
126
using containers from Lombok Island is difficult.
Fisheries and capture fisheries: At present, most of the artisanal fishing boats are sampan-type boats with
out-board engines; they are operating only in Ekas Bay. Since the location is closer to the Indian Ocean than to the
existing fishing port, it would appear to be advantageous if larger fishing vessels/boats can utilize the port.
Although the utilization of resources in the fishing ground by the artisanal fishing boats has almost reached its
limit; potential still exists for larger fishing vessels/boats in areas where underutilized fishery resources are
available.
②Possibility of fishery business development
Currently, home-industry-scale boiled processed fish produced by women in the fishing village of Teluk
Awang is available and a large-scale fish processor and exporter operates in Labuhan Lombok. Distribution to the
western coast of Lombok Island, a tourist spot and a high consumption area located near Bali Island, will become
easier if the access road to Teluk Awang is improved. Then the fishery business might develop.
③Remote areas (Boarder areas, archipelagic areas, etc.)
The site is located in the outer-ring area and faces the Indian Ocean.
④Potential for regional development
The number of households in the fishing village near the fishing port in Teluk Awang is about 300.
Upgrading the fishing port to PPN is questionable if these small-scale fishers will remain as the main users. To
promote a wider range of users, it is essential to improve the access road and water and electricity supplies as well
as settle the security problem as mentioned below.
⑤Possibility of alleviation of threat to peace and social order
Some people state the access road to Teluk Awang has nighttime security problems. Development is
expected to strengthen security.
⑥Issues
a) Careful confirmation regarding demand is necessary since 30GT fishing vessels, as users of the port, have not
yet been seen. About 300 fishers live in the village and less than 150 sampan-type fishing boats are actively using
the beach. These small-scale fishers require improved mooring and fish landing facilities. Thus, the order of the
development of facilities should be considered for the convenience of small-scale fishers.
b) At present, the supply of electricity to the village is limited to only public facilities. It is important to supply
sufficient electricity when the fishing port becomes PPN. Moreover, it is also necessary to expand the facilities to
secure a sufficient water supply.
c) Though there are two access roads to the fishing port, both are in a bad condition and there is a security problem.
On the north road to the fishing village of Teluk Awang, two bridges crossing a river running to the north of the
village are in very bad condition and dangerous to cross. The villagers have been repairing these bridges little by
little with their own money. The other road to Prya via Kuta was improved recently between Prya and Kuta, but a
12.5-kilometer stretch from Kuta to Teluk Awang is still in bad condition and has a security problem. Some
villagers advised us not to use this road when the study was being implemented.
127
d) The province owns fishing patrol vessels and the district has 3 fishing patrol vessels. Teluk Awang is ideally
located to oversee fishing activity in the Indian Ocean.
(2) Untia (Makassar)
①Appropriateness of natural conditions
1) Natural conditions
Wave conditions: As mentioned later, the fishing port is located about 600m off the coast, and there is no barrier
against waves from the Makassar Straight in the Java Sea. Therefore, in order to be able to optimally utilize the
mooring facilities, the breakwater should be improved.
Topography and water depth: The site is located in a shallow, flat lagoon behind some reefs. To attain adequate
depth, the fishing port is planned to be located about 600m off the coast, but it is still difficult to realize a depth of
3m. Thus, dredging is required. In order to keep the port basin calm enough and to prevent sand creeping into the
dredged basin, a breakwater, which will cover the port basin, is planned. For access to the fishing port, a road
460m in length built on reclaimed land and a pile-supported trestle are planned. Since the reclaimed road will
prevent the sedimentation along the shore, there is the possibility that accumulation will occur in the upstream side
and erosion in the downstream side.
Water quality: At present, the pollutant source is nearby domestic waste water. The fishing port is about 600m
offshore; therefore, it would not affect the water condition in the fishing port area. In future operations, pollutant
sources could be waste water from the fishing port such as that from the holds of ships, from the apron, from
processing and so on. Compared with other common fishing ports, the port basin is unique because of the
surrounding breakwater. Therefore, it should be noted that an accumulation of contaminator might occur inside the
breakwater. So drainage should be carefully considered.
2) Geographical conditions
Transportation: The fishing port is located about 20 minutes by car from downtown Makassar City. “KIMA” an
industrial zone where some fish processing factories operate is located near the site. Most of the catches landed at
Makassar are brought from archipelagic areas offshore from Makassar. Therefore, transportation of the catches to
the development site will be the same as transportation to the existing PPI from the point of view of convenience
of use.
Distribution: The port of Makassar is managed by PELINDO-IV. The port is an important base for distribution,
connecting eastern Indonesia to SurabayaI, which is the biggest marine transport base for commodity distribution
in Indonesia. In recent years, a sophisticated container terminal has been improved, being used for the
transportation of fishery products. Most of the regular routes for container vessels bound for eastern Indonesia pass
through Makassar. Also, many regular flights going to eastern Indonesia pass through Makassar. Fishery products
are often transported by air. Thus, Makassar is in a very important position, acting as a distribution base between
eastern Indonesia and Java Island, a high consumption area.
Fisheries and capture fisheries: The existing main fishing grounds are the Makassar Sea Strait and the Java Sea
128
near archipelagos in the offshore area of Makassar. There are no major fishing ports that can be used as bases for
fishing vessels and boats which utilize this marine area. Makassar, as an economic and distribution base, is not
fully utilized in the capture fisheries sector.
②Possibility of fishery business development
Makassar City is a base for fish distribution in eastern Indonesia. Since Untia is close to an industrial area,
greater export of fishery products is expected, utilizing the international commercial port and international fishing
port. However, under the existing conditions, most of the exports are transported by container from the
commercial port. The role of the fishing port in relation to exports is still a little doubtful. Fish suppliers in the
Makassar area utilize PPI. PPI plays a major role in fish loading for inter-regional distribution in Makassar and to
high consumption areas such as Jakarta, as well as exports, which are handled by middlemen who have some
power in the fish distribution process. It is difficult to predict how many users there will be of the improved fishing
port in Untia since the distance from PPI to Untia is about 10km. It is an urgent task to settle these issues before
making a management plan for the operation of the fishing port in Untia.
③Remote areas (Boarder areas, archipelagic areas, etc.)
This site is not categorized as “outer-ring”, but it is positioned to support the activities of outer-ring fishing
ports in eastern Indonesia.
④Potential for regional development
As mentioned above②, the development potential of Makassar as a base for fish distribution is
considerable.
⑤Possibility of alleviation of threat to peace and social order
There are no specific issues regarding conflict and peace and social order.
⑥Issues
a) It is reported that 149 fishing boats 20GT or bigger out of 12,015 fishing boats operate in South Sulawesi.
However, only fishing boats 10GT or less operate in the adjacent waters of Makassar. It is uncertain how much
demand there will be for 30GT fishing boats when the fishing port of PPN is constructed. It is necessary to
carefully confirm the demand as no users as yet have clearly been selected as the target.
b) In Paotere fishing port (PPI), the area and facilities of the quay are largely insufficient. Taking this fact into
consideration, the potential main users of Untia fishing port deem to be users of the PPI Paotere. It is important to
consider the scale of the facility based on the existing utilization of PPI.
c) Some users of Paotere fishing port mentioned that they don’t want to completely transfer from the existing PPI
near the city center to the new site. It is necessary to alter such users’ opinions and coordinate the role sharing
between Paotere fishing port and Untia fishing port when the latter will start to be used.
d) The new site is a very shallow beach in a lagoon. There is the possibility of sedimentation and/or erosion of the
nearby beach since the sea current along the shore line may change due to the new port. It is important to consider
such environmental impact.
e) In the existing construction, the piles are exposed several metres above the surface of the sea. This is dangerous
129
because of the lack of horizontal strength if there is not enough embeded length of the pile beneath the sea bottom.
f) Only IDR23.96 billion has been invested out of a total budget of IDR364.0 billion as of 2010. It will take a long
time to complete the facilities planned with the scale of the current budget.
(3) Kupang
①Appropriateness of natural conditions
1) Natural conditions
Wave conditions: Kupang is located near the narrow Sape Strait, and the waves are usually calm. At present,
mostly fishing boats larger than the 10GT class are using PPP Kupang. These fishing boats need a resting basin or
quay for resting and repairs because they cannot use beach. Even in Sape Strait it is sometimes difficult to moor at
the jetty in PPP Kupang, which is directly facing the strait, owing to the wind and wave conditions. Therefore, a
calm port basin, which can allow 10- to 30GT-class fishing boats to rest safely for a specific period, is greatly
needed in the fishing port.
Topography and water depth: The main jetty has enough depth, but another one is located in a very shallow
place in the lagoon and is only capable of handling small boats. The sea bottom consists of coral reef rocks and
sand, and the bottom topography is stable. There is a jetty owned by a fuel company at the south side of the PPP,
so any large-scale southward expansion needs to be carefully investigated. The land area of PPP is locating at the
bottom of a hill; therefore land use is limited and expansion is difficult. Thus, land reclamation is needed to expand
the current fishing port facilities.
Water quality: Pollutant sources could be waste water from the fishing port such as that from the holds of ships,
from the apron, from processing and so on. In the site survey, carried out during the low season, the sea water was
very clear and there was no waste garbage found on the bottom of the sea. Usually most of the fish is unloaded
packed in ice and/or frozen, so processing work is limited in the fishing port, and there is no auction, therefore the
most dominant pollutant would be washing water from the holds. On the other hand, large fishing boats could not
enter the port basin, so waste water could not be released into the port basin from them, keeping the water clean.
2) Geographical conditions
Transportation: It takes about 20 minutes by car to go to the fishing port from downtown Kupang City. Kupang
port, managed by PELINDO-III, is located next to the fishing port. Freezers and fish processors are in the fishing
port and the location is convenient for transportation by container. Since there are no facilities for fishing vessels
and boats to rest during the off-season, many fishing boats 30GT or bigger move to more remote areas, Bitung for
example, and rest there.
Distribution: Regular container vessels bound for Bali, Makassar, and Surabaya use the port of Kupang next to
Kupang fishing port. The catches can be transported by reefer containers. Live fish are transported by air.
Fisheries and capture fisheries: The main fishing grounds are the Flores Sea and the Indian Ocean (eastern part
of FMA573). The fishing port is a base for fishing boats that operate in the same fishing grounds. 78% of the
2,339 tons of exported fishery products in 2010 were shipped to Japan. It is said that utilization of the fishery
130
resources in the fishing grounds where artisanal fishing boats operate has reached its limit; however, there is still
potential to develop fishing operations carried out by bigger fishing vessels in areas where underutilized fishery
resources remain.
②Possibility of fishery business development
At present, PPI plays an important role as a base for fish distribution to the city of Kupang. The number of
users of the existing PPP Kupang fishing port is limited, however, there are sufficient number of fish processing
companies, frozen fish factories and middlemen who utilize the PPP fishing port. Thus, this figure will probably
increase if the handling area and jetties, which have sufficient depth and sufficient space, is improved.
Modernization of fishing boats, types of fishing gear and methods, and improvement of security countermeasures
are the points that must be solved for more effective functioning of the fishing port.
③Remote areas (Boarder areas, archipelagic areas, etc.)
Kupang City is located near the border with Timor Leste and Australia. Fishery products are also exported
to those countries.
④Potential for regional development
PPP Kupang fishing port is positioned in the southern outer-ring area of eastern Indonesia and the location
could be a new base for growth in the region.
⑤Possibility of alleviation of threat to peace and social order
There have been problems among fishing boats to secure space for mooring on the narrow jetty. Therefore,
it is deemed to be necessary to increase the space for mooring on the jetty.
⑥Issues
a) The jetty in the off-shore side, which is utilized by fishing vessels of 30GT or bigger, is insufficient in terms of
length. It takes 4-5 days for 10 fishing vessels to finish their work, which causes big problems. When a large
transportation vessel comes into the PPP fishing port, the quay is occupied for 4-5 days by the same vessel, so
other fishing boats are forced to wait off-shore until the quay becomes vacant.
b) Since there is no space for resting and anchoring, fishing boats go back to other fishing ports like Bitung to rest
and repair during the off-season. Expenses can be limited by transporting the crews only when necessary if fishing
vessels and boats can anchor in PPP Kupang.
(4) Nunukan
①Appropriateness of natural conditions
1) Natural conditions
Wave conditions: The site is facing the Sebatik Strait between Sebatik Island and Nunukan Island, providing
cover from waves, so the area is very calm.
Topography and water depth: The site is located in front of a mangrove swamp. The sea is mostly shallow near
the coast but becomes deep about 100m off the coast. The ground is silty and very soft. As the waves are calm and
there are no large rivers nearby, there would be a negligible effect on the coast caused by construction.

131
Water quality: At present, water pollutants are not found near the site. In future operations, the pollutant sources
could be waste water from the fishing port such as that from holds of ships, from the apron, from processing and
so on. Compared to other common fishing ports, there would be no specific difference and problems.
2) Geographical conditions
Transportation: The fishing port is 30-40 minutes by car from downtown Nunukan, where the commercial port
is located. Fishers’ houses constructed by the local government are near the fishing port. Most of the fishers engage
in seaweed aquaculture. The majority of the catch is caught by fishers who live in Sebatik Island. The site is 30-60
minutes from Sebatik Island. Sebatik Island is almost the same distance from Tawau in Malaysia, so the location is
advantageous for exports to this city.
Distribution: Nunukan Port, managed by PELINDO-IV, is in the city of Nunukan. Container transportation
started from April 2010. Extension of the landing strip at the airport is now under way. Jets airplane will be able to
operate from the air strip when the work is completed. A propeller airplane currently operates between Tarakan
and Nunukan.
Fisheries and capture fisheries: The main fishing ground is the western Selebes Sea (FMA716). Since there is
no major fishing port infrastructure in the western Selebes Sea, which borders with Malaysia in the north, a base
for the utilization and management of fishery resources and control of IUU fishing is greatly needed.
②Possibility of fishery business development
Currently, almost no fishers are in Nunukan, while approximately 1,000 fishers are in Sebatik Island located
near Nunukan. Fishers in Sebatik Island ship their catch to Tawau in Malaysia and Tarakan with financial and/or
physical support from many middlemen in Tarakan and a small number of middlemen in Nunukan. Fishers in
Sebatik Island have been turning to seaweed culture from capture fisheries and the number of fishers has been
decreasing. Taking these facts into consideration, the potential for business development in the fisheries sector of
Nunukan is deemed to be low. Comprehensive development in the border area is currently going on to settle the
above issue. Improvement of outer-ring fishing ports focusing on fishery resources is one of the important
development policies. It is expected that the improvement of outer-ring fishing ports will have a positive impact on
business development.
③Remote areas (Boarder areas, archipelagic areas, etc.)
The border with Malaysia passes Sebatik Island, located near Nunukan Island. Catches in Indonesian water
areas are transported to Tawau, a major base for fishery products in Malaysia. Many problems exist such as IUU
fishing by Malaysian fishing boats, Indonesian fishers and middlemen who ship their products illegally to Tawau
with the support of Malaysian distributors and so on. Therefore, the control system must be strengthened. The
scale of the market of Nunukan is small, since Nunukan Island is located in a low and damp area and is not
connected to any other areas in Nunukan District by any transportation. Thus, expectations for the economic
development of Nunukan Island are high through the creation of an outer-ring fishing port.
④Potential for regional development
As mentioned above ② and ③, the development potential in this region, which has no major industries, is

132
not considered to be high. Therefore, assistance from the central government for regional economic development
is a crucial task, and improvement of the fishing port is considered as the core part of this assistance.
⑤Possibility of alleviation of threat to peace and social order
As mentioned above ③, strengthening the control system to deal with IUU fishing boats from Malaysia, as
well as illegal exports, is a high priority. It is also an urgent task to improve the infrastructure to accommodate
patrol vessels and boats to combat the above issues.
⑥Issues
a) In the Nunukan area, most of the catches are from fishers in Sebatik Island and are sent to Tawau, Malaysia.
Also, a large quantity of catches landed at Tarakan are processed and exported to Tawau. In Tawau, fish are sold
for local consumption and are also exported to Hong Kong, Thailand, and Korea, etc. It is a key issue whether or
not fish distribution from Nunukan fishing port can remain competitive in comparison to distribution channels via
Malaysia.
b) No fishing ports, including PPI, have the facilities at present that can handle catches. Therefore, the expected
users of PPN Nunukan fishing port will be the existing fishers of Sabatik Island. However, in the fishing port plan,
there has been no investigation and clarification of the expected users. Currently, it takes only about 30 minutes by
sea from Sebatik Island to Tawau. It will take longer due to the longer distance if the transportation goes to Tawau
through Nunukan. Regarding this point, the authorities in Nunukan responded that the administration would
instruct neighboring fishers to use the newly established fishing port.
c) Some major middlemen in Nunukan said they would purchase 30GT fishing vessels by utilizing the
government assistance system targeting small pelagic fish. Nunukan District also supports the government
assistance system.
d) It currently takes only about 30 minutes by sea from Sebatik to Tawau. The distance will become longer to
Tawau if transportation goes through Nunukan fishing port.
e) Since the supply of ice in Nunukan and Sebatik is limited in regards quantity, fishers buy ice in Tawau. The
improvement of the system for supplying ice is a crucial issue.
f) It is difficult to sufficiently monitor Malaysian IUU fishing vessels and boats since there is no facility that patrol
vessels and boats can utilize. The role of the fishing port is deemed to be important in this aspect.
g) It is necessary to consider carefully the construction of the piling since the ground at the site of Nunukan fishing
port is not firm.
h) In Nunukan, there is a district-appointed coral reef conservation area. But it is not near the planned fishing port
construction area. However, it should be determined more precisely whether or not there will be any negative
impact from the construction and/or use of the fishing port after construction.
(5) Bitung
①Appropriateness of natural conditions
1) Natural conditions
133
Wave conditions: Bitung is located in Lembeh Strait, which lies between Sulawesi Island and Lembeh Island,
and the waves are very calm here. On the other hand, on the west coast, from the mouth of the Lembeh Strait,
waves come in from the Molucca Sea and the area is not so calm.
Topography and water depth: The main jetty has sufficient depth. On the other hand, the expansion area is
shallow and the new jetty is planned to be located 180m off the coast. The sea bottom profile is good for
foundations and there is little sedimentation.
Water quality: Pollutant sources would be waste water from the fishing port such as from the holds of ships, from
the apron, from processing and so on. In comparison to other common fishing ports, there would be no specific
difference and problems. However, it was observed that at the quay in the neighboring PERIKANAN
NUSANTARA, fishers dissect tuna on board and discard the guts into the sea. Thus, the water quality might be of
concern near to this area.
2) Geographical conditions
Transportation: The fishing port is located on the east side of Bitung City. The coast to the west of the fishing
port is occupied by the commercial port operated by PELINDO IV and many fish processing factories. It takes
about one hour to Manado airport and one and a half hours to the Manado City. Thus, shipborne and airborne
transportation can be used easily.
Distribution: From neighboring Bitung port, there are many regular container services to Makassar and Surabaya,
including reefer containers for fishery products. Tuna loins are transported by air.
Fisheries and capture fisheries: The main fishing grounds are Molucca Sea and Ceram Sea (FMA715), and
Celebes Sea (east part of FMA 716). Bitung fishing port is one of the base ports (the others are Ternate, Ambon
and Kendari) in these fishing grounds. In addition, Bitung is an important fishery base for north eastern Indonesia,
facing the border with the Philippines across the Celebes Sea.
②Possibility of fishery business development
Bitung, located in the northern part of Sulawesi Island, has good fishing grounds in neighboring areas and
advantageous markets including Manado City. In addition, there is a healthy level of distribution to big
consumption markets such as Jakarta, Surabaya, etc., utilizing reefer containers and containers. Currently, many
fish processing factories and frozen fish companies operate inside and outside of Bitung fishing port, and the
demand for utilization of the fishing port is high. However, the space for mooring is not enough to meet demand
and private companies have been increasingly building their own jetties for landing fish. Many fishers participate
in business capture fisheries organized by vessel owners of purse-seine fishing. Therefore, the dependency of
fishers on middlemen is low. Because of this, fishers can enjoy positive fishing activities. The business potential is
high both on the supply side and demand side for the distribution of the fish.
③Remote areas(Boarder areas, archipelagic areas, etc.)
The site is close to certain southern areas of the Philippines such as Jolo, Basilan, and the Tawi Tawi Islands.
Illegal fishing by Filipino fishing boats is a serious problem. Therefore, the port needs to be upgraded to strengthen
the monitoring and surveillance system of fishing.

134
④Potential for regional development
As mentioned above ②, the potential for regional development is high.
⑤Possibility of alleviation of threat to peace and social order
It is especially important to strengthen the system for monitoring and controlling fishing boats and flag of
convenience ships from the Philippines.
⑥Issues
a) It is necessary to shorten the waiting time for the fishing boats off-shore by extending the 1m-deep quay. It is
also necessary to consider improved zoning for landing, handling, and preparation space through the expansion of
the fishing port facilities.
b) It takes long time for large fishing vessels in a 6m-deep quay as well. Currently, three wooden 80GT fishing
vessels can moor the quay at any one time; on the contrary 5 to7 of this type of fishing vessels were utilizing the
quay when the study team visited from May 18-19, 2010. Improvement of the utilization cycle is also required by
separating the landing and preparation zones for large fishing vessels.
c) Due to the lack of a quay, many private fish processing companies construct their own jetties and land fish
directly. This may be an obstruction for vessels navigation in the narrow strait between Bitung and Lenbe Island.
This has become a serious security problem for maritime navigation; any further increase in private jetties must be
prevented.
d) A Sun Shade Roof has been constructed in the handling space between the auction hall and the 1m- deep quay.
It controls the rise in temperature of the fish and is effective for maintaining fish quality. But in the drainage system
of the auction hall there might be stagnant water and frequent cleaning is necessary.
e) The 6m quay was built with a steel pile-supported jetty and was completed in 2002. However, no corrosion
protection measures were taken. PPS Bitung has carried out the investigation for corrosion protection measures
and PPS Bitung is applying for the necessary budget at present. The implementation of these measures is urgent.
f) In construction of the access jetty nearby reclaimed land, it is important to consider the order of work. For
example, in the plie driving of the access jetty there, the revetment of reclaimed land must be removed once and
restored after pile driving works.
(6) Ternate
①Appropriateness of natural conditions
1) Natural conditions
Wave conditions: The site is located at the southwestern end of Ternate Island and the waves are very calm
because the site is mostly surrounded by Halmahera and Tidore Island
Topography and water depth: The two jetties have enough depth as does the quay in front of the auction hall.
The sea bottom, which is covered with sand and stones, is good for foundations and there is little sedimentation.
Water quality: Pollutant sources could be waste water from the fishing port, such as that from the holds of ships,
from the apron, from processing and so on. Sometimes damaged fish are discarded at sea, but most of them are

135
ingested by benthoses such as sea urchins. Transparency is very high and the water quality is believed to be good.
2) Geographical conditions
Transportation: The fishing port is located in the center of Ternate City. However, the access road from the main
road is narrow, so trailers with containers are unable to enter. There is a commercial port operated by PELINDO
VI in the town with a regular container service. However, the bridge on the main road between the commercial
port and the fishing port is not capable of taking trailers with containers. There are many air services between
Ternate and major cities
Distribution: There are regular container services from neighboring commercial ports to Bitung, Makassar and
Surabaya, including reefer containers.
Fisheries and capture fisheries: The main fishing grounds are in the Molucca Sea, which is shared with Bitung
and Bacan Islands. Ternate fishing port is a fishery base for this area. The demand for fish is very high in the
region.
②Possibility of fishery business development
At present, 97% of the catch by fishers living around Ternate is for intraregional consumption, and 3% are
supplied as raw materials for small-scale processed products. Since the population in the region is small,
consumption is limited and oversupply occurs. Thus, sometimes fishers are forced to postpone to go fishing.
Although fishers and their families positively participate in the selling and processing of the catch, the possibility
for development as businesses, especially the possibility regarding expansion to areas outside the region, is not
high under the present conditions. One of the reasons is that the fishers in the archipelagic areas near to Bitung
unload a lot of their catch at Bitung port, and the fishers in Bitung catch fish in the fishing ground around Ternate,
which is then transported to Bitung. The prospect of increasing the amount of catch sold outside the region may
rise in the future if there is an improvement in quality of the processed fishery products by private enterprises.
③Remote areas (Boarder areas, archipelagic areas, etc.)
It is an archipelagic area consisting of many islands of various sizes such as Ternate, Tidore, Maitara,
Morotai, Halmahera, and transport between the islands is not convenient.
④Potential for regional development
There is no market to deal with fishery products when a surplus in intraregional consumption occurs.
Expansion in the business of private companies that utilize containers is expected in the future.
⑤Possibility of alleviation of threat to peace and social order
The deterioration in the security situation since 1999 to 2000 is apparent and support for infrastructure
development in the local economy after the independence of north Maluku is essential.
⑥Issues
a) Judging from the availability of fishing ports, there is not a lack of fishing port facilities at present, and there are
no serious problems with the present scale of facilities and fishery activity. Also, the possibility of increased
demand is unknown.

136
(7) Tual
①Appropriateness of natural conditions
1) Natural conditions
Wave conditions: The site, which is located on the west coast of Kai Island, is connected to Banda Sea via a
complicated water route consisting of many small islands and atolls. Thus the site is shielded from waves and the
water is very calm.
Topography and water depth: The seabed is fairly deep near the shore area, and the jetty has adequate depth.
Thick vegetation spreads towards the water’s edge and the beach is narrow around the fishing port. There is little
sedimentation and the effect on the beach of fishing port construction is negligible.
Water quality: Pollutant sources could be waste water from the fishing port such as from the hold of a ship,
washing water from the apron, waste water from processing and so on. Currently, water transparency is very high
and the water quality is believed to be good.
2) Geographical conditions
Transportation: The site is about 10 minutes from Tual City. In Tual City, there is a commercial port which is
managed by the central government, and operates a regular container service. The airport (Langgur Dumatubun)
in Tual is basically for military use but commercial airlines can operate regular service to major cities. The
construction of a new commercial airport is under way in Tual City.
Distribution: There is a regular container service to Surabaya, which includes a reefer container for fishery
products. A chartered carry boat transports frozen fish to Surabaya and Taiwan from Tual fishing port.
Fisheries and capture fisheries: The main fishing grounds are the eastern part of the Banda Sea shared with
Ambon, the Arafura Sea and the Timor Sea shared with Merauke. Tual fishing port is one of the base ports for
these fishing grounds.
②Possibility of fishery business development
As for the fishery products industry in Tual, there is small-scale fisheries for markets within the region, a
supplyer for high consumption places such as Jakarta, one large company involved in exporting, large-scale
middlemen selling fishery products to areas outside the region, and seaweed culture. Among these, the possibility
for expansion into high consumption places appears promising. It is believed that the possibility for expansion
within the region is low because islands in Maluku province are widely dispersed and transport between the
islands is not convenient. However, in the Tual fishing port, the number of fishing boats has decreased greatly due
to the incident involving the seizure of foreign fishing boats in 2007. In this regard, the public sector is expected to
engage into this problem with improved manner. There is the issue of cooperation between the public and private
sectors at present and the possibility of developing the fishery business is not known. An immediate solution to this
issue is necessary.
③Remote areas (Boarder areas, archipelagic areas, etc.)
Maluku province is in the archipelagic area where a lot of islands are scattered across a wide area.
④Potential for regional development

137
Although Tual fishing port was originally a fishing port for exports, the present-use situation is limited as
mentioned above ②. If the relationship and level of cooperation between public and private sectors are examined,
and the number of fishing boat using the fishing port increases, the development potential of this region, which has
abundant fishery resources, would be increased.
⑤Possibility of alleviation of threat to peace and social order
As mentioned above ④
⑥Issues
a) It is a matter of highest importance that the situation that has been ongoing since the incident in 2007 is resolved
and large-sized fishing boats utilize the fishing port as before. Also, dealing with the fishing boat from the
Republic of Korea that is still moored at the port after its seizure is necessary. It is believed that there are enough
facilities for fishing boats using the fishing ports at present.
b) The investors who once agreed to participate in the construction and administration of industrial facilities
decided to closedown their enterprise because of the stop of economic activities at PPN Tual fishing port in 2008.
c) The site where the expansion is planned has numerous undulations, and there are streams and gorges between
the current fishing port sites. Therefore, large-scale land leveling is necessary in order to utilize the site

138
4.3.3 Conclusions of the site surveys
The prospects for support of fishing port development in the seven (7) fishing port sites are outlined as
follows.
(1) Review of all seven sites
In general, fishing port development planning should be based upon a proper spatial plan designed by public
sector planners and infrastructures should be planned appropriate to the size and number of fishing boats. Within
the seven surveyed sites, Teluk Awang, Untia (Makassar) and Nunukan are to be newly constructing fishing ports
and construction work has already been started with the budget provided by the Indonesian government. MMAF
is expending considerable effort to secure a budget for the development of all the fishing ports. However, it takes
time to secure the budget and a short fall in the budget, meaning there isn’t enough to cover the construction work,
forces a delay in the development program. In addition, because of the difficulty in supervising the construction
work and technical difficulties, progress is not meeting the government’s expectations. Thus, the government of
Indonesia is hoping for assistance from Japan, because Japan has considerable experience in fishing port/port
development meeting high international standards with precise technical management.
In the fishing port development program, unlimited coastal exploitation, which might impact coastal
fisheries, such as reclaiming mangrove swamps, should be prevented to insure sustainable fishery development.
Within the seven survey sites, PPN Nunukan is located near a mangrove swamp, there is a lobster spawning
ground off Awang bay in Teluk Awang, and Kupan City is making a strong effort to protect the coastal
environment. These points should be taken into consideration.
(2) Review of each fishing port development site
At every site, the assistance from Japan should be depend upon the investigation about the expected benefits
of the fishing port development, recipient of the benefits, and required scale and detail of the facilities based on the
above considerations.. In particular, it should be payed attention to newly constructed fishing ports, since the
recipient of the benefits have not been investigated, and the demarcation between neighboring PPI and new fishing
ports including fishing port users have also not been considered. It would be advisable in every ORFP site to
investigate the expected benefits and to re-examine the detailed plans. The review of each of the seven fishing port
sites is as follows:
① Teluk Awang
In Teluk Awang, the construction work has already started. However, in terms of shape and quality of
facilities, there might be a difference between the parts completed with the Indonesian budget and newly
constructed parts built with outside funding. In addition, a proper structural/physical division of the facilities is
also needed. In Teluk Awang, starting construction of the main jetty is impossible at this moment. This facility
could be a potential assistance target for Japan. Furthermore, in Nunulan and Makassar, the same thing could be
considered since construction work has already started.
139
② Kupang
In Kupang fishing port, the shortage of landing and loading facilities is causing a serious problem. And the
demand for anchorage areas and dock yard/slip way is also high. However, there is no indication to start
construction work at the moment. In this manner, it is possible to carry out a re-examination of the current
development plan based on the high demand for the fishing port facilities. There is an idea for the current
development plan to deepen the port basin and improve the revetment into the quay wall with a deepened port
basin. The users of neighboring PPI are mainly small-scale fishers with fishing boats of less than 10GT. Thus,
demarcation between PPP Kupang, which is used by fishing boats larger than 10GT, and other PPI is clear.
③ Untia (Makassar)
The development of Untia (Makassar) fishing port requires quite a large budget for the construction of the
breakwater, dredging and so on. Development will take a long time because the annual budget is limited. Thus, at
the first stage of assistance, a review of the current development plan and detailed plan, such points as an
investigation into the recipients of funds, coordination with stakeholders, demarcation between neighboring PPI,
facility plans considering the above results, a step-by-step construction plan, and an environmental assessment of
the surrounding coastal area, could be carried out. It is also important to make good use of the logistic center
functions of Makassar City in regards to the fisheries sector.
④ Nunukan
In Nunukan, understanding its competitiveness with the fishery business in Tawao and Tarakan, and an
examination of its superior assets, are necessary. The fishing port users mainly consist of Sebatik fishers; however,
geographical conditions might greatly alter the current fishing boat activities, so that an examination of the
numbers and types of fishing boats that use the fishing port, demand and trend of fishing boats is required. Also,
attention should be paid to the effectiveness of administrative guidance on the use of fishing ports. In addition to a
review of these plans, there is concern about the structural safety of existing facilities because of the substandard
construction work. At present, a review of the facility plan is being carried out, and it is thought that there is a
specific time margin between starting the development and the review of the plans.
⑤ Bitung
In Bitung, it seems that a prospect of the budget in APBN is clear. According to the PPN Bitung office, the
construction of an access jetty is planned to start this year. If this construction progresses smoothly, the support
from Japan for the jetty construction will not be needed. The current Bitung fishing port might be the most
advanced fishing port in terms of hygiene management in Indonesia. Through an examination of the
comprehensive hygiene management of the fishing port, including expansion of the current facilities, the Bitung
fishing port is expected to become a model for fishing port hygiene management in Indonesia.
⑥ Ternate
Since the Ternate fishing port shares its main fishing ground with the Bitung fishing port, it would be
necessary to sort out the demarcation regarding fishing port functions between both fishing ports. Also, careful
analysis is required about beneficiaries and benefits owing to the development. The Celebes Sea to the north side

140
shares a border with the Philippines, and its function as a foothold for fisheries in this sea area is important. Thus, it
has to be carefully investigated whether the existing facilities are capable in this regard.
⑦ Tual
A lot of large-sized fishing boats used the Tual fishing port before the investigation by the police in 2007;
before the investigation, the port performed an important function. At present, the degree of interest from the
private sector is still high regarding fishery resources, as a private enterprise manages the private quay and fishery
base including a processing factory, in this area. However, to restore the port’s position, there needs to be a shift of
large-sized fishing boats, which currently use PPN Ambon and PPS Bitung, back to Tual; therefore, prudent
consideration will be needed regarding further development.
141
Chapter 5 Synthesis of the study results
It is always fundamental for any donors to evaluate the adequacy and the level of preparedness
of a proposed plan of assistance. This part of the document provides a comprehensive review of the
ORFP development plan. In the course of this study, a number of remaining issues are identified,
which may require the MMAF’s additional actions before this plan is put forward for further
discussion..
5.1 Preliminary appraisal of ORFP development plan
5.1.1 Relevance
(1) Consistency with the national objectives of the fishery sector
The National Medium Term Development Plan (NMTDP 2010-2014; RPJMN) is the
Indonesia’s overarching national strategy, which defines the directions of national development. In this
plan, the importance of the qualitative improvement of human resources and strengthening of
economic competitiveness with the improved science and technology was highlighted as a priority
area. In order to achieve this objective, a total of 11 actions areas are identified, which include
administrative reform, poverty reduction, food security, infrastructure development, investment and
business, management of environment and disasters, assistance for underdeveloped areas/remote
areas/post-conflict areas, and culture/creativity and innovation of technology.
One of the ways to strengthen economic growth in Indonesia is the reinvigoration of primary
industry such as agriculture, forestry and fisheries. The ORFP-DP is considered to contribute such
policy objectives as infrastructure development, food security, management of environment and
disasters, and assistance for underdeveloped areas/remote areas/post-conflict areas.
In terms of national fishery policy, the priority areas defined in the Medium-term Development
Plan of the Ministry of Marine Affairs and Fisheries (RENSTRA MMAF2010-2014) consists of 5
areas: administrative reform, poverty reduction, food security, management of environment and
disasters, and assistance for underdeveloped areas/remote areas/post-conflict areas, which are totally
in line with the NMTDP.
In order to ensure the safety of fishing operations in the near border areas and to promote the
better utilization of fishery resources, MMAF has developed the master plan for outer ring fishing port
development in 2004, and selected 26 fishing ports in 21 provinces from 968 fishing ports in the
whole areas of Indonesia. Selection criteria for the outer ring fishing ports are;
¨ Suitability of natural conditions
¨ Prospect for fishery business development
¨ Remoteness (proximity to borders and island regions, etc.)
¨ Development potential in the region

142
¨ Potential to contribute to the threat reduction in disputes and peace (safety).
In the master plan, 9 fishing ports located in the least-developed areas near the eastern border
and islands region are selected as priority fishing ports to be developed in the first phase. In addition,
the Indonesian government has develop a fishery industry driven rural development plan, so called
Minapolitan vision, in which 86 target sites are identified throughout the country including some of
outer ring fishing port development sites. As a whole, it can be considered that ORFP-DP fulfills the
purpose in the context of the development strategy of the marine fisheries sector.
(2) Consistency with the other relevant policy frameworks
In the natural resources and environment sector, 5 priority policy objectives were outlined as
follows.
① Sustainable development
② Global climate change
③ Development of archipelagic water areas
④ Utilization of natural resources
⑤ Improvement of environmental sustainability and quality
In the fishery sector, there are two policy objectives that are closely related to the above policies.
① Improvement of food security (fishery products)
② Management of marine resources
The fishery sector forms a part of the natural resources and environment sector; it plays an
important role in sustaining people’s livelihoods and the supply of raw materials that is crucial to the
national economic growth. Therefore, the ORFP development plan is considered to be in line with the
plans and policies of the natural resources and environment sector, since the fishing ports of the ORFP
development plan, especially those located near borders and island regions, support the better
utilization of fishery resources in Indonesian waters and the supply of quality fishery products.
(3) Relevance to the socio-economic needs
The ORFP plan has an important mission to fulfill the increasing domestic demand for fish and
there is an issue that the contribution of the fishery sector to the national economy increases as
international demand for fishery products increases. Although the Indonesian government is expected
to meet these needs, Indonesian fishery production is almost reaching the upper limit from the point of
view of the availability of marine fishery resources (MSY: 6.4 million tons and TAC: 5.12 million
tons). As such any increment in total fishery production from now on cannot be expected in the marine
capture fisheries sector. However, the activities of the fishing fleet are not evenly conducted in the
domestic water areas and it can be said that utilization of resources is still low in some areas, so there
143
should be remaining rooms for further development. These areas are rather remote areas along the
outer ring of Indonesian territory, and most of them are underdeveloped. Therefore, it is thought that
the needs of fishing port development, which promote balanced utilization of fishery resources, are
very high. The ORFP-DP is a plan to contribute to the promotion of effective utilization of resources
in the underdeveloped areas within the EEZ, ensuring the safety of fishery industry operation in the
marginal areas of Indonesia and proper utilization of fishery resources, in addition to the eradication of
the IUU fishing through the provision of operation bases for national patrol vessels for monitoring,
control and surveillance of the EEZ areas. For that reason, the development needs of ORFP-DP to
provide new fishing ports meeting international standards in outer ring areas are very high.
5.1.2 Efficiency
Regarding the efficiency of this project, it is considered from the viewpoint of (1) output (2)
time frame and (3) project costs as shown below. Although they have anticipated financial assistance
from external sources (donors) with the implementation of the ORFP development plan of MMAF
from the beginning, they have developed the master plan of ORFP in 2004, and initiated their own
efforts by making the best use of whatever available budget (central, regional and extraordinary
budget, etc.). The project started by taking phased approach (one to three) regarding the 26 outer ring
fishing ports with a total project cost of 6,500 billion IDR (approx. 65 billion yen) in the
implementation period of 8.5 years. This is because they viewed that overseas assistance would take
considerable time. Such effort is an indication of the Indonesian government’s firm commitment on
the ORFP-DP. However, it was observed during the construction work in phase one that a steel pipe
pile of the pier in Nunukan collapsed because of heavy weather, and construction work slowed in
Teluk Awang and Makassar because of the delayed disbursement of the project’s budget. Similar
problems may occur, which may further delay the time of completion. Therefore, at present,
completion is nowhere in sight, and it has to be judged that effectiveness level of this plan is low.
These problems can be considered technical matters; but may also be attributed to the fact that
they cannot receive the support of overseas donors in a timely manner. The reasons for this are 1) the
relatively low priority is given to the fishery sector as compared to the other infrastructure
development projects in Indonesia and 2) the fishery industry formed a part of the agricultural sector
for many years, and hence it was undervalued in the agriculture-centered administration system.
However, since the Ministry of Marine Affairs and Fisheries separated and became independent from
the Agriculture Ministry in 1999, the importance of the fishery sector has increased reflecting a rise in
international demand for marine fishery resources, needs for mitigation of rural disparity and
promotion of district economy by regional industrial upbringing. Therefore, approaches for donors by
the Indonesian side on this project may change greatly in order to accomplish the plan in the future.
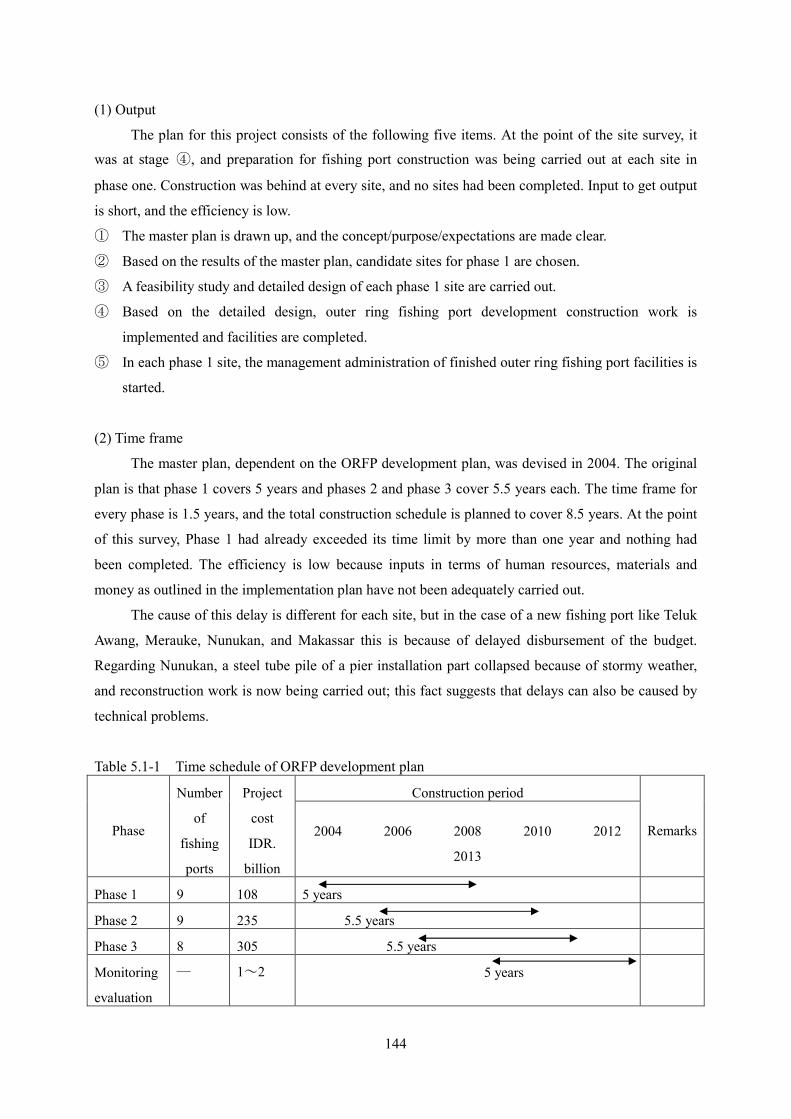
144
(1) Output
The plan for this project consists of the following five items. At the point of the site survey, it
was at stage ④, and preparation for fishing port construction was being carried out at each site in
phase one. Construction was behind at every site, and no sites had been completed. Input to get output
is short, and the efficiency is low.
① The master plan is drawn up, and the concept/purpose/expectations are made clear.
② Based on the results of the master plan, candidate sites for phase 1 are chosen.
③ A feasibility study and detailed design of each phase 1 site are carried out.
④ Based on the detailed design, outer ring fishing port development construction work is
implemented and facilities are completed.
⑤ In each phase 1 site, the management administration of finished outer ring fishing port facilities is
started.
(2) Time frame
The master plan, dependent on the ORFP development plan, was devised in 2004. The original
plan is that phase 1 covers 5 years and phases 2 and phase 3 cover 5.5 years each. The time frame for
every phase is 1.5 years, and the total construction schedule is planned to cover 8.5 years. At the point
of this survey, Phase 1 had already exceeded its time limit by more than one year and nothing had
been completed. The efficiency is low because inputs in terms of human resources, materials and
money as outlined in the implementation plan have not been adequately carried out.
The cause of this delay is different for each site, but in the case of a new fishing port like Teluk
Awang, Merauke, Nunukan, and Makassar this is because of delayed disbursement of the budget.
Regarding Nunukan, a steel tube pile of a pier installation part collapsed because of stormy weather,
and reconstruction work is now being carried out; this fact suggests that delays can also be caused by
technical problems.
Table 5.1-1 Time schedule of ORFP development plan
Phase
Number
of
fishing
ports
Project
cost
IDR.
billion
Construction period
Remarks 2004 2006 2008 2010 2012
2013
Phase 1 9 108 5 years
Phase 2 9 235 5.5 years
Phase 3 8 305 5.5 years
Monitoring
evaluation
― 1~2 5 years

145
Total 26 650 8.5 years
Source: Produced by the research team with reference to the ROAD MAP, Outer ring fishing port
development, Jan. 2010, DGCF, MMAF
(3) Project cost
As for project costs, the total project cost of the ORFP development plan is 6,500 billion IDR
(about US$ 76.61 million), and the project costs of each phase are estimated at 1,080 billion IDR
(about 10.8 billion yen), 2,350 billion IDR (about 23.5 billion yen), and 3,050 billion IDR (about 30.5
billion yen) respectively. In addition, monitoring/evaluation research costs are estimated at 10-20
billion IDR (about 100-200 million yen) for five years after phase 1 completion.
From the beginning, funding from a donor was planned for and several procedures were
undertaken by the government; however, owing the importance of the project, development has started
by making use of the government’s own budget (central, regional and extraordinary budget, etc.). This
is because securing assistance from foreign countries takes time; however, construction has been
slowed because of a delay in budget provision for the new fishing ports, and problems such as pushing
back the completion time have become obvious. There is little prospect of completion at present. This
is partly caused by technical problems, but also through the timing of support by overseas donors.
There is a shortage of funds that will significantly affect the efficiency of the project.
5.1.3 Prospects for effective implementation
(1) Prospects for effectiveness
The purpose of the ORFP development plan is to ensure that 26 outer ring fishing ports are
ready within the planned period, and that administration of the ports continues; in addition, the plan
also promotes the security of fishery operations in border waters and the appropriate use of fishery
resources through the development of outer ring fishing ports.
The purpose is similar to the phase 1 that targeted 9 high-priority places in the eastern area.
Construction of basic areas such as shore protection work and a mooring zone (a pier, a quay) have
been implemented in four places (Teluk Awang and Nunukan, etc.) among the 9 fishing ports in the
eastern parts of phase 1. In addition, the budget to extend the capacity of the outer ring fishing ports
has been secured, and one part of the site acquisition program and landfill construction has already
started in the existing five fishing ports such as Bitung and Kupang.
As presented above, there is a problem, common at every site, that the construction funds are
lacking and there is little prospect for the completion of the whole of phase 1. Even though the project
implementation period was initially five years, it has already exceeded two years. Therefore, the
expected effects of outer ring fishing port development as shown below have not yet materialized.

146
Indicators of effectiveness:
・ Safe operation in the border areas at sea is ensured.
・ Support services for domestic and foreign-operated fishing boats are improved.
・ Utilization of outer ring fishing ports increase in terms of unloading of catches by
foreign fishing boats that operate in international waters near Indonesia.
・ Monitoring of IUU fishing is strengthened, and the loss caused by IUU fishing
decreases.
・ Economic profit (indirect) through elimination of IUU fishing is ensured.
・ Employment opportunities created by domestic and foreign companies using outer
ring fishing ports increases.
・ Economic activities of outer ring fishing port areas become more active, and a new
foothold for local economic growth is formed.
In order to produce a positive effect from fishing port development, good management of
facilities working in tandem with other relevant plans such as those for resources, production,
processing, circulation, retail and consumption (disposal) are vital.
As for effectiveness, judging from the construction progress situation, it is almost impossible to
hope for completion of construction of all the sites in phase 1 (nine places) with the original budget.,
Although the phase 2 (9 sites), and phase 3 (8 sites) started some construction work in 2007 and 2005
respectively, it is most likely that lack of provision of external funding would influence the whole of
the ORFP development plan.
However, the development needs of the outer ring fishing ports are considerable, and this is the
project to address urgent issues such as the eradication of IUU fishing, so ensuring promotion of the
project is a priority.
(2) Scale of facilities
The requirements regarding scale/specifications of ORFP-DP in Indonesia are as below. These
fall into A) current fishing port class (6 ports at present) or B) (13 ports at present), and it is not to
demand bigger scale and/or new specifications particularly.
However, the idea that project fishing ports will offer new business opportunities to foreign
investors may be beyond the reach of the project. It has been supposed that it is difficult to develop
more than 20 ports in one go even if there are only 6 class A fishing ports in the whole of Indonesia at
present. As pointed out before, the reason is that a careful examination of the scale of such
development is lacking, and it is necessary to review the details for every site.
Moreover, regarding the number of fishing ports, it is important to focus on 9 outer ring fishing
ports in the east for the phase 1, and concentrate MMAF’s technical resources and funds in these ports,
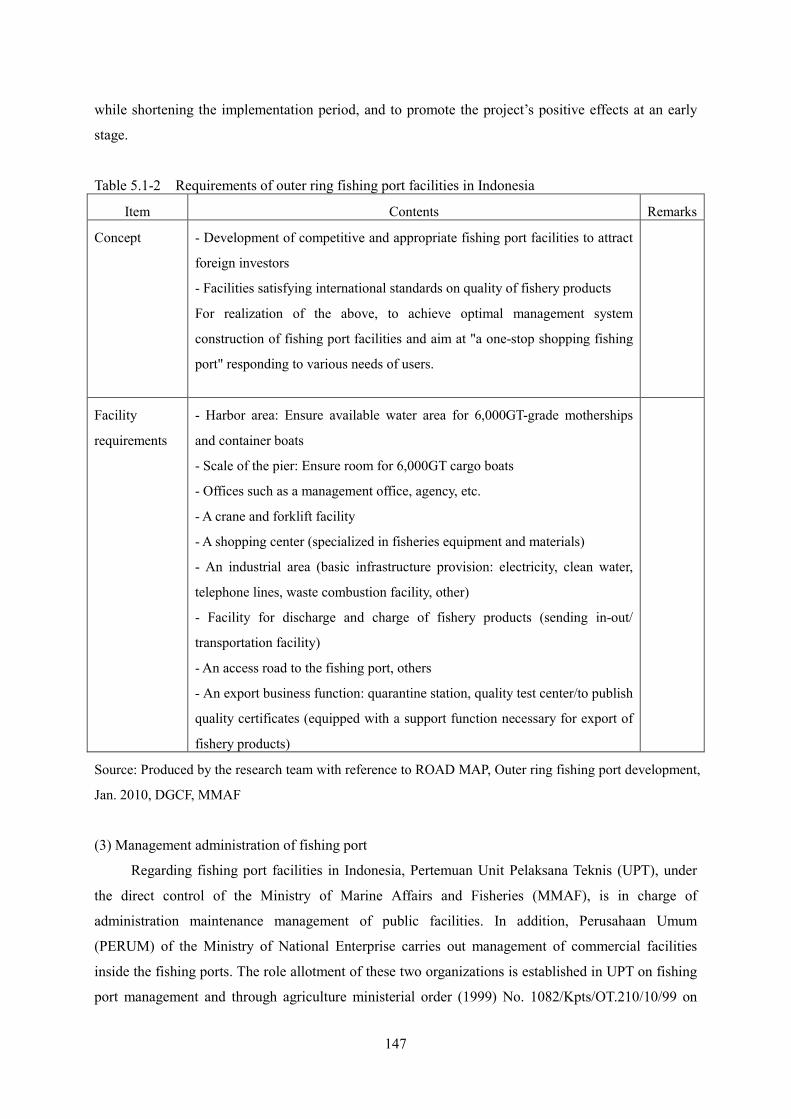
147
while shortening the implementation period, and to promote the project’s positive effects at an early
stage.
Table 5.1-2 Requirements of outer ring fishing port facilities in Indonesia
Item Contents Remarks
Concept - Development of competitive and appropriate fishing port facilities to attract
foreign investors
- Facilities satisfying international standards on quality of fishery products
For realization of the above, to achieve optimal management system
construction of fishing port facilities and aim at "a one-stop shopping fishing
port" responding to various needs of users.
Facility
requirements
- Harbor area: Ensure available water area for 6,000GT-grade motherships
and container boats
- Scale of the pier: Ensure room for 6,000GT cargo boats
- Offices such as a management office, agency, etc.
- A crane and forklift facility
- A shopping center (specialized in fisheries equipment and materials)
- An industrial area (basic infrastructure provision: electricity, clean water,
telephone lines, waste combustion facility, other)
- Facility for discharge and charge of fishery products (sending in-out/
transportation facility)
- An access road to the fishing port, others
- An export business function: quarantine station, quality test center/to publish
quality certificates (equipped with a support function necessary for export of
fishery products)
Source: Produced by the research team with reference to ROAD MAP, Outer ring fishing port development,
Jan. 2010, DGCF, MMAF
(3) Management administration of fishing port
Regarding fishing port facilities in Indonesia, Pertemuan Unit Pelaksana Teknis (UPT), under
the direct control of the Ministry of Marine Affairs and Fisheries (MMAF), is in charge of
administration maintenance management of public facilities. In addition, Perusahaan Umum
(PERUM) of the Ministry of National Enterprise carries out management of commercial facilities
inside the fishing ports. The role allotment of these two organizations is established in UPT on fishing
port management and through agriculture ministerial order (1999) No. 1082/Kpts/OT.210/10/99 on
148
operational relations with other organizations. UPT is a government organization, and the budget
comes from the national budget. According to MMAF, the annual maintenance and management
budget for fishing port facilities managed by UPT was about 10.7 billion IDR in 2007. UPT has an
income from port entrance fees, and after having entered the national treasury, it can be withdrawn
quarterly in order to make up for any lack in maintenance and management costs. Income in 2007 was
about 1.2 billion IDR. Meanwhile, PERUM has a self-support accounting system, and the harbor
income except the port entrance fee (including the rent of for tenants, the fee for use of the quay, cold
storage, a workplace, and slipways, etc., other sales such as ice, fuel oil and water) becomes the
income of PERUM entirely. This harbor income covers the maintenance and management costs that
PERUM has to bear. In summary, concerning administration, maintenance and management of
facilities after the outer ring fishing port facilities have been completed, it is supposed that there will
be no technical problems since UPT and PERUM have already shown their capabilities to do so.
5.2 Feasibility of ORFP development plan
From the viewpoint of sustainability, the feasibility of ORFP-DP was examined regarding
technical ability, administration/maintenance/management ability, and funding ability. The results are
as follows:
(1) Technical ability
The Indonesian government has about 960 fishing ports throughout the country and makes
considerable effort in the development of fishing port infrastructure facilities especially in the rural
areas for the continuous utilization of fishery resources. The results show that about 370 fishing ports
have undergone development in the last ten years. The outer ring fishing ports will fall into the
existing PPS or PPN (classes A or B) according to the plan, and there are 6 places in class A and 13
places in class B at present. Considering these points, it is judged that the technical ability regarding
fishing port development is sufficient. It is planned that the scale and specifications of ORFP-DP
match international standards, and it is necessary to implement the plan steadily taking into account
the experience gained in Jakarta fishing port (as a hub port of ORFP in the western area) where the
bank of a quay is presently being raised. In this sense, technical guidance for the staff is needed
including engineers from the Directorate General of Capture Fisheries (DGCF) fishing port bureau in
MMAF, which is the implementation agency of ORFP-DP.
In addition, administration management after the completion of the facilities is important; also it
is significant to establish a comprehensive implementation system for the entire outer ring fishing port
development program by involving relevant authorities including UPT and PERUM, and to
continuously share the project information in accordance with the progress situation of phase 1, phase
2 and phase 3 at the project sites.
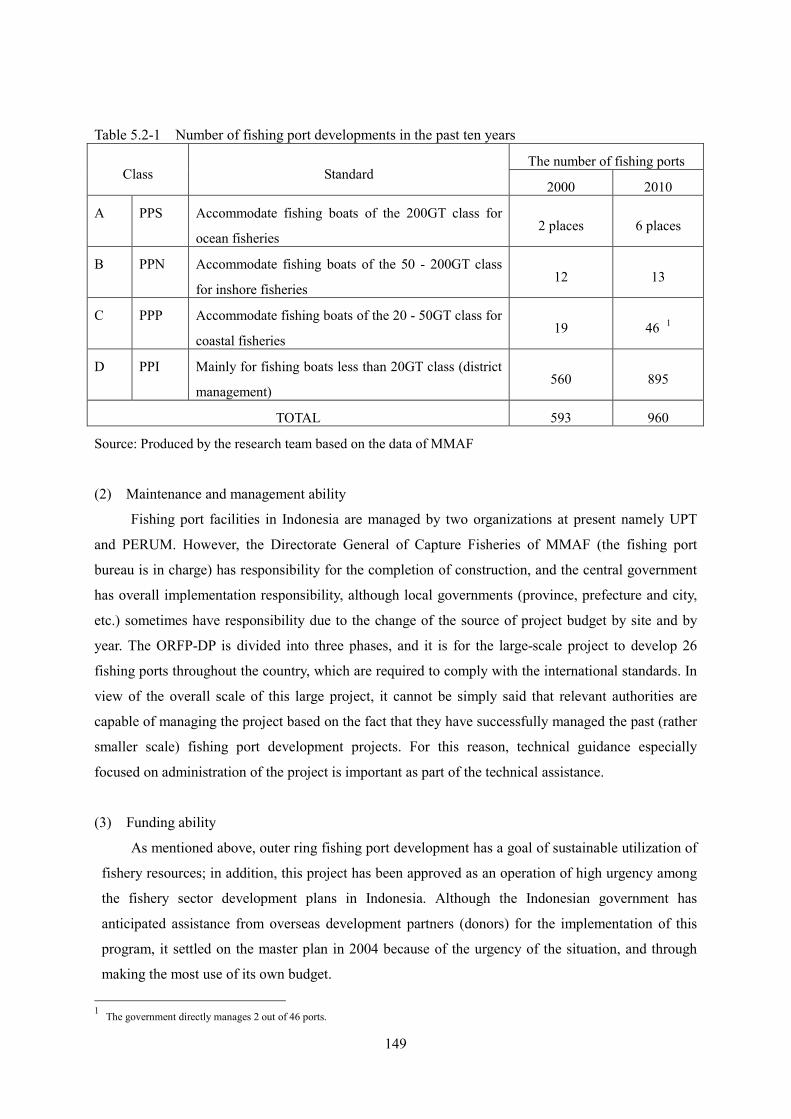
149
Table 5.2-1 Number of fishing port developments in the past ten years
Class Standard The number of fishing ports
2000 2010
A PPS Accommodate fishing boats of the 200GT class for
ocean fisheries 2 places 6 places
B PPN Accommodate fishing boats of the 50 - 200GT class
for inshore fisheries 12 13
C PPP Accommodate fishing boats of the 20 - 50GT class for
coastal fisheries 19 46 1
D PPI Mainly for fishing boats less than 20GT class (district
management) 560 895
TOTAL 593 960
Source: Produced by the research team based on the data of MMAF
(2) Maintenance and management ability
Fishing port facilities in Indonesia are managed by two organizations at present namely UPT
and PERUM. However, the Directorate General of Capture Fisheries of MMAF (the fishing port
bureau is in charge) has responsibility for the completion of construction, and the central government
has overall implementation responsibility, although local governments (province, prefecture and city,
etc.) sometimes have responsibility due to the change of the source of project budget by site and by
year. The ORFP-DP is divided into three phases, and it is for the large-scale project to develop 26
fishing ports throughout the country, which are required to comply with the international standards. In
view of the overall scale of this large project, it cannot be simply said that relevant authorities are
capable of managing the project based on the fact that they have successfully managed the past (rather
smaller scale) fishing port development projects. For this reason, technical guidance especially
focused on administration of the project is important as part of the technical assistance.
(3) Funding ability
As mentioned above, outer ring fishing port development has a goal of sustainable utilization of
fishery resources; in addition, this project has been approved as an operation of high urgency among
the fishery sector development plans in Indonesia. Although the Indonesian government has
anticipated assistance from overseas development partners (donors) for the implementation of this
program, it settled on the master plan in 2004 because of the urgency of the situation, and through
making the most use of its own budget.
1 The government directly manages 2 out of 46 ports.

150
However, during the construction work, problems have been revealed such as the collapse of a
steel pipe pile, slowing down of construction work, and postponement of the completion date. In
Teluk Awang, Nunukan and Merauke, the budget has been allotted annually since construction started
in 2005; but the fact is that there is not enough money to be able to finish within the period as
originally scheduled. The situation is not clear whether or not the necessary budget can be sourced.
Although the Indonesian government has started construction work with its own budget, in terms of
the construction progress and management situation of phase 1, considerable delays have already
occurred.
(4) Necessity for close cooperation with related projects
For the outer ring fishing port development, it is important to carry out related plans such as
fishing boats building and distribution, and preparation of support facilities such as roads and bridges
for fish distribution in a timely manner. Close cooperation with the other ministries and private
enterprises is essential to achieve the aims of the ORFP development plan, and there is a need to push
related projects of public infrastructure such as roads, and to attract private enterprises, especially
fishery processing-related companies.
5.3 Suggestions/recommendations on the ORFP development plan
There are a number of salient issues identified in the course of the study, which may require the
MMAF’s additional actions. The followings are suggestions/ recommendations drawn from the
synthesis of the study results.
(1) Principles of facility development
The main point in the facility development project comes down to a simple question; “are they
actually used and how effectively are they utilized?” The facilities become obsolete over time, and
there is the possibility the useful life of the facilities is reduced even by half when maintenance is not
good. Hence, in ORFP-DP the most important point is to maintain the necessary quality (Q), and to
complete construction steadily within the given cost brackets (C) and for a fixed period (D).
(2) Re-evaluation of demand prediction/development strategies at each site
The basic design of outer ring fishing ports in Indonesia is to enhance the contribution of the
fishery sector in the national economy through effective utilization of fishery resources. Driven by this
objective, it is apparent that the size of fishing ports (port classification) in the master plan has been
determined simply based on the estimated available quantity of fishery resources in the area. This
implicates that the fishing port developed in such a way may likely be over-sized as compared to the
actual demand from the fishing industry in the area. The current situation on facility utilization,
151
demand predictions at present and in the future, and the present status of the local fishery industry are
not reflected precisely in the facilities development plan of the ORFP plan.
(3) Clarification of the responsibilities among relevant government agencies in the implementation of
the ORFP development plan
In the fishing ports under construction, there are several fishing ports where improvement work
is slow due to the lack of budget and delay in budget execution. For example, there is the case where
only the development of small incidental facilities was undertaken, since construction of the main
facilities like piers could not be started because of limited annual budget. Also, there is the case that
the scale of a plan is large and there are no prospects for completion in light of the current construction
progress situation. There is the example case that a project was implemented without assigning a
consultant in charge of technical supervision due to the lack of budget, and serious faults occurred in
construction. In addition, there is the danger that confusion and parts not being completed occurred in
certain projects through repeated changes of the construction implementation agencies. For example,
there is the case that a province maintained construction records until last year, the records were then
transferred to a prefecture, but the information regarding former construction work was not transferred.
Therefore, it is necessary to clarify the responsibility system for project implementation before
assistance is considered.
(4) Timely and coordinated implementation of supporting facility development
The role of large-sized fishing ports (i.e.PPN, PPS) in various parts of the country, including
outer ring fishing ports, is to promote the utilization of fishery resources with support of fishery
production activity in offshore fishing grounds, and to improve storage/processing functions at ports
and distribution of fishery products to consumption places. For smooth distribution of fishery products
beyond the areas of fishing ports, it is required that a frozen container transportation service is
available, and/or that regular air freight or transportation by charter service is possible. It was observed
that some of the roads and bridges are remained non-functional in some of the outer ring fishing ports
of phase 1, it is important to improve the basic social infrastructure to keep pace with outer ring
fishing port development, in order to reinforce the distribution system for fishery products, and to
ensure enough competitive power.
(5) Clear demarcation of technical responsibilities when taking over development work
In every site, understanding the project benefits, usage patterns of the facilities is important, so
investigation/analysis about assumed advantages must be done as a premise of support, and the
examination of the facilities’ scale based on the results of analysis is indispensable. The problems
remain such as construction of facilities taking priority in new fishing ports with the benefits not being
152
considered, allotment of functions among nearby PPI, and the division of target users has not taken
place. Therefore, it is necessary to pay enough attention when taking over such development work
which is under way.
The potential use of the fishing port is influenced by the investment trend by the private
enterprises such as fishing boats owners and fishery processing factories, etc. that are assumed will be
users. Although the situation is different in each fishing port, as for outer ring fishing port
development in the eastern part of phase 1, it is important to develop infrastructure through
cooperation between the public and private sectors such as keeping public investment to a minimum
and the private sector carrying out as much work as possible in cooperation with public sectors; it is
also necessary to devise a plan with enough relevance to the situation. Especially, in the projects
where construction has already started, there is a possibility of having a difference in the facilities’
quality between those with foreign assistance and those of the Indonesian side, and it is necessary to
have appropriate and clear division of responsibilities. This requires enough attention in view of
making warranty responsibility clear.
Consequently, in the case where construction work on the facilities is under way, it is necessary
to analyze the prospective outcomes/benefits and to review the plan based on analysis of each site
raised in the ORFP development plan in order to clarify the demarcation of technical responsibilities
and to promote the project having a common understanding among stakeholders.
(6) Importance of the supervision of work
There are a number of problems observed during the site survey, which require close attention
of relevant government agencies. These include 1) some completed facilities are not fully utilized due
to the delay of execution of the construction budget at latter stage, 2) loss of expected revenue because
of the delay in the construction work, 3) rise in construction material costs caused by extended
construction schedule, and 4) reduced profit owing to an increase in management and security costs.
The presence of such problems clearly indicates the importance of the supervision of work.
(7) Necessity of the operation/management plan of the fishing port
For the outer ring fishing port development in the eastern area, although the situation is different
in each site, cooperation between the public and private sectors is important in such a way that public
sector investment is kept to a minimum and private sectors carry out the development as much as
possible in cooperation with public sectors. In this case, it is necessary to formulate an adequate
management and administration plan of the port.
5.4 Other remarks
(1) Environmental impact assessment

153
1) Overview of the system
The environmental law of Indonesia was revised in October 2009, and there is a plan to shift to
a new law in the next 2 years. For the construction of fishing ports, examination and evaluation of
environmental influences are carried out, and a system to examine the environmental influence on
construction is established.
2) Process
The procedure of the existing system is as follows (according to an interview with the Ministry
of Environment).
− Planning stage: An environmental document is made up (environmental management, referring to
environmental/social influence evaluation).
− The first stage: A public notice is given to related local communities within a fixed time and
social/environmental consultation is carried out. It is reviewed in the prescribed evaluation
committee meeting. (There are three types of implementation organizations: the Ministry of the
Environment, province and local government). On this basis, environmental influence evaluation
research (EIA) is implemented. Stakeholders (Indonesian Fisheries Association, etc.) participate in
the evaluation committee meeting. Also, an Ad-hoc Commission formed by relevant ministries
and experts is held with the chairperson being from the Ministry of Environment at a central
government level. In a case where the environmental influence and the project benefits are
compared and evaluated, and results presented by this commission are deemed to be useful,
permission for the project is granted to a state or local government.
− The second stage: A tackling procedure has already decided, and a plan concerning environment
influence countermeasures is made within 6 months in case some incident occurs after the project
starts.
3) The points of concern
① As regards relevant regulations about the projects in the fishery sector, the rules that meet the scale
and contents of the developments (area size, fresh water/seawater distinction) are established, since the
development of aquaculture ponds for shrimp and fish have an influence on the ecosystem of the local
area and coast (material and water), the land features, and ecosystem of a mangrove swamp.
Regarding outer ring fishing port development, consultation with the department in charge is needed
in case facilities like a storage tank are set up.
② About the fishing port facilities, the regulations regarding harbors are applied. For the fishing port
development, the EIA examines certain construction operations such as landfill, dredging and pile
driving. Depending on the classification and scale of facilities, such as a breakwater, a quay, shore
protection and landfill, the necessity of EIA and the implementation level of evaluation committees

154
(the ministry, province and district) are decided. Considerations such as an ocean surge, ocean currents,
drifting sand and the atmosphere are referred to. Regarding the operations that fall under the items
shown in the next table, it is necessary to carry out analysis on the environmental influence (This rule
is a new system). In case of fishing port facilities, implementation responsibility of the EIA lies with
the MMAF.
Table 5.4-1 Regulations regarding development of the harbor
Number Contents of development The scale and scientific reason
1 Railroad track network More than 25km
2 Underground railroad track construction All
3 Terminal facilities More than 2ha
4 a: Dredging in the water area
b: Dredging in the river and the ocean
bedrock, and nature of rocks
More than 500,000m2
All (There is a possibility of influence on local
society and influence on waterway systems,
coastal ecosystem, a change in the topography and
natural processes flowing to the ocean from the
river.)
5 Per each facility:
a: Sheet pile and pile driving quay
Extension and dimensions
b: Gravity-type quay
c: Shore protection and breakwaters
d: Onshore facilities (Terminals, storage,
container facilities, etc.)
e: Mooring buoy
More than 200m, more than 6,000m2
All
More than 200m
More than 5ha
More than 10,000DWT
6 Filling in land More than 25ha, or more than 500,000m3
7 Waste abandonment near the site (This
item is not clear)
More than 500,000m3, or more than 5ha
8,9,10 Construction of an airport All
Source: The environment law decreed by the Ministry of Environment, October 2009
(2) Private sector’s needs and projections of the demand for fish and fish products
1) Private sector’s needs
The private sector’s demand for hygiene standard varies and physical arrangement for quality
control can be easily outdated. Therefore it is not always realistic to construct fishing port facilities
that meet such demand from the private sector. In order to make effective use of public funding, it

155
would be worthwhile to consider facilities that do not include hygiene and quality control related
functions. The tenants of the facilities (i.e. private sector) can make necessary arrangement that meet
their own needs of hygiene and quality control.
It should be also mentioned here that foreign fishery product importers often very selective in
purchasing fish aiming mainly for high quality and high value fishes, and it may go against the
principles of effective use of fishery resources. There are various consumer needs for fishery products,
the authorities need to pay due considerations on such aspect in managing fisheries resources.
Moreover, the present fishing port facilities have a problem with unloading the fish catch; it
takes too long and the quality of fish deteriorates. It is desired that the outer ring fishing port facilities
will have the scale and specifications to satisfy international standards of hygiene and efficient
handling of fish and fishery products.
2) Estimates for demand for fish and processed fish products in Indonesia
The demand for fish has increased generally in Indonesia. This is because the government has
been promoting fish consumption from the viewpoint of health. Directorate General of Fisheries
Product Processing and Marketing of MMAF has been conducting extension activities for fish
consumption. Also, the demand for processed products to satisfy the diversified consumers’
preferences has increased, for example fish jerky produced in certain districts such as Ternate are now
sold throughout Java Island. To market these products, acquisition of halal certificate is required, and
this is the point to pay attention on the technology guidance for product development.
Thus, the development of processed products, even if they are small scale, is promising activity
that enables the use of various fish resources with a little market value. To assist the above activity, it
is important to strengthen the information service function about fish catch when the fishing port
facilities are developed.
Since this study is conducted mainly through the collection and analysis of existing information
and site surveys of 7 ports, it has only examined the outline of ORFP-DP, not the details of each
fishing port. Therefore, for the thorough examination of the ORFP development plan, it is necessary to
collect more detailed information through further investigation, to make clear the level of
responsibility for construction work already completed within the framework of the project, and to
discuss continuously the concrete implementation methods to ensure quality of each project.