data democratisation: liberate your data to unlock its true value
TRANSCRIPT


19.03.2015
DATA DEMOCRATISATION:LIBERATE YOUR DATA TO UNLOCK ITS TRUE VALUE
Webinars by AT Internet
2

DATA DEMOCRATISATION
Nicole Pukala
› Sales Manager, Central
Europe
Daria Vasilyeva
› Digital Analytics Consultant,
Moscow, Russia
3
ABOUT SPEAKERS

› How do we understand Data Democratisation at AT Internet?
› What impact does the actual use of the data have on your
business?
› Examples: How can we help your business to manage a seemingly
unbearable pool of information in a way that it can improve the
online conversion of your business?
4
KEY QUESTIONSTO BE DEALT WITH TODAY

5
DATA COLLECTEDIN 2005

6
DATA COLLECTEDIN 2015

7
GOOGLE SEARCHLAYERS

8
GOOGLE SEARCHDATA LAYERS

DATA DEMOCRATISATION
9

10
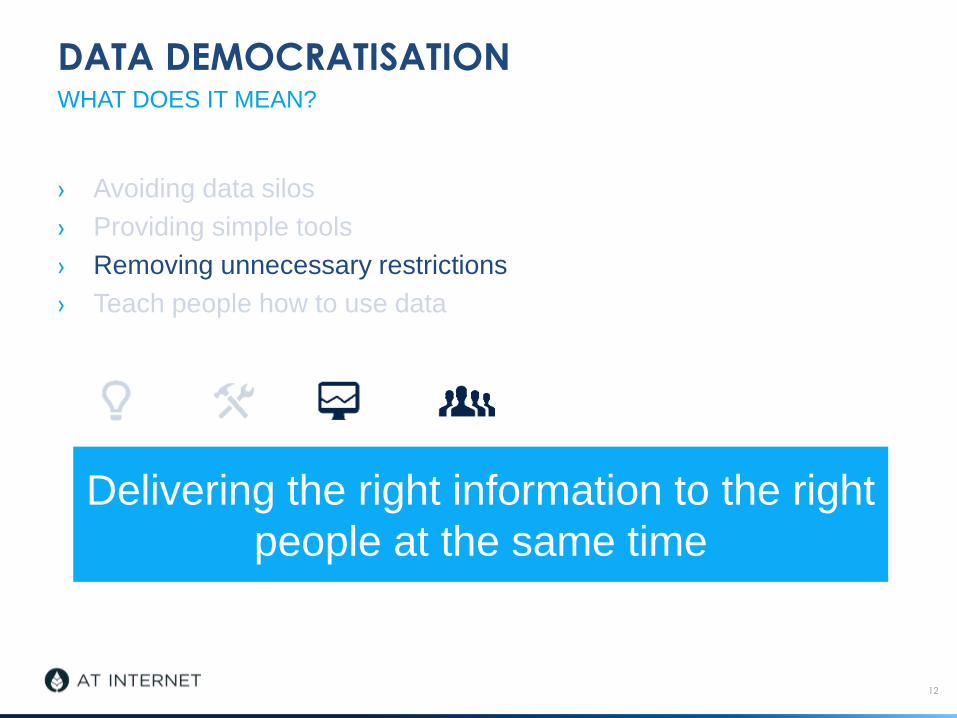
› Avoiding data silos
› Providing simple tools
› Removing unnecessary restrictions
› Teach people how to use data
Delivering the right information to the right
people at the same time
DATA DEMOCRATISATIONWHAT DOES IT MEAN?

11
› Avoiding data silos
› Providing simple tools
› Removing unnecessary restrictions
› Teach people how to use data
Delivering the right information to the right
people at the same time
DATA DEMOCRATISATIONWHAT DOES IT MEAN?
12
› Avoiding data silos
› Providing simple tools
› Removing unnecessary restrictions
› Teach people how to use data
Delivering the right information to the right
people at the same time
DATA DEMOCRATISATIONWHAT DOES IT MEAN?

13
› Avoiding data silos
› Providing simple tools
› Removing unnecessary restrictions
› Teach people how to use data
Delivering the right information to the right
people at the same time
DATA DEMOCRATISATIONWHAT DOES IT MEAN?

14
› Reports designed by end users
› Central repository for data analysis
› User interaction
› Scalable solution
Delivering the right information to the right
people at the same time
DATA DEMOCRATISATIONWHAT DOES IT MEAN?

15
› Reports designed by end users
› Central repository for data analysis
› User interaction
› Scalable solution
Delivering the right information to the right
people at the same time
DATA DEMOCRATISATIONWHAT DOES IT MEAN?

16
› Reports designed by end users
› Central repository for data analysis
› User interaction
› Scalable solution
Delivering the right information to the right
people at the same time
DATA DEMOCRATISATIONWHAT DOES IT MEAN?

17
› Reports designed by end users
› Central repository for data analysis
› User interaction
› Scalable solution
Delivering the right information to the right
people at the same time
DATA DEMOCRATISATIONWHAT DOES IT MEAN?

DATA DEMOCRATISATIONSEGMENTATION AND API
18

DATA DEMOCRATISATION
19
THROUGH SEGMENTATION
We need to ‘segment or die’ and stop trying to
find the average audience but instead
reaching all types of users.
«
»Avinash Kaushik, Web Analytics Evangelist
AT Internet’s segmentation tool, available in
DataExplorer module, provides online
marketers/analysts not only with accurate,
reliable data in real-time, but with data which
can be exploited immediately.
*DataExplorer is integrated as part of the Analyzer solution

20
APPLICATION PROGRAMMING INTERFACE
’’
’’
AND WHY IS IT USEFUL?
WHAT IS AN API?
Email Dashboard Excel CRM Ad Server
API - architecture for sharing data between platforms and applications. Content
that is created in one place can be dynamically reproduced and updated in
multiple locations.

“The easy to use Data Query tool, means
that your web analysts are completely
autonomous in creating API URLs.”
Bruno Guilbot
Data and Behavioural Marketing Manager
Solocal Group
REST APIDATA QUERY TO SET UP REST URL

SCM E-PROC ERP CRMEXTERNAL
DATA
ETL PROCESS
EXTRACT – TRANSFORM - LOAD
DATA WAREHOUSE
Information is generated, stored and distributed
Data Marts OLAP Cubes
22
Reports Tables Dashboards Scorecards Forecasts
API API API APIDATA SOURCE
LAYER
ETL LAYER
DATA WAREHOUSE
LAYER
ANALYTICAL LAYER
THE APIDATA LAYERS

USE CASES
23

# GOALS• Increase user loyalty
• Grow and develop audience & readership
# RESULTS• Visitors return to the site and
consume even more content
• Visits from Google News grew +74%
(in 4 months)
EXAMPLE - MEDIA AND PUBLISHING
ACTUAL USE OF DATA

AMAZON EMR
PIG RUBY
SCRIPTS
COPY
ETL Scripts ETL Scripts
Staging Area Data Warehouse Data Exploration
EXAMPLE - MULTIMEDIA CLIENT
ACTUAL USE OF DATA

ABANDONED THE QUOTE.
RETURNED ON THE WEBSITE.
THANKS TO TMS THE
RIGHT CONTENT IS ONLINE
TRIGGER TO CMS TO
PUBLISH A REMINDER
CA
SE
A
ACESS THE HOMEPAGE
FROM EXTERNAL CAMPAIGN
CONTENT IS ADAPTED
ACC. TO THE CAMPAIGN
THE CAMPAIGN IS
IDENTIFIED BY AXA
CA
SE
B
IDENTIFY
VISITOR
ANALYSE
BEHAVIOUR
CHOOSE THE
CONTENT
CROSS INFO
CRM DATA
END TO END MODELLING AT AXA INVESTMENT BANKING
ACTUAL USE OF DATA

ACTUAL USE OF DATA
27
TAG MANAGEMENT ACTIONS
› Choose tag management system like Tag Commander
› Insert tags
› Create rules when tag has to be set
› Standard WA tag shall be submitted for every page hit
› Sales tracker tag shall just be called when a sales or
subscription is done
› Internal search shall just be submitted when a search is
done
› etc.

OBJECTIVES
• Standardize the KPI’s and metrics for all
internet businesses
• Create a group-wide kpi dashboard, plus
local dashboards to pilot digital activities
in real time
ACHIEVEMENTS
• KPI and dashboards for HQ and for each
business units delivered (more than 200
sites/apps)
• Automated data collection for all
dashboards via api
ACTUAL USE OF DATAEND TO END DASHBOARDS - CLASSIFIEDS

DATA WAREHOUSE
CHIEF EDITOR SALES AND MAKETING MANAGEMENT
ACTUAL USE OF DATA
customised exports
automation
data culture
DATA MANAGEMENT AT MEINE STADT

DATA WAREHOUSE
CHIEF EDITOR SALES AND MAKETING MANAGEMENT
ACTUAL USE OF DATA
customised exports
automation
data culture
DATA MANAGEMENT AT MEINE STADT

ACTUAL USE OF DATA
31
CONVERSION OPTIMISATION - BANKING
OBJECTIVES
Improve usability to increase conversion by
combining MV testing with web analytics
ACHIEVEMENTS
• Conversion rates have improved in the
majority of funnels
• Every new revamp project relies on MV
testing waves before being published
online
DATA DEMOCRATIZATION
• WA & MV data in one system
• All stakeholders get access to data

ACTUAL USE OF DATA
JOHN SEES
TV ADVERT
JOHN VISITS THE
ADVERTISER’S WEBSITEDRIVE-TO-WEB
ANALYSIS
TV ADVERT
RECOGNITION
TV TRACKING

ACTUAL USE OF DATATV TRACKING DASHBOARD

TV TRACKING DASHBOARD
ACTUAL USE OF DATA

DASHBOARDING
35

DASHBOARDING
36
› External cognition
› Communication
› Visualization of connectional content
› Exploration
› Enhancement of productivity
GOALS
Delivering the right information to the right
people at the same time

DASHBOARDING
› Too much data
› No insights included
› Colours are more important than insights
› Show only one dimension and have no significance
› Silly scale – no comparisons are possible (i.e.sparklines)
› No clear message
37
BAD DASHBOARDS

DASHBOARDINGBAD DASHBOARDS

DASHBOARDING
Benchmark & segment
Isolate your critical few metrics
Don´t stop at metrics – include insights!
• Insight
• Recommendation for action
• Business insights
The power of a single page
Churn and stay relevant – evolve constantly
39
5 RULES FOR A GOOD DASHBOARD

DASHBOARDING
Different dashboards
for
different stakeholders
STAKEHOLDERS DASHBOARDS

TABLEAU
TOOLS FOR DATA VISUALISATION

QLICKVIEW
TOOLS FOR DATA VISUALISATION

MANEYES
TOOLS FOR DATA VISUALISATION

https://apps.atinternet-solutions.com/
AT INTERNET - DASHBOARD APP
TOOLS FOR DATA VISUALISATION

WWW.ATINTERNET.COM
Daria Vasilyeva – Digital Analytics Consultant