data-driven illustrations for climate smart communities
TRANSCRIPT

Portland State University Portland State University
PDXScholar PDXScholar
TREC Final Reports Transportation Research and Education Center (TREC)
10-2013
Data-Driven Illustrations for Climate Smart Data-Driven Illustrations for Climate Smart
Communities Scenarios Communities Scenarios
Nancy Yen-wen Cheng University of Oregon
Kim Ellis Metro
Molly Vogt Metro
Clint Chiavarini Transportation Research and Education Consortium
Justin Houk Transportation Research and Education Consortium
See next page for additional authors Follow this and additional works at: https://pdxscholar.library.pdx.edu/trec_reports
Part of the Environmental Policy Commons, Transportation Commons, and the Urban Studies and
Planning Commons
Let us know how access to this document benefits you.
Recommended Citation Recommended Citation Cheng, Nancy Yen-wen, Kim Ellis, Molly Vogt, Clint Chiavarini, Justin Houk, Brian Lockyear, Boyce Postma, and Peggy Morell. Data-Driven Illustrations for Climate Smart Communities Scenarios. OTREC-SS-728. Portland, OR: Transportation Research and Education Center (TREC), 2013. https://doi.org/10.15760/trec.57
This Report is brought to you for free and open access. It has been accepted for inclusion in TREC Final Reports by an authorized administrator of PDXScholar. Please contact us if we can make this document more accessible: [email protected].

Authors Authors Nancy Yen-wen Cheng, Kim Ellis, Molly Vogt, Clint Chiavarini, Justin Houk, Brian Lockyear, Boyce Postma, and Peggy Morell
This report is available at PDXScholar: https://pdxscholar.library.pdx.edu/trec_reports/62

A National University Transportation Center sponsored by the U.S. Department of
Transportation’s Research and Innovative Technology Administration
OREGON
TRANSPORTATION
RESEARCH AND
EDUCATION CONSORTIUM OTREC FINAL REPORT


DATA-DRIVEN ILLUSTRATIONS FOR CLIMATE SMART COMMUNITIES SCENARIOS
OTREC-SS-728
by
Nancy Yen-wen Cheng
University of Oregon
Kim Ellis
Metro
Molly Vogt
Metro
and Clint Chiavarini, Justin Houk, Brian Lockyear, Boyce Postma, and Peggy Morell
for
Oregon Transportation Research
and Education Consortium (OTREC)
P.O. Box 751
Portland, OR 97207
October 2013


Technical Report Documentation Page 1. Report No.
2. Government Accession No.
3. Recipient’s Catalog No.
4. Title and Subtitle
Data-Driven Illustrations for Climate Smart Communities Scenarios
5. Report Date October 2013
6. Performing Organization Code
7. Author(s)
Nancy Cheng, Kim Ellis, Molly Vogt, Ericka Brendel, Clint Chiavarini, Justin Houk, Boyce
Postma, Brian Lockyear and Peggy Morell
8. Performing Organization Report No.
9. Performing Organization Name and Address
University of Oregon Department of Architecture
1206 University of Oregon Eugene, OR 97403-1206
10. Work Unit No. (trais)
11. Contract or Grant No.
12. Sponsoring Agency Name and Address
Oregon Transportation Research and Education Consortium (OTREC)
P.O. Box 751 Portland, Oregon 97207
13. Type of Report and Period Covered
14. Sponsoring Agency Code
15. Supplementary Notes
16. Abstract
Public investment in transit and streetscape improvements can encourage private development, and subsequently increase transit ridership and
reduce pollution. Portland, OR’s Metro regional government has developed investment scenarios designed to reduce light vehicle carbon emissions. Adopting a regional scenario requires public review and consultation with local governments who will implement the comprehensive
plans and land-use regulations. Decision makers and residents need to understand potential benefits: ways in which targeted investment could
generate more livable urban spaces while reducing greenhouse gases. Illustrations can show how the investments could shape the pedestrian experience through trees, street furniture, buildings, open spaces, etc.
This report explains a new workflow to illustrate urban development possibilities that can be adjusted according to evolving forecasts.
Developing accessible scenario illustrations from city and regional planning forecasts requires sound analysis and thoughtful graphics to effectively communicate the analysis results. Our workflow connects planning forecasts (incorporating economic, transportation and land
development data) to a parametric urban modeler to generate development massing, with views refined with 3D and 2D graphic procedures.
Our objective has been to streamline the creation of visuals that communicate community development patterns and amenities provided with different levels of investment. A streamlined procedure allows different designers to generate illustrations with a consistent graphic style. The
report documents the workflow, and identifies challenges, opportunities and questions for further work.
17. Key Words
Urban visualization, transportation, urban development, parametric modeling
18. Distribution Statement
No restrictions. Copies available from OTREC: www.otrec.us
19. Security Classification (of this report)
Unclassified
20. Security Classification (of this page)
Unclassified
21. No. of Pages
22. Price


ACKNOWLEDGEMENTS
This project was funded by the Oregon Transportation Research and Education Consortium
(OTREC). In addition to the authors, contributors to the project include Metro staff Paul Couey,
Alan Gunn, Matthew Hampton, and Janice Larson. Technical advice was provided by ESRI
personnel including Shannon McElvaney, Sean Morrish, and John Sharrard. We would like to
thank UO A&AA Dean Frances Bronet, Architecture head Judith Sheine, former Metro Research
Center Director Mike Hoglund, former Metro Planning and Development Director Robin
McArthur, and former Metro Planning Manager Christina Deffebach for their encouragement
and support.
DISCLAIMER
The contents of this report reflect the views of the authors, who are solely responsible for the
facts and the accuracy of the material and information presented herein. This document is
disseminated under the sponsorship of the U.S. Department of Transportation University
Transportation Centers Program in the interest of information exchange. The U.S. Government
assumes no liability for the contents or use thereof. The contents do not necessarily reflect the
official views of the U.S. Government. This report does not constitute a standard, specification,
or regulation.


TABLE OF CONTENTS
EXECUTIVE SUMMARY .......................................................................................................... 1
1. BACKGROUND AND INTENTIONS .................................................................................. 2
2. APPROACH ............................................................................................................................. 3
3. AUDIENCE AND PURPOSE ................................................................................................. 5
4. GRAPHIC PROCESSES AND CHALLENGES .................................................................. 5
5. CONNECTING BUILDING DEVELOPMENT TO JOB AND HOUSING
PROJECTIONS .......................................................................................................................... 12
6. ISSUES: PLACE SPECIFICITY, PLANNING ABSTRACTION AND SOFTWARE
FIT ........................................................................................................................................... 18
7. CONCLUSION ...................................................................................................................... 20
8. LIST OF FIGURES ............................................................................................................... 21
9. REFERENCES ....................................................................................................................... 22


1
EXECUTIVE SUMMARY
Public investment in transit and streetscape improvements can encourage private development,
and subsequently increase transit ridership and reduce pollution. Portland OR’s Metro regional
government has developed investment scenarios designed to reduce light vehicle carbon
emissions. Adopting a regional scenario requires public review and consultation with local
governments who will implement the comprehensive plans and land-use regulations. Decision
makers and residents need to understand potential benefits: ways in which targeted investment
could generate more livable urban spaces while reducing greenhouse gases. Illustrations can
show how the investments could shape the pedestrian experience through trees, street furniture,
buildings, open spaces, etc.
This report explains a new workflow to illustrate urban development possibilities that can be
adjusted according to evolving forecasts. Developing accessible scenario illustrations from city
and regional planning forecasts requires sound analysis and thoughtful graphics to effectively
communicate the analysis results. Our workflow connects planning forecasts (incorporating
economic, transportation and land development data) to a parametric urban modeler to generate
development massing, with views refined with 3D and 2D graphic procedures. Our objective has
been to streamline the creation of visuals that communicate community development patterns
and amenities provided with different levels of investment. A streamlined procedure allows
different designers to generate illustrations with a consistent graphic style. The report documents
the process of creating data-driven illustrations using ESRI ArcGIS, ESRI CityEngine, Sketchup;
then identifies challenges, opportunities and questions for further work.

2
1 BACKGROUND AND INTENTIONS
Governments can help reduce greenhouse gas emissions by investing in urban centers, corridors
and employment areas in ways that attract private development of pedestrian and bicycling-
friendly communities. Investments can take the form of providing services and shopping near
where people live, expanding transit service, managing parking and providing safer routes for
walking and biking and other tools. Removing barriers to more efficient use of land and existing
infrastructure can also help local governments achieve their desired community visions.
The Climate Smart Communities Scenarios Project was initiated in response to a mandate from
the 2009 Oregon Legislature to develop a strategy to reduce greenhouse gas emissions from cars
and small trucks by 2035. The goal of the CSC project is to adopt a preferred approach that
meets the state mandate and supports community visions for downtowns, main streets and
employment areas.
To better understand how best to support community visions and reduce greenhouse gas
emissions, Metro evaluated three approaches - or scenarios - to investing in locally adopted land-
use and transportation plans and policies, and evaluated the impact of those investments on how
the region grows over the next 25 years. The analysis results will be used to frame a regional
discussion about which investments and actions should be included in a preferred approach for
the Metro Council to consider for adoption in December 2014. Sound analysis and informative
graphics are needed to effectively communicate the results of the analysis to help policymakers
and the public understand the tradeoffs and benefits associated with different investments.
This research project is focused on the development of informative and accessible illustrations of
combined transportation and land development strategies that yield different levels of
greenhouse gas emission reductions. Illustrations of the scenarios tested were intended to help
policymakers and other stakeholders better understand the potential on-the-ground impacts of
each scenario.
The project team researched several processes to create visualizations and illustrations that can
be updated and adjusted to reveal alternative development possibilities that reflect forecasted
growth. Our workflow uses city and regional growth distribution forecasts to generate possible
urban development massing, with views refined with 3D and 2D graphic procedures. The goals
include streamlining the creation of visuals that communicate urban form and street design
provided with different levels of investment, and defining a procedure that allows different
designers to step in during the life of a project and create a set of illustrations that has a
consistent graphic style. This report documents the approach taken, describes the recommended
workflow, and identifies challenges and questions for further work.
The project has provided an important opportunity to build on Metro's leadership in planning,
mapping and data analysis with the University of Oregon's (UO) architectural graphics
proficiency. It has served to build relationships for future collaborations between the UO's

3
Architecture Department, Metro's Data Resource Group (DRC) and Climate Smart Communities
(CSC) Scenarios project team, the City of Portland's Bureau of Planning and Sustainability
(PBPS) and ESRI CityEngine software developers (ESRI CE).
2 APPROACH
The Metro CSC team worked with regional advisory committees, community and business
leaders, and other stakeholders to develop three scenarios to evaluate during the summer of
2013:
Scenario A – Recent Trends - This scenario is a projection of how the region would grow if
current local government transportation and land-use plans are followed through to 2035
with existing revenues and policies.
Scenario B – Adopted Plans - This scenario is a projection of how the region would grow if
current local government transportation and land-use plans are followed through to 2035
with the revenues anticipated in the 2035 Regional Transportation Plan.
Scenario C – New Plans and Policies - This scenario is a projection of how the region
would grow if current local government transportation and land-use plans are followed
through in addition to implementing the emerging Southwest Corridor land-use vision
and pursuing more investment throughout the region.
Scenario B - adopted plans for increased investment - has been calibrated to adopted land-use
plans and a regionally developed, local-government-reviewed household and employment
forecast adopted by the Metro Council in November 2012. The data from this project results
from state-of-the-art models that calculate greenhouse gas emissions, regional travel, and the
growth and distribution of households and jobs.
The Scenario B and Scenario C data has been translated into color-coded maps using Fregonese
Associates’ Envision Tomorrow ArcGIS-based Scenario Builder, an urban and regional planning
sketch-planning tool used to develop and evaluate land-use growth scenarios. Land-use
Development Types (Dev Types) were defined as percentages of building types (such as office,
industrial, multifamily residential and mixed use) and typical building heights in number of
stories. Development Types were assigned to 264-foot two-grid cells by painting on color-coding
as consequences of the transportation and land-use policy directives. Envision Tomorrow
calculates each grid cell’s capacity for housing units and jobs (among other possible measures).
This allows planners to correlate growth distribution scenarios to numbers of housing units and
jobs that could be accommodated.

4
Figure 1: Fregonese Associates' Envision Tomorrow allows planners to paint Development
Types onto map grid cells.
Figure 2: Each Development Type corresponds to specific proportions of building types,
building height, number of housing units and jobs, and transit activity. Graphic cards by Ryan
Sullivan of Paste in Place graphics.
This development capacity was subsequently reviewed by city and county staff and then
modeled using MetroScope, another planning tool utilized by Metro’s Data Resource Center to
support the Climate Smart Communities Scenarios Project. MetroScope forecasts growth
distributions through the interplay of market forces with land-use policies and transportation.
MetroScope takes into account economic trends (employment by industry class) and
demographic trends (households by size, income and age bracket); local zoning and planned
capacity; an inventory of buildable land; real estate value/prices; urban reserves supply; system
development charges; and other development factors to estimate future household and
employment growth and distribution in the region.

5
3 AUDIENCE AND PURPOSE
From these broad planning forecasts, the team's job has been to translate how the growth
scenarios would look in a particular district on the ground. Planning data is often abstract and
challenging to understand, so the illustrations are intended to help communicate the results of the
evaluation to stakeholders so they may provide input on what strategies and investments they
support for their community.
Illustrations can help planners, policymakers and the public develop a common understanding
about how policies could affect specific places. For example, transforming vacant land or surface
parking lots into new retail or services served by transit and building new sidewalks and bicycle
routes can help create a vibrant, pedestrian-friendly environment. Illustrations can make these
possibilities legible, and build support for these investments and other policies such as
retrofitting streetscapes to include street lighting, street trees and planting beds.
A wide variety of stakeholders were identified through the research process, creating the need for
different types of visualizations. Some of these stakeholders include taxpayers, local government
officials, GIS data specialists, state government officials, and local business owners. Each
stakeholder would likely require a slightly different variation of the graphic that would be easiest
to read. For example, a mayor might want to look at new development from an aerial view,
providing a quick grasp of the complete implications of development on a district or city level,
while a small-business owner might want to see what that development means in terms of
modified access to the street or public transportation. Both are equally relevant, but require a
different type of illustration.
Many styles and concepts for visualizations were discussed in the early phases of the project,
including simple cartoony city graphics, detailed realistic renderings, data-centered
visualizations that read as infographics, simple color-coded 3D blocks, and some combination of
these communication tools. Because the research has emphasized exploring alternatives rather
than producing finished renderings, no definitive style for this work was identified. Instead, a
description of the graphic workflow and sample images were developed for further exploration at
a later date.
4 GRAPHIC PROCESSES AND CHALLENGES
Planners and GIS professionals often develop, store and analyze planning schemes in databases
that have spreadsheet user interfaces, which can generate two-dimensional map graphics. The
purpose of this research is to make this data accessible and legible to a wider audience through
three-dimensional illustrations.
It was first necessary to understand the tools that were available and how they might work
together to produce a relatively simple workflow process, allowing for future usability. ESRI’s
CityEngine was the first tool under investigation, a 3-D procedural modeling and visualization

6
software designed to work within a GIS environment. We received input and suggestions from
many people at ESRI throughout the development of this research, and it should be noted that
without their feedback and support the research would have been impossible to complete.
CityEngine (CE) can be used to visualize an existing place utilizing GIS data and to visualize
new places based on desired parameters and quantitative urban form characteristics. The primary
strength of the software and reason for its use in this research is its unique ability to create
adjustable urban environments through parametric procedural modeling. This means that many
buildings, roads and urban elements created within the visualization are controlled through
geometric rules programmed by the author, as opposed to piece-wise development of individual
geometric elements. This is powerful because it allows for dynamic change of many individual
model elements to reflect changes in the development parameters.
For example, creating a building in CE does not require extruding a box and punching windows
in the box as in typical 3D modeling software such as Trimble Sketchup (SU), or Autodesk 3DS
MAX. Instead, creating a building in CE requires writing a set of operations in the procedural
language known as .CGA scripting. To grow a building, the footprint of the box is copied
vertically for a specific number of floors, then the faces of the box are split into bays, windows
and door areas. When a building is created this way, options can be developed in the code to
allow for geometric manipulations via changes to the code, the built-in properties “slider bars.”
Production of a single building through code would be inefficient – writing code requires
understanding the syntax and programming language, and is less intuitive than a graphical user
interface. However, producing many buildings – across a neighborhood, district or city –
becomes much more efficient using code-based automation. In contrast to manual manipulation,
where each building takes the same amount of time to produce and adds up over a modeled site,
in code-based modeling a single line of code many be edited to increase the number of buildings
from one to 15 or 500. If you wanted to create a city made of boxes with 4’2" widows, and then
later decide that actually you want them slightly larger, it would take hours in a typical static
modeler such as SU or 3DS Max. But with a dynamic modeler, the change is instantaneous. This
software was the obvious choice for creating rapid visualizations for the data that already existed
in the GIS world.
The original intention was to develop all elements of place through CE and export it to rendering
software such as 3DS Max or Kerkythea (Kerky) via SU, followed by Photoshop and
distribution. This would allow for relatively low graphics skills to create visualizations in a semi-
rapid manner, with extreme ease of manipulation dictated by data variations.
Graphic workflows in the research process are described below.
4.1 CITYENGINE AS THE PRIMARY MODELLER
Initially, there was a serious investment in learning CE to develop and export entire city scenes
for rendering. The software workflow functioned well in creating new urban regions, and
generated more geometric conflicts and bugs when used with existing GIS data or modeling

7
places with lots of open space in between landmarks. As the software interface matures, this
approach should be further explored in the future, as seen in robust vendor examples.
Strengths:
Can lead to more efficient workflow.
Less software to learn.
Potential to create code that very quickly models a wide variety of place types with ease.
Future integration with ESRI software.
Excellent at modeling dense urban environments based on lot parameters.
Weaknesses:
Requires more deep time investment to fully develop a parametric neighborhood.
Poor at modeling less dense environments where buildings have a loose relationship with
the lot shape.
Does not relate multiple geometries. All geometry manipulation must take place within
one object.
Does not fill gaps in GIS database.
Figure 3. CityEngine uses rules to generate streets from street centerlines and buildings from lot
footprints, leaving gaps from setbacks and right-of-ways.
4.2 CITYENGINE BUILDINGS WITH GOOGLE EARTH BASE MODEL
To facilitate quick, accurate building placement, we tested Google Earth as a model platform,
exporting parts of the CE model as .KMZ files (typically buildings only). If the original GIS data
is georeferenced, all procedurally modeled CE geometries are also georeferenced and on import
to Google Earth are automatically placed accurately. For East Portland’s Gateway district, we
created roughly a dozen buildings sized according to MetroScope data and a recent Urban
Design plan (PDC, 2012), then imported these directly into Google Earth. They appeared in their
correct places on the 2D map. Using Google Earth’s 3D environment created by LIDAR

8
lightfield scanning, the buildings created in CE fit right into their existing surroundings.
Screenshots were then taken and cleaned up in Photoshop.
Figure 4: Google Earth image of existing land (top) with CityEngine buildings (middle) and
Photoshop (bottom).
Strengths:
Extremely easy once models are built in CE.
Georeferenced, so no placement is necessary.
Batches imports.
Good quality of satellite photo and export resolution (with Google Earth PRO).
Easy to create Photoshop scripts for some entourage since resolution is constant.
Excellent background visuals for aerial perspectives with the built-in topography toggle.

9
Weaknesses:
The source LIDAR data used for this area was inconsistent - many parts of the scene had
erroneous elevations.
Geometry conflict - This method really only works well for building on what exists, as
the geometries you import will simply be placed over the existing geometries. This is
especially true of trees, which will often appear to be emerging from imported
geometries.
In some cases, may require extensive Photoshop manipulation.
Figure 5: Pedestrian street-level views exaggerate distortions of site photos captured from above
and require supplementary foreground information. Right foreground shows unrealistic covered
tree canopy.
Figure 6: Non-photorealistic illustration effects can be created by post-processing the images.
Limited control over edge precision makes the techniques less appropriate for illustrating
buildings. (See work of Dr. Jürgen Döllner and David Salesin.)
4.3 CITYENGINE BUILDINGS WITH SKETCHUP SITE
DEVELOPMENT
Because CE uses geometric rules to create streets, blocks, buildings and other urban elements, it
works efficiently and precisely when creating new cities. Results were messier using CE to

10
generate forms from real-world GIS data. Immediately, technical complexities became apparent:
the auto-generated world of the parametric roads and buildings did not fit perfectly with the
existing GIS data. For example, lot easements and setbacks created gaps between the idealized
sidewalks and building facades. Additionally, the machine would sometimes hang due to the
large volume of data.
To avoid these gaps and other site geometry challenges, we exported CE’s parametrically
generated buildings into a clean base model created in Sketchup from the GIS maps. Due to the
small data involved, export of individual buildings could be done much more consistently than
export of a large urban neighborhood.
The automatically generated CE buildings can be just one layer of information in a 3D
visualization that can also include streets, vegetation, sky, background, and entourage such as
scale figures and vehicles. To complement the CE buildings, a 3D streetscape “toolkit” of linear
street, swale, sidewalk and other amenities was developed in Sketchup. This toolkit allows quick,
consistent modeling of pedestrian-friendly urban streets, as the model elements can be placed
onto a base aerial image. The elements of the toolkit are taken from the 2002 Metro design
guidelines. Buildings from CE could then be placed in their appropriate locations, and the image
exported to rendering software. From there, edits in Photoshop, adding the additional layers of
information, can create a visually interesting image.
Figure 7: Streetscape toolkit provides linear components for pedestrian-friendly green streets.

11
Strengths:
Strong aesthetic control of the final product.
Accessible modeling environment allows integration of third-party visualization tools.
Weaknesses:
Illustrations cannot contain parametric elements or be interactively data-driven.
While moving the 3D model from CityEngine to Sketchup makes the interactive “data-driven”
aspect of visualizations one step removed, the Sketchup platform provides an accessible level of
modeling control and refinement. Though this process does not truly merge the worlds of GIS
databases and compelling 3D renderings, it gets close to some of the projects goals and certainly
illuminates the path forward. In the future, these streetscape toolkits could be turned into
parametric objects within CityEngine for automatic deployment, though it would not address the
challenge of gaps between the idealized street definition and the complex reality of lot
boundaries.
Figure 8: Scenarios A, B & C with CityEngine buildings and streetscape elements. Lifting the
viewpoint off the ground shows spatial organization better than ground-level perspectives.

12
5 CONNECTING BUILDING DEVELOPMENT TO JOB AND
HOUSING PROJECTIONS
5.1 DATA-DRIVEN WORKFLOW
In addition to looking at the graphics workflow, we separately examined how to make the
Envision Tomorrow Development types drive the urban massing in CE. The intention was to use
the Development Type categories assigned to grid cells in Envision Tomorrow to define and
grow appropriate building types until we hit the target job and housing numbers. The steps
include:
1. Generate massing of existing buildings from the GIS data.
2. Identify building lots ripe for development.
3. Select appropriate CE building types and define their vertical massing.
4. Measure the associated jobs and housing projected from the demolished and proposed
buildings.
5. Create an iterative feedback loop which continues to develop property until the target
numbers are reached.
We diagrammed this path from the GIS data, reflecting Envision Tomorrow and Metroscope
analysis, through the software platforms. The Envision Tomorrow development grids, property
tax lots and existing building footprints are imported into CityEngine as shapes on separate
layers, each annotated with relevant GIS data.
GIS
to
CityEngine
to
Python
to
CityEngine
to
Sketchup
to
Photoshop/Illustrator

13
Figure 9: Workflow concept shows sequence of decision points and operations.
14
Switching into the Python programming environment within CityEngine, the lots are first aligned
to the development grid cells and assigned the corresponding development type. From this point
we iteratively select and redevelop lots based upon the Envision Tomorrow goals for housing
and jobs within each grid cell. The diagram shows a complete workflow for this process, which
was partially implemented during the study. In the complete flow, a grid cell is selected and
evaluated relative to its target job and housing numbers. If underdeveloped, a lot within the grid
cell is chosen for redevelopment based upon a criteria function such as underutilization of the
existing property. Existing buildings are removed from the lot and a new building type (e.g.,
single-family residential, office or industrial) assigned based on the building types mapped to the
lot’s associated grid’s Development Type (e.g., commercial node, urban residential or light
industrial). The new building is generated and the grid reassessed relative to the Envision
Tomorrow goals. The iteration continues until all grid cells meet their target goals or no further
development towards meeting those goals is possible.
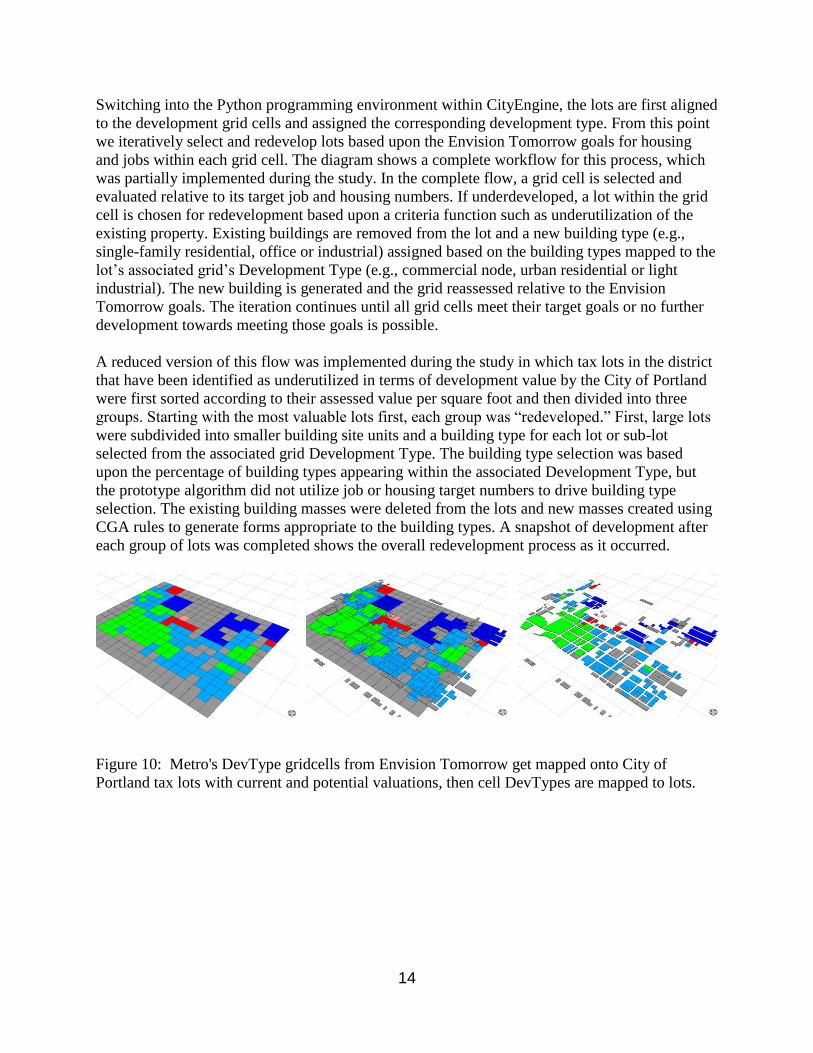
A reduced version of this flow was implemented during the study in which tax lots in the district
that have been identified as underutilized in terms of development value by the City of Portland
were first sorted according to their assessed value per square foot and then divided into three
groups. Starting with the most valuable lots first, each group was “redeveloped.” First, large lots
were subdivided into smaller building site units and a building type for each lot or sub-lot
selected from the associated grid Development Type. The building type selection was based
upon the percentage of building types appearing within the associated Development Type, but
the prototype algorithm did not utilize job or housing target numbers to drive building type
selection. The existing building masses were deleted from the lots and new masses created using
CGA rules to generate forms appropriate to the building types. A snapshot of development after
each group of lots was completed shows the overall redevelopment process as it occurred.
Figure 10: Metro's DevType gridcells from Envision Tomorrow get mapped onto City of
Portland tax lots with current and potential valuations, then cell DevTypes are mapped to lots.

15
Figure 11. Data-driven building growth selects lots most likely to develop and iteratively adds
massing according to the Development Type for the grid cell (upper right) until the number of
housing units and jobs are met.

16
5.2 SOFTWARE PLATFORM ANALYSIS
In developing the prototype workflow a great deal was learned about the different but
overlapping strengths and capabilities of each of the three programming environments: GIS,
Python and CityEngine CGA rule files. Each platform allowed certain operations to be
performed easily; however, none of the three was sufficient to perform the entire process alone.
The fact that the team had to power a user for each of the tools greatly facilitated the
development of the workflow.
Specifically, each tool was used and had the following strengths and weaknesses:
5.2.1 ArcGIS
Used via the ArcGIS GUI to select and separate shapes into layers prior to importing into
CityEngine.
Used for:
2D pre-processing to identify overlapping elements and separate shapes into
groups to be assigned to different layers in CityEngine.
Annotating shapes with initial data such as Development Types assigned to grid
cells.
Strengths:
Already the source format and tool for most of the data being analyzed.
Existing, stable tool with a large feature set for manipulating 2D shapes.
Strong existing tool knowledge and expertise.
Weaknesses:
2D work only.
Although ArcGIS provides additional custom programming capabilities, in this study all
processing at this stage was done by hand, not automated.
5.2.2 Python
The most flexible of the programming environments, Python provided a general software
language for data manipulation and creating the iterative redevelopment loop. Within CityEngine
the development environment tended to be very brittle in that even minor syntax errors caused
modules simply not to load, with no feedback regarding why or where the error was located.
Used for:
Loading Envision Tomorrow data from Excel spreadsheets.
Assigning Envision Tomorrow Development Types to grid cells.
Aligning tax lots to grid cells and tagging with corresponding Development Types
(each lot was assigned to one grid cell and development type; a grid cell could
have zero, one or multiple lots assigned to it).
Aligning existing building footprints to individual lots for redevelopment (each
footprint could overlap with multiple lots, and each lot could have multiple
footprints on it).
Calculating lot value based on annotated data provided from GIS.

17
Sorting by value and selecting lots for redevelopment.
Incrementally redeveloping lots, deleting existing building footprints that
overlapped with them, assigning the correct CGA rules based on development and
building type, and triggering the generation of the new buildings.
Strengths:
Flexibility and capability to develop arbitrary computer algorithms, data
structures and routines.
Interpreted command environment allows incremental development of tasks and
live interaction with the CityEngine model.
Provides the path needed to load and utilize additional data sources such as Excel
spreadsheet data.
Weaknesses:
Brittle programming environment which proved challenging for development and
debugging.
Limited CityEngine API module support to date.
Limited geometry support without an additional third-party package.
5.2.3 CGA Rule Files
This rule-based programming language specifically targets CityEngine shape generation and is
extremely useful for the final stages of generating massing models. The language provides a
feature-rich environment for shape selection and generation that would be cumbersome or
impossible to duplicate in a traditional imperative programming environment such as Python.
Used for:
Probability-based selection of alternative building types and shapes.
Form generation.
Sub-dividing large lots.
Strengths:
Ease in creating massing forms.
Ease in selecting alternative choices based on probability values.
Weaknesses:
Lack of input support for external data input.
Specialist language and knowledge required.
5.3 FURTHER DEVELOPING DATA-DRIVEN MANIPULATION
While all of the pieces are in place to enable CityEngine’s use as a data-driven visualization tool,
the complexity of triple environment (GIS/Python/CGA) requires stabilization and refinement.
With a complete Python environment and the command interpreter interface, it should be
possible to quickly and interactively create data-driven views of urban landscapes. The primary
hurdle to overcome is that of stabilizing the Python debugging environment and then building up
a family of Python routines and CGA model files for repeated use.
From visual inspection, it appears that the current CityEngine workspace is based upon the
powerful and extensible Eclipse Interactive Development Environment. Eclipse has Python
development modules available and, using those, it might be possible to create a much more

18
robust and complete programming and debugging environment for manipulating data and
creating the needed iterative programming loops. Identifying a fast and robust 3D Python
geometry package is also necessary to continue the work. CGA-rule files will continue to be the
best mechanism for creating the actual building masses, but much of the data manipulation and
rule assignment could be incorporated into the Python space and, from there, controlled by
simple Excel spreadsheets specifying the alternative development scenarios and parameters.
6 ISSUES: PLACE SPECIFICITY, PLANNING
ABSTRACTION AND SOFTWARE FIT
6.1 SPECIFICITY: FROM VIRTUAL CITIES TO REAL
NEIGHBORHOODS
Our conceptual workflow for moving from GIS to CityEngine to Sketchup initially went
smoothly when using small hypothetical example districts. When we began to apply this
workflow to real data for a specific neighborhood in East Portland’s Gateway district, then the
nature of the project changed. While CityEngine can be used to quickly generate new idealized
cities, working on an existing neighborhood is more complex. Sliver lots and small parcels might
have to be aggregated to create usable lots. Associations have to be made between different kinds
of data: Building footprints need to be tied with their lots, and lots matched to urban planning
grid cells. This is further complicated by the fact that Metro and the City of Portland have made
different choices in grid cell dimensions.
Because of its ability to create an archetypal urban form, we can imagine using CityEngine to
create a more robust set of Development Type descriptions. CGA scripts could provide visual
descriptions of abstract block types as 3D color-coded massing icons with housing and jobs
quantities. The Development Types painted in Envision Tomorrow could then generate either
Lego-block massing, whose colors reveal the development type, or a more photorealistic
neighborhood view. The concept of being able to look back to the data behind the image by
selecting a building is promising. We like being able to select a block and see DevType and
some statistics, and being able to move between levels of detail – from Lego to building façade.
The challenges of bringing together different kinds of information can be addressed through a
better teaming of those with skills in GIS, CE and SU, and exploiting their skills to better effect
in solving these issues. A central data repository with a log system for reporting progress and
communicating questions could streamline communication. GIS data will likely require some
updating in the future if it is to be used in the CE user interfaces, and a true CE code developer
will likely be necessary to fully exploit the wealth of GIS data available. If the data and codes
ruling the data are effective, as examples have shown in other cities, there is no doubt that this
can be an excellent method for creating powerful visualizations.

19
6.2 DEPICTING ABSTRACT PLANNING SCENARIOS
Throughout the research, the team had difficulty pinning down how the general concept of three
investment scenarios intended to reduce carbon emissions would translate into funding built
amenities for a specific place. In part, this is due to the difficulty of predicting the
implementation consequences of broad planning initiatives. For example, attractive inexpensive
greenfield sites brought into the urban growth boundary can change the growth distribution and
impede development of central areas, even in a high-growth scenario.
To develop the general theme of providing better access to public transportation and more
“liveable cities,” much research remains in understanding how a wide variety of actions can
make a difference in the reduction of greenhouse gas emissions. The impact of these actions
must first be better understood before the tangible differences shaping the individual experience
in a place can be visualized.
The specific history of the location came into play when creating illustrations of Gateway as a
trial area for the research. While the intention of the pilot illustrations was to show how an area
could prosper from transit and other investments, Gateway is already well-served by public
transportation, a key greenhouse gas emission reduction strategy. The area has been repeatedly
identified as ripe for development due to a large investment in light rail transit, and its relatively
low-real estate value in combination with a central location in the Portland metropolitan area.
However, other market factors have deterred development of a more vibrant regional center as
envisioned by the City of Portland’s comprehensive plan.
As a pilot example, the Gateway location points out the difficulties in developing specific
neighborhood street-corner visualizations. The planning process is abstract and makes it difficult
to define desirable outcomes. While we want to show the kind of attractive retail shops, planting
configurations, and benches that make an attractive pedestrian environment, they require
investment and design decisions that are much further down the road from the initial planning.
Therefore, the challenge of ambiguous content for the visualization is likely to exist for most
neighborhood locations.
6.3 UTILITY OF CITYENGINE FOR PLANNING VISUALIZATION
In summary, we have shown that rigorous development forecasting can drive CityEngine's
powerful parametric modeler to depict 3D land-use and transportation scenarios. It works very
well for neighborhood scale planning at the abstract massing scale. Programming the detail
needed for street-corner perspectives is both laborious and inappropriate to early planning
visulization. We needed a substantial time investment to develop CGA building descriptions,
adapt anomalous real-world GIS data and create the data-driven massing.
Currently, CE is more efficient at portraying alternatives for blank sites and has difficulty
resolving the complexity of real-world data. Reflecting its European roots, it is more effective for
dense urban settings than the typical suburban fabric with buildings independent of lots. A strong
library of CGA building and streetscape elements would make the tool more effective in the
hands of designers.

20
While CityEngine’s real-time rendering is laudable, visual standards for static images are very
high. So the models require further processing for static illustrations, making it difficult to have
them data-driven.
7 CONCLUSION: UNITING DIVERSE PERSPECTIVES
By showing different kinds of information, an ensemble of targeted images can build a case for a
development scenario. Color-coded massing visualizations which indicate growth potential can
complement more diagrammatic 2D maps and more evocative photographic references. As with
all infographics and place-making visualizations, the challenge is very often one of simplifying
vast amounts of information into a straightforward and clear message. The form of the message
needs to be tuned to the audience and the scale of the information: building, street corner,
neighborhood or region. The challenge of efficiently creating suitable representations will
continue to be present in further research.
Because the software landscape is constantly evolving, this is a snapshot of an attempt to bring
together diverse tools and expertise towards common purposes. In the future, we seek a more
interactive way to communicate possibilities for urban growth and illustrate the look and feel of
the spatial experience. We seek a simple interface for non-technical people in which we can add
or subtract housing units and jobs, then see the consequences. The software could help us
understand where to place a building based on the redevelopment potential, given an existing
development model.
Overall, we need three legs of the stool. The economics from MetroScope, the DevType map
sketching of GIS-based Envision Tomorrow, and the 3D parametric modeling of CityEngine
need to come together, using the best of each. This project developed a dialogue between those
with common interests coming from different perspectives. With a greater understanding of how
the tools can work together, we can identify appropriate application challenges for further
research.

21
8 LIST OF FIGURES
Figure 1: Fregonese's Envision Tomorrow allows planners to paint Development types onto map
gridcells.
Figure 2: Each Development Type corresponds to specific proportions of building types,
building height, number of housing units and jobs, and transit activity. Graphic cards by Ryan
Sullivan of Paste in Place graphics
Figure 3. CityEngine uses rules to generate streets from street centerlines, and buildings from lot
footprints, leaving gaps from setbacks and right-of-ways.
Figure 4: Google Earth of existing (top) with CityEngine buildings (middle) and Photoshop
(bottom)
Figure 5: Pedestrian perspective views exaggerate distortions of site photos captured from above
and require supplementary foreground information. Right foreground shows unrealistic covered
tree canopy.
Figure 6: Non-photorealistic illustration effects can be created by post-processing the images.
Limited control over edge precision makes the techniques less appropriate for illustrating
buildings. (See work of Dr.Jürgen Döllner and David Salesin)
Figure 7: Streetscape toolkit provides linear components for pedestrian friendly green streets
Figure 8: Scenarios A, B & C with CityEngine buildings and streetscape elements. Lifting the
viewpoint off the ground shows spatial organization better than ground level perspectives.
Figure 9: Workflow concept shows sequence of decision points and operations.
Figure 10: Metro's DevType gridcells from Envision Tomorrow get mapped onto City of
Portland's taxlots with current and potential valuations, then cell DevTypes are mapped to lots.
Figure 11. Data-driven building growth selects lots most likely to develop and iteratively adds
massing according to the Development Type for the gridcell (upper right) until the number of
housing units and jobs are met.

22
9 REFERENCES
Dr. Jürgen Döllner, Hasso Plattner Institute, University of Pottsdam, Lab tests how non-
photorealistic rendering techniques affect user perceptions of urban visualizations.
http://www.hpi.uni-potsdam.de/doellner/3dgi/
Metro, Creating livable streets: Street design guidelines for 2040
http://www.oregonmetro.gov/index.cfm/go/by.web/id=235
S. McElvaney, Geodesign: Case Studies in Regional and Urban Planning, ESRI Press, 2012.
http://esripress.esri.com
Portland Development Commission (PDC), Johnson Reid LLC and SERA Architects, Gateway
Urban Design and Market Study, 2012.
http://www.pdc.us/Libraries/Gateway_Regional_Center/Gateway_Urban_Design_and_Market_S
tudy_Report_pdf.sflb.ashx
Dr. David Salesin, University of Washington Seattle has pioneered non-photorealistic rendering
techniques by careful observation and analysis of artists techniques.
http://salesin.cs.washington.edu/


P.O. Box 751 Portland, OR 97207
OTREC is dedicated to stimulating and conducting collaborative multi-disciplinary research on multi-modal surface transportation issues, educating a diverse array of current practitioners and future leaders in the transportation field, and encouraging implementation of relevant research results.