data driven u.s. passenger vehicle life-cycle emissions
TRANSCRIPT

Data Driven U.S. Passenger Vehicle Life-Cycle Emissions Comparisons
Tristan Burton
Life-Cycle Analysis for Transportation Symposium
November 3, 2021
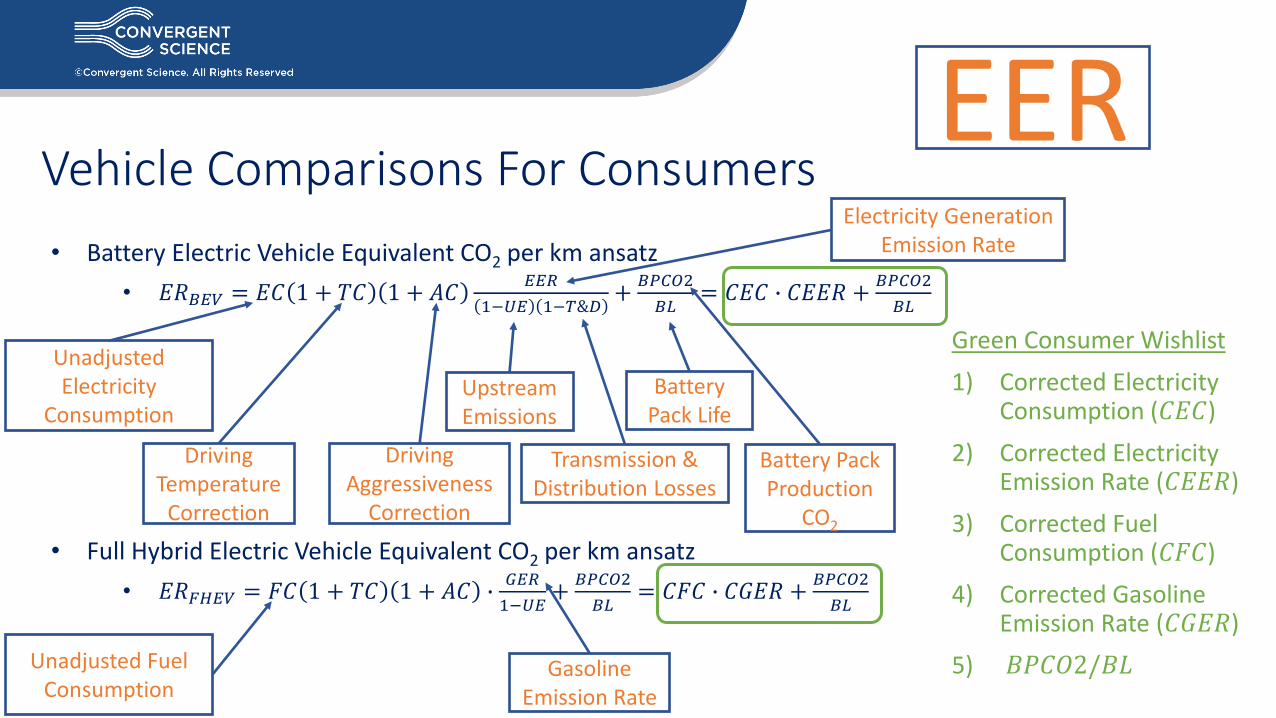
Vehicle Comparisons For Consumers
• Battery Electric Vehicle Equivalent CO2 per km ansatz
• 𝐸𝑅𝐵𝐸𝑉 = 𝐸𝐶 1 + 𝑇𝐶 1 + 𝐴𝐶𝐸𝐸𝑅
1−𝑈𝐸 1−𝑇&𝐷+
𝐵𝑃𝐶𝑂2
𝐵𝐿= 𝐶𝐸𝐶 ∙ 𝐶𝐸𝐸𝑅 +
𝐵𝑃𝐶𝑂2
𝐵𝐿
• Full Hybrid Electric Vehicle Equivalent CO2 per km ansatz
• 𝐸𝑅𝐹𝐻𝐸𝑉 = 𝐹𝐶 1 + 𝑇𝐶 1 + 𝐴𝐶 ∙𝐺𝐸𝑅
1−𝑈𝐸+
𝐵𝑃𝐶𝑂2
𝐵𝐿= 𝐶𝐹𝐶 ∙ 𝐶𝐺𝐸𝑅 +
𝐵𝑃𝐶𝑂2
𝐵𝐿
Upstream Emissions
Transmission & Distribution Losses
Unadjusted Electricity
Consumption
Driving Temperature
Correction
Driving Aggressiveness
Correction
Battery Pack Life
Battery Pack Production
CO2
Electricity Generation Emission Rate
Unadjusted Fuel Consumption
Gasoline Emission Rate
Green Consumer Wishlist
1) Corrected Electricity Consumption (𝐶𝐸𝐶)
2) Corrected Electricity Emission Rate (𝐶𝐸𝐸𝑅)
3) Corrected Fuel Consumption (𝐶𝐹𝐶)
4) Corrected Gasoline Emission Rate (𝐶𝐺𝐸𝑅)
5) 𝐵𝑃𝐶𝑂2/𝐵𝐿
EER

Which Electricity Emission Rate?
• Conventional Battery Electric Vehicle Manufacturer Marketing Wisdom
• “Use the average electricity mix.”
• Sum up all the greenhouse gas emissions (kg CO2eq) and divide by the total generation (MWh)
• The only thing that is correct about this is the units!
• It ignores:
• Demand dependency of emissions
• Demand response of electricity sources
• Geographic and temporal variation
• Electricity exchange between regions
• “But …., don’t those things ‘average’ out?”
• Absolutely not!

Conserving Mass Is Usually Important • A Contrived Example
• 1 TWh integrated load capacity grid
• One non-emitting source of electricity e.g. wind, solar, hydro, nuclear
• One emitting source of electricity e.g. coal, gas, oil (assume 500 kg CO2/MWh)
• How much CO2 is emitted by a 0.1 MWh integrated load on the grid?
• Average mix proponent: “Multiply the average mix electricity emission rate by the load.”
• Data driven analysis proponent: “Let’s remove it and see.”
Actual Emissions (kg CO2)
Average Mix Emissions (kg CO2)
Final Average Mix Emissions (kg CO2)
10% non-emitting
Nominal Load 4.5e8 4.5e8 4.49999995e8
Load Reduction 50 45 44.9999995
50% non-emitting
Nominal Load 2.5e8 2.5e8 2.49999975e8
Load Reduction 50 25 24.9999975
449.999995 kg CO2/MWh
249.999975 kg CO2/MWh
Cleaner (dirtier) gridwhen loads are removed (added)
To get the emissions correct, you need before and after values for both the average mix emission rates and the load.
Change in emissions per change in load is the quantity of interest
Average Mix FlawsChanges to the emission rates are small, but when they’re applied across the entire grid, it’s a meaningful amount of CO2.
Error gets worse at higher non-emitting fractions.
Future predictions assuming renewable fractions are inherently limited.

Real Data
• 2019 U.S. Emissions & Generation Data• EPA Air Markets Program Data: hourly CO2 emissions and gross generation for power plants
• EIA: hourly demand, generation by electricity source, electricity imports and exports
0
2,000,000
4,000,000
6,000,000
8,000,000
10,000,000
12,000,000
14,000,000
16,000,000
18,000,000
20,000,000
15000 20000 25000 30000 35000 40000
kg C
O2e
q/h
Marginal Demand (MW)
SWPP 11 p.m.-12 a.m. Emissions
0
1,000,000
2,000,000
3,000,000
4,000,000
5,000,000
6,000,000
7,000,000
0 2000 4000 6000 8000 10000 12000 14000 16000 18000
kg C
O2e
q/h
Marginal Demand (MW)
NYIS 11 p.m.-12 a.m. Emissions
Includes Monthly Offset
Corrected Total Demand

Marginal Demand and Imports
• Many sources do not respond to demand• You get what you get and you don’t get
upset
• Marginal demand is the part of the demand met by sources that do respond to demand
• For CISO at 8 a.m.• Gas
• Hydro
• Imports
• All have statistically significant slopes
• Approximately 25% of California’s electricity is imported
• Need to account for this along with local generation emissions
2019 CISO 8 a.m. generation data

Correct Electricity Emission Rate Definition
• GHG emission mass flow rate (kg CO2eq/h) increase/decrease due to the addition/removal of a load (MW) from a grid, divided by the load
𝐸 𝑌𝑟ℎ|𝑋𝑟ℎ = 𝑥 + ∆𝑥 − 𝐸 𝑌𝑟ℎ|𝑋𝑟ℎ = 𝑥
∆𝑥
= መ𝛽𝑟ℎ𝑌 +
𝑞∈ 𝑅𝑟ℎ𝑀
መ𝛽𝑟𝑞ℎ𝑇
𝐸 𝑌𝑞ℎ|𝑋𝑞ℎ = 𝑥 + ∆𝑥 − 𝐸 𝑌𝑞ℎ|𝑋𝑞ℎ = 𝑥
∆𝑥
Expected change in emission mass flow rate on grid due to additional load ∆𝑥
Demand met by sources that respond to demand
Neighboring grids (𝑞)
Emission mass flow rate on grid 𝑟 for hour of day ℎ
Generationregression parameter
Imports regression parameter
Current grid (𝑟)
• Coupled system of geographically and temporally resolved emission rates
Burton, Powers, Burns, Conway, Leach & Senecal (2021) “A Data-Driven Greenhouse Gas Emission Rate Analysis for Vehicle Comparisons”, Under Review

How Much Difference Can It Possibly Make?Average Mix Electricity Emission Rates (2018 eGrid)
• CA 191.4 kg CO2eq/MWh
• OR, WA 109.1 kg CO2eq/MWh
• ND, SD, NE, KS, OK 497.4 kg CO2eq/MWh
• IA, IL, IN, MI, MO, MS, MN, WI 552.0 kg CO2eq/MWh
Coupled Regression Analysis (Min/Max/Average)• CISO 337.7 / 431.7/ 396.3 kg CO2eq/MWh
• BPAT 0 / 204.3 / 93.4 kg CO2eq/MWh
• SWPP 411.9 / 753.5 / 523.5 kg CO2eq/MWh
• MISO 722.9 / 778.0 / 749.1 kg CO2eq/MWh
2019 U.S. Total (for entertainment purposes only)• Average Mix 410 kg CO2eq/MWh
• Regression Analysis 587.2 kg CO2eq/MWh
0
100
200
300
400
500
600
700
800
12 AM 4 AM 8 AM 12 PM 4 PM 8 PM 12 AM
Emis
sio
n R
ate
(kg
CO
2eq
/MW
h)
BPAT CISO MISO SWPP

2020 Kia Niro Emission Rate Differences
𝐸𝑅𝐹𝐻𝐸𝑉 − 𝐸𝑅𝐵𝐸𝑉
• Similar production CO2 except for battery
• 𝐵𝐿: 105-160% of warranty (100,000 miles)
• 𝐵𝑃𝐶𝑂2: 61-106 kg CO2eq/kWh
• 𝐵𝑃𝐶𝑂2/𝐵𝐿• BEV (67.5 kWh)
• 16.0-42.1 g CO2eq/km
• Uncertainty equivalent to 5/7.5 mpg at 40/50 mpg
• Bigger pack, bigger problem
• FHEV• 0.37-0.97 g CO2eq/km
• 𝑇𝐶 and 𝐴𝐶 from AAA Study (2019) or 5-cycle test data
Top Row: Statistically Significant Regression Parameters
Bottom Row: Statistically Significant Emitting-Only Regression Parameters
BEV More Favorable Assumptions BEV Less Favorable Assumptions
BEV Lower CO2eq FHEV Lower CO2eq
All Marginal Source ER
20% of demand 52% of demand
Fossil Only Marginal Source ER
0% of demand 66% of demand

• All loads are marginal (don’t forget battery production and well-to-tank gasoline refining)• If you remove a load from the grid, wind/solar/nuclear usually don’t shut down (CA excluded), we just need
less of the emitting sources
• “Too much CO2” conundrum is solved by realizing that demand-response based emission rates would drop with demand
Parting Thoughts
• U.S. vehicle LCAs which use average mix emission rates are not accurate• The most egregious use is for future emission rate predictions on grids with prescribed non-emitting
generation percentages
• 9% increase in renewable generation in 2020 (69 TWh), another 7% projected increase in 2021 (58 TWh) , 127 TWh total, but removing 117 TWh from the 2019 dataset did nothing to the emission rates (CAUTION: Processing of 2020 data in progress)
• U.S. emissions and generation data are available to calculate more accurate emission rates for the present
• Demand-response based modeling must be used for the future
• BEV is most likely favorable to fossil-fueled ICEV, but not FHEV (yet, depending on location)• Front-loading CO2 into the atmosphere for infrastructure and battery production is premature for the U.S.
