data-ed online: trends in data modeling
TRANSCRIPT
Click to Add Presented By Text
Trends in Data Modeling
Presented by Steven MacLauchlan and Peter Aiken, Ph.D.
Welcome: Trends in Data Modeling
2
Copyright 2014 by Data Blueprint
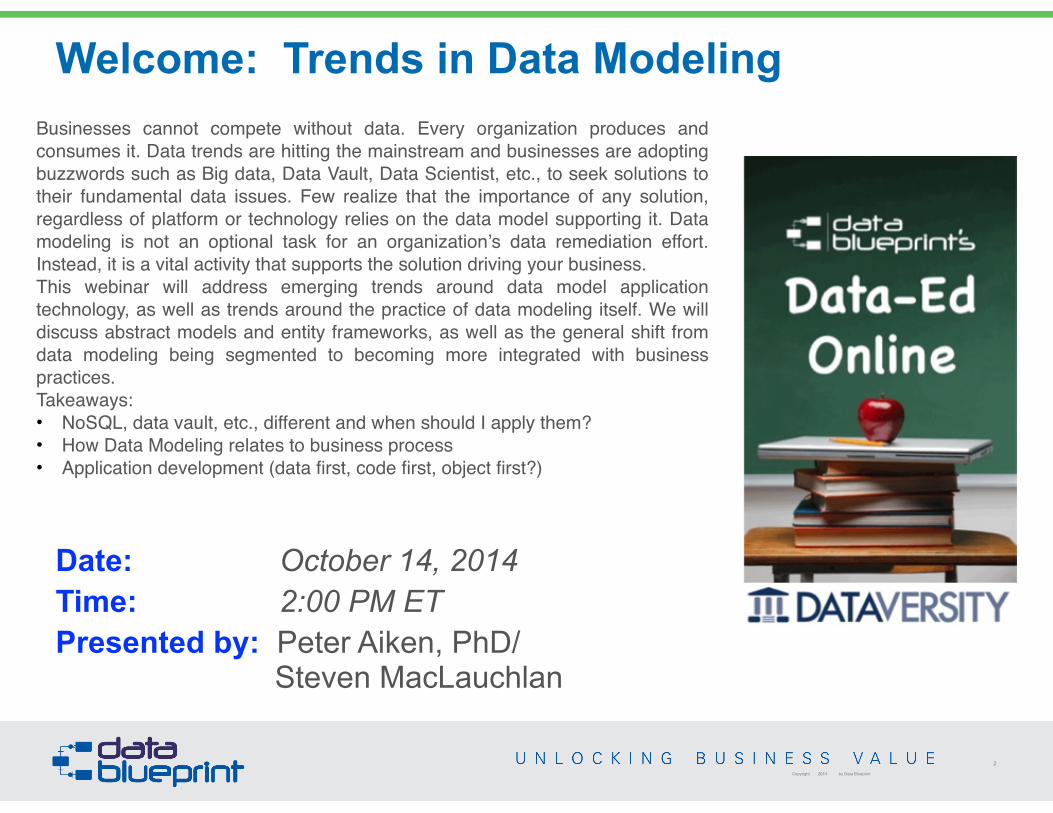
Date: October 14, 2014 Time: 2:00 PM ET Presented by: Peter Aiken, PhD/ Steven MacLauchlan
Businesses cannot compete without data. Every organization produces and consumes it. Data trends are hitting the mainstream and businesses are adopting buzzwords such as Big data, Data Vault, Data Scientist, etc., to seek solutions to their fundamental data issues. Few realize that the importance of any solution, regardless of platform or technology relies on the data model supporting it. Data modeling is not an optional task for an organization’s data remediation effort. Instead, it is a vital activity that supports the solution driving your business. !This webinar will address emerging trends around data model application technology, as well as trends around the practice of data modeling itself. We will discuss abstract models and entity frameworks, as well as the general shift from data modeling being segmented to becoming more integrated with business practices.!Takeaways:!• NoSQL, data vault, etc., different and when should I apply them?!• How Data Modeling relates to business process!• Application development (data first, code first, object first?)
Get Social With Us!
Like Us on Facebook www.facebook.com/
datablueprint Post questions and comments Find industry news, insightful
content and event updates.
Join the Group Data Management &
Business Intelligence Ask questions, gain insights and collaborate with fellow
data management professionals
3Copyright 2014 by Data Blueprint
Live Twitter Feed Join the conversation! Follow us: @datablueprint @paiken
@SJMacLauchlanAsk questions and submit your comments: #dataed
PETER AIKEN WITH JUANITA BILLINGSFOREWORD BY JOHN BOTTEGA
MONETIZINGDATA MANAGEMENT
Unlocking the Value in Your Organization’s
Most Important Asset.
Peter Aiken, Ph.D.
4
Copyright 2014 by Data Blueprint
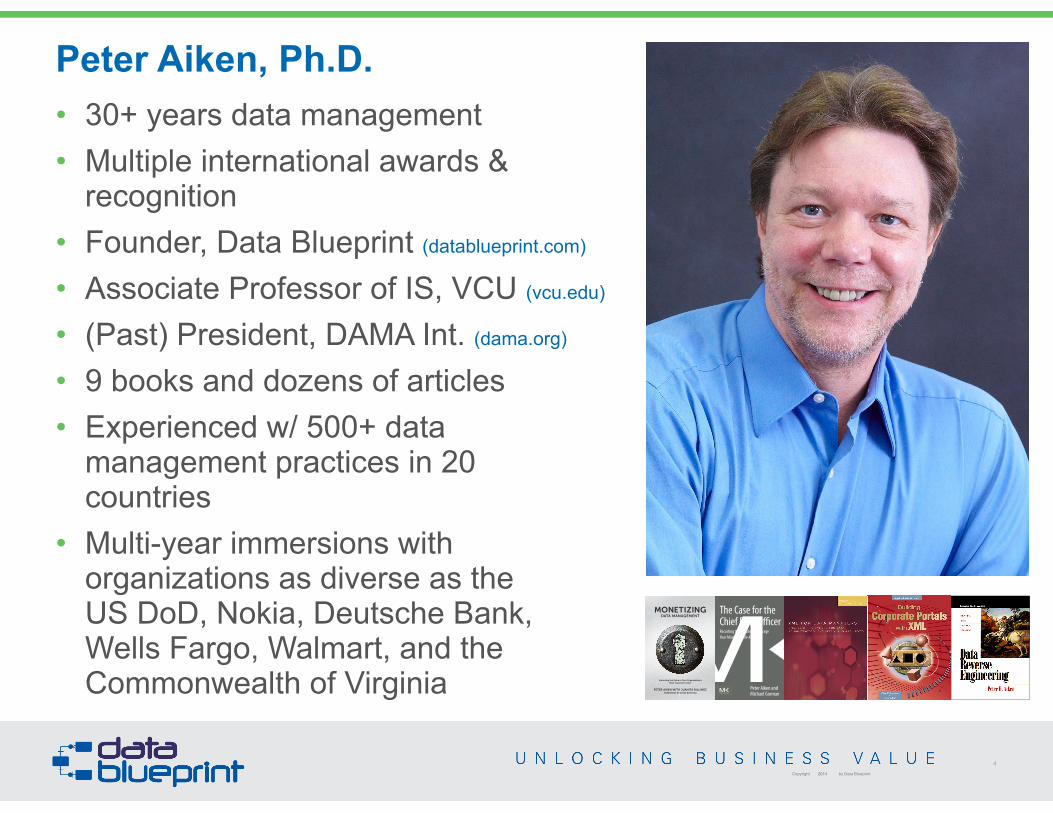
• 30+ years data management • Multiple international awards &
recognition • Founder, Data Blueprint (datablueprint.com) • Associate Professor of IS, VCU (vcu.edu) • (Past) President, DAMA Int. (dama.org) • 9 books and dozens of articles • Experienced w/ 500+ data
management practices in 20 countries
• Multi-year immersions with organizations as diverse as the US DoD, Nokia, Deutsche Bank, Wells Fargo, Walmart, and the Commonwealth of Virginia
The Case for theChief Data OfficerRecasting the C-Suite to LeverageYour Most Valuable Asset
Peter Aiken andMichael Gorman
Steven MacLauchlan
5
Copyright 2014 by Data Blueprint
• 10 years of experience in Application Development and Data Modeling with a focus on Healthcare solutions.
• Head of Marketing, and PR. Helped revamp the game playtesting process from the ground up with a data-centric approach which improved confidence in the final rules
• Delivers tailored data management solutions that provide focus on data’s business value while enhancing clients’ overall capability to manage data
• Certified Data Management Professional (CDMP)
• Computer Science degree from Virginia Commonwealth University
• Most recent focus: Understanding emerging data modeling trends and how these can best be leveraged for the Enterprise.
At Data Blueprint we believe...
Data Assets
Financial Assets
RealEstate Assets
Inventory Assets
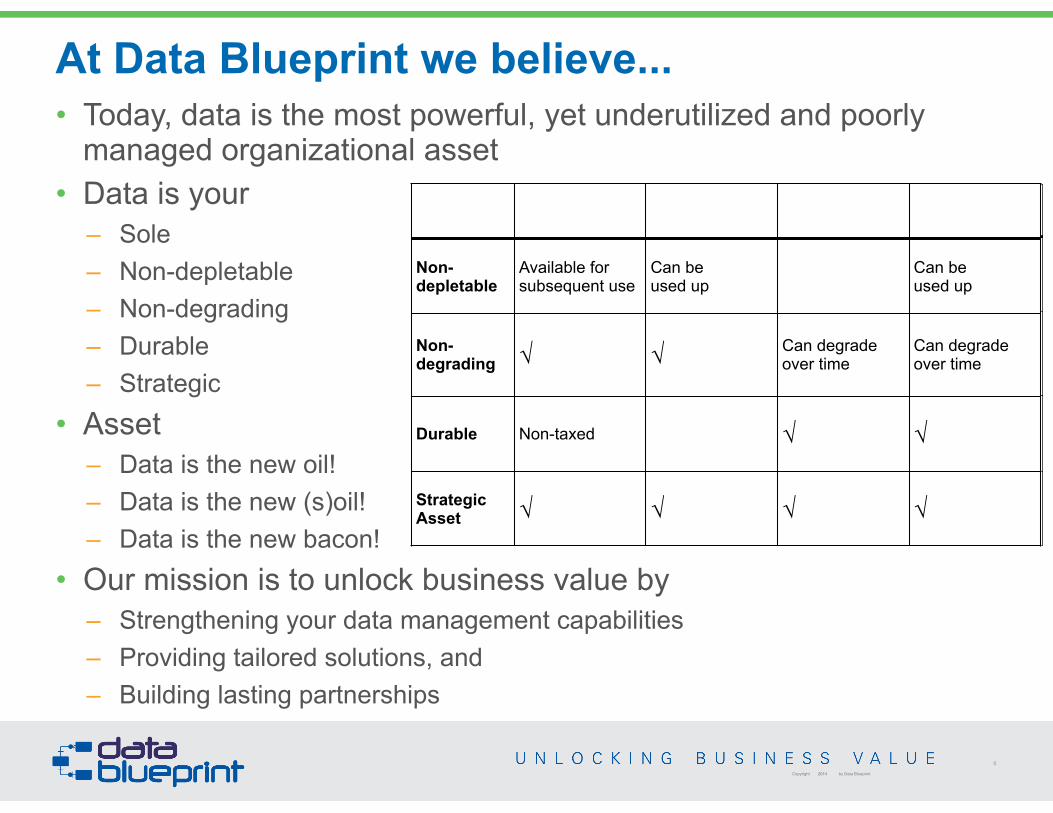
Non-depletable
Available for subsequent use
Can be used up
Can be used up
Non-degrading √ √ Can degrade
over timeCan degradeover time
Durable Non-taxed √ √
Strategic Asset √ √ √ √
6
Copyright 2014 by Data Blueprint
• Today, data is the most powerful, yet underutilized and poorly managed organizational asset
• Data is your – Sole – Non-depletable – Non-degrading – Durable – Strategic
• Asset – Data is the new oil! – Data is the new (s)oil! – Data is the new bacon!
• Our mission is to unlock business value by – Strengthening your data management capabilities – Providing tailored solutions, and – Building lasting partnerships
Trends in Data Modeling
7
Copyright 2014 by Data Blueprint
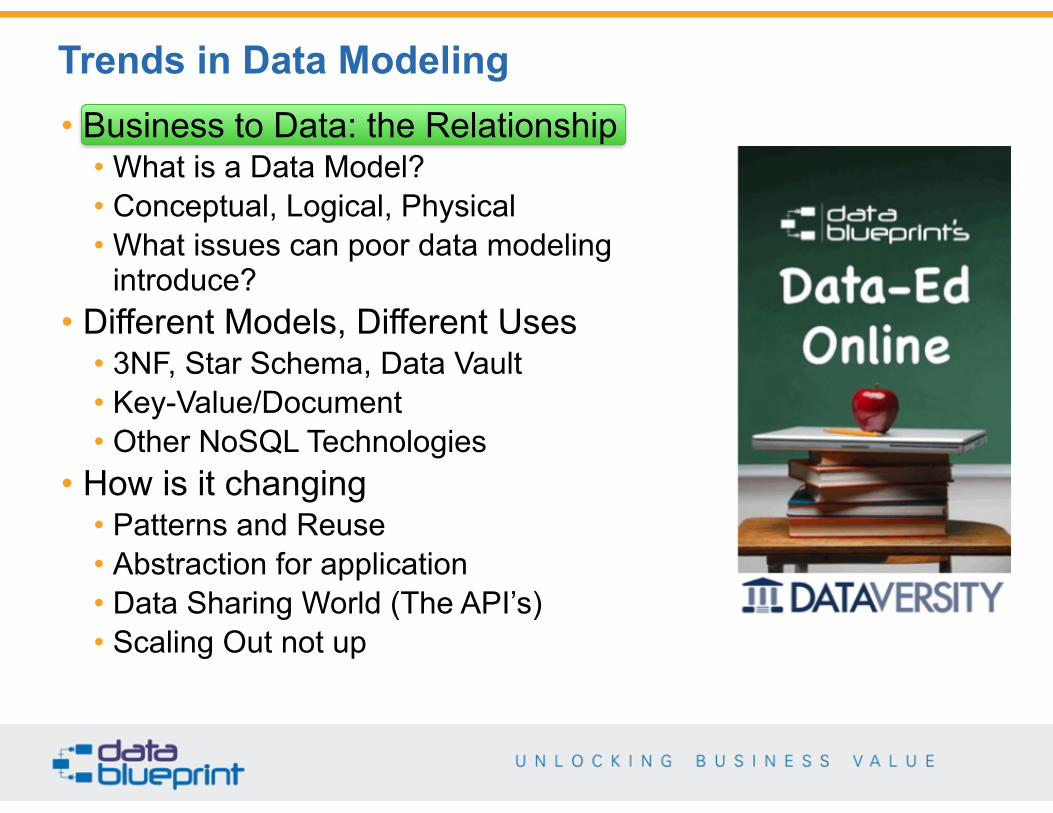
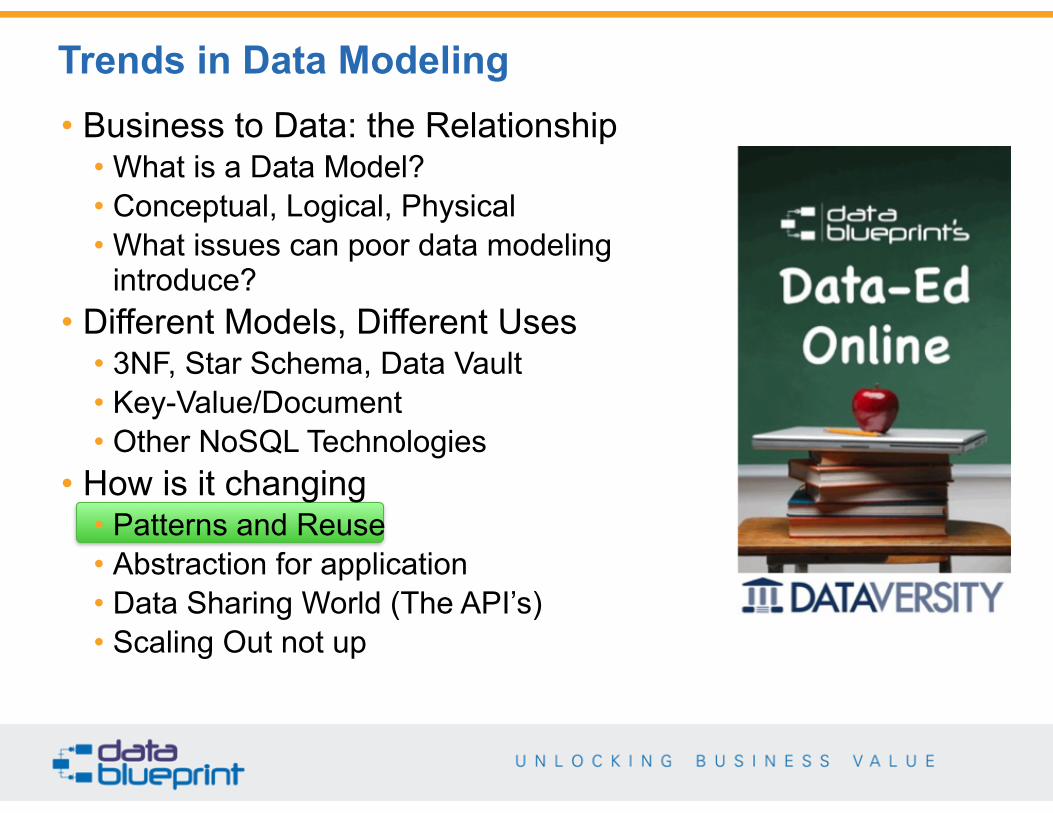
• Business to Data: the Relationship • What is a Data Model? • Conceptual, Logical, Physical • What issues can poor data modeling
introduce? • Different Models, Different Uses
• 3NF, Star Schema, Data Vault • Key-Value/Document • Other NoSQL Technologies
• How is it changing • Patterns and Reuse • Abstraction for application • Data Sharing World (The API’s) • Scaling Out not up
What is a Data Model*?
8
Copyright 2014 by Data Blueprint
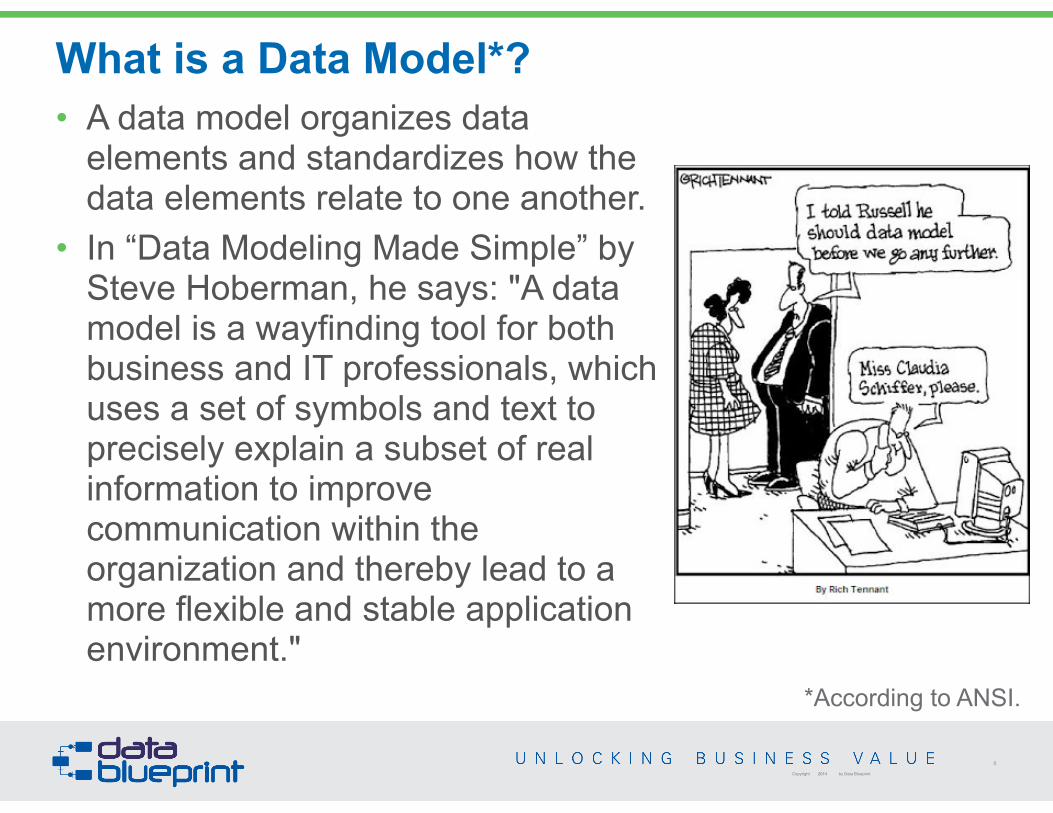
*According to ANSI.
• A data model organizes data elements and standardizes how the data elements relate to one another.
• In “Data Modeling Made Simple” by Steve Hoberman, he says: "A data model is a wayfinding tool for both business and IT professionals, which uses a set of symbols and text to precisely explain a subset of real information to improve communication within the organization and thereby lead to a more flexible and stable application environment."
How are Data Models Expressed as Architectures?
9
Copyright 2014 by Data Blueprint
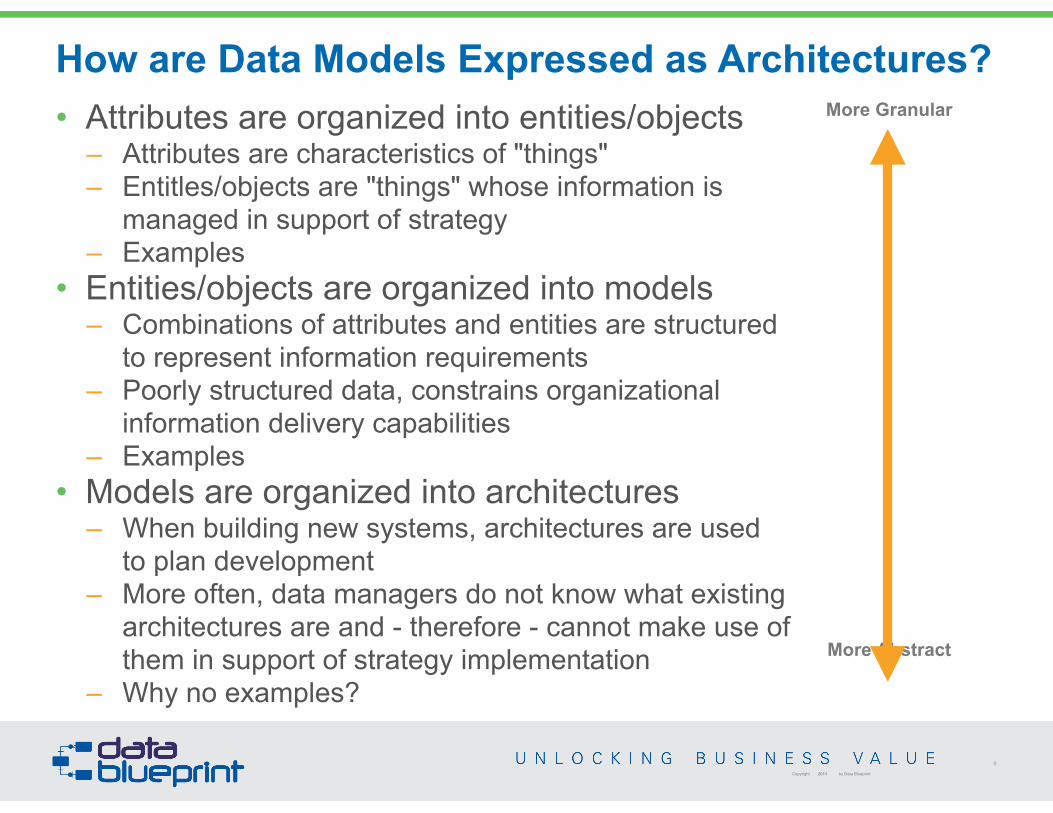
• Attributes are organized into entities/objects – Attributes are characteristics of "things" – Entitles/objects are "things" whose information is
managed in support of strategy – Examples
• Entities/objects are organized into models – Combinations of attributes and entities are structured
to represent information requirements – Poorly structured data, constrains organizational
information delivery capabilities – Examples
• Models are organized into architectures – When building new systems, architectures are used
to plan development – More often, data managers do not know what existing
architectures are and - therefore - cannot make use of them in support of strategy implementation
– Why no examples?
More Granular
More Abstract
The Conceptual Data Model
10
Copyright 2014 by Data Blueprint
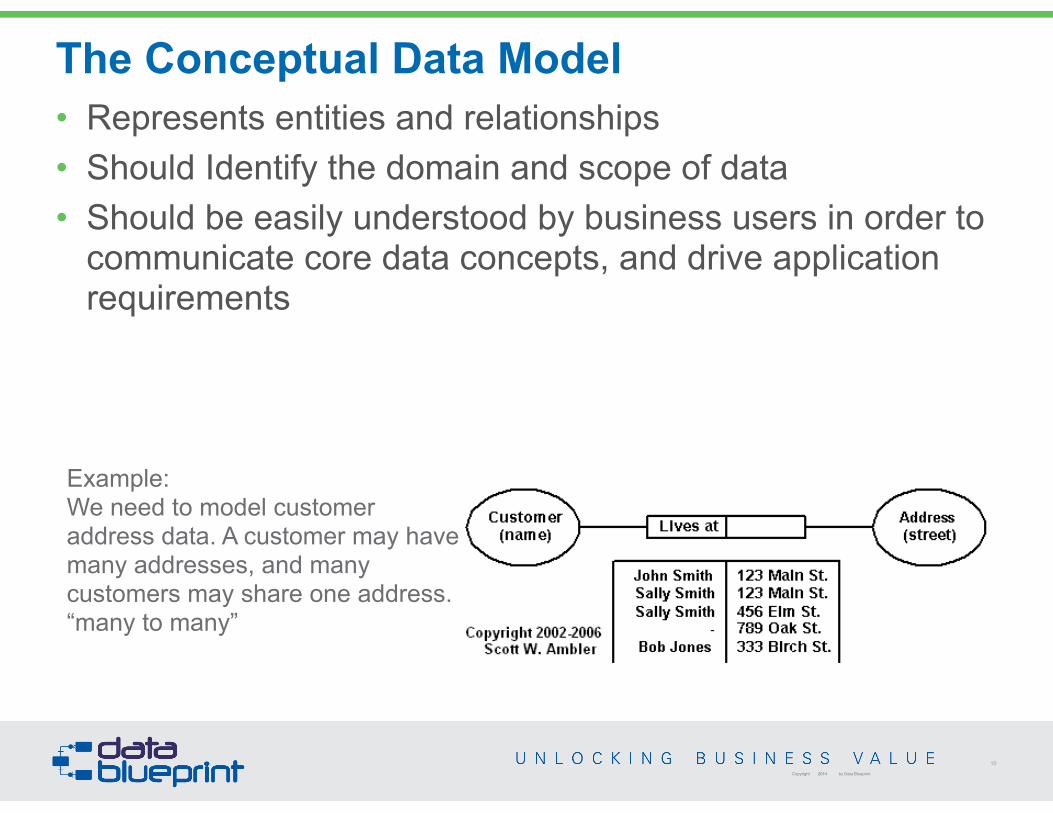
• Represents entities and relationships • Should Identify the domain and scope of data • Should be easily understood by business users in order to
communicate core data concepts, and drive application requirements
Example: We need to model customer address data. A customer may have many addresses, and many customers may share one address. “many to many”
11
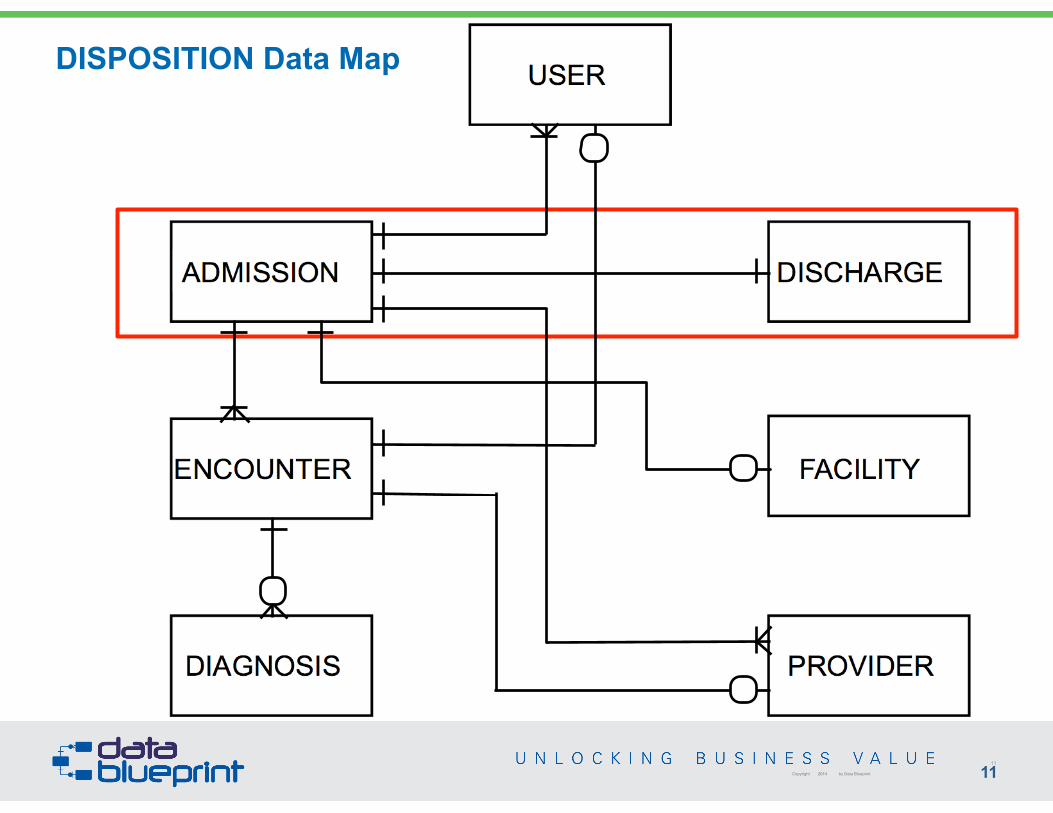
DISPOSITION Data Map
11
Copyright 2014 by Data Blueprint
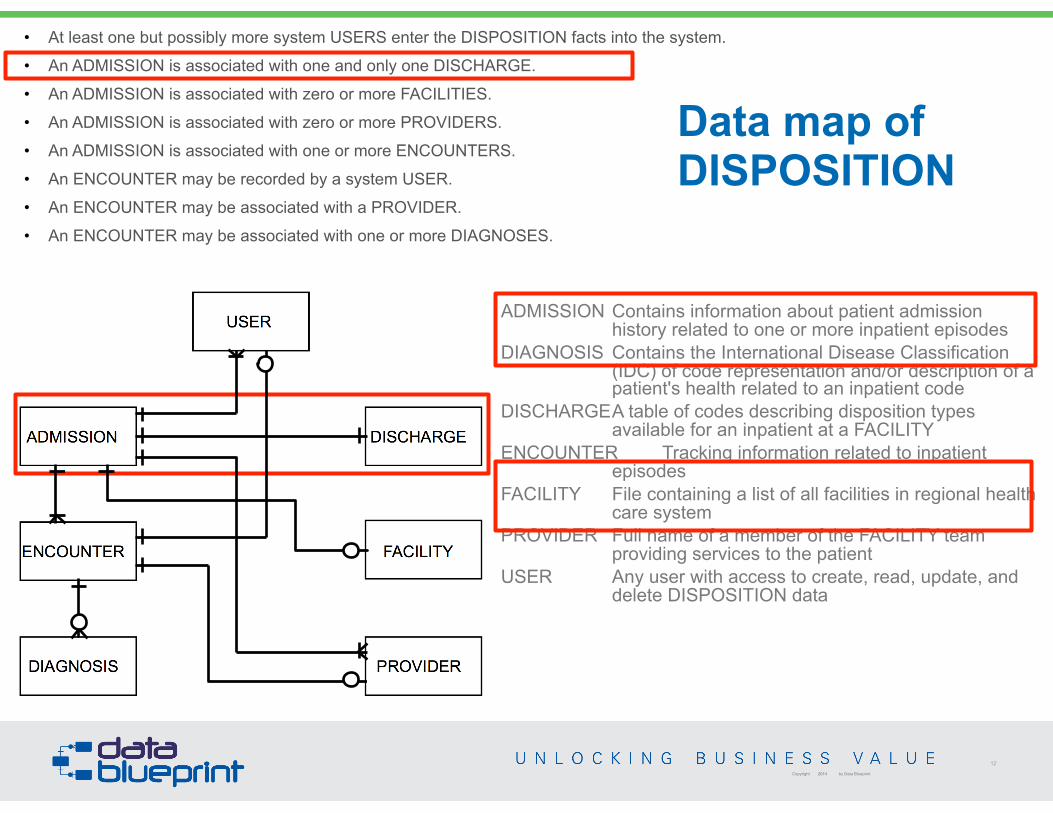
• At least one but possibly more system USERS enter the DISPOSITION facts into the system.
• An ADMISSION is associated with one and only one DISCHARGE.
• An ADMISSION is associated with zero or more FACILITIES.
• An ADMISSION is associated with zero or more PROVIDERS.
• An ADMISSION is associated with one or more ENCOUNTERS.
• An ENCOUNTER may be recorded by a system USER.
• An ENCOUNTER may be associated with a PROVIDER.
• An ENCOUNTER may be associated with one or more DIAGNOSES.
Data map of DISPOSITION
12
Copyright 2014 by Data Blueprint
ADMISSION!Contains information about patient admission history related to one or more inpatient episodes
DIAGNOSIS!Contains the International Disease Classification (IDC) of code representation and/or description of a patient's health related to an inpatient code
DISCHARGE!A table of codes describing disposition types available for an inpatient at a FACILITY
ENCOUNTER! Tracking information related to inpatient episodes
FACILITY! File containing a list of all facilities in regional health care system
PROVIDER! Full name of a member of the FACILITY team providing services to the patient
USER! Any user with access to create, read, update, and delete DISPOSITION data
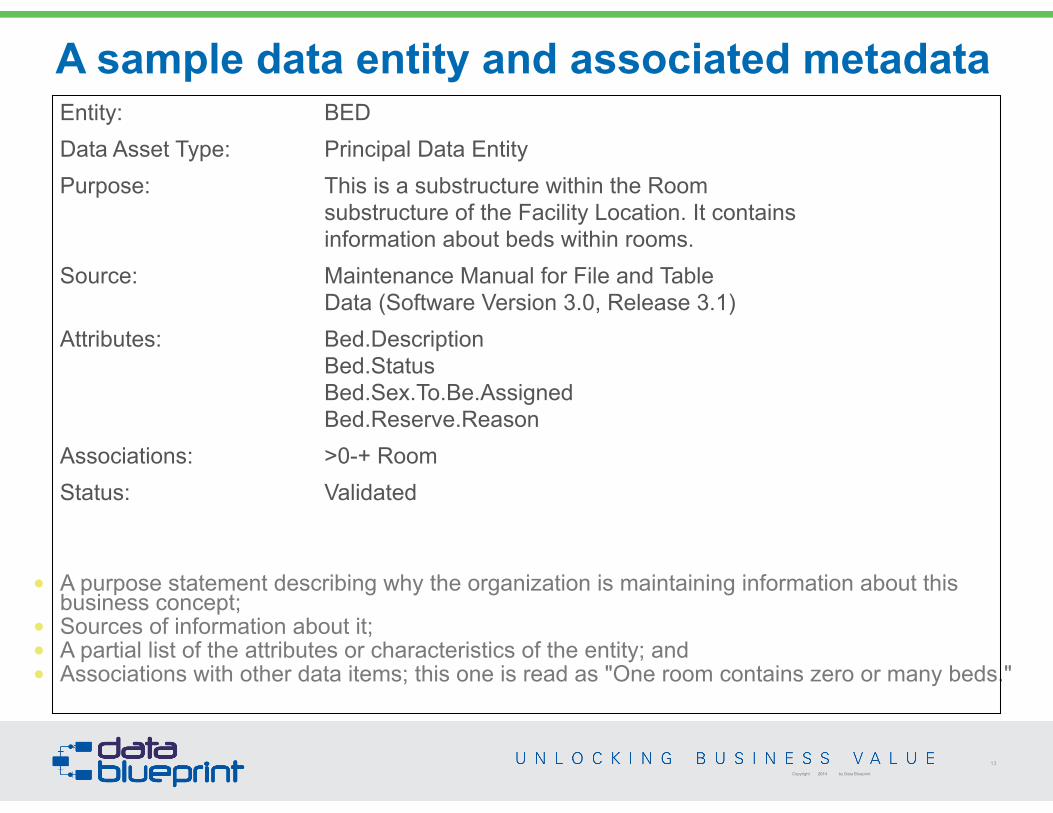
A sample data entity and associated metadata
13
Copyright 2014 by Data Blueprint
• A purpose statement describing why the organization is maintaining information about this business concept;
• Sources of information about it; • A partial list of the attributes or characteristics of the entity; and • Associations with other data items; this one is read as "One room contains zero or many beds."
Entity: BED Data Asset Type: Principal Data Entity Purpose: This is a substructure within the Room
substructure of the Facility Location. It contains information about beds within rooms.
Source: Maintenance Manual for File and Table Data (Software Version 3.0, Release 3.1)
Attributes: Bed.Description Bed.Status Bed.Sex.To.Be.Assigned Bed.Reserve.Reason
Associations: >0-+ Room Status: Validated
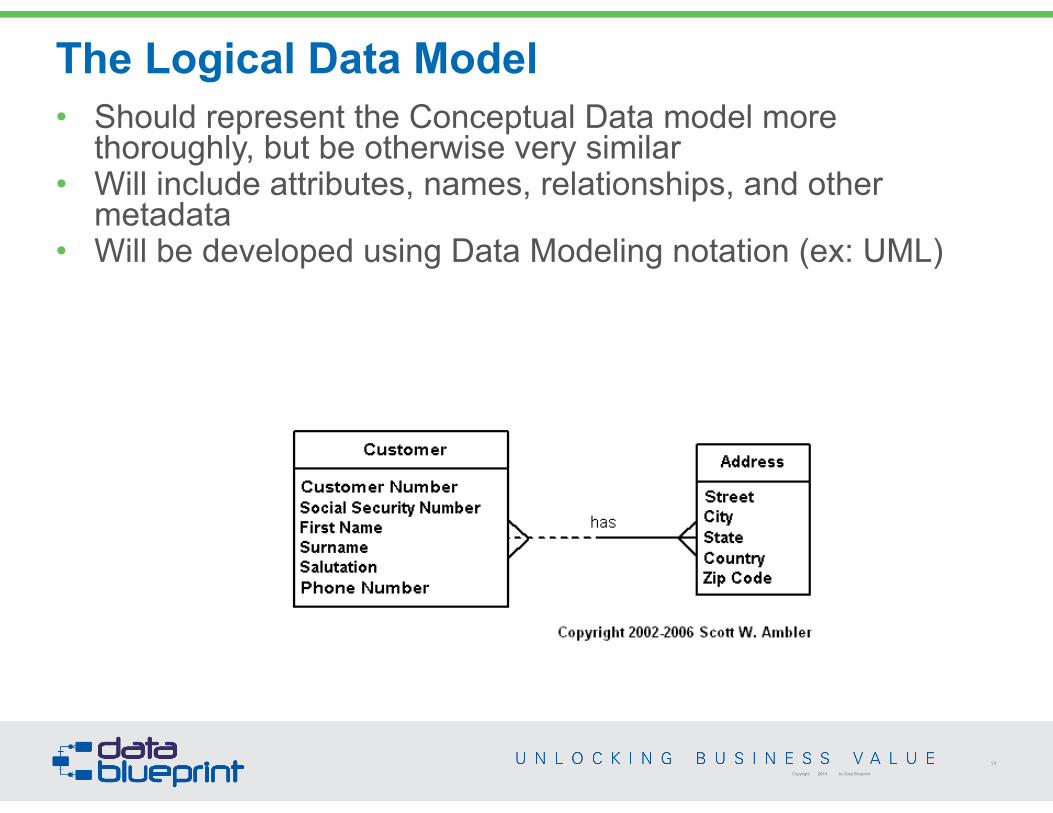
The Logical Data Model
14
Copyright 2014 by Data Blueprint
• Should represent the Conceptual Data model more thoroughly, but be otherwise very similar
• Will include attributes, names, relationships, and other metadata
• Will be developed using Data Modeling notation (ex: UML)
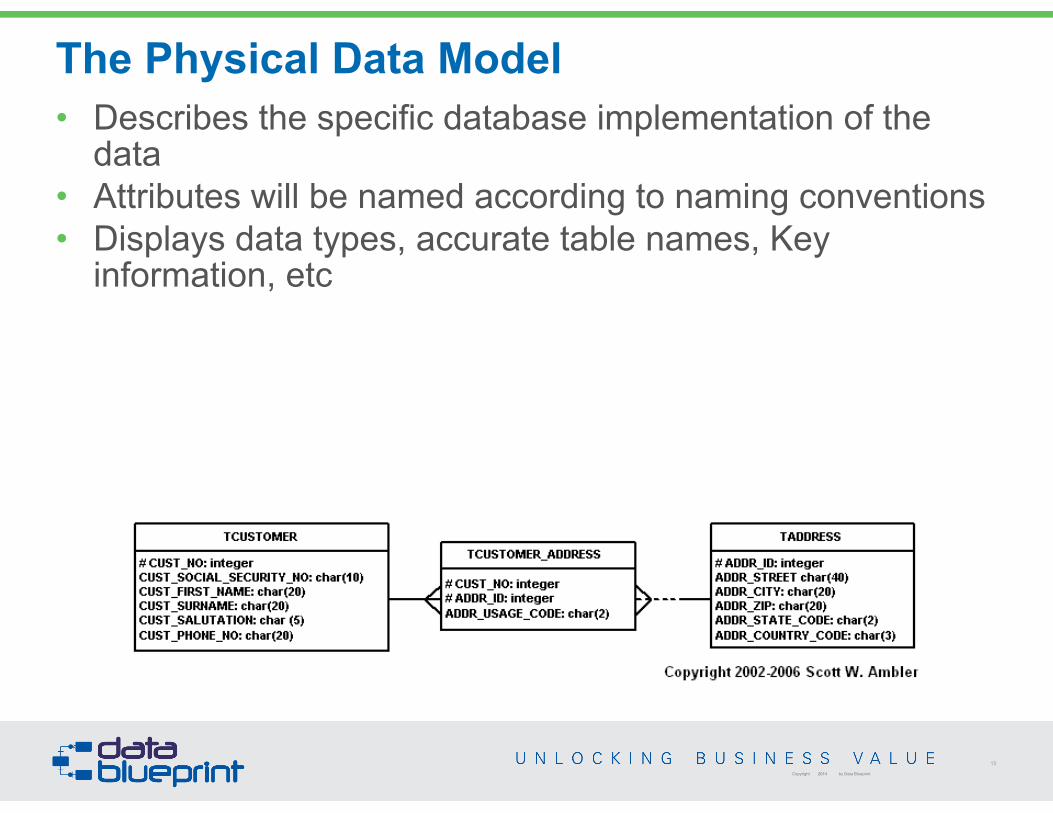
The Physical Data Model
15
Copyright 2014 by Data Blueprint
• Describes the specific database implementation of the data
• Attributes will be named according to naming conventions • Displays data types, accurate table names, Key
information, etc
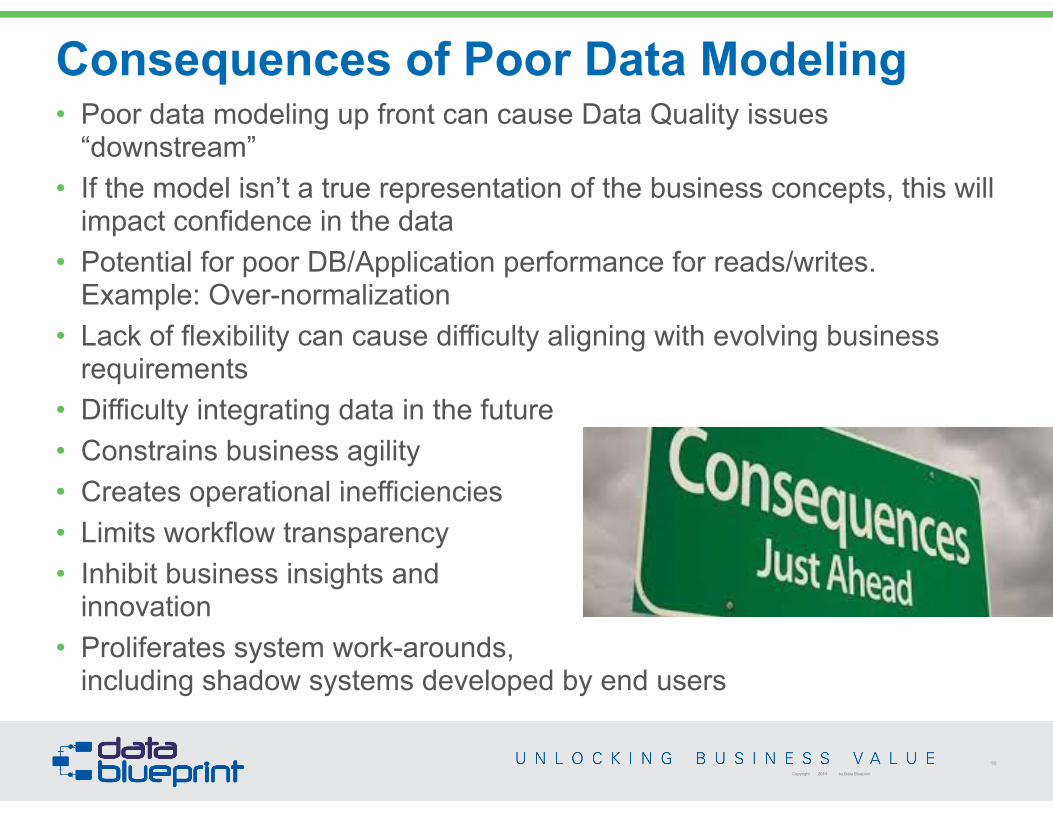
Consequences of Poor Data Modeling
16
Copyright 2014 by Data Blueprint
• Poor data modeling up front can cause Data Quality issues “downstream”
• If the model isn’t a true representation of the business concepts, this will impact confidence in the data
• Potential for poor DB/Application performance for reads/writes. Example: Over-normalization
• Lack of flexibility can cause difficulty aligning with evolving business requirements
• Difficulty integrating data in the future • Constrains business agility • Creates operational inefficiencies • Limits workflow transparency • Inhibit business insights and
innovation • Proliferates system work-arounds,
including shadow systems developed by end users
Trends in Data Modeling
17
Copyright 2014 by Data Blueprint
• Business to Data: the Relationship • What is a Data Model? • Conceptual, Logical, Physical • What issues can poor data modeling
introduce? • Different Models, Different Uses
• 3NF, Star Schema, Data Vault • Key-Value/Document • Other NoSQL Technologies
• How is it changing • Patterns and Reuse • Abstraction for application • Data Sharing World (The API’s) • Scaling Out not up
*
Normalization Rules Overview
18
Copyright 2014 by Data Blueprint
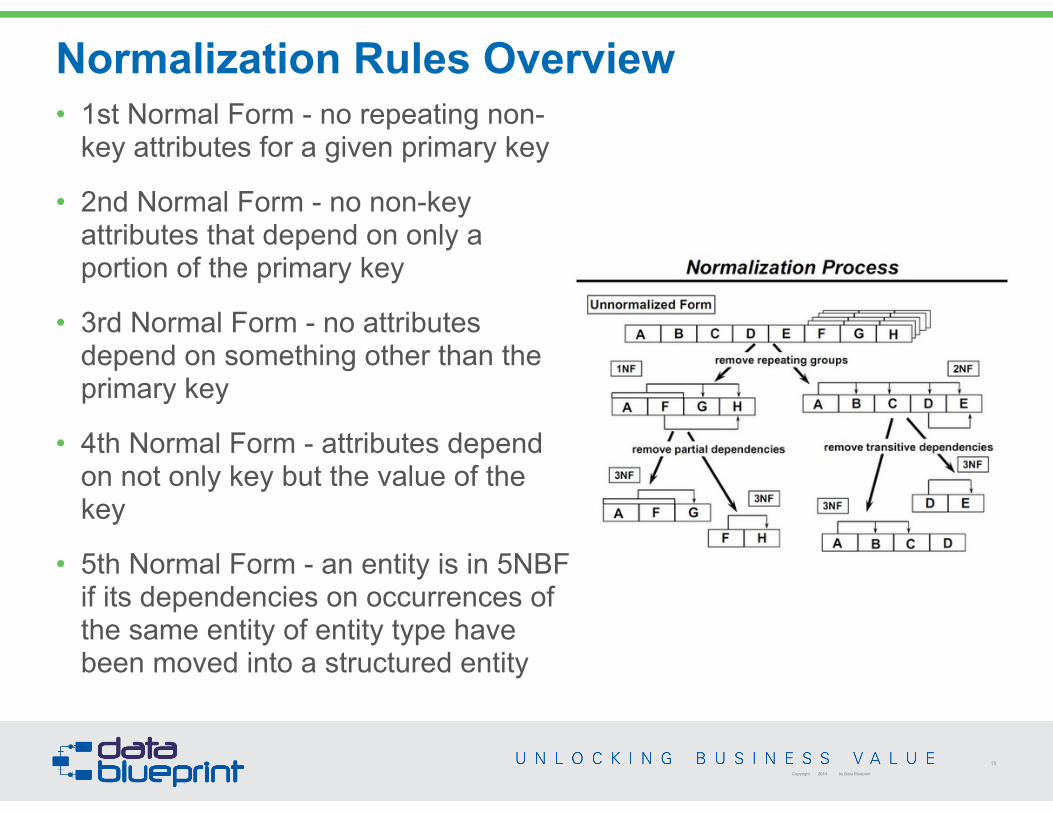
• 1st Normal Form - no repeating non-key attributes for a given primary key
• 2nd Normal Form - no non-key attributes that depend on only a portion of the primary key
• 3rd Normal Form - no attributes depend on something other than the primary key
• 4th Normal Form - attributes depend on not only key but the value of the key
• 5th Normal Form - an entity is in 5NBF if its dependencies on occurrences of the same entity of entity type have been moved into a structured entity
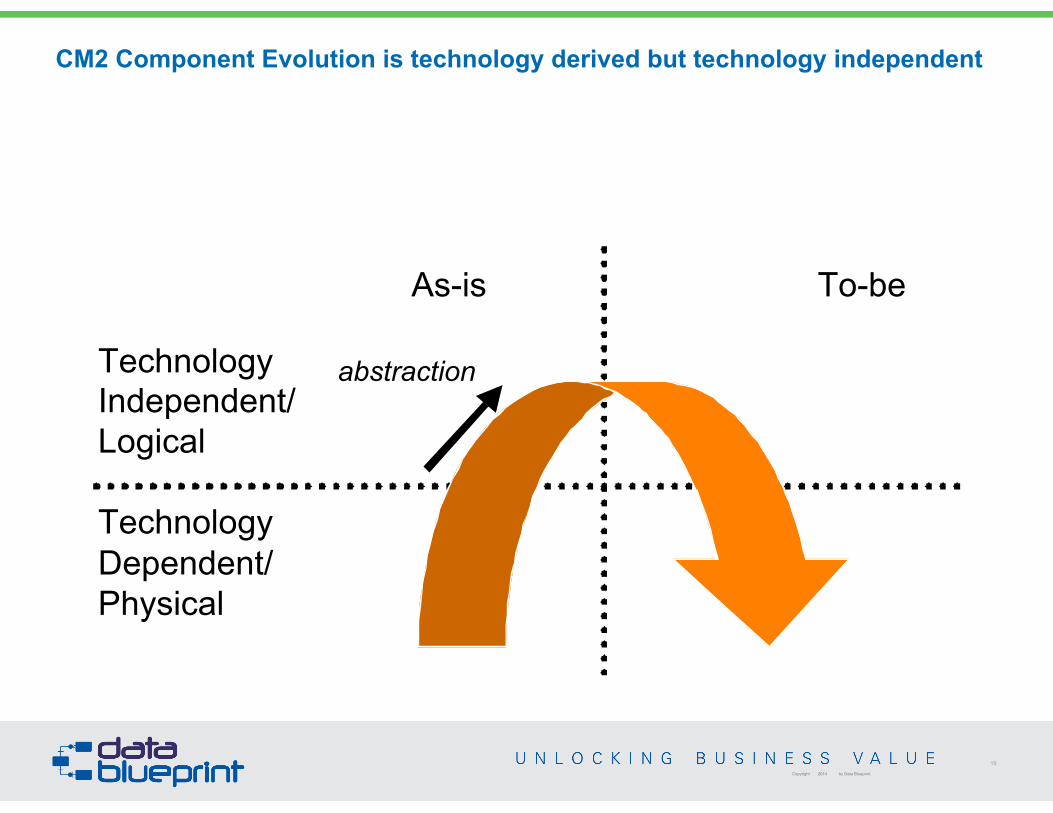
CM2 Component Evolution is technology derived but technology independent
19
Copyright 2014 by Data Blueprint
As-is To-be
TechnologyIndependent/Logical
TechnologyDependent/Physical
abstraction
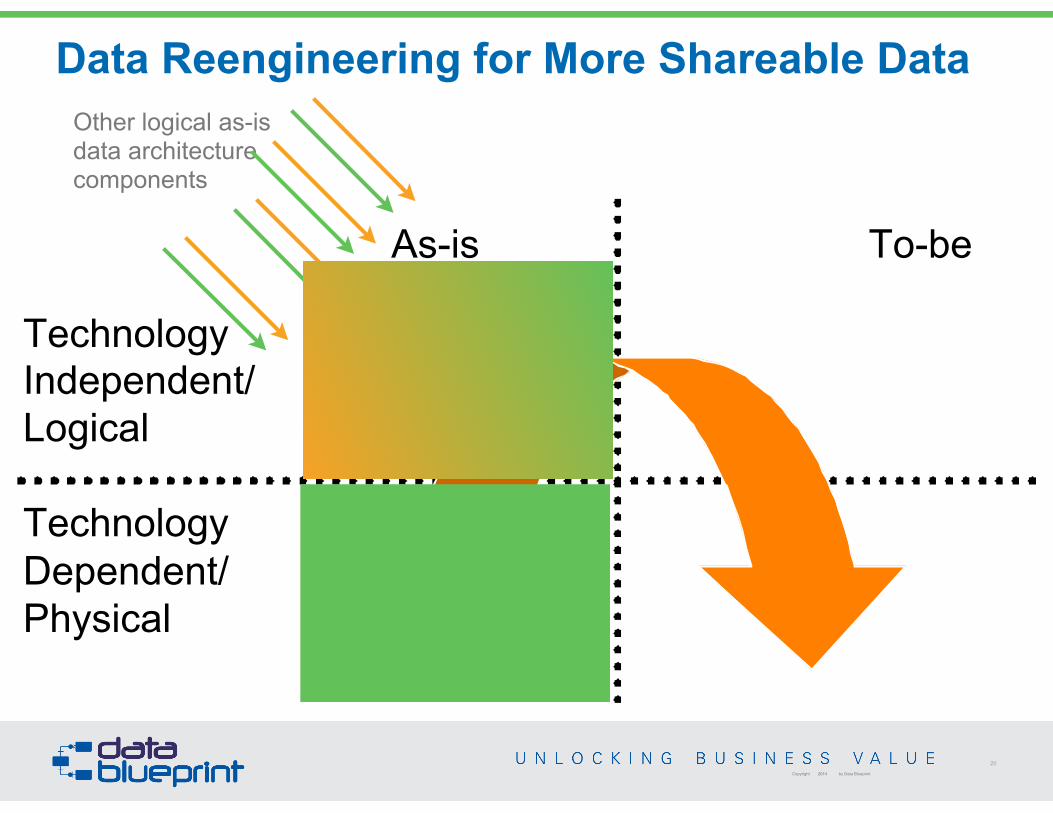
Data Reengineering for More Shareable Data
20
Copyright 2014 by Data Blueprint
As-is To-be
TechnologyIndependent/Logical
TechnologyDependent/Physical
abstraction
Other logical as-is data architecture components
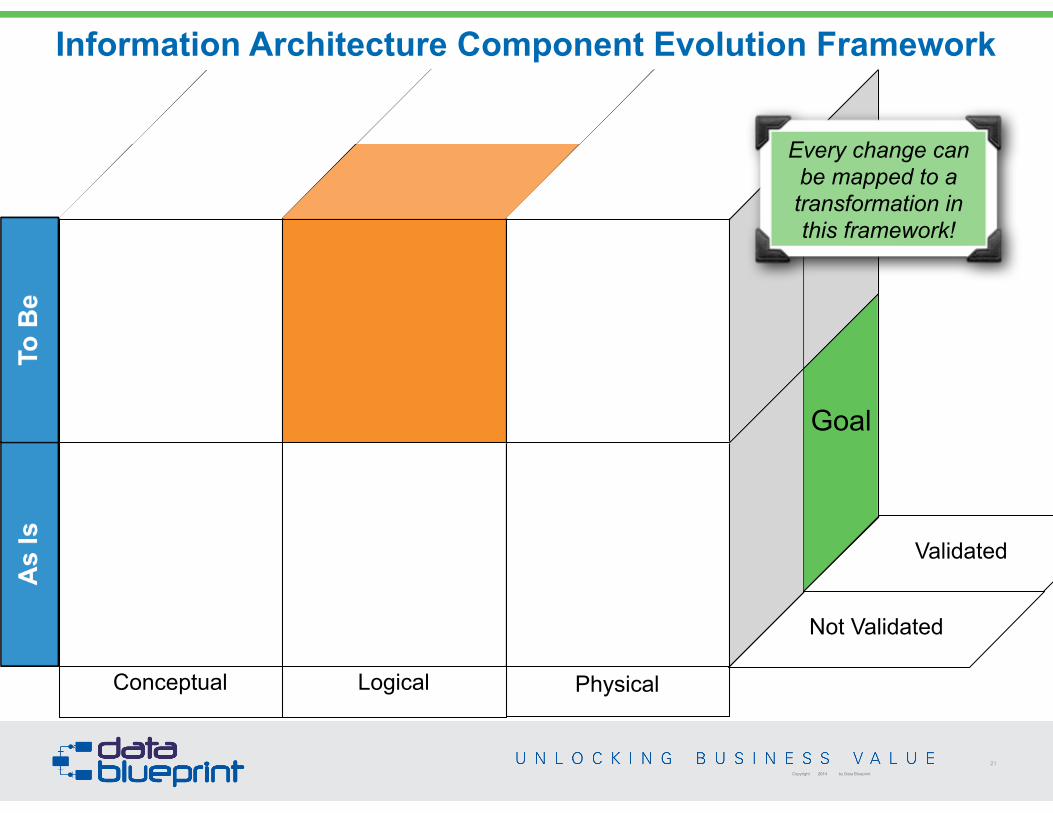
Information Architecture Component Evolution Framework
Conceptual Logical Physical
Goal
Validated
Not Validated
Every change can be mapped to a transformation in this framework!
21
Copyright 2014 by Data Blueprint
Third Normal Form
22
Copyright 2014 by Data Blueprint
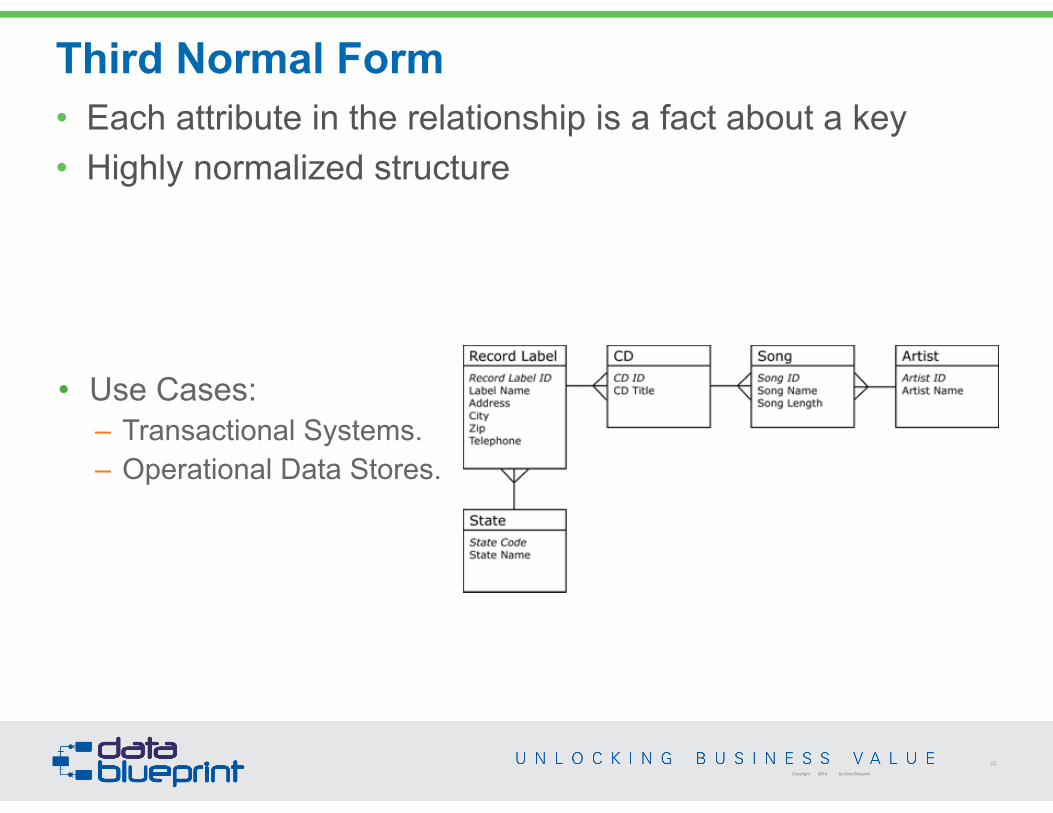
• Each attribute in the relationship is a fact about a key • Highly normalized structure
• Use Cases: – Transactional Systems. – Operational Data Stores. !
!
Third Normal Form: Pros and Cons
23
Copyright 2014 by Data Blueprint
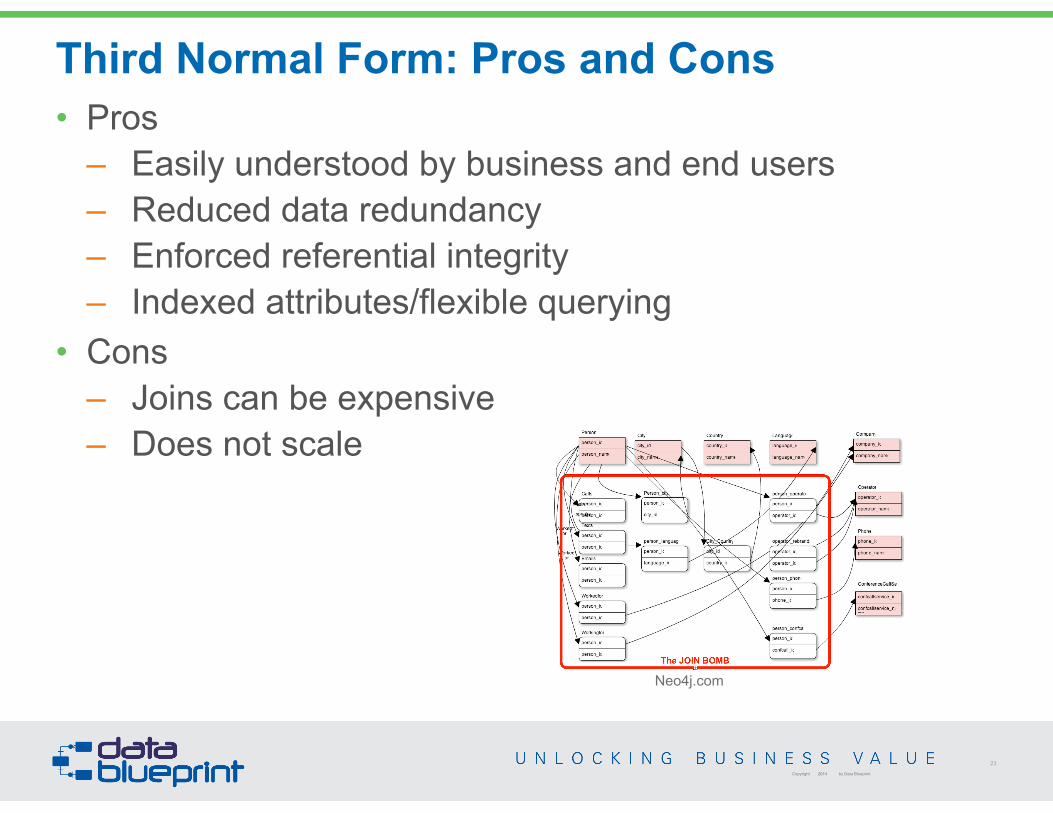
• Pros – Easily understood by business and end users – Reduced data redundancy – Enforced referential integrity – Indexed attributes/flexible querying
• Cons – Joins can be expensive – Does not scale
Neo4j.com
Star Schema
24
Copyright 2014 by Data Blueprint
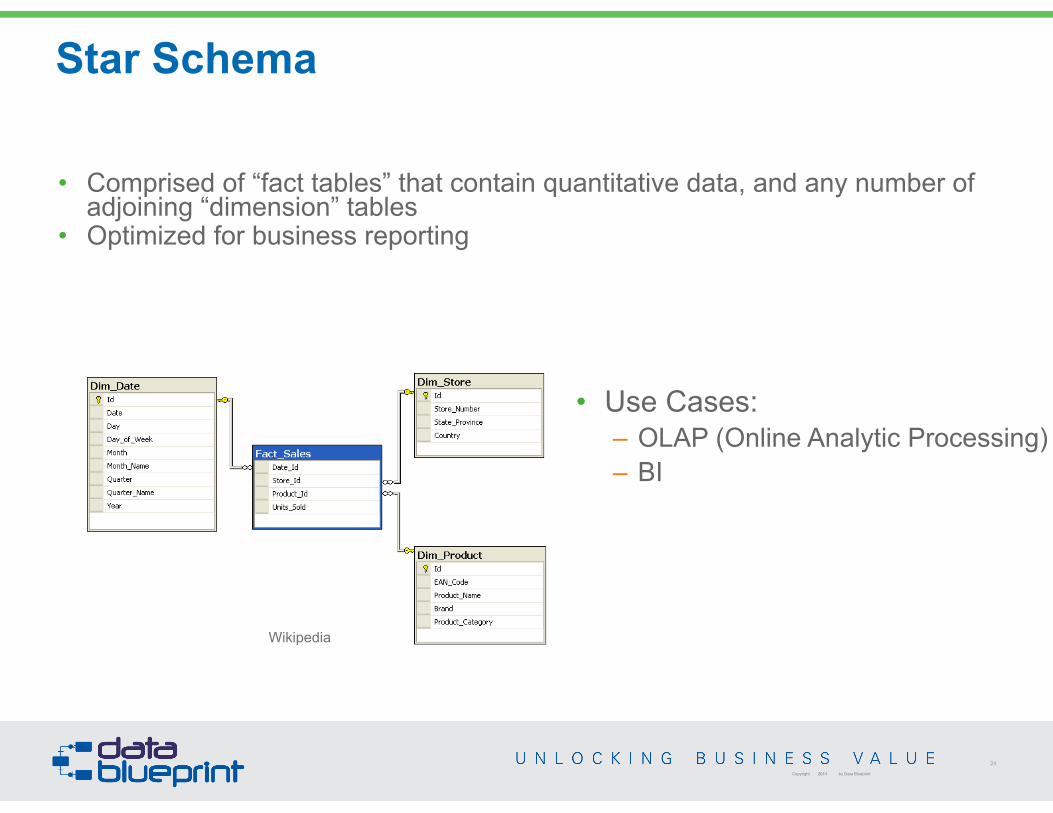
• Comprised of “fact tables” that contain quantitative data, and any number of adjoining “dimension” tables
• Optimized for business reporting !!
• Use Cases: – OLAP (Online Analytic Processing) – BI !
!
Wikipedia
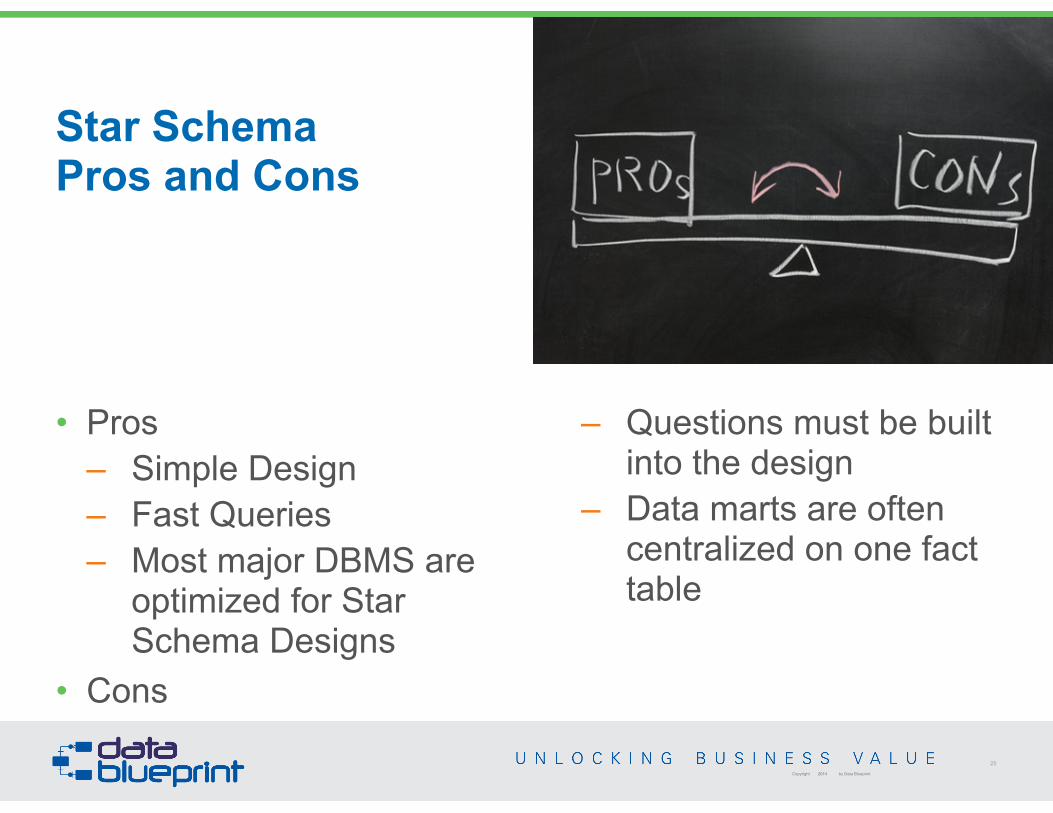
Star Schema Pros and Cons
25
Copyright 2014 by Data Blueprint
• Pros – Simple Design – Fast Queries – Most major DBMS are
optimized for Star Schema Designs
• Cons
– Questions must be built into the design
– Data marts are often centralized on one fact table
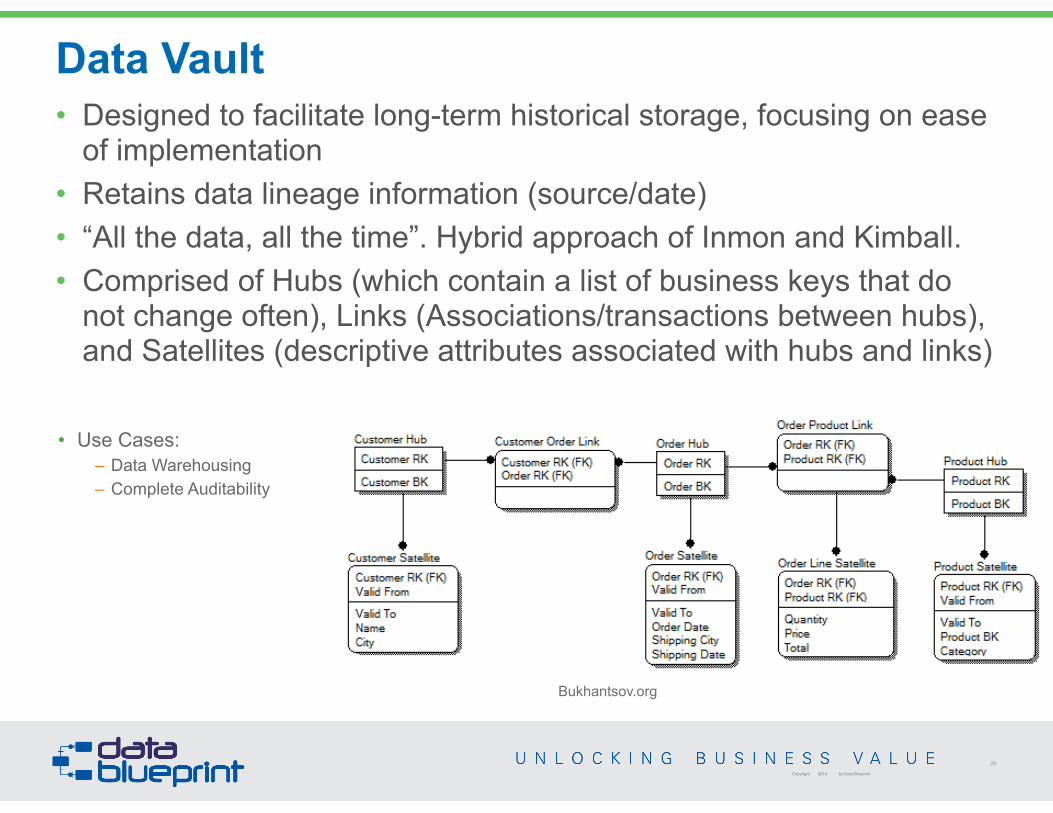
Data Vault
26
Copyright 2014 by Data Blueprint
• Designed to facilitate long-term historical storage, focusing on ease of implementation
• Retains data lineage information (source/date) • “All the data, all the time”. Hybrid approach of Inmon and Kimball. • Comprised of Hubs (which contain a list of business keys that do
not change often), Links (Associations/transactions between hubs), and Satellites (descriptive attributes associated with hubs and links)
• Use Cases: – Data Warehousing – Complete Auditability !!!
!
Bukhantsov.org
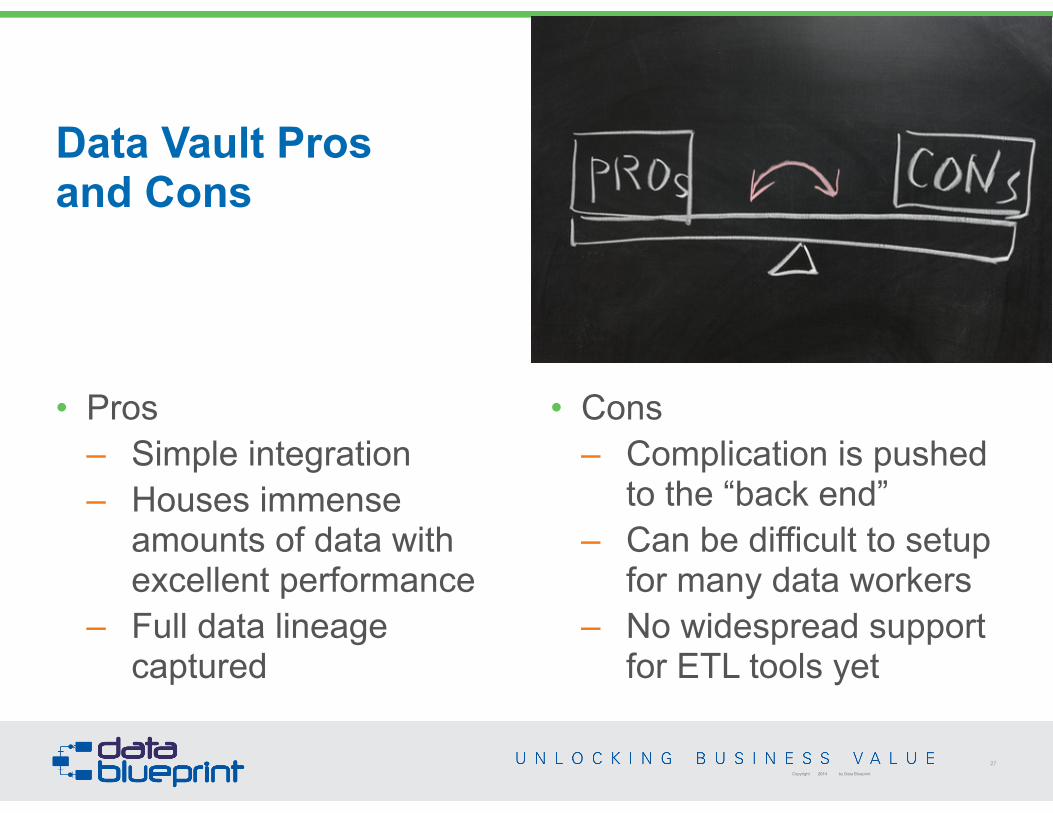
Data Vault Pros and Cons
27
Copyright 2014 by Data Blueprint
• Pros – Simple integration – Houses immense
amounts of data with excellent performance
– Full data lineage captured
• Cons – Complication is pushed
to the “back end” – Can be difficult to setup
for many data workers – No widespread support
for ETL tools yet
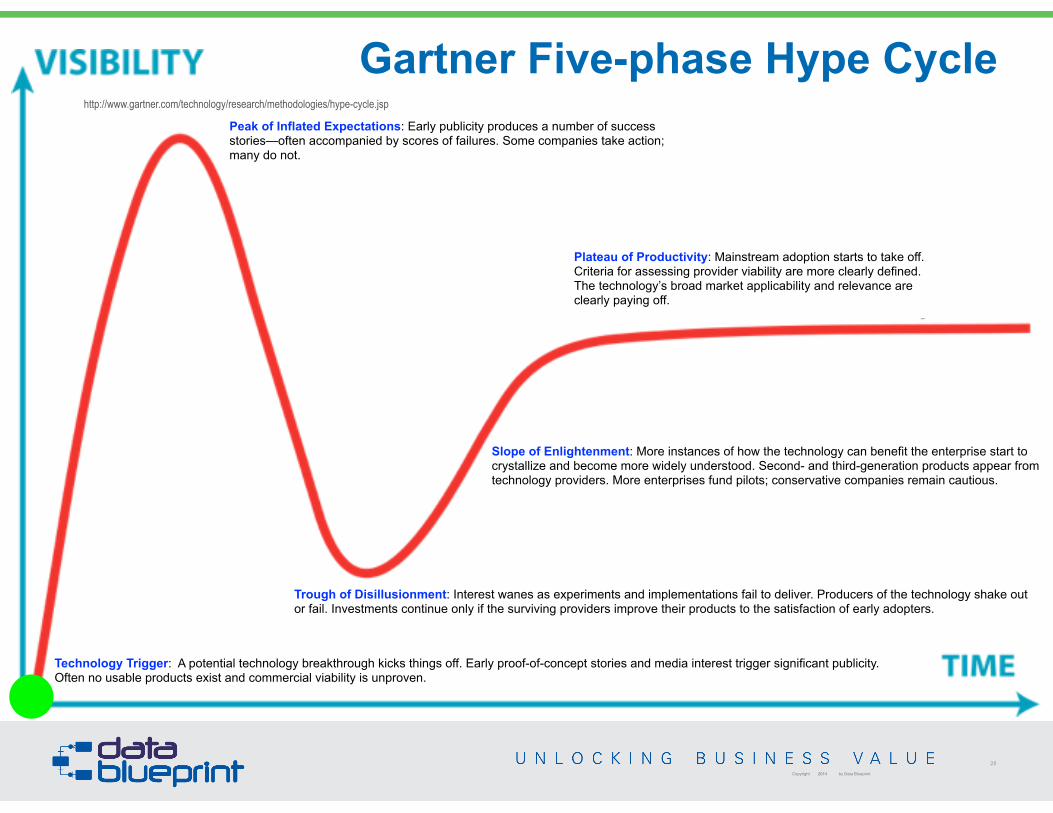
Gartner Five-phase Hype Cycle
28
Copyright 2014 by Data Blueprint
http://www.gartner.com/technology/research/methodologies/hype-cycle.jsp
Technology Trigger: A potential technology breakthrough kicks things off. Early proof-of-concept stories and media interest trigger significant publicity. Often no usable products exist and commercial viability is unproven.
Trough of Disillusionment: Interest wanes as experiments and implementations fail to deliver. Producers of the technology shake out or fail. Investments continue only if the surviving providers improve their products to the satisfaction of early adopters.
Peak of Inflated Expectations: Early publicity produces a number of success stories—often accompanied by scores of failures. Some companies take action; many do not.
Slope of Enlightenment: More instances of how the technology can benefit the enterprise start to crystallize and become more widely understood. Second- and third-generation products appear from technology providers. More enterprises fund pilots; conservative companies remain cautious.
Plateau of Productivity: Mainstream adoption starts to take off. Criteria for assessing provider viability are more clearly defined. The technology’s broad market applicability and relevance are clearly paying off.
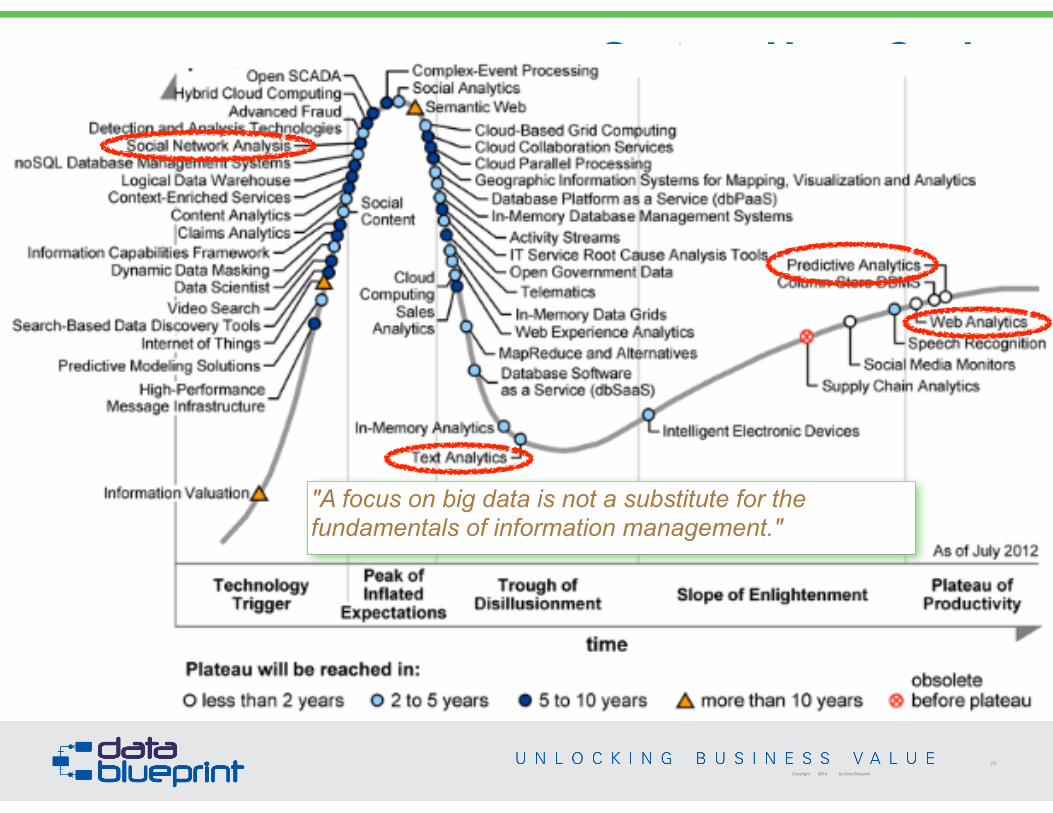
Gartner Hype Cycle
29
Copyright 2014 by Data Blueprint
"A focus on big data is not a substitute for the fundamentals of information management."
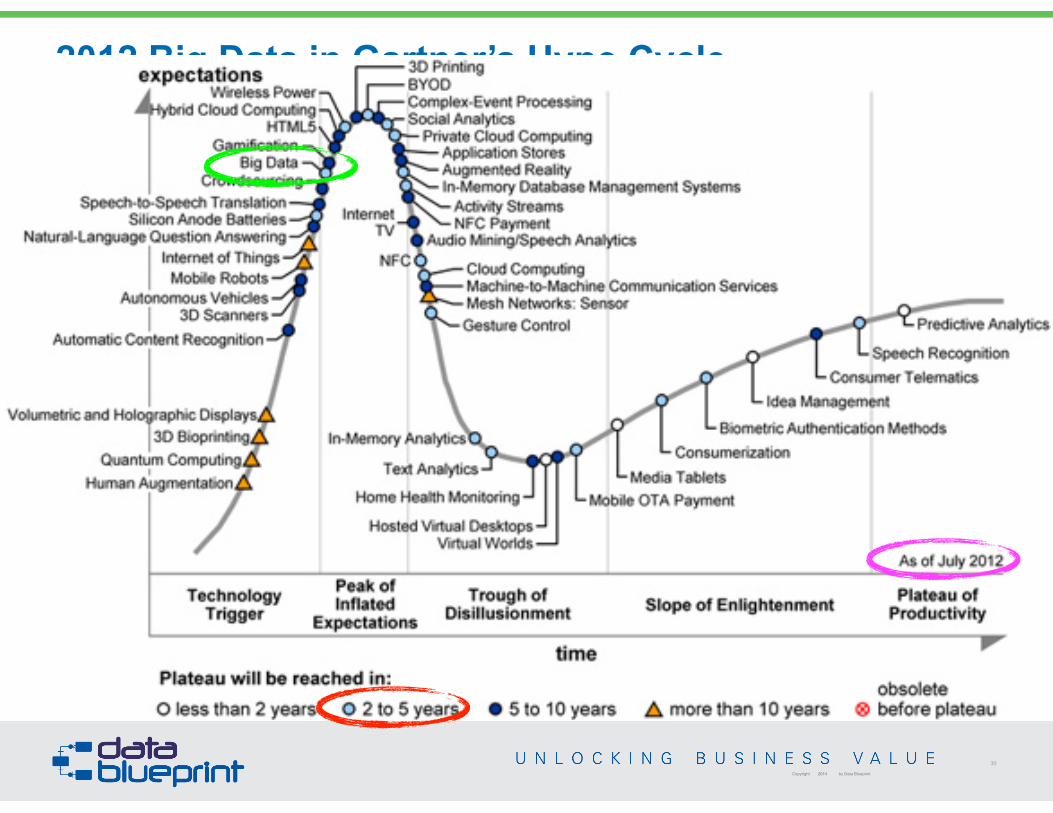
2012 Big Data in Gartner’s Hype Cycle
30
Copyright 2014 by Data Blueprint
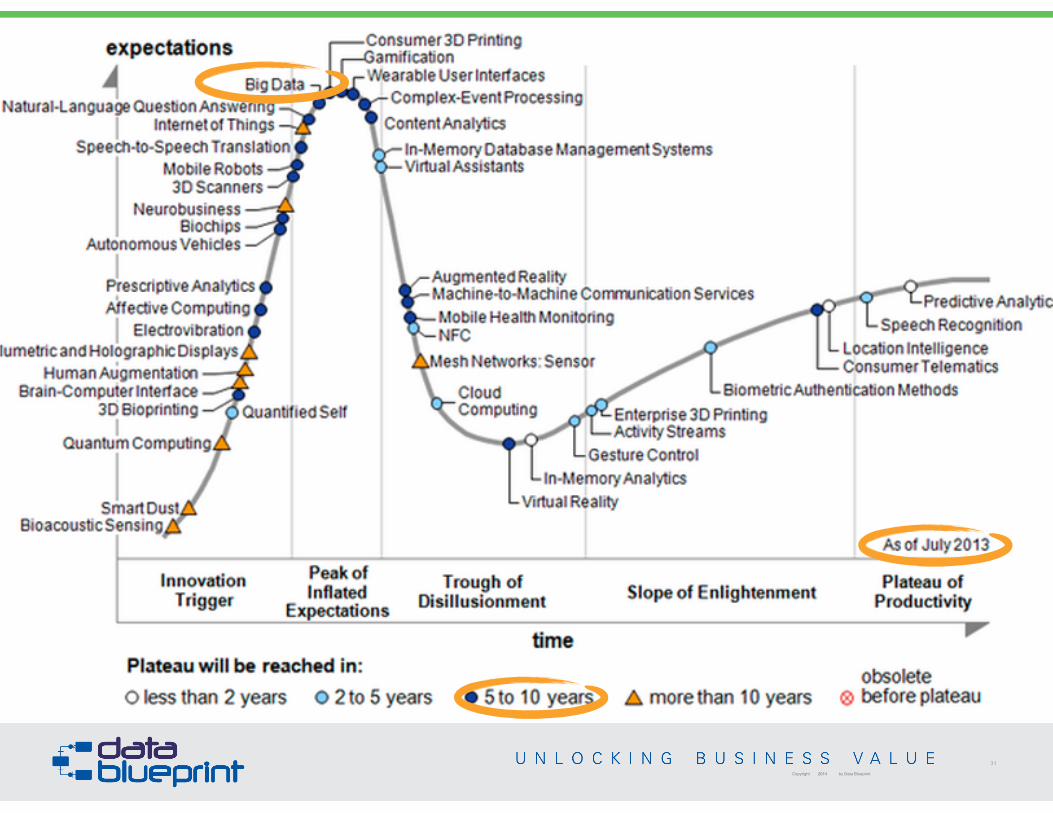
2013 Big Data in Gartner’s Hype Cycle
31
Copyright 2014 by Data Blueprint
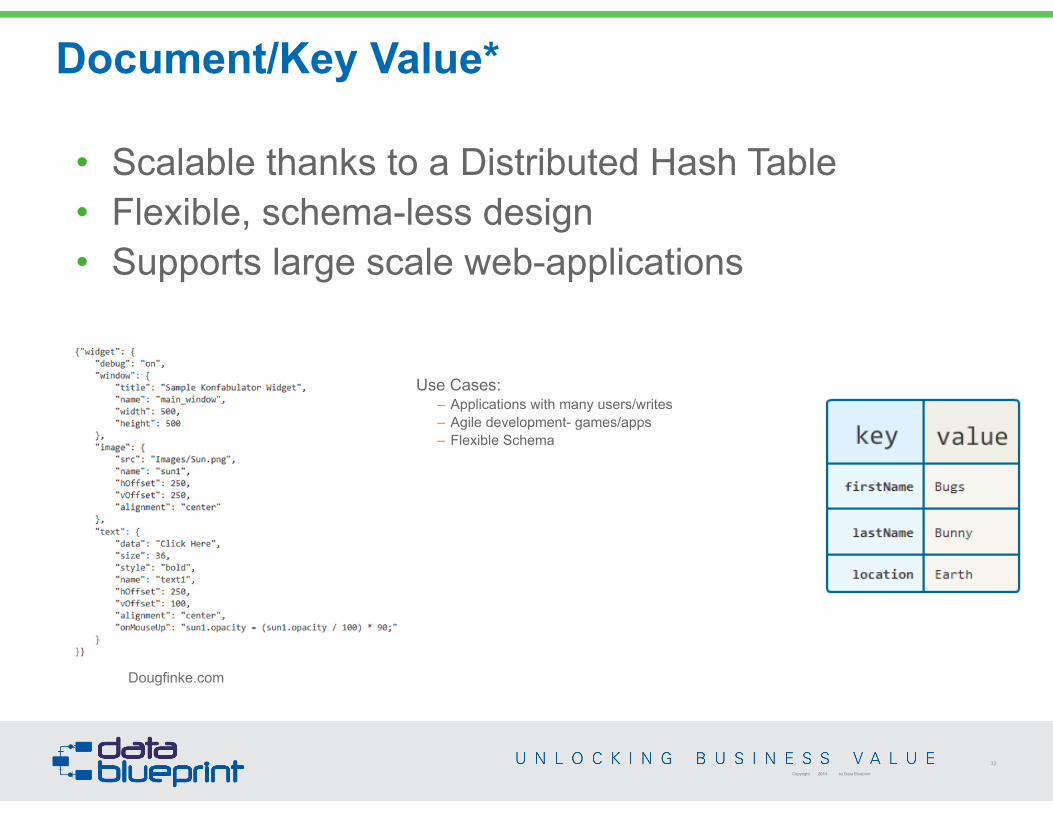
Document/Key Value*
32
Copyright 2014 by Data Blueprint
• Scalable thanks to a Distributed Hash Table • Flexible, schema-less design • Supports large scale web-applications
!
• Use Cases: – Applications with many users/writes – Agile development- games/apps – Flexible Schema !!!!
!
Kirupa.com
Dougfinke.com

Document/Key Value Pros and Cons
33
Copyright 2014 by Data Blueprint
• Pros – “Schema-less” design
empowers developers* – Scalable – High availability – Economically viable (scale
out not up!)
• Cons – Poor ad-hoc query and
analysis capabilities – Lack of maturity – “Eventually consistent”
Other NoSQL Solutions*
34
Copyright 2014 by Data Blueprint
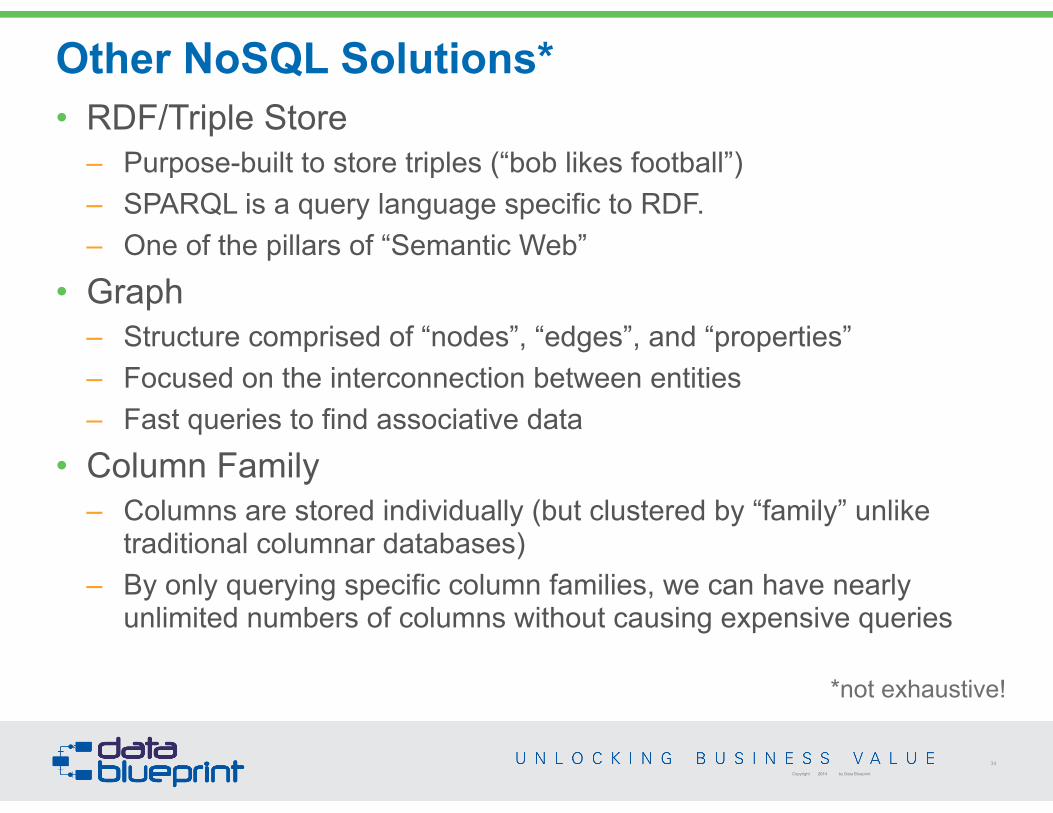
• RDF/Triple Store – Purpose-built to store triples (“bob likes football”) – SPARQL is a query language specific to RDF. – One of the pillars of “Semantic Web”
• Graph – Structure comprised of “nodes”, “edges”, and “properties” – Focused on the interconnection between entities – Fast queries to find associative data
• Column Family – Columns are stored individually (but clustered by “family” unlike
traditional columnar databases) – By only querying specific column families, we can have nearly
unlimited numbers of columns without causing expensive queries
*not exhaustive!
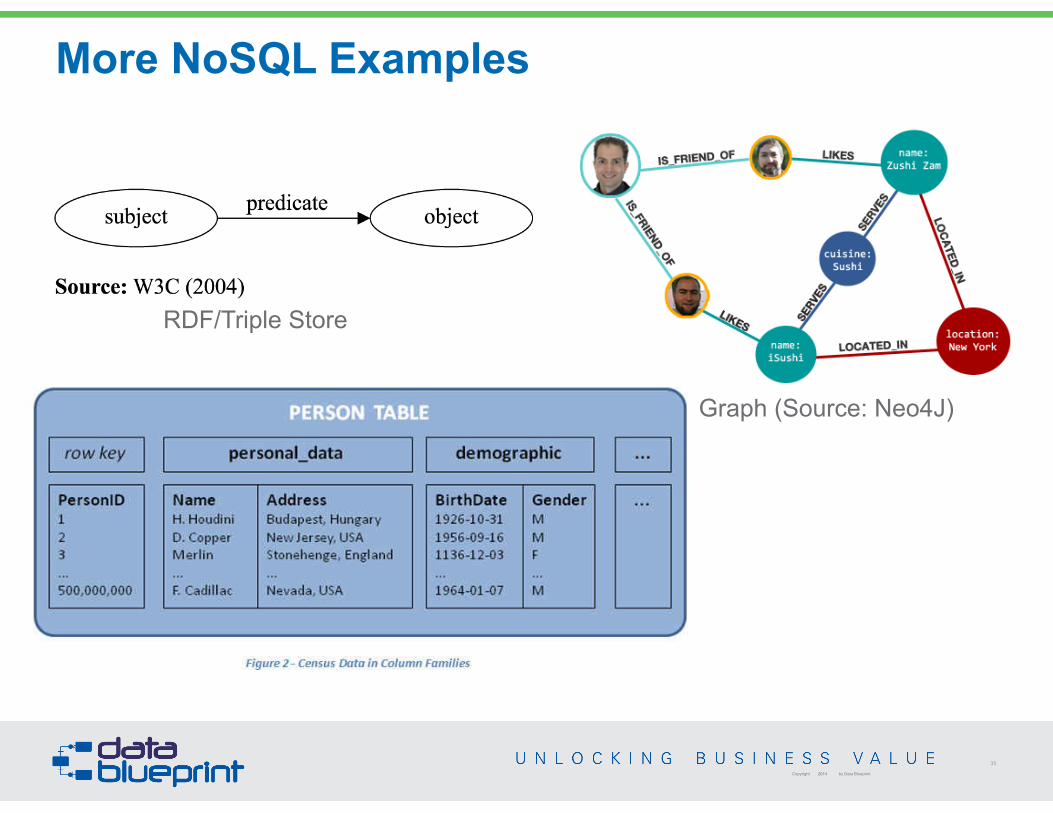
More NoSQL Examples
35
Copyright 2014 by Data Blueprint
RDF/Triple Store
Graph (Source: Neo4J)
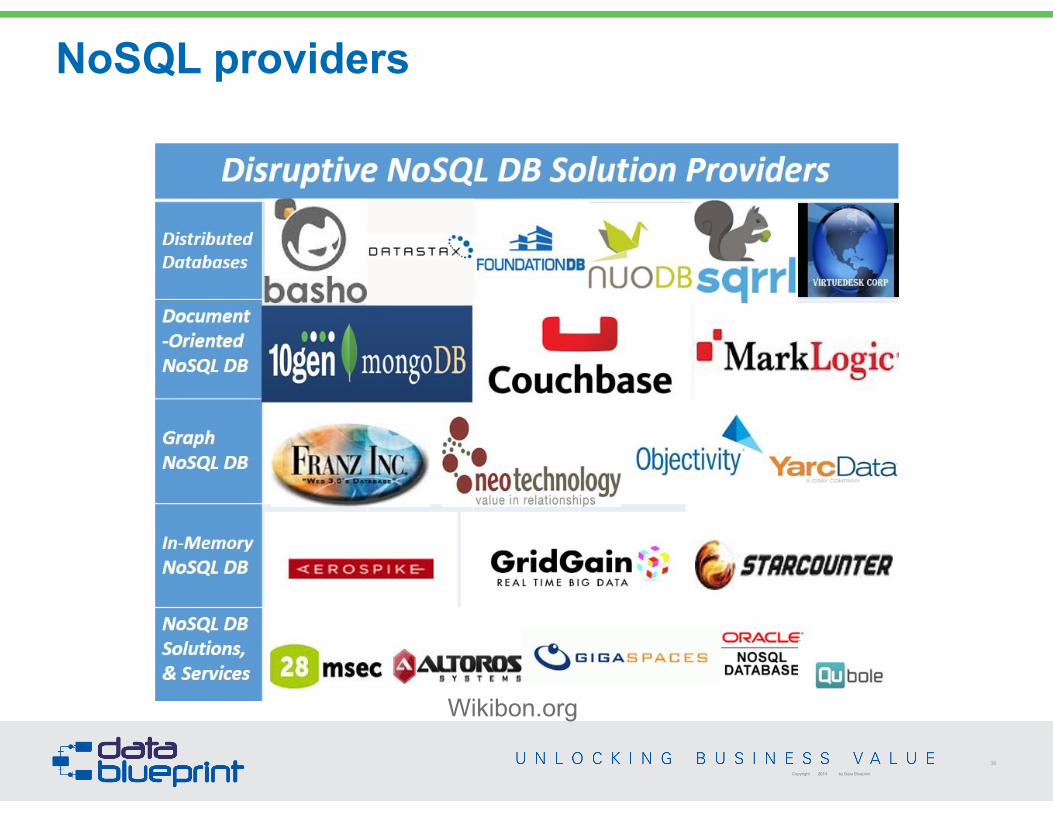
NoSQL providers
36
Copyright 2014 by Data Blueprint
Wikibon.org
Trends in Data Modeling
37
Copyright 2014 by Data Blueprint
• Business to Data: the Relationship • What is a Data Model? • Conceptual, Logical, Physical • What issues can poor data modeling
introduce? • Different Models, Different Uses
• 3NF, Star Schema, Data Vault • Key-Value/Document • Other NoSQL Technologies
• How is it changing • Patterns and Reuse • Abstraction for application • Data Sharing World (The API’s) • Scaling Out not up
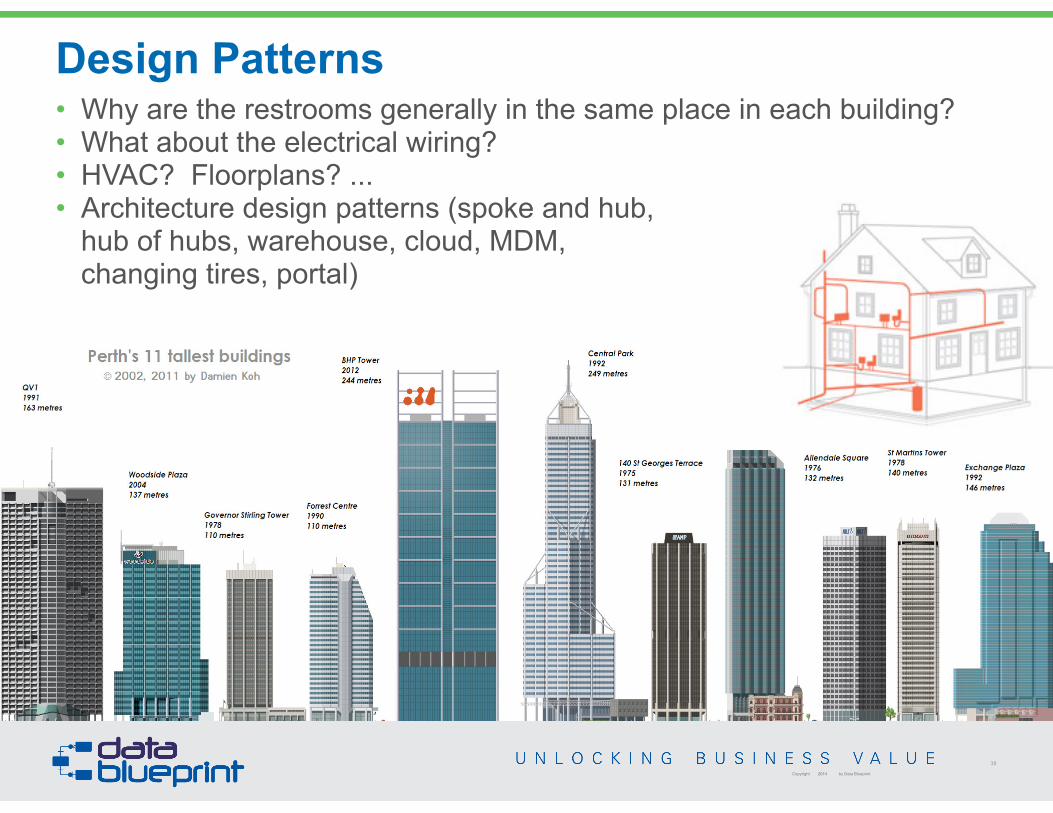
Design Patterns
38
Copyright 2014 by Data Blueprint
• Why are the restrooms generally in the same place in each building? • What about the electrical wiring? • HVAC? Floorplans? ... • Architecture design patterns (spoke and hub,
hub of hubs, warehouse, cloud, MDM, changing tires, portal)
Source:http://dmreview.com/article_sub.cfm?articleID=1000941 used with permission
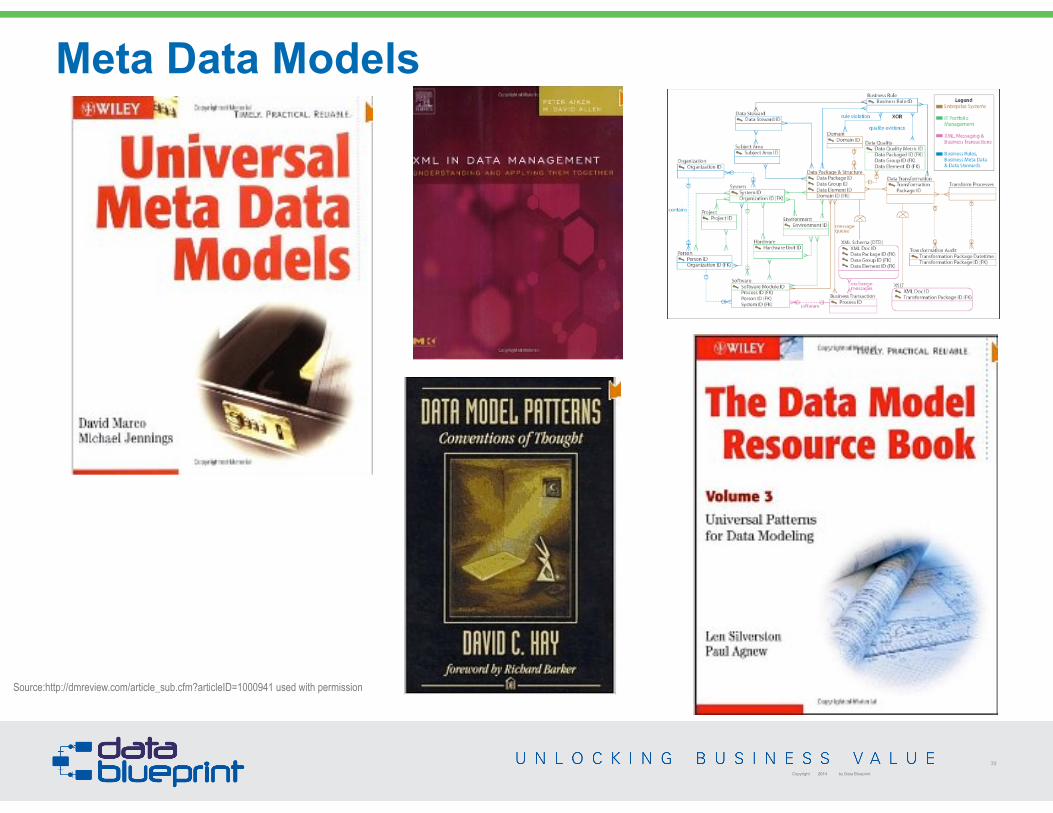
Meta Data Models
39
Copyright 2014 by Data Blueprint
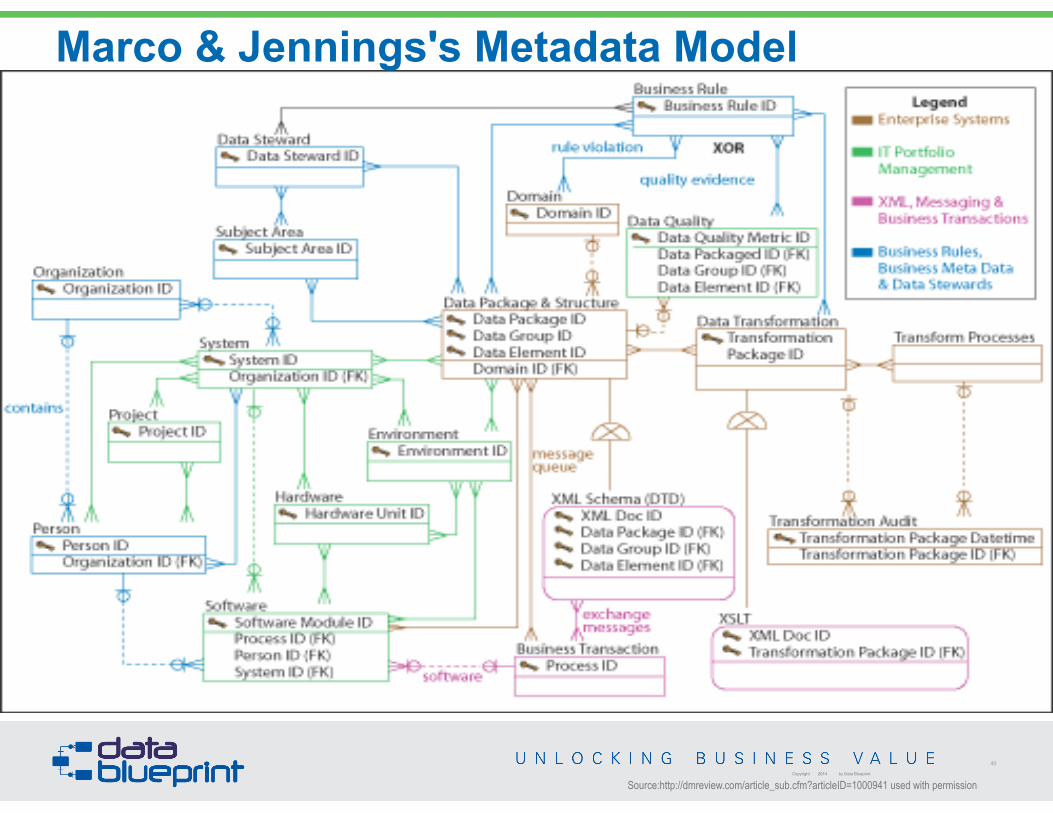
Marco & Jennings's Metadata Model
Source:http://dmreview.com/article_sub.cfm?articleID=1000941 used with permission
40
Copyright 2014 by Data Blueprint
Patterns and Reuse
41
Copyright 2014 by Data Blueprint
• Common rule of thumb:
– One third of a data model contains fields common to all business.
– One third contains fields common to the industry, and the
– Other third is specific to the organization.
• Patterns should theoretically provide an organization with a base-line to quickly develop data infrastructure.
• Off-the-shelf solutions may require in-depth customization or specialization.
Data as a Service
42
Copyright 2014 by Data Blueprint
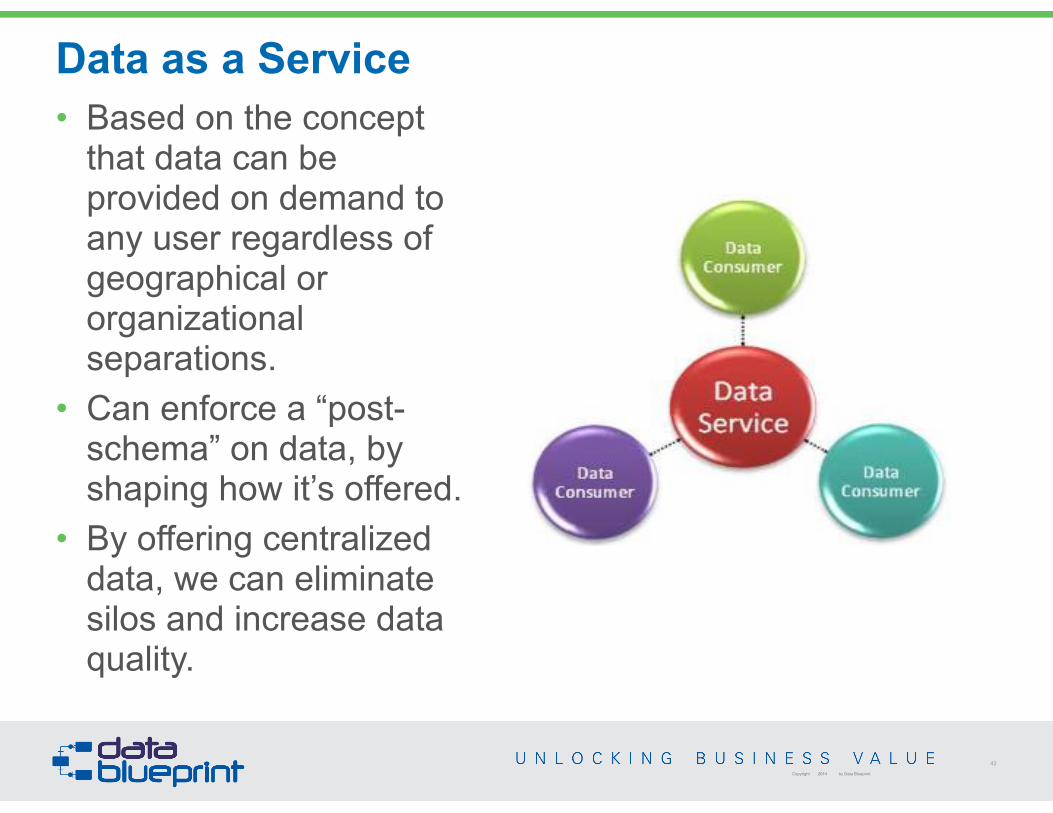
• Based on the concept that data can be provided on demand to any user regardless of geographical or organizational separations.
• Can enforce a “post-schema” on data, by shaping how it’s offered.
• By offering centralized data, we can eliminate silos and increase data quality.
Data Sharing World
43
Copyright 2014 by Data Blueprint
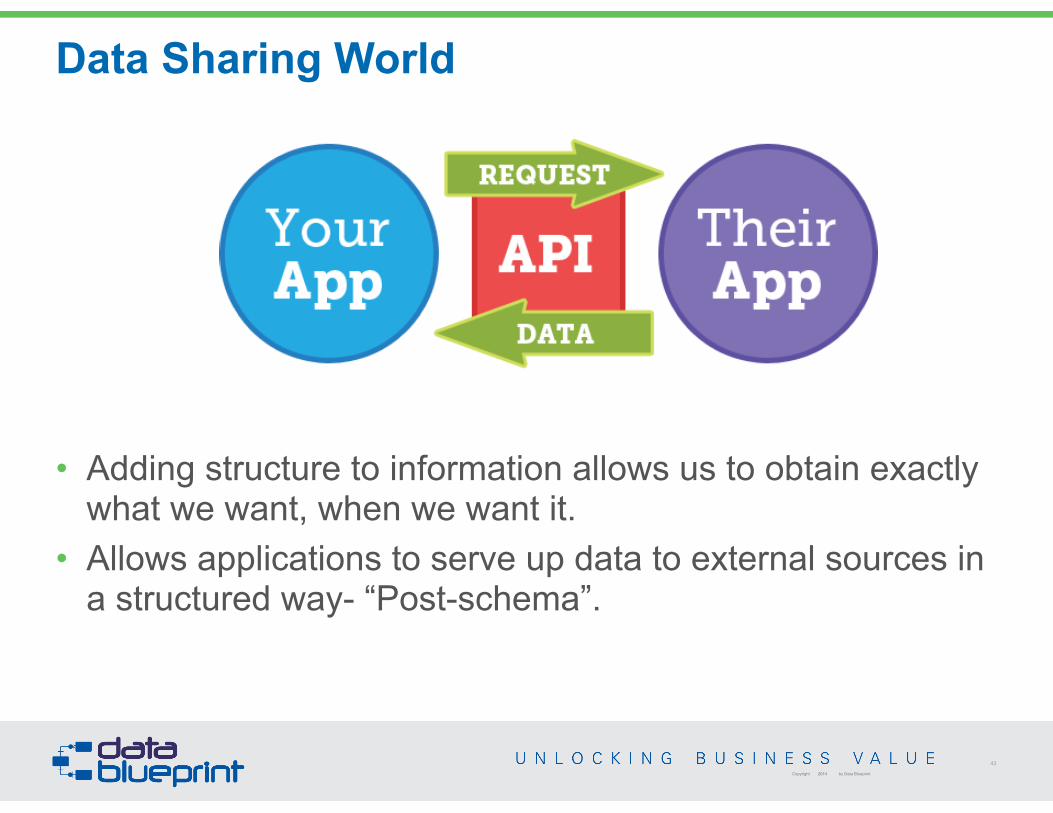
• Adding structure to information allows us to obtain exactly what we want, when we want it.
• Allows applications to serve up data to external sources in a structured way- “Post-schema”.
Scaling Out Not Up
44
Copyright 2014 by Data Blueprint
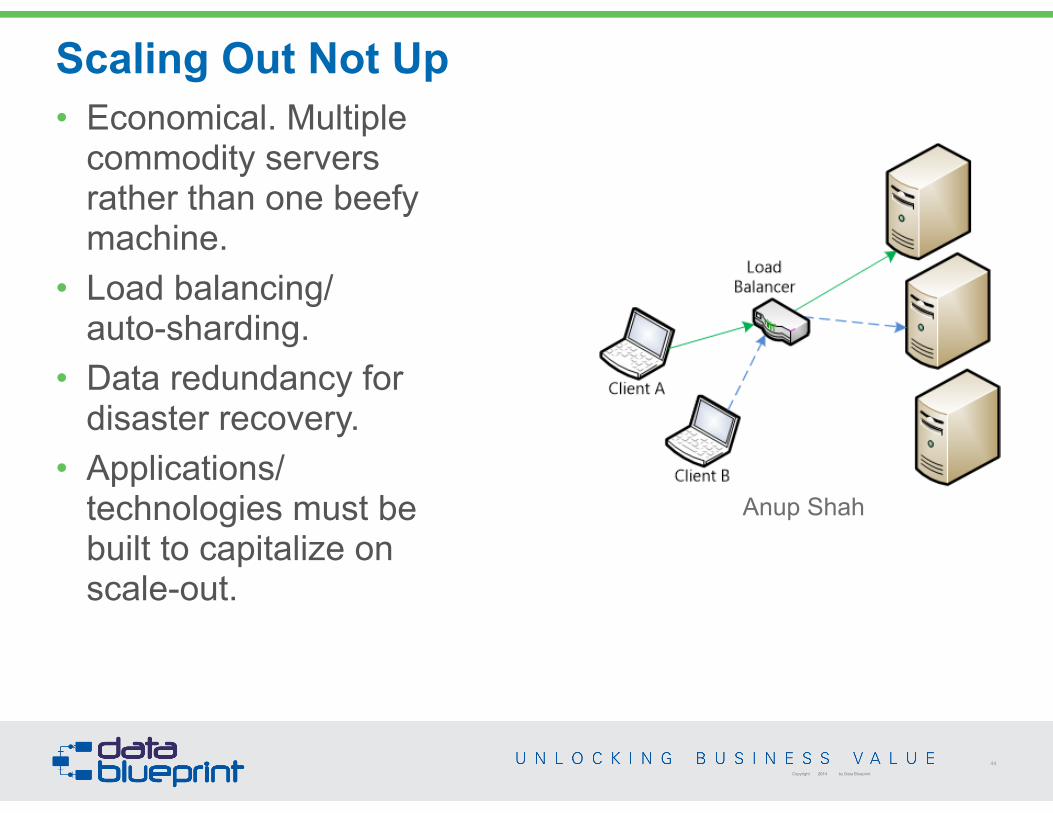
Anup Shah
• Economical. Multiple commodity servers rather than one beefy machine.
• Load balancing/auto-sharding.
• Data redundancy for disaster recovery.
• Applications/technologies must be built to capitalize on scale-out.
Trends in Data Modeling
45
Copyright 2014 by Data Blueprint
• Business to Data: the Relationship • What is a Data Model? • Conceptual, Logical, Physical • What issues can poor data modeling
introduce? • Different Models, Different Uses
• 3NF, Star Schema, Data Vault • Key-Value/Document • Other NoSQL Technologies
• How is it changing • Patterns and Reuse • Abstraction for application • Data Sharing World (The API’s) • Scaling Out not up
Conclusions
46
Copyright 2014 by Data Blueprint
• Data Modeling is important to get right.
• Getting it “right” is hugely dependent on the business case, maturity of the organization, flexibility for future growth, and so much more.
• There are many technologies and ideas available to help solve a number of problems.
• Don't try any of this without considering the various architectures involved
Questions?
47
Copyright 2014 by Data Blueprint
It’s your turn! Use the chat feature or Twitter (#dataed) to submit
your questions to Peter and Steven now.
Upcoming Events
48
Copyright 2014 by Data Blueprint
Metadata Strategies November 11, 2014 @ 2:00 PM ET/11:00 AM PT !
Data Warehouse Strategies December 9, 2014 @ 2:00 PM ET/11:00 AM PT !
Sign up here: • www.datablueprint.com/webinar-schedule • or www.dataversity.net
Sources
49
Copyright 2014 by Data Blueprint
• Data model. (2014, October 7). In Wikipedia, The Free Encyclopedia. Retrieved October 7, 2014, from http://en.wikipedia.org/w/index.php?title=Data_model&oldid=628639882
• Data Modeling 101. (2006). In Agile Data. Retrieved October 7, 2014, from http://www.agiledata.org/essays/dataModeling101.html
Click to Add Presented By Text