data gravity index
TRANSCRIPT

Inaugural report measuring the intensity of Data Gravity and its effect on the Global 2000 Enterprises
Data Gravity Index DGx V1
®
™

2
3 ABOUT
4 FOREWORD
5 INTRODUCTION Index Formula
Index Score
Data Creation Lifecycle
Macro Trends
G2000 Enterprises
Highlights
11 FORECASTS
19 IMPLICATIONS
22 METHODOLOGY
Contents
2Data Gravity Index DGx™ I digitalrealty.com ©2020 Digital Realty Trust®, Inc.
Data GravityIndex™
About Foreword Introduction Forecasts Implications Methodology

Data Gravity Index DGx™ I digitalrealty.com ©2020 Digital Realty Trust®, Inc. 3
ABOUT Foreword Introduction Forecasts Implications Methodology
Data GravityIndex™
As the largest global provider of multi-tenant datacenter capacity,1 we have a unique vantage point on how technology infrastructure is built, deployed and operated. Our customers continue to solve the most complex infrastructure, connectivity and workload use cases on our platform globally. This includes use cases across network peering, hyperscale, low-latency, high-performance computing, big data and artificial intelligence.
Recently, we have witnessed the emergence of a new megatrend occurring on our platform: specifically, the explosion of enterprise data growth globally. This drove us to understand more. We conducted research between August 2019 and August 2020 and drew upon more than a dozen third-party data sources, ranging from the World Economic Forum and United Nations to global consulting and market research firms. We also developed a patent-pending formula to measure, quantify and determine the implications of the explosion of enterprise growth. The methodology is based on the analysis of thousands of attributes of Global 2000 Enterprise companies’ presences in each metro, along with variables for each metro, including GDP, population, number of employees, technographics, IT spend, average bandwidth and latency, as well as flows of data.
We are publishing our findings as an annual report to facilitate industry dialogue and to assist both our Enterprise and Service Provider customers as they shift their infrastructure strategy to address this emerging megatrend. Introducing the Data Gravity Index DGx™ - a global forecast that measures the intensity and gravitational force of enterprise data growth for 21 metros across the world.
About the Data Gravity Index™
Digital Realty Trust, Inc. owns or licenses all copyright rights in all content, including, without limitation, all text, images, videos, and graphics in this document, to the full extent provided under the copyright laws of the United States and other countries. You are prohibited from copying, reproducing, modifying, distributing, displaying, performing, or transmitting any of the content in this document for any purposes.
1. 451 Research, Market Forecast, Leased Datacenter Global Providers, 2020. Capacity measured in terms of both the number of datacenters and operational square footage.
About Digital RealtyDigital Realty supports the world’s leading enterprises and service providers by delivering the full spectrum of data center, colocation and interconnection solutions. PlatformDIGITAL®, the company’s global data center platform, provides customers a trusted foundation and proven Pervasive Datacenter Architecture PDx™ solution methodology for scaling digital business and efficiently managing data gravity challenges. Digital Realty’s global data center footprint gives customers access to the connected communities that matter to them with 280 facilities in 47 metros across 22 countries on six continents.
To learn more about Digital Realty, please visit digitalrealty.com or follow us on LinkedIn and Twitter.
A DIGITAL REALTY COMPANY A Digital Realty and Brookfield Infrastructure JV

About FOREWORD Introduction Forecasts Implications Methodology
Data Gravity Index DGx™ I digitalrealty.com ©2020 Digital Realty Trust®, Inc. 4
Data GravityIndex™
The Digital Economy The digital economy is remaking both private
and public enterprises across all industries, transforming how they create and deliver value.
Requires a New Business Architecture To succeed, enterprises need to operate ubiquitously and on-demand, augmented by real-time intelligence
to best serve customers, partners and employees across channels, business functions, and
multiple points of business presence.
Data Gravity is the Obstacle Data Gravity inhibits enterprise workflow performance,
raises security concerns, and increases costs, all complicated by regulatory requirements and other
artificial constraints. With Data Gravity, the laws of physics and IT intersect to provide a proxy for a new age of business
architectures that Enterprises will be driven to adopt and Service Providers will be pressed to support.
Foreword Forces a Shift to Data-Centric Architecture Data Gravity forces a new architecture, one that
inverts traffic flow and brings users, networks and clouds to privately hosted enterprise
data. With this new architecture, Data Gravity barriers are removed and new capabilities are unlocked.
Elevates the Role of a Multi-Tenant Datacenter
To implement this data-centric architecture, Enterprises and Service Providers need a secure, neutral meeting place to host their infrastructure
in proximity to yet separate from each other.A multi-tenant datacenter platform enables
such a deployment paradigm.
It’s the first time Data Gravity has been measured and quantified for the Global 20001 Enterprises.
1. Defined by Forbes’ annual ranking of the world’s 2000 largest public companies
Data Gravity Index DGx™ I digitalrealty.com ©2020 Digital Realty Trust®, Inc. 55
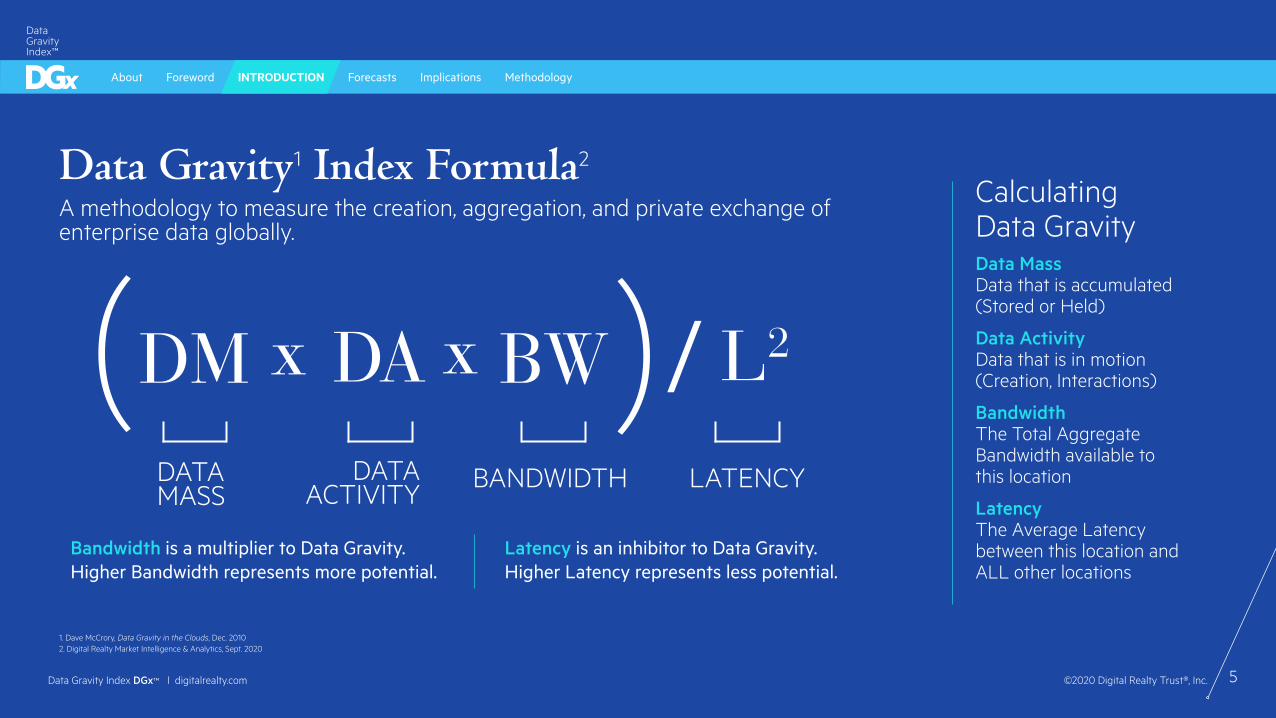
Data Mass Data that is accumulated (Stored or Held)
Data Activity Data that is in motion (Creation, Interactions)
Bandwidth The Total Aggregate Bandwidth available to this location
Latency The Average Latency between this location and ALL other locations
Data Gravity1 Index Formula2
A methodology to measure the creation, aggregation, and private exchange of enterprise data globally.
Calculating Data Gravity
Bandwidth is a multiplier to Data Gravity. Higher Bandwidth represents more potential.
Latency is an inhibitor to Data Gravity. Higher Latency represents less potential.
Data Gravity Index DGx™ I digitalrealty.com ©2020 Digital Realty Trust®, Inc.
1. Dave McCrory, Data Gravity in the Clouds, Dec. 2010 2. Digital Realty Market Intelligence & Analytics, Sept. 2020
DATAMASS
DATAACTIVITY
BANDWIDTH LATENCY
About Foreword INTRODUCTION Forecasts Implications Methodology
Data GravityIndex™

About Foreword INTRODUCTION Forecasts Implications Methodology
Data Gravity Index DGx™ I digitalrealty.com ©2020 Digital Realty Trust®, Inc. 6
Data GravityIndex™
Data Gravity Index Score Reflects Intensity The Data Gravity Index Score measures the intensity and gravitational force of enterprise data growth across 21 metros globally. The score, as measured in gigabytes per second, provides a relative proxy for measuring data creation, aggregation and processing.
Data Gravity scores, as measured in gigabytes per second, illustrative of actual results
AMERICAS
New York’s Data Gravity Score79.61
EMEA APAC
Tokyo’s Data Gravity Score80.32
London’s Data Gravity Score167.05
The Data Gravity Score considers 1,000+ attributes from 13 authoritative sources on G2000 Enterprises including:
Firmographic Data• Industry segment(s)
• Employee data
• Revenue data
• Location data
• Corporate entity
Technographic Data• IT spend
• Preferred vendors
• Network traffic
distribution
• Network PoPs
• DC PoPs
• Cloud PoPs
Industry Benchmarks
• Data creation/ transfer
rates
• Latency by access
method, user type,
location, application
type
• Growth rates
• Cloud usage
• Networking services
• Distributed services
• Data technologies
• End points, user devices
• Application use cases
Figs. 1, 2 and 3. Data Gravity Index, Sept. 2020

About Foreword INTRODUCTION Forecasts Implications Methodology
Data Gravity Index DGx™ I digitalrealty.com ©2020 Digital Realty Trust®, Inc. 7
Data GravityIndex™
STRUCTURED & UNSTRUCTURED
STORAGE
INTERACTIONS & TRANSACTIONS
Continuous Data Creation Lifecycle Underpins Data Gravity
Enterprises serve an increasing number of users and endpoints that are creating and exchanging data
By 2022, more than 50% of enterprise data will be created outside the data center or cloud 1
PEOPLE &THINGS
DATA CREATION
DATA PROCESSING
DATA AGGREGATION & EXCHANGE
DATA ENRICHMENT
Fig. 4. Data Creation Lifecycle; Data Gravity Index, Sept. 2020
Files and messages invoke concurrent interactions and transactions between users and machines
By 2024, G2000 Enterprises in these 21 metros will be required to add an additional 8,960 petaFLOPs to process new digital workflows2
Enterprise Data has to be gathered and formatted for presentation, exchange and compliant storage
By 2024, across the 21 metros, G2000 Enterprises will be adding storage at a combined rate of 496 terabytes per second for aggregation & exchange3
Analytics, machine learning and AI enable enterprises to embed workflow intelligence
By 2022, 65% of CIOs will incorporate AI into their ERP strategies to gain competitive advantage4
1. Gartner, Infrastructure is Everywhere, ID #G00384194 2. Digital Realty Market Intelligence & Analytics, Sept. 2020 3. Digital Realty Market Intelligence & Analytics, Sept. 2020 4. Gartner, 100 Data and Analytics Predictions Through 2024, ID #G00721868
ANALYTICS & ENRICHMENT

About Foreword INTRODUCTION Forecasts Implications Methodology
Data Gravity Index DGx™ I digitalrealty.com ©2020 Digital Realty Trust®, Inc. 8
Data GravityIndex™
Macro Trends Amplifying Data Gravity
WHAT
WHY
HOW
Enterprise Data Stewardship The enterprise is fast becoming the world’s
data steward
By 2025, 80% of data worldwide will reside
in enterprises1
Increases the volume of data that needs to be aggregated and stored
Source: 1IDC #US44413318, Data Age 2025, The Digitization of the World
From Edge to Core, November 2018
Digital-Enabled InteractionsIncreasing digitization of
enterprise workflows
Digitally-enabled interactions rank 2x greater importance
vs. physical interactions 3
Increases enterprise data exchange volumes globally
Source: 3McKinsey, B2B Decision Maker Pulse Survey, April 2020
Data LocalizationExpanding legal and regulatory
policies requiring local data storage
By 2022, 87% of IT Leaders will maintain local copies of customer
and transaction data for compliance4
Increases # of enterprise locations of data aggregation
Source: 4451 Research , Infrastructure Imperative – IT Leader Survey,
November 2019
Cyber—Physical Integration of physical and digital security systems to
improve enterprise cybersecurity
By 2023, 70% of security products will integrate
IT-OT-IOT systems5
Increases types and volumes of data creation & exchange
Source: 5Gartner, Emerging Technology Analysis- Cyber-Physical
Security. ID: G00726994
Mergers & AcquisitionsGlobalization is driving corporate
M&A to achieve scale
M&A Volumes are expected to return to pre-Covid
levels in 20212
Increases # of data sources participating in data exchange
Source: 2Goldman Sachs, BRIEFINGS Newsletter June 16, 2020

About Foreword INTRODUCTION Forecasts Implications Methodology
Data Gravity Index DGx™ I digitalrealty.com ©2020 Digital Realty Trust®, Inc. 9
Data GravityIndex™
Why Data Gravity Impedes G2000 EnterprisesAs a cohort, Global 2000 Enterprises have the greatest propensity to need to address Data Gravity. This segment spends $2.6T annually on IT Infrastructure & Networking,1 operating the most complex systems and serving millions of users and endpoints, with coverage across many points of presence globally.
G2000 ENTERPRISE IT COMPOSITE PROFILE 1,2,3,4,5,6,7,8
• 13+ Countries w/Business Presence
• 19k Business Units in Top 21 Metros
• 36+ Points of Presence (PoPs)
• 7k+ Datacenter PoPs
• 100m+ Employees
• 11m+ Applications
• 57k+ SAAS Applications
• $2.6T+ Annual IT & Network Spend
• $18B+ Annual IAAS Spend
• $8B+ Annual PAAS Spend
• $40B+ Annual SAAS Spend
• $7B+ Annual Colocation Spend
1. Gartner, Digital Realty Market Intelligence & Analytics: 2. HG Insights; 3. Intricately; 4. Synergy Research; 5. Gartner; 6. IDC; 7. Telegeography; 8. Digital Realty Market Intelligence & Analytics
Figs. 5, 6 and 7. Data Gravity Index, Sept. 2020
AMERICAS
New York’s Data Gravity Score79.61
EMEA APAC
Tokyo’s Data Gravity Score80.32
London’s Data Gravity Score167.05
Data Gravity Index DGx™ I digitalrealty.com ©2020 Digital Realty Trust®, Inc. 10
About Foreword INTRODUCTION Forecasts Implications Methodology
Data GravityIndex™
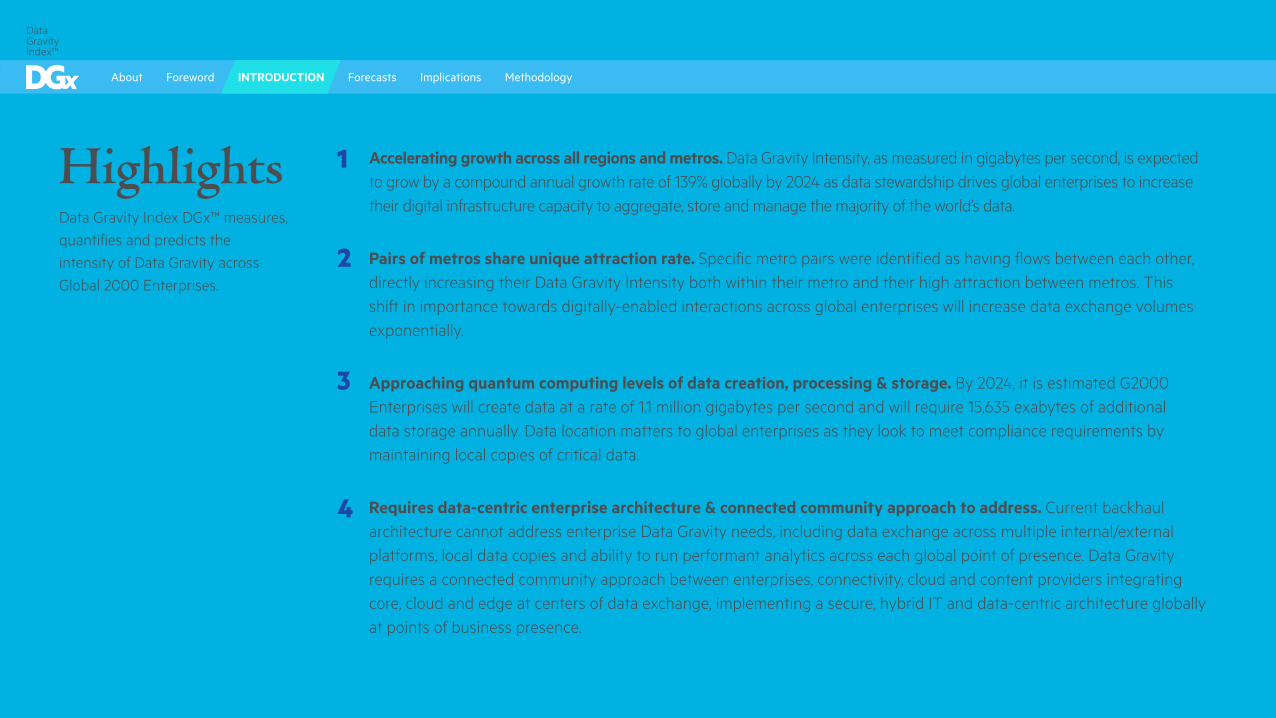
Highlights Accelerating growth across all regions and metros. Data Gravity Intensity, as measured in gigabytes per second, is expected to grow by a compound annual growth rate of 139% globally by 2024 as data stewardship drives global enterprises to increase their digital infrastructure capacity to aggregate, store and manage the majority of the world’s data.
Pairs of metros share unique attraction rate. Specific metro pairs were identified as having flows between each other, directly increasing their Data Gravity Intensity both within their metro and their high attraction between metros. This shift in importance towards digitally-enabled interactions across global enterprises will increase data exchange volumes exponentially.
Approaching quantum computing levels of data creation, processing & storage. By 2024, it is estimated G2000 Enterprises will create data at a rate of 1.1 million gigabytes per second and will require 15,635 exabytes of additional data storage annually. Data location matters to global enterprises as they look to meet compliance requirements by maintaining local copies of critical data.
Requires data-centric enterprise architecture & connected community approach to address. Current backhaul architecture cannot address enterprise Data Gravity needs, including data exchange across multiple internal/external platforms, local data copies and ability to run performant analytics across each global point of presence. Data Gravity requires a connected community approach between enterprises, connectivity, cloud and content providers integrating core, cloud and edge at centers of data exchange, implementing a secure, hybrid IT and data-centric architecture globally at points of business presence.
1
2
3
4
Data Gravity Index DGx™ measures, quantifies and predicts the intensity of Data Gravity across Global 2000 Enterprises.

ForecastsData Gravity Index forecasts through 2024 by region, metro, metro-to-metro exchange, enterprise data creation, processing and storage
About Foreword Introduction FORECASTS Implications Methodology
11Data Gravity Index DGx™ I digitalrealty.com ©2020 Digital Realty Trust®, Inc.
Data GravityIndex™

Global ForecastAccelerating growth across all regions. Data Gravity
Intensity, as measured in gigabytes per second, is expected to
grow by a compound annual growth rate of 139% globally by
2024 as data stewardship drives global enterprises to increase
their digital infrastructure capacity to aggregate, store and
manage the majority of the world’s data. 4,000.00
2,000.00
6,000.00
8,000.00
10,000.00
12,000.00
14,000.00
16,000.00
2020 2021 2022
Total
2023 2024
Data Gravity Intensity Global Forecast1,2
139% CAGR
Gig
abyt
es P
er S
econ
d
Year
18,000.00
1. Data Gravity Intensity is calculated by the Data Gravity Index Formula: (DM x DA x BW) / L2
2. Data Gravity Intensity is defined by the Data Gravity Index Score. See Methodology for scoring and data.
Fig. 8. Data Gravity Index, Sept. 2020
About Foreword Introduction FORECASTS Implications Methodology
Data Gravity Index DGx™ I digitalrealty.com ©2020 Digital Realty Trust®, Inc. 12
Data GravityIndex™

2020 2021 2022 2023 2024
Data Gravity Intensity Regional Forecast1,2
APAC 153% CAGR
EMEA 133% CAGR
NA 137% CAGR
0 2,000.00 4,000.00 6,000.00 8,000.00 10,000.00
Regi
on
Gigabytes Per Second
12,000.00 14,000.00
Regional ForecastAccelerating growth across all regions. Data Gravity Intensity, as
measured in gigabytes per second, is expected to grow by a compound
annual growth rate of 133% or higher in each region by 2024.
Forecast Highlights• By 2024, EMEA is expected to remain the home to the greatest
intensity of Data Gravity across the 21 metros.
• Across the 21 metros, EMEA and APAC Data Gravity Intensity are
increasing at faster rates than North America.
• Across the 21 metros, EMEA region Data Gravity Intensity will exit
2024 at almost double the rate of North America.Fig. 9. Data Gravity Index, Sept. 2020
1. Data Gravity Intensity is calculated across 21 metros using the Data Gravity Index Formula: (DM x DA x BW) / L2
2. Data Gravity Intensity is defined by the Data Gravity Index Score. See Methodology for scoring and data.
About Foreword Introduction FORECASTS Implications Methodology
Data Gravity Index DGx™ I digitalrealty.com ©2020 Digital Realty Trust®, Inc. 13
Data GravityIndex™

Data Gravity Intensity Metro Forecast1,2
0.01 0.10 1.00 10.00 100.00 1,000.00 10,000.00
Amsterdam
Beijing
Chicago
Dallas
Dublin
Frankfurt
Hong Kong
London
Los Angeles
Mexico City
New York
Paris
Sao Paulo
Seattle
Seoul
Shanghai
Silicon Valley
Singapore
Sydney
Tokyo
Washington, D.C.
2024 2020Gigabytes Per Second
Top
21 M
etro
s
177% CAGR
158% CAGR
200% CAGR
159% CAGR155% CAGR
164% CAGR
Metro ForecastFrom 2020 to 2024, the top 6 metros with the highest CAGR (in descending order) are:
Singapore I Hong Kong I Dallas I Sydney I Seattle I Tokyo
Singapore is a critical business and data hub for global enterprises with presence in the APAC region with its pro-business policies and diverse connectivity options.
Hong Kong is an international financial and trade hub and connectivity gateway between APAC and the rest of the world for global enterprises.
Dallas is a preeminent business hub for global or regional headquarters and provides a connectivity gateway for global enterprises.
Sydney has developed into a global business hub with a majority of global enterprises with operating presence, in addition to serving as a rich connectivity gateway.
Seattle is becoming the home to many global enterprises participating in the cloud ecosystem, in addition to being a connectivity conduit between North America and APAC regions.
Tokyo is one of the largest economies in the world, a business and financial hub for global enterprises and drives large amounts of data creation.
Fig. 10. Data Gravity Index, Sept. 2020
1. Data Gravity Intensity is calculated by the Data Gravity Index Formula: (DM x DA x BW) / L2
2. Data Gravity Intensity is defined by the Data Gravity Index Score. See Methodology for scoring and data.
About Foreword Introduction FORECASTS Implications Methodology
Data Gravity Index DGx™ I digitalrealty.com ©2020 Digital Realty Trust®, Inc. 14
Data GravityIndex™

Inter-Metro ForecastGlobal Metro to Metro Gravity
Top 10 Metro to Metro Connections 2020Attraction Metro A Metro B
14,344.22 London Amsterdam
12,162.51 Paris London
7,604.18 Washington, D.C. New York
4,533.48 Silicon Valley Los Angeles
1,611.46 Frankfurt Paris
1,211.34 London Frankfurt
1,109.79 Shanghai Beijing
420.32 New York Silicon Valley
386.90 New York London
369.07 Dublin London
Pairs of metros share unique attraction rate. Specific metro pairs were identified as having flows between each other, directly increasing their Data Gravity Intensity both within their metro and with their high attraction between metros. This shift in importance towards digitally-enabled interactions across global enterprises will increase data exchange volumes exponentially.
1. London to Amsterdam is at the top in both 2020 and 2024. London is a leading financial center for internationalenterprises, and Amsterdam is headquarters to some of the world’s largest companies and a leading financial hub for Europe. Data is exchanged for finance and trade purposes, among other reasons, creating a very high level of attraction.
2. Paris to London is the second-highest attraction in both 2020 and 2024. Paris and London are both financialcenters with large populations and are capital cities of their respective countries. With diverse G2000 Enterprise presence, their combined data being shared and generated makes their attraction very high.
3. Hong Kong to Tokyo is projected to be in the top 10 attraction between metros by 2024. Hong Kong is a largefinancial center with high volumes of trade and is considered a gateway to China. Tokyo is the gateway to Asia from the US and has lots of manufacturing and, in addition to being a financial center, drives large amounts of data creation. While the attraction is predicted to increase between 2020 and 2024, this attraction is expected to stay in the top 10 for a long time.
Figs. 11 and 12. Data Gravity Index, Sept. 2020
1. Attraction between metros is calculated by adding Data Masses together and adding the Data Activity numbers together, then multiplying them with Bandwidth and finally dividing the result by the Latency squared between them.2. See Methodology for scoring and data.
Top 10 Metro to Metro Connections 2024Attraction Metro A Metro B
387,160.00 London Amsterdam
351,187.93 Paris London
220,339.51 Washington, D.C. New York
167,647.26 Silicon Valley Los Angeles
54,800.54 Frankfurt Paris
34,162.12 Beijing Shanghai
27,464.84 London Frankfurt
12,193.56 New York Silicon Valley
11,183.59 New York London
10,795.09 Hong Kong Tokyo
About Foreword Introduction FORECASTS Implications Methodology
Data Gravity Index DGx™ I digitalrealty.com ©2020 Digital Realty Trust®, Inc. 15
Data GravityIndex™

By 2024, it is estimated G2000 Enterprises across the 21
metros will create 1.1 million gigabytes of data per second.
400,000
200,000
600,000
800,000
1,000,000
1,200,000
2020 2021 2022 2023 2024
Calculating Enterprise Data Creation (Gigabytes Per Second) 1,2
521,611
669,708
859,860
1,104,009
0
Gig
abyt
es P
er S
econ
d
Year
28% CAGR
406,265
Fig. 13. Data Gravity Index, Sept. 2020
Data Gravity Intensity Quantified - Enterprise Data Creation
1. Data creation was calculated by combining data created by both G2000 Enterprise employees and end points..2. See Methodology for scoring and data.
About Foreword Introduction FORECASTS Implications Methodology
Data Gravity Index DGx™ I digitalrealty.com ©2020 Digital Realty Trust®, Inc. 16
Data GravityIndex™

By 2024, G2000 Enterprises across 21 metros will require 8.96
additional exaFLOPs to process new digital workflows.
Fig. 14. Data Gravity Index, Sept. 2020
Data Gravity Intensity Quantified – Enterprise Data Processing
1. Data Processing was calculated by analyzing G2000 Enterprise IT processing needs to handle new data-centric workloads such as AI & ML, analytics, costs per TFLOPs, and other factors.2. See Methodology for scoring and data.
Metro 2020 2024Amsterdam 154.51 185.67
Beijing 1,598.23 1,920.55
Chicago 211.90 254.63
Dallas 250.34 300.82
Dublin 127.22 152.87
Frankfurt 64.99 78.10
Hong Kong 237.51 285.40
London 693.31 833.13
Los Angeles 130.28 156.55
Mexico City 48.16 57.87
New York 796.67 957.34
Paris 420.82 505.69
Sao Paulo 48.14 57.85
Seattle 227.47 273.35
Seoul 193.99 233.11
Shanghai 172.79 207.64
Silicon Valley 587.94 706.51
Singapore 101.40 121.85
Sydney 148.92 178.95
Tokyo 1,054.97 1,267.73
Washington DC 187.53 225.34
7,457.06 8,960.96
Enterprise Data Processing 2020-2024 by Metro (pFLOPS)1,2
About Foreword Introduction FORECASTS Implications Methodology
Data Gravity Index DGx™ I digitalrealty.com ©2020 Digital Realty Trust®, Inc. 17
Data GravityIndex™

4,000
2,000
6,000
8,000
10,000
12,000
14,000
2020 2021 2022 2023 2024
Calculating Enterprise Data Storage Growth (Exabytes)1,2
4,478
6,794
10,306
0
Exab
ytes
Year
52% CAGR
16,000
18,000
2,952
15,635
By 2024, it is estimated G2000 Enterprises across the
21 metros will require 15,635 exabytes of additional data
storage annually.
Fig. 15. Data Gravity Index, Sept. 2020
Data Gravity Intensity Quantified - Enterprise Data Storage
1. Data Storage was calculated by taking the storage capacity, growth and annual rate of deployment of Enterprise storage (HDD, SSD, and Tape) and analyzing across 21 metros.2. See Methodology for scoring and data.
About Foreword Introduction FORECASTS Implications Methodology
Data Gravity Index DGx™ I digitalrealty.com ©2020 Digital Realty Trust®, Inc. 18
Data GravityIndex™

Implications
About Foreword Introduction Forecasts IMPLICATIONS Methodology
Data Gravity Index DGx™ I digitalrealty.com ©2020 Digital Realty Trust®, Inc. 19
Data GravityIndex™

Centers of Data
Exchange
Implication #1 – A Data-Centric Architecture is Mandatory
Architecture is constrained Needs to be inverted Deployed at global points of presence
CURRENT BACKHAUL ARCHITECTURE DOES NOT ADDRESS GLOBAL ENTERPRISES’ DATA GRAVITY NEEDS TO:• Exchange data across multiple internal/external platforms• Maintain local data copies for data compliance• Run concurrent multi-data set analytics in a performant manner at
global points of presence
A DATA-CENTRIC ARCHITECTURE IS REQUIRED TO ADDRESS DATA GRAVITY BARRIERS, THIS INCLUDES:• Putting data at the center of the architecture• Inverting traffic flow, leveraging interconnection and bringing clouds
and users to the data • Removes speed of light & Data Gravity performance constraints at
global points of presence
IMPLEMENTING A DATA-CENTRIC ARCHITECTURE IN MULTI-TENANT DATACENTERS ADDRESSES DATA GRAVITY AT GLOBAL POINTS OF PRESENCE TO:• Reduce Risk – with secure data exchange • Lower Costs – reduction in bandwidth and duplicated infrastructure• Grow Revenue – through unbounded data analytic performance
SENDS DATA TO CLOUDS
BRINGS CLOUDS TO THE DATA
RECEIVES DATA SLOWLY
BRINGS USERS TO THE DATA
IN THE CLOUDS Applications & Capacity
AT THE EDGE Users & Things
IN THE CLOUDS Applications & Capacity
AT THE EDGE Users & Things
Current backhaul architecture cannot address enterprise Data Gravity needs, including data exchange across multiple internal/external platforms, local data copies and the capabilities to run performant analytics across each global point of presence. Architecture needs to be inverted to a data-centric architecture deployed at points of presence in neutral, multi-tenant datacenters to integrate private and public data sources.
Fig. 16. Data Gravity Index, Sept. 2020
About Foreword Introduction Forecasts IMPLICATIONS Methodology
Data Gravity Index DGx™ I digitalrealty.com ©2020 Digital Realty Trust®, Inc. 20
Data GravityIndex™

Implication #2 – Requires a Connected Community Approach Data Gravity requires a connected community approach between enterprises, connectivity, cloud and content providers. This approach integrates core, cloud and edge at centers of data exchange, implementing a secure, data-centric hybrid IT architecture at Global Enterprise points of business presence deployed in multi-tenant datacenters.
CLOUD INTERCONNECTION MULTI-TENANT DATACENTERS DISTRIBUTION POINTS OF PRESENCE
APPLICATIONS, PLATFORMS & CAPACITY
IN THECLOUD
Centers of Data
Exchange
CONNECTED DATA COMMUNITIES
AT THE EDGE
USERS, DEVICES, THINGS
Fig. 17. Data Gravity Index, Sept. 2020
ADD NEWMARKETS
EVOLVE ON-RAMPS
BUILD HYBRID OFFERINGS
REWIRE THE NETWORK
OPTIMIZE DATA EXCHANGE
IMPLEMENT HYBRID CONTROLS
BUILD HYBRID NETWORK OFFERINGS
ADD NEW MANAGEDSERVICES
ADD NEWPOINTS OF PRESENCE
CLOUD & CONTENT PROVIDERS ENTERPRISES CONNECTIVITY PROVIDERS
USE CASES
About Foreword Introduction Forecasts IMPLICATIONS Methodology
Data Gravity Index DGx™ I digitalrealty.com ©2020 Digital Realty Trust®, Inc. 21
Data GravityIndex™

Methodology22
About Foreword Introduction Forecasts Implications METHODOLOGY
Data Gravity Index DGx™ I digitalrealty.com ©2020 Digital Realty Trust®, Inc. 22
Data GravityIndex™

Data Gravity Index DGx™ implements a patent-pending formula which quantifies and predicts the continuous creation of data across 21 metros globally.
Analyzing Thousands of AttributesThe Data Gravity Index methodology is based on the analysis of thousands of attributes of Global 2000 Enterprise companies’ presences in each metro, along with variables for each metro, including GDP, population, number of employees, technographics, IT spend, average bandwidth and latency, as well as flows of data.
Solving for Data Mass and Data ActivityThe size and attraction of data for each metro was created by solving for a Data Mass number and a Data Activity number. The result was then multiplied by the average Bandwidth and divided by the average Latency squared.
Calculating Data Gravity Between MetrosThe Data Gravity between metros was calculated by adding Data Masses together and adding the Data Activity numbers together, then multiplying their product by Bandwidth and dividing the result by the Latency squared between metros.
Calculating the Enterprise Data Creation LifecycleData Creation was calculated by combining data created by both G2000 Enterprise employees and end points.
Data Processing was calculated by analyzing G2000 Enterprise IT processing needs to handle new data-centric workloads, such as AI & ML, analytics, costs per TFLOPs and other factors.
Data Storage was calculated by taking the storage capacity, growth and annual rate of deployment of Enterprise storage (HDD, SSD, and Tape) and analyzing across 21 metros.
MethodologyThe system for measuring Data Gravity for the Global 2000 Enterprises
Data Mass The estimated volume of data stored in a metro over a period of time.
Data Activity The estimated amount of data movement and interactions in a metro over a period of time.
Bandwidth The average amount of bandwidth available in a metro or between two metros.
Latency The average latency between all metros and a single metro or between two specific metros.
Development of Data Gravity Index referenced and/or considered various data sources, including HG Insights, Intricately, Synergy Research Group, Telegeography, PeeringDB, WonderNetworks , Dotcom-Monitor, Organization for Economic Co-Operation and Development, Wikipedia, Google Maps, Worldometer, US. Census, DataUS.io, IDC, 451 Research, Gartner, McKinsey, PWC, Accenture, World Economic Forum and United Nations.
23
About Foreword Introduction Forecasts Implications METHODOLOGY
Data Gravity Index DGx™ I digitalrealty.com ©2020 Digital Realty Trust®, Inc. 23
Data GravityIndex™
About Foreword Introduction Forecasts Implications METHODOLOGY

Pervasive Datacenter Architecture (PDx™) Library• PDx Methodology
• Blueprints
• Design Guides
• Solution Briefs
DigitalRealty.com/PDx-Library
Explore this new megatrend, and see how the explosion of data growth globally forces a shift to a new data-centric hybrid IT architecture. If you have any questions or want to learn more about this industry-first report, email [email protected]
Data Gravity Insights Hub• Insights
• Videos
• Virtual Events
• Visualization Tools
• New Releases
DigitalRealty.com/Data-Gravity-Index
Digital Realty supports the world’s leading enterprises and service providers by delivering the full spectrum of data center, colocation and interconnection solutions. PlatformDIGITAL®, the company’s global data center platform, provides customers a trusted foundation and proven Pervasive Datacenter Architecture PDx™ solution methodology for scaling digital business and efficiently managing data gravity challenges. Digital Realty’s global data center footprint gives customers access to the connected communities that matter to them with 280 facilities in 47 metros across 22 countries on six continents. To learn more about Digital Realty, please visit digitalrealty.com or follow us on LinkedIn and Twitter.
Learn MoreUnlock New Capabilities to Manage the Effects of Data Gravity
Contact Us
US & SA +1 877 378 3282
APAC +65 65053900
EU - London +44 (0)207 954 9100
EU - Amsterdam +31 (0)88 678 90 90 EU - Frankfurt +49 (0) 69 6640 8040
Email [email protected]
Data GravityIndex™
About Foreword Introduction Forecasts Implications Methodology
Data Gravity Index DGx™ I digitalrealty.com ©2020 Digital Realty Trust®, Inc. 24
Data GravityIndex™

DISCLAIMERThe content herein and services by Digital Realty are provided to you on an “As Is” and “As Available” basis, except as set forth in a definitive agreement between you and Digital Realty. Except as expressly provided, to the full extent permissible by law, Digital Realty disclaims all representations and warranties of any kind, express or implied, including, without limitation, and implied warranties of merchantability and fitness for a particular purpose. To the full extent permissible by law, Digital Realty will not be liable for any damages of any kind, including, any loss of profits, loss of use, business interruption, or indirect, special, incidental, consequential, or punitive damages of any kind in connection with services, content, products or any other information provided or otherwise made available to you by Digital Realty.
The content herein contains statements about Data Gravity Index™ which are based on current internal expectations, forecasts and assumptions that involve risks and uncertainties that are subject to change and that could cause actual outcomes and results to differ materially, including changes to the input sources and other macro trends. No representations or warranties are made by Digital Realty or any of its affiliates as to the accuracy or likelihood of success of individual elements of the Data Gravity Index or any statements or projections related thereto. Whether or not any such strategies or projections are in fact achieved will depend upon future events which are not guaranteed, some of which are not within the control of Digital Realty.
Data Gravity Index DGx™ ©2020 Digital Realty Trust®, Inc
®