data informed quality management: towards evidence …
TRANSCRIPT

DATA INFORMED QUALITY MANAGEMENT: Towards Evidence-Based Practise
Magana Silas Mwangi
Department of Management & Organization
Hanken School of Economics
Vasa
2020


ACKNOWLEDGEMENT
First, I am grateful to the Almighty God for giving me the strength and blessing to be able to
complete this thesis successfully.
I wish to sincerely thank Mikko Lehtola the Quality Manager at the case company for giving
me the opportunity to write this thesis for a real case in a global company. His door was always
open and steered me in the right direction whenever he thought I needed it. He also allowed
this thesis to be my work.
I would also like to thank the case company for giving me a real business case to work on for
my thesis. Particularly, I would like to thank the Vaasa quality team for agreeing to participate
and provide input for this study. If it were not for them, this study would not have been
successfully conducted.
I would like to acknowledge my thesis supervisor Dr. Ashkan Fredstrom at Hanken
University. He provided invaluable support for the technical and academic part of this thesis
and I am gratefully indebted to his valuable support, comments, and feedback. Also, I would
like to appreciate Hanken University for the opportunity to learn, grow, and reach this
milestone in my life.
Finally, I must express gratitude to my family and friends for all their support and continuous
encouragement throughout my study and through the process of researching and writing this
thesis. I especially thank my former lecturer from Novia Hanna Latva, for helping me with
the final draft and proofreading my thesis. This accomplishment would not have been
possible without you all. Thank you!
Magana Silas Mwangi

i
HANKEN SCHOOL OF ECONOMICS
Department of:
Management and Organization
Type of work:
Master’s Thesis
Author: Magana Silas Mwangi Date: 9/12/2020
Title of thesis:
DATA INFORMED QUALITY MANAGEMENT: Towards Evidence-Based Practise
Abstract: This thesis investigates the potential of integrating data analytics into quality
management to provide a more accurate analysis of quality issues. The case company
is a global leader in smart technologies and complete life cycle solutions for both
marine and energy markets. Although data has been utilized for decades, the true
potential of data is starting to be understood with the development of new tools and
technologies to leverage data. With this new insight, there is interest in understanding
the potential in the data available and exploring the most suitable approaches in
creating value from it.
The study seeks to answer these questions and explore in an organizational context the
implications of adopting such an approach through both literature review and
empirically by action research. The action research strategy was chosen since it most
accurately defined the research environment. Furthermore, it justified many aspects of
the study such as the ethical considerations and ease of access to information. The
literature review covers Quality management and tackles the practical side of analytics
and how it can be integrated into evidence-based decision-making. The analysis
incorporates the data from the company as well as multiple sources including
interviews from meetings and results from the actual analysis. The different data
sources are analysed in a cyclic manner which is characteristic of action research. This
approach enhances the validity and reliability of the analysis.
In the findings, the adoption of analytics in quality management is presented as well as
some issues that arise from such an analysis. Moreover, I also identify some of the
challenges and opportunities present with the approach adopted from this study. The
key findings are that it would be beneficial to adopt analytics for quality management
to enable quality managers to make better decisions. Furthermore, data quality could
also be a new focus area for quality teams to improve data collection. Developing such
an approach in the future requires quality managers to work closely with the business
managers to create well-defined business challenges.
Keywords: Quality management, Analytics, Decision making, Action research,
Project-based organization

ii
CONTENTS
1 INTRODUCTION ....................................................................................................... 1
1.1 Research aim ...................................................................................................... 2
1.2 Research questions ............................................................................................ 2
1.3 Structure of the thesis ........................................................................................ 3
1.4 Delimitation ....................................................................................................... 4
2 CASE COMPANY BACKGROUND............................................................................ 5
2.1 NC Management ................................................................................................ 5
2.2 Business challenge ..............................................................................................7
3 LITERATURE REVIEW ............................................................................................ 9
3.1 Quality management .......................................................................................... 9
3.1.1 Quality Management development ...........................................................10
3.1.2 Nonconformity management .................................................................... 13
3.1.3 Quality management in project-based industries ..................................... 16
3.2 Knowledge Discovery ........................................................................................ 18
3.2.1 Knowledge Discovery in Database (KDD) ................................................. 18
3.2.2 Pareto solutions ......................................................................................... 19
3.2.3 Practical NC management example .......................................................... 21
3.3 Evidence-Based Decision Making ................................................................... 23
3.4 Constructed Framework .................................................................................. 25
4 RESEARCH METHODOLOGY .............................................................................. 27
4.1 Research Strategy ............................................................................................ 27
4.2 Action Research ............................................................................................... 28
4.2.1 Purpose and Rationale of the Research .................................................... 28
4.2.2 Research setting ....................................................................................... 29
4.3 Method ............................................................................................................. 30
4.3.1 Action Research Cycle 1 (Analysis I) ........................................................ 32
4.3.2 Action Research Cycle 2 (Analysis II) ...................................................... 33
iii
4.3.3 Action Research Cycle 3 (Analysis III) ..................................................... 34
4.4 Data collection ................................................................................................. 35
4.4.1 Data Collection (AR 1) .............................................................................. 36
4.4.2 Data Collection (AR 2) .............................................................................. 38
4.4.3 Data Collection (AR 3) .............................................................................. 40
4.5 Analysis strategy ............................................................................................... 41
5 RESULTS ................................................................................................................ 44
5.1 Record .............................................................................................................. 44
5.2 Classify ............................................................................................................. 48
5.3 Plan, perform and Verify .................................................................................. 51
5.4 Close ................................................................................................................. 52
5.5 Survey results ................................................................................................... 53
5.6 Summary of findings........................................................................................ 56
6 DISCUSSION ........................................................................................................... 57
6.1 Findings linked to theory and previous studies ................................................ 57
6.1.1 Features of Quality Management and business implications (RsQ1) ....... 57
6.1.2 Theoretical framework for adoption of data analytics (RsQ2).................. 57
6.1.3 Factors affecting adoption of data analytics (RsQ3) ................................ 58
6.1.3.1 Challenges for data analytics adoption ................................................. 58
6.1.3.2 Support for data analytics adoption ..................................................... 62
6.2 Method discussion .............................................................................................. 66
6.2.1 Action research ......................................................................................... 66
6.2.2 Weaknesses and uncertainties ................................................................. 67
7 CONCLUSION ........................................................................................................ 69
7.1 Conclusions from findings .................................................................................. 69
7.2 Recommendations and future research ............................................................. 70
7.3 Final Remarks ..................................................................................................... 71
REFERENCES ................................................................................................................ 74

iv
APPENDICES
Appendix 1 ...................................................................................................................... 72
Appendix 2 ...................................................................................................................... 73
TABLES
Table 1: Summary of literature utilizing AHP in QM (Donauer, et al., 2014) ................ 20
Table 2: Data collection for AR1 ..................................................................................... 37
Table 3: Data collection for AR2 .................................................................................... 39
Table 4: Summary of the QI data ................................................................................... 45
Table 5: Conrod centre defects based on location and defect type ................................ 48
Table 6: Frequency related attributes for the matrix X- Axis ........................................ 50
Table 7: Frequency related attributes for the matrix Y- Axis ......................................... 50
Table 8: Summary of survey issues. ............................................................................... 53
FIGURES
Figure 1: The thesis outline and how it relates to the research question ......................... 3
Figure 2: General NC process ........................................................................................... 6
Figure 3: NC categories and notification types ................................................................ 6
Figure 4: QM development stages (Hansson & Klefsjö, 2003) ....................................... 11
Figure 5: QM tools, values and techniques (Hansson & Klefsjö, 2003)......................... 12
Figure 6: QMS driving continuous improvement (J.Berk & S.Berk, 2000) ................... 14
Figure 7: Frequency-based vs cost-based Pareto charts ................................................. 16
Figure 8: KDD process (Fayyad, et al., 1996) .................................................................. 19
Figure 9: KDD during NC analysis ................................................................................. 22
Figure 10: Analysis including DM preferences .............................................................. 22
Figure 11: Conceptualization of evidence-based practice (Adopted from Barends, et al.,
2014) ............................................................................................................................... 24
Figure 12: Conceptual framework for improved NC management using evidence-based
approach ......................................................................................................................... 26
Figure 13: Action research cycles .................................................................................... 31
Figure 14: Example of an observation box for including observational data ................. 35
Figure 15: Analysis strategy for this study ...................................................................... 42

v
Figure 16: Field values example of QI data .................................................................... 45
Figure 17: CRISP-DM process (Larose & Larose, 2015, p. 7) ......................................... 46
Figure 18: QI data grouped by risk level ........................................................................ 47
Figure 19: Pareto for top 8 issues in Conrod WorkCentre ............................................. 49
Figure 20: Conrod WorkCentre NC Matrix ..................................................................... 51
Figure 21: Response from the survey regarding ease of use for SAP and catalogue ..... 54
Figure 22: Response from the survey regarding data input for QI notifications ........... 54
Figure 23: Response from the survey regarding data reliability for QI notifications .... 55

vi
LIST OF ABBREVIATIONS
QM Quality Management
QA Quality Assurance
QMS Quality Management System
NC Non-Conformity
DM Decision Maker
INC Internal Non-Conformity
ERP Enterprise Resource Planning
AR Action Research
ISO International Organization for Standardization
ETO Engineer – To – Order
KD Knowledge Discovery
KDD Knowledge Discovery in Database
MOO Multi-Objective Optimization
FMEA Failure Mode Effect Analysis
RPN Risk Priority Number
EBDM Evidence-based decision making
EBMgt Evidence-based management
AR Action Research

1
1 INTRODUCTION
“In God we Trust, all others bring data”1. With the advent of technology and other
disruptive innovations such as automation, Internet of Things (IoT), Artificial
Intelligence (AI), and Big data, there is a shift in business practices towards digitization
(Schwab, 2016). This has been christened as the fourth industrial revolution or “Industry
4.0” a term which first was used at Hannover Messe in 2011 by Professor Wolfgang
Wahlster (Director and CEO of the German Research Centre for AI) while addressing the
audience (Lydon, 2014).
Businesses are increasingly under mounting pressure due to global competition and the
ever-changing markets and customer demands. This is compounded by the complexity
of the value chain as well as stricter regulations and demand for shorter lead times.
Organizations ought to proactively seek opportunities that would leverage their strategic
abilities, improve all areas of their business, and develop on their current successes. This
is applicable throughout the organization including quality management (QM). It is
perceived that currently, most quality management teams are tackling issues such as
inefficiencies due to sub-optimized systems, manual metric calculations, lack of cross-
functional ownership, ineffective supplier communication among others (Jacob, 2017).
The new technologies have proven to be able to leverage data to increase productivity
and efficiency, especially in the manufacturing industry. However, it is seen both in
practice and academic fields that quality management and digital innovation are
developed separately. Therefore, questions are being raised around the industry 4.0 hype
such as what digitization means for companies, what is the current state of digitizing
among companies, what technologies can be adapted to drive the change towards
industry 4.0, what is the cost of the changes, and what are the risks?
This study aims to review the data utilization by the quality department in a case
company and develop a proof of concept for the potential and possible adoption of data
analytics technology that could utilize the currently collected data.
1 Associated with W. Edward Deming although it was published in 1986 in the book “The Deming Management Method” by Mary Walton. No one was given credit for the quote. Edwin R. Fisher while addressing a subcommittee of the U.S house of Representatives stated the saying was already cliché in 1978.
2
1.1 Research aim
This research aims to assist the case company to evaluate and improve the utilization of
data in the quality department. In this study, the focus will be on the Internal Non-
Conformity (INC) data collected in the Enterprise Resource Planning (ERP) system. The
idea is to experiment on different data analytics technologies to explore other uses of the
data beyond the current usage which is following up the cost of non-conformities(NCs)
and the number of unresolved issues that go beyond six months.
1.2 Research questions
To fulfil its aim, the study will seek to address the potential of utilizing available data by
experimenting with data analytics. The experiments will explore the possibilities of
discovering new insights or observing emergent trends that could be of interest in a
quality management context. The thesis is based on one main research question:
RQ: Can data analytics be incorporated in quality management and will
this lead to an improvement in nonconformity management?
The main research question encompasses a complex issue about utilizing data analytics
in a specific context and the business implication it could potentially have. To determine
the influence of data analytics on QM, it is vital to understand QM characteristics as well
as the specific context of the application. Furthermore, it is important to capture the
organization conditions that create the enabling environment and subsequently analyse
both supporting and impeding factors for the implementation of data-driven QM.
To address these emergent issues from the research question and align the study towards
answering the research questions, it is divided into four concrete subsections. Each
subsection contributes to answering the main research question as follows:
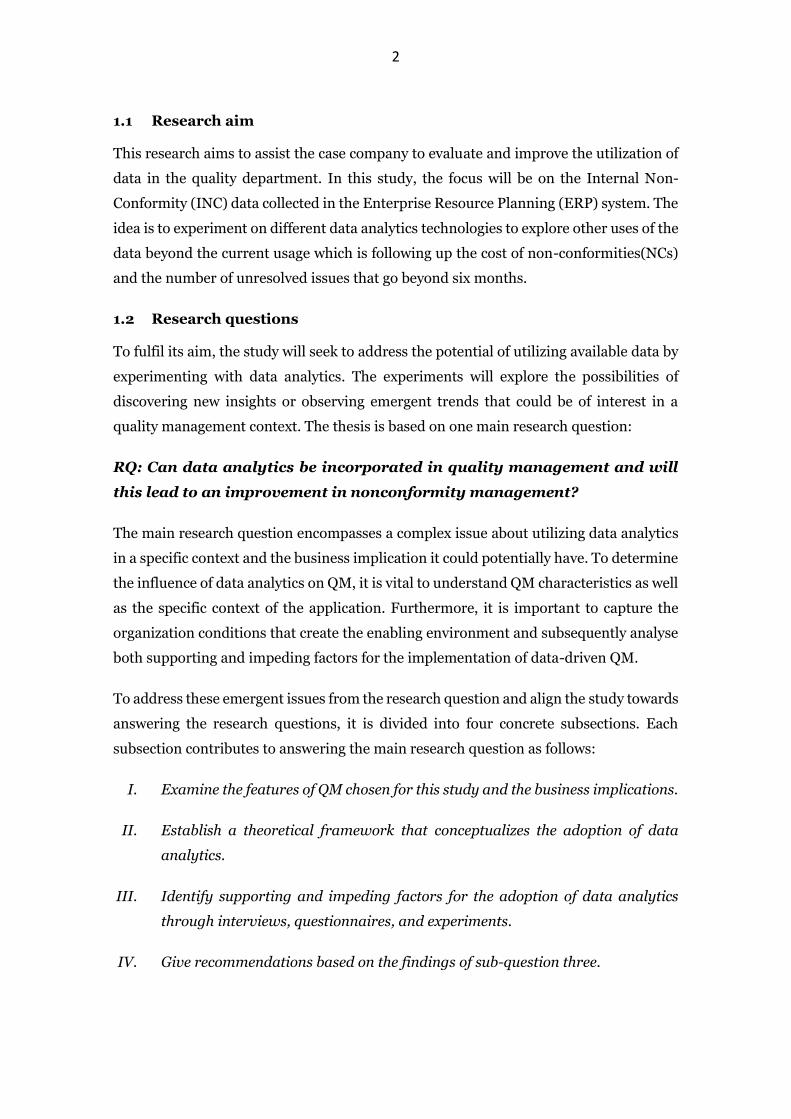
I. Examine the features of QM chosen for this study and the business implications.
II. Establish a theoretical framework that conceptualizes the adoption of data
analytics.
III. Identify supporting and impeding factors for the adoption of data analytics
through interviews, questionnaires, and experiments.
IV. Give recommendations based on the findings of sub-question three.

3
These research sub-questions are used as guidelines for the study and are answered
throughout the thesis.
1.3 Structure of the thesis
The thesis is structured into seven chapters with the first introducing the study. Chapter
2 describes the setting of the case company and introduces the need for this study.
Chapter 3 reviews the literature relating to the relevant topics covered in the thesis
including QM, NC management, and evidence-based decision-making to give a theoretic
understanding of the thesis. Chapters 4 covers the research methods chosen and the
justification for choosing the methods. Chapter 5 provides a summary of the key findings
from the empirical part of the study. Chapter 6 gives a detailed analysis of the key
findings as well as a presentation of the results in their full form. Finally, Chapter 7
concludes the research by providing theoretical and managerial contributions as well as
recommendations for future research as depicted in Figure 1 below.
Figure 1: The thesis outline and how it relates to the research question

4
1.4 Delimitation
The first delimitation of this research is the focus on non-conformity (NC) management
which is a sub-function of QM. Although the study will utilize data analytics technologies,
the study is not focusing on the technological aspect of the phenomenon. However, data
analytics technology will be used to generate results that will be utilized in the study. This
means there will not be a detailed explanation as to how the results were obtained but
the focus will be on the utilization of the results. Additionally, the study does not explore
the potential of data analytics for other business functions such as accounting or finance.
The second research delimitation concerns the approach to the topic. This study will
address the subject from a business perspective only. Although the study diverges into
the technology realm, any technical analysis is solely for contextualization hence there
will not be an exhaustive coverage of the technologies used for this study. The technical
aspects of this research are mostly utilized in the action research (AR) project stage of
the study and the choice of technology was determined by AR leaders. Furthermore, the
study is targeting business managers and managerial students hence the need to focus
more on the business than the technological aspect.
The final research delimitation was the scope of this study. Since the study was action
research (AR) for an international organization, the focus was only on the unit worked
on during the project phase of the action research. This localization means the data
analytics capabilities were not tested on other quality units. Furthermore, due to the
sheer size and function of the quality department, the focus was narrowed down to
internal non-conformity (INC) management which is part of QM. This was done to
enable the possibility of testing the results for the action research part of the project in a
limited time frame.

5
2 CASE COMPANY BACKGROUND
The case company is an international company that is a global leader in smart
technologies and complete lifecycle solutions in both marine and energy markets. Among
their offering, they design and produce engines of different capacities operating on a
variation of fuel. The company has several production facilities which assemble the
engines. Each assembly plant has its quality team, and this thesis focuses on one of the
teams.
This company places a high premium on quality. Their quality ambition is not to “accept,
create or pass - on any quality defects” and delivering reliable products while assuring
dependability. Moreover, they are ISO certified meaning they have a sound QM system.
From both the ISO standard and the company management viewpoint, NC issues are
viewed as improvement areas since it is very unlikely to have no issues, especially in a
complex manufacturing environment. The NC could be in a service, product, process,
supplier goods, or in the management system itself. These are identified through
customer complaints, internal audits, external audits, inspection either from incoming
material or at the factory or during testing. This study will focus on product NCs at the
factory during production.
Targeting NC is part of an ambitious plan called the “NC cost down program”. This
program aims to satisfy customers, ensure proper corrective actions are implemented
which will lead to a reduction of NC costs. This will ultimately lead the company to both
improving customer satisfaction and achieving its profitability goal. The plan is
sponsored by the Board of Management and overseen by a cross-business Steering
Committee.
2.1 NC Management
There is a general process for managing NCs which is common to all the business units
which are depicted in Figure 2 below. These steps are prescribed in the internal directive
on MS nonconformity:
I. Record – the NC report should be generated in SAP as a notification or as a report
if SAP is not implemented. The notification should contain the appropriate
notification information such as type, date, defect location, costs, etc.
Furthermore, it should contain information of interested parties i.e. (creator,
resolution owner)

6
II. Classify - the NC risk should be estimated and included in the NC report based
on guidelines on risk assignment. The severity is R1 indicating most severe to R4
which is least severe.
III. Plan, Perform, Verify – This involves initiating immediate corrections followed
by Root Cause Analysis (RCA) and Corrective and Preventive Action (CAPA). For
R1 and R2 NC, an RCA is mandatory.
IV. Close – After carrying out all the necessary measures and actions according to
the directive then the NC is closed.
Figure 2: General NC process
The NCs are categorized based on four main stages of the project which are internal
notifications, NBH (after production, before hand over), Warranty claims, and post-
warranty claims. These different stages yield a variation of the NCs produced as depicted
in Figure 3 below.
Figure 3: NC categories and notification types

7
For example, supplier-related issues are labelled as QE whereas internal production
issues are labelled QI. Typically, as the project proceeds, the more complex and costlier
the NC becomes.
To reduce the NC cost, it is important to have effective systems for monitoring and
correcting deviations at the earliest instance of occurrence. As can be seen in Figure 3,
the best place to manage NC is the INC which occurs during the production process.
However, in a complex manufacturing setting, the chances of deviations occurring at this
phase are quite high. It is important to understand the nature of the NC to develop
concrete actions that lead to timely identification of deviations that need corrections and
those that require corrective actions.
The relevant INC for this thesis is QI. The QI contains information about:
I. Defect location code – where we have nonconformity.
II. Defect type/damage code – which phase the nonconformity happens/ what
kind of estimated damage cause.
III. Cause code – why we have nonconformity.
IV. Priority – which is the risk category related to nonconformity.
V. Roles and responsibilities – who takes care of creating, following up, and
assigned tasks relating to the notification.
This data contains valuable information that can be used by the quality team to follow
up on issues and help in understanding the nature of deviations. Furthermore, it can be
used in prioritizing corrective action initiatives thus reducing issues arising in the
production line.
2.2 Business challenge
As mentioned previously, as products move along the production line the cost of fixing
the issue grows exponentially. One example given during a factory visit was the
tightening of pipes. If an assembly line worker forgets to tighten an oil pipe, it will not be
noticed until the final testing. During the testing, the high pressure leads to leakage of
the oil and this could trigger other component failures. Such situations require
investigation to understand why the pipe was not tightened since it could be an accident,
design issue, tool issue, or carelessness. Faults that occur during testing tend to be more

8
expensive than faults corrected on the shop floor. Hence, the need to develop a
system/tool to improve NC management.
Currently, these notifications are part of the Key Performance Indicators (KPI’s)
followed up by the quality team. The current metrics measurable is NC cost as a
percentage of sales, cost of nonconformity (M€), and the number of NC notifications
open over 6 months. Furthermore, the data is used by the quality team in investigating
the nature of the deviations to determine the appropriate actions since not all issues
require a detailed investigation. The data utilized is stored in the SAP data warehouse.
The quality team has been experiencing challenges in analysing the notification data
beyond trending for the KPIs.
One issue identified was the generation of the notification. The production line has an
internal IT system where issues are recorded from the shop floor. This system is
independent of the ERP system which is utilized by the whole organization including the
QM team and the management. However, if there is a need to allocate the cost of the
deviation it is then manually filled in by the quality inspectors. This implies the data in
the ERP system is a snippet of the data at the production site. Such data cannot give a
full picture of the issues occurring at the production hence impeding a holistic approach
to solving quality issues. This has been highlighted as a major barrier in capturing value
from data and analytics (McKinsey Global Institute & McKinsey Analytics, 2016).
Another issue identified was the challenge of analysing the data. The SAP contains a
standardized and global catalogue used by the company. The catalogue manages to
capture most components although, there are still site-specific details that cannot be
implemented. In some instances, it contains very general terms such as “any manpower”
or “any material missing” which cannot yield useful information when analysing the
data. The current challenge with analysis of the data is drilling down to common issues
since most of the time it ends up with the generic terms. Finally, the number of INC was
quite large and the variability quite high. Coupled with the analysis challenge, the
utilization of data analytics became a viable option to test.
It is with this backdrop that this thesis was commissioned by the quality manager. There
is growing pressure on companies to leverage their data to improve profitability as well
as make more factual based decisions. Reports such as (McKinsey Global Institute &
McKinsey Analytics, 2016) highlight that data has become a critical asset in this age of
data and analytics.

9
3 LITERATURE REVIEW
This section sets the backdrop to the research subject through a literature review of
theory on QM improvement from both a technical and managerial view. The first
subchapter tackles the fundamental principles of quality and lays the foundation of NC
management in QM. The subsequent subchapter addresses the data analysis,
highlighting how it could be utilized in a quality management context. Then we address
how this approach to quality can be adopted using managerial lenses. In this context, we
analyse the role of management and how they can implement a successful NC
management improvement which could ultimately lead to lower quality cost. The
significance of lower quality cost could potentially lead to higher customer satisfaction
and better financial performance which is a win-win situation. Finally, a constructed
framework that combines all these ideas into a concrete action plan is utilized in the
empirical part of the research.
3.1 Quality management
QM is a significant research field for researchers as well as business managers. Although
QM has been in management literature for the past three decades, the movement has
been long in existence. Despite the wide coverage of the topic, a common consensus lacks
on the definition of quality due to the multidimensional nature of the phenomenon. For
example, quality has been defined as either Value, Conformance to specifications,
Conformance to requirements, Fitness for use, Loss avoidance, or meeting and/or
exceeding customers' expectations. These divergent views all address the same issue
hence the need to establish a common understanding of the phenomena is a key issue
before analysing it (Reeves & Bednar, 1994; Garvin, 1984).
Garvin (1984) demonstrates the lack of consensus by highlighting the difference in
opinion from four different disciplines; philosophy, economics, marketing and
operations management. He argues philosophy has focused on definitional issues;
economics on profit maximization and market equilibrium; marketing on customer
satisfaction and operations management on engineering processes and manufacturing
control. This has led to variation in the research since different disciplines contain
different perspectives, frameworks, models, and terminology. However, Garvin (1984)
also noted convergent themes emerging from these different perspectives. He identified
these themes as transcendent, manufacturing-based, product-based, user-based, and
value-based approaches (Garvin, 1984). Moreover, there are also common terminologies
used concerning QM such as quality control, quality assurance, total quality control, and

10
total QM (Hassan, et al., 2000). To understand this phenomenon, there is a need to
understand the origins and development of the concept.
3.1.1 Quality Management development
Quality as a phenomenon is complex and contextual as noted in the previous subchapter
on QM. Hence the clarification of the definition gives the reader a good understanding
of quality in the context of this study. A somewhat convergent definition of quality is “all
activities of the overall management function that determine the quality policy,
objectives, and responsibilities, and implement them by means such as quality planning,
quality control, quality assurance and quality improvement within the quality system”
(ISO, 2005).
The practices and strategy of quality in manufacturing have evolved through different
stages. At inception quality started from an inspection-oriented form with a focus on
product, however, nowadays it has taken a more strategic position and is seen as a driver
to competitive advantage (Feigenbaum, 1951; Rui & Voss, 2002; Karmarkar & Pitbladdo,
1997). To understand its development, it is beneficial to briefly review its evolution from
inspection, through quality control, quality assurance to the current practices. These
phases are referred to as “quality eras” (Garvin, 1988, pp. 12-14).
The first identified form of a quality system is believed to have been during the
construction of the pyramid. Evidence of the systematic use of tools as well as supporting
evidence from archaeological findings further support this claim (Weckenmann, et al.,
2015). Since then, there was slow development until the development of four distinct
eras as can be seen in Figure 4. According to Albert, et al. (2015), the first era was marked
with inspection whereby specialists would inspect quality into the product. This was
based on the industrial revolution whereby the focus was on the conformance of
products. However, the downside was the high internal cost which ushered in the second
era of process control.
This era was credited to Walter Shewhart who published a book called ‘Economic Control
of Quality of Manufactured Product’ and created a control chart. He proposed the use of
sampling inspection over 100% inspection to make inspection more efficient and cost-
effective. This was done using the control chart to monitor the quality performance of
the process and sampling of the products to be inspected. The use of statistical tools led
to this era being called “statistical process control” (SPC) or “statistical quality control”
(SQC) (Weckenmann, et al., 2015). Another tool introduced during this era was the

11
Design of Experiment (DOE) which was established to improve the process. This tool is
usually used by R&D and requires specialized knowledge (Garvin, 1988; Albert, et al.,
2015). The main difference between inspection and quality control was the shift of focus
from the product to the process.
Figure 4: QM development stages (Hansson & Klefsjö, 2003)
The third era is quality assurance which broadened the perspective on quality from
manufacturing-based to managerial implications. It shifted from detection and reaction
towards reactive measures to prevent defects. It was initiated from defence industries,
but it permeated into the private sector especially large industrial companies. Other
concepts introduced during this era include standards, measuring the cost of quality,
total quality control, reliability engineering, and zero defects. The major contributions in
this era were from Japan and the USA (Josephine & Wilkinson, 2002).
The final era is the Total Quality Management (TQM) era which involved the application
of QM principles throughout the organization. This era brought about system thinking
and a holistic approach towards QM. This era saw the institutionalization of TQM, ISO
9000 system, and Six-Sigma. These quality approaches expanded the stakeholders
beyond the customers as well as entrench management involvement in matters of
quality. Furthermore, QM is perceived as a continuously evolving management system
consisting of values, techniques, and tools as can be seen in Figure 5. The technique and
tools in the example below are not exhaustive since the system keeps developing and
differences in industries account for the development and adoption of different tools
(Hansson & Klefsjö, 2003).
Currently, QM development is facing challenges due to globalization and complexity in
requirements. Customer requirements have gone beyond the product to include issues

12
such as sustainability and social responsibility. Furthermore, global collaboration in
supply, purchasing, development, and manufacturing increases the complexity of the
operating environment. It is argued to tackle these mounting challenges, there is a need
to focus on three key areas namely, addressing the perceived quality, target human-
focused development to ensure the success of improvement initiatives, and utilizing
technologies to develop intelligent Quality Management Systems(QMS) (Weckenmann,
et al., 2015).
Figure 5: QM tools, values and techniques (Hansson & Klefsjö, 2003)
The internet is awash with speculation on the future of QM which will be ushered in by
the ‘4th industrial revolution’ which is currently taking shape. The key emphasis is on
predictive based QM through leveraging technology. This is evident in the revised ISO
9001 standard which has changed from preventive action towards a risk-based approach.
This standard also introduces concepts such as knowledge management and evidence-
based decision making which takes into consideration the organizational context and
stakeholders (Fonseca, 2015).
One of the functions of a QMS is the management of NCs. NC management is mainly
geared towards reducing the cost of quality. In manufacturing, the quality depends on
the input such as materials, and the processes that the input material undergoes to give
a product. Both materials and processes need to be controlled to reduce the risk of NC
occurrence. From a firm perspective, this is important since it has cost implications that
affect its overall financial performance. The different NCs are treated differently
depending on their nature. The supplier NCs are different from product NCs. For the
product NCs, the point of detection matters. For example, if it happens during

13
production it is an internal NC whereas if it is detected by the customer during use it
becomes a warranty claim. Hence, it is vital to understand the NC management process
in any given setting before embarking on a quality improvement program to reduce
quality costs.
3.1.2 Nonconformity management
NC is defined as the “non-fulfilment of a requirement” (ISO, 2005). The requirement can
be a need, expectation, or obligation which is stated or implied. There are many types of
requirements within an organization for example customer requirements, management
requirements, product requirements, and legal requirements. Failure to meet any of
these requirements results in nonconformity (Hoyle, 2001). When a product NC occurs,
it must be identified and controlled to avoid delivery and unintended use. A product NC
is one that fails specified customer requirements, intended usage requirements, stated
or implied needs, organizations requirements, or customer expectations. Managing NC
is an integral part of the QMS system. The NC management has a process-based
approach although the actions taken to resolve the NC may differ between organizations.
In a QMS there are two broad approaches to manage NC namely corrective action (CA)
and preventive action (PA). Furthermore, CA could be broken down further in
corrections and corrective actions. Although the terms might sound confusing,
corrections are remedial actions that only fix NCs whereas CA prevents NCs from
happening. However, CA is only applicable where the NC has occurred whereas PA is
based on potential NCs that have not occurred (Hoyle, 2001).
High technology manufacturing environments create unique challenges to QM due to
the complexity of the products. QM in this sector places emphasis on customer focus,
continuous improvement, defect prevention, and recognizing responsibility for quality is
shared by all (J.Berk & S.Berk, 2000). Quality is defined as “the ability to meet or exceed
customer requirements and expectations” (J.Berk & S.Berk, 2000, p. 4). In this setting,
NC’s arise due to variations, hence variability reduction leads to improved quality. NCM
in this sector is very important since failure to manage it leads to reworks and repair
which increases the cost of production and lower productivity. Berk (2000) argues that
from a production perspective, quality should be measured based on the quantity and
cost of NCs. Furthermore, value and quality are most efficiently improved through
measuring NC and “systematically attacking the dominant ones (J.Berk & S.Berk, 2000,
p. 23). An example of an NCM routine is depicted in Figure 6 below. The process begins

14
with identification and documenting the NCs, then collecting the data in a suitable
database followed by processing the data using different perspectives to efficiently
prioritize the corrective actions.
Figure 6: QMS driving continuous improvement (J.Berk & S.Berk, 2000)
The first step is the identification and recording of NC. This includes NCs discovered by
an inspector, item failure during testing, rejected items during purchasing, when
statistically controlled processes exceed the control limits, and warranty claims due to
customer dissatisfaction. These NCs are recorded in a document usually called NC report
(for our purpose we will refer to it as NC notification). The notification typically includes
a description of the item, type, cause, the action is taken (rework, repair, or scrapping),
where it happened, the involved parties (originator, responsible person, or resolution
owner). Although most companies have an NC reporting system, some NCs may not be
captured especially when there is no emphasis on documentation hence rework or
scraping is carried out on the shop floor without recording. Failure to document these
NCs leads to problems persisting without any way of carrying out any improvement
(J.Berk & S.Berk, 2000).
The next step is developing a database that allows the collection of the data in a format
that enables further analysis by parameters such as date, product or part, NC type, work
area, operator, or supervisor. The database should be developed to standardize the data
for accurate sorting and manipulation in the subsequent stages. Once the data is

15
captured, it is shared with the stakeholders i.e. business leaders, middle managers, and
workers. To effectively communicate the information, it must be converted into a format
that is easy to observe where the problem lies resulting to the knowledge discovery
(J.Berk & S.Berk, 2000).
This step involves selecting features from the quality database which effectively
communicate the state of the quality in an organization. The tabular data is not effective
in this case hence the use of graphical quality measurements is used. These include trend
lines, pie charts, and Pareto charts (first used by an Italian economist called Vilfredo
Pareto to highlight the principle of 80/20 where 80% of results are attributed to 20% of
the causes). According to Berk(2000), the important measurements which should be
extracted from the database are:
I. Summaries of NC quantities and costs – This consists of types and quantities of
NC and the number of NC notifications over time, Pareto charts containing the
same data from each reporting period, and Pareto charts with the same data
expressed in terms of cost.
II. Summaries of scrap, rework, and repair actions – Scraping in this context refers
to discarding an item and replacing it with a new one. Rework is any work done
to make an NC comply with drawing and specification requirements whereas
repair could refer to work done to make an NC comply with performance
requirements. Each category could be summarised with Pareto charts showing
items for each action by quantities and costs.
III. Summaries of supplier performance – developing a supplier rating system from
NC notifications related to supplier
IV. Summaries of product reliability- Pareto chart based on warranty data, repair
data, and customer feedback.
V. Summaries of what quality is costing the organization – Organization costs are
divided into three areas namely failure costs, appraisal cost, and preventive cost.
Failure costs are associated with correcting nonconformance. Typically, they
comprise the biggest share of the organization's total quality cost. Appraisal costs
are associated with defect detection. Preventive costs are associated with
activities that target the prevention of defects from occurring. These can be
summarised using a pie chart to show the share of different costs, a trending chart

16
for the different costs to see the direction the organization is moving, relative
trends (quality cost as a percentage of sales, rework and repair as a percentage of
labour, scrap as a percentage of material) and a Pareto chart showing the
dominant cost in each cost categories.
Figure 7 below shows examples of the visual representations that could form part of the
QMS reporting charts. The use of cost-based and frequency-based Pareto charts presents
managers with a visual representation of the distribution of issues and costs which aids
in making more informed prioritization decisions on where to apply corrective actions.
Figure 7: Frequency-based vs cost-based Pareto charts
However, this demonstration oversimplifies the complexity in high technology
manufacturing environments which are typically project-based or engineer-to-order
(ETO). The complexities introduced in such environments are discussed below.
3.1.3 Quality management in project-based industries
QM has been argued to be universally applicable to all organizations, this has been
reinforced by the emergence of awards such as the Malcolm Baldrige National Award
and the European Quality Award. However, challenges in implementation have led to
the emergent of two views. The supporters for a universal view on QM argue that
challenges are integral in moving an organization towards quality whereas the opponents
contend that these problems arise due to a mismatch between the proposed form of QM
and the organizational context. The latter view has not been adequately covered in QM
literature (Sousa & Voss, 2001). Furthermore, a universal approach to QM contradicts
the contingency approach which is strongly associated with existing management theory
(Dean & Bowen, 1994). The contingency perspective factors both the internal factors (e.g.
manufacturing strategies) and the external factors (e.g. customer requirements). Studies
investigating QM contingencies have uncovered many contextual variables such as

17
product complexity, organizational uncertainty, the timing of QM implementation,
maturity of QM program, etc (Sousa & Voss, 2001).
Current QM practices were developed during the era of mass production whereby the
products were less diverse and produced en masse. Although these practices can be
utilized in an ETO environment to identify the main cause of errors, they cannot
contribute to a structured improvement of quality. This is due to the nature of the
diversity of products in this environment whereby the errors depend on specific products
and there are interdependencies on the processes based on the complexity of the product.
These interdependencies obscure the aspect of quality throughout the value chain hence
it can only partially be explained by an effect chain (Ngo & Robert, 2016). For such
organizations, there are different approaches based on the organizational behaviour they
can use during the implementation of their manufacturing strategy:
I. Wait and see – This is a reactive approach.
II. Learn as you go – This is an incremental approach.
III. Predict and pre-empt – This is a proactive approach.
The first approach ‘wait and see’, is mainly dealing with issues as they arise. If issues
arise, the managers react by solving them otherwise nothing is done at all. This approach
has some short-term benefits of not incurring the unnecessary expenditure. However,
the firefighting mode has a detrimental effect in the long term for both the system and
the organization. The second approach ‘Learn as you go’ involves making gradual
changes to create ‘small wins’. This approach is versatile and could potentially create
momentum into building a strategic and systematic approach to improving quality. The
pitfall for this approach is the high dependency on effective communication and
feedback. If this fails, there is a probability of reverting to a reactive ‘wait and see’
approach. Finally, the ‘predict and pre-empt’ approach considers all the issues during
the planning process before they arise. This approach is suitable for organizations that
adopt a strategic approach to manage their business. The drawback is that it requires
investment in resources and takes time to implement (Storey, 1994). For an organization
to move from a reactive to a proactive approach, there is a need to create a ‘buy-in’ from
the management which requires a proof of concept. This proof of concept can be
implemented using the incremental approach. A potential opportunity for implementing
the incremental approach is in utilizing quality relevant data.

18
Companies nowadays have access to a large amount of data. Despite the availability, the
main challenge has been utilizing the data until recent developments in computer
science. These include data analytics, data mining, and knowledge discovery in data,
which have led to the creation of new value for data (Dominik, et al., 2018). The collection
and analysis of data to solve quality-related issues are viewed as an approach to quality
improvement with data mining and knowledge discovery in databases being successfully
deployed even in complex environments (Gülser, et al., 2011).
3.2 Knowledge Discovery
Knowledge discovery can be described as the ‘nontrivial’ process of discovering useful
knowledge from data. The term process implies there are many steps involved whereas
nontrivial means it involves the search of structure, models, patterns, or parameters
(Fayyad, et al., 1996). To understand the process in our context, we discuss it in detail in
the sub-section below.
3.2.1 Knowledge Discovery in Database (KDD)
The data-information-knowledge-wisdom hierarchy (DIKW) is the most used model in
defining these terminologies in information and knowledge management. It is used for
defining and contextualizing the relationship between the entities (Rowley, 2007).
According to Rowley (2007), data is a recorded activity or event and on its own, it lacks
meaning or value and is unorganized and unprocessed; information is processed data
that is meaningful and valuable and appropriate for a specific purpose; knowledge can
be viewed as a mix of information and background knowledge (context-specific
knowledge such as experience, company values). In the DIKW hierarchy, knowledge
acquisition requires a process to combine information obtained with background
knowledge. This in turn could lead to discovery of phenomena or a better understanding
of the situation.
KDD involves acquiring knowledge from the data. It involves data mining which is used
for both KDD and as a sub-process of the KDD process. Figure 8 depicts the process as
described by (Fayyad, et al., 1996). It starts by identifying the relevant target data from
the database. The data is then pre-processed to remove noise and outliers before further
processing. The cleaned data is then passed through a data mining algorithm to generate
patterns. The patterns are then interpreted and evaluated for the knowledge to be
uncovered.

19
Figure 8: KDD process (Fayyad, et al., 1996)
In this context, KDD is utilized to generate the Pareto charts that summarize the different
quality measures. Despite providing a systematic approach to turn data into knowledge,
it has some limitations. For an effective QMS (as depicted in Figure 6), the knowledge
extracted from the data should lead to better-informed decisions on the issues to target
to implement corrective actions with the biggest impact on quality improvement. The
limitation stems from the gap between statistic-based summaries and value-based
decision-making which factors in business objectives and involves multiple decision-
makers (Wang & Rangaiah, 2017). Choi, et al., (2005) argues to overcome this challenge,
data mining could be combined with decision analysis techniques. This would be
configured such that data mining contributes to identifying the choices whereas decision
analysis prioritizes those alternatives based on the decision-maker's preferences.
3.2.2 Pareto solutions
The results obtained from the KDD are known as “Pareto-optimal front” or Pareto
“nondominated solutions” which comprise multiple possible solutions except for
instances where objectives are not conflicting. In those exceptional cases, one unique
solution exists. This arises from the multi-objective optimization (MOO) which often has
conflicting objectives and the optimal solutions are equally good from the different
perspectives (Wang & Rangaiah, 2017). MOO problems are found in everyday life and
are prevalent in many areas such as mathematics, engineering, social studies, economics,
aviation, and many more. Similarly, there are many methods in solving such problems
(Pierre, et al., 2014) in our example it is called a Pareto-based approach.

20
The presence of multiple solutions gives rise to a new problem of selecting one of the
non-dominant solutions hence the need for a decision-maker (Wang & Rangaiah, 2017).
There exist different configurations of including the decision-maker (DM) and his
preferences in solving the multi-objective problem. These methods are no preference
methods, a priori methods, and interactive methods (Pierre, et al., 2014). Some of the
methods found in the literature include the Simple Weighted Addition method (SWA),
Analytical Hierarchical Process (AHP), and different outranking methods such as the
Elimination and Choice Translating Reality (ELECTRE) (Lu, et al., 2007). Table 1 below
highlights some of the studies that have utilized AHP or some variant in a QM context.
Table 1: Summary of literature utilizing AHP in QM (Donauer, et al., 2014)
It is argued applying a combination of QM tools is beneficial for quality improvement as
demonstrated by (Donauer, et al., 2014) where a combination of Pareto and Failure mode
and effects analysis (FMEA) analysis yields to a prioritization matrix for the NCs. The

21
FMEA could be modelled using an AHP approach where the DM’s preferences are
quantified and used to rank the NCs. This approach is applicable in choosing both
preventive and corrective action actions.
This could be achieved by choosing the AHP method where ‘a priori’ method could be
used in combination with a risk assessment to prioritize preventive measures. Contrarily,
an interactive method could be utilized with historical data to prioritize corrective
methods. Another benefit would be the utilization of both historical data and current
data in exploring the Pareto solutions to be considered. This approach ensures the
involvement of the DM which taps into the knowledge of the experts as well as objectives
of the DM (Donauer, et al., 2014).
A simple weighted decision generated using FMEA can be achieved by assigning a risk
prioritization number (RPN) which comprises the severity, occurrence, and detection of
the fault. These are determined by the DM by evaluating each factor on a 10-point scale
(Nuchpho, et al., 2014). The advantage of this approach is the ability to rank both
quantitative and qualitative nonconformity data based on the DM’s preferences.
Furthermore, the weighted results give a more realistic picture of the situation which
cannot be captured purely by data.
3.2.3 Practical NC management example
In this section, a hypothetical example is developed to highlight some of the issues
mentioned in the literature. Suppose data was collected about nonconformities from a
production site. The notifications were qualitative hence the frequency is the only
accurate measurement. Based on the type of defect and location, they were grouped into
N1-N6 and grouped as shown in Figure 9 below. Furthermore, a Pareto chart was also
created based on the frequency of occurrence.
According to the ‘Pareto principle’ NC5, NC3 and NC1 make up over 80% of the issues.
From a decision-maker perspective, this data is not enough to make a business case for
improvement hence other factors ought to be included in the context. This usually
includes costs, type of NC, nature of the NC among others. Typically, the factors chosen
are usually part of KPI and there are targets set by the business managers.

22
Figure 9: KDD during NC analysis
If the DM decides to generate an RPN such as Nuchpho, et al., (2014), a new Pareto
solution based on risk is generated, as shown in Figure 10 below.
Figure 10: Analysis including DM preferences
By taking into consideration the rating of the RPN the Pareto changes from (NC5, NC3,
NC1) to (NC3, NC2, NC4). The ratings are as follows:
• Severity – How badly it can affect operations on a scale (1-10) where 1=least sever
to 10=most sever.
• Occurrence – based on the percentage of occurrence then normalized by
multiplying by 10 (NCx/NCtotal * 10). This could also be rated by domain experts
on the 1-10 scale.
• Detectability – ease of detection to avoid passing defects on a scale (1-10) where
1=easy to detect and 10=difficult to detect.

23
This example illustrates the difference between statistic-based solutions and the value-
based solutions discussed earlier. The DM preferences can significantly change the
interpretation of the data which gives it a richer context hence a more informed
perspective of where the actual problems lie.
NC management can be summarized as a function of QMS which identifies and ranks
NCs to enable an organization to make informed decisions while choosing and
implementing continuous improvement projects. However, the decision making process
in an organization is difficult to understand or improve. Moreover, quality improvement
is not a well-structured problem since there are multiple criteria to choose from hence
data alone cannot be used in the decision-making process. This approach to making
decisions can be referred to as evidence-based decision making (Pfeffer & Sutton, 2006)
which is briefly disused in the next section.
3.3 Evidence-Based Decision Making
Evidence-based decision making (EBDM) is situated in the Evidence-based management
(EBMgt) movement which entails the adoption of ‘best available evidence’ in
organizational practices and managerial decisions (Pfeffer & Sutton, 2006). This
approach to decision-making has been adopted by the ISO 9001 standard as a QM
principle signifying its relevance in this context. The revision from a factual approach to
EBDM could be due to the introduction of the clause on organizational knowledge. Since
data is regarded as facts when it comes to decision making, the context (organizational
knowledge) should also be factored in.
EBMgt is not a totally new phenomenon and has served as a guide for bridging the
‘research-practice’ gap in management. According to its proponents, it has been defined
as the systemic use of best available ‘evidence’ to improve management practice which
developed from evidence-based medicine (Rousseau, et al., 2008).
The term evidence in the managerial context is used as an encompassing term for human
knowledge. The knowledge could be based on data, scientific research, local
organizational information, and even professional experience (Rousseau, et al., 2008).
In an organizational context applicable evidence could include:
• Scientific evidence – findings from published scientific research.

24
• Organizational evidence – data, facts, and figures gathered from the
organization.
• First-hand evidence – professional experience from practitioners and interested
parties' views and input (stakeholder evidence).
These are some of the sources an evidence-practitioner could potentially utilize to make
better-informed decisions (Barends, et al., 2014). As depicted in Figure 11 below, the
evidence forms part of a collaborative decision-making process which factors in the
organization setup, resources available as well as the experience from the practitioners.
Figure 11: Conceptualization of evidence-based practice (Adopted from Barends, et al., 2014)
To arrive at an evidence-based decision, Barends et al., (2014) propose a six-step process.
I. Asking – The first step is to analyse the current system to identify practical issues
which are then translated into specific questions.
II. Acquiring – The evidence is sought to address the questions identified in the
previous step. This requires collaborative effort to identify relevant evidence
sources and in some instances access to the information.

25
III. Appraising – The evidence collected is then analysed critically for relevance,
strength, and quality before being utilized in the consequent stages.
IV. Aggregating – After passing the appraisal, the evidence is then merged and
weighted based on the stakeholders/practitioner’s intentions.
V. Applying – The evidence is then adopted into the decision-making process where
it could lead to better-informed choices or even an intervention.
VI. Assessing – The outcome is then monitored and evaluated continuously with
appropriate intervention based on the results.
This model although developed with the context of the health profession could be
extended to be used in other social disciplines as well. Rousseau (2006) argues that
adopting an evidence-based managerial approach gives managers an advantage over
those who do not practice it. She contends that EBMgt offers high-quality managerial
decisions with better implementation and the outcomes support the organizational
goals. Ultimately, it could lead to better collaboration between researchers, educators,
and managers creating a co-creation community where information is “systematically
gathered, evaluated, disseminated, implemented, re-evaluated, and shared” (Rousseau,
2006, pp. 267-268).
3.4 Constructed Framework
This study constitutes QM as the theoretical foundation of this study. It specifically
addresses the management of NCs which is a core function of QA. Additional theories
and models have been used to demonstrate the practical implementation of NC
management and improvement of the process. Figure 12 below illustrates how the
concept of EBDM has been used to construct the framework for this study.
Research evidence comprises the literature review which has been used for identifying
and analysing viable NC management ideas. Organizational evidence is the
documentation and guidelines on NC management that has been gathered from the case
company which includes directives and training manuals. It also includes an
experimental data analysis based on the real data from internal NC notifications in the
company. Stakeholders' values and professional judgment came from quality personnel
ranging from quality managers to quality inspectors who work on the shop floor.

26
Figure 12: Conceptual framework for improved NC management using evidence-based approach
From a QM perspective, the conceptual framework conforms to the revised ISO
9001:2015 which could be beneficial for organizations. Among the changes in the new
ISO standard are risk-based thinking, organizational knowledge, and evidence-based
decision making (ISO quality, 2015). In the literature review, the data mining in the
context of this study is combined with knowledge from a DM which is a form of
utilization of organizational knowledge. Furthermore, developing ranking based on the
RPN using experts within the organization enables faster identification of riskier NCs
which is the tenets of risk-based thinking. Finally, incorporating other evidence
including organizational knowledge, expert, and practitioner's knowledge to improve NC
management embodies EBDM.

27
4 RESEARCH METHODOLOGY
This chapter describes the methodology of the study including an outline of the research
strategy, research design, research methods, and a discussion on the quality of the
research.
4.1 Research Strategy
The research strategy is based on many factors which include; research questions and
objectives, the extent of existing knowledge, the amount of time and resources at your
disposal, and personal philosophical preferences (Saunders, et al., 2009). The research
strategy for this study was anchored on the objectives of the study as well as the resource
availability.
The purpose of the study was to investigate how to improve the analysis of quality
deviation data with the overall aim of improving QM for the case company. Moreover,
the company was willing to offer unlimited access to its resources including data with the
hope of creating an experimental solution. Therefore, the research was addressing a real
organizational problem and creating knowledge about the problem. Prior to deciding on
this research objective, several consultations had been made to identify potential
development projects within the quality department. The objective was set after the start
of the research. This research approach is part of ‘progressive illumination’ which is
notably specific to practitioner action research (McNiff & Jack, 2001).
Researching a business environment can be quite challenging due to the complexity of
the environment. It is unlikely to use experimental research in such a setting since it
would require some degree of control over the environment. Moreover, controlled
settings are unlikely to be related to the real world and the results cannot be extended to
all organizations. Another research strategy is action research which is credited to Lewin
1964. Action research shares similarities with case studies. For example, both are generic
terms covering many forms of research perspectives and designs, they also focus on
phenomena in the world of action. Despite these similarities, they are fundamentally
different approaches. Action research starts with issues and concerns whereas a case
study begins with the researcher’s interest in a phenomenon. This also implies
collaboration between the researcher and participants is vital for the success of an action
research study than a case study.

28
Action Research (AR) was chosen as the research strategy for this study primarily
because it defined the research environment most accurately. Furthermore, the inclusion
of ‘progressive illumination’ and ‘research in action’ contributes to choosing this strategy
despite its controversial standpoint in the research community. The controversies arise
due to the uniqueness of the method. Since such studies are usually ‘one-off’s, it is argued
it lacks rigor due to its lack of repeatability (Eden & Huxham, 1996, p. 75).
4.2 Action Research
Action Research has many names and definitions, however, they all share some common
themes which are: research in action, rather than about action; participatory; concurrent
with action and a sequence of events and an approach to problem-solving (Coughlan &
Coughlan, 2002).
One of the most commonly used definitions of AR is, “action research aims to contribute
both to the practical concerns of people in an immediate problematic situation and to the
goals of social science by joint collaboration within a mutually acceptable ethical
framework" (Rapoport 1970:499 as cited in (Susman & Evered, 1987, p. 587)). This
means there is both action and research to create a change. Hence the reference to
“research in action rather than about action” (Coughlan & Coughlan, 2002, p. 223). It is
also viewed as a cyclic process consisting either explicitly or implicitly of observing,
reflecting, acting, evaluating, and modifying (McNiff & Jack, 2001). Furthermore, the
members of the system participate actively in this cyclic process hence there is no
boundary between the object being studied and the researcher.
According to Coghlan & Brydon-Miller (2014), it is important to formally deal with
specific issues such as the purpose and rationale of the research, the context, method of
inquiry among others. Addressing these issues legitimizes the study since it will conform
to academic requirements although the presentation and argument will differ.
4.2.1 Purpose and Rationale of the Research
Based on the initial findings of the business challenges discussed in Chapter 2, the quality
manager chose the data analysis challenge as the main research interest. Based on prior
experience with the available tools (QlikView and Ms Excel), he requested we test other
analysis tools other than the ones currently in use. The research would involve testing
data collected in the SAP for nonconformities from January 2018 to December 2018. The

29
aim was to test a different tool to analyse the same dataset to generate actionable
knowledge from the notifications.
During discussions as to which tool could be considered, it was agreed the big data tool
would be a good option. The rationale behind picking a big data tool was twofold. Firstly,
the data was voluminous hence qualified to be categorized as big data. Secondly, the data
contained both structured and unstructured data. Using a big data tool would allow the
utilization of all the data, unlike the existing tools which could only be used to analyse
structured data.
From the case company perspective, this provided an opportunity to test the potential of
using big data analytic tools to extract value from data (McKinsey Global Institute &
McKinsey Analytics, 2016). Furthermore, it would increase the data capabilities of the
quality department by integrating new analysis tools. In the academic field, this is an
excellent example of a practical case study that could contribute to understanding the
deployment of big data analytics tools. Issues such as deployment and factors affecting
the success or failure of such projects could give a richer understanding of the big data
phenomenon, and its applicability in a business context.
4.2.2 Research setting
The research project was initially an eight-month (February – September 2019)
collaborative study between the company and the researcher though it was extended
based on the promising results. The primary contact was the Quality Manager in charge
of QMS who then chose other employees to be part of the internal project stakeholders.
The researcher joined the cross-functional team which comprised of employees from the
production side, quality inspectors, and data analysts who had vast experience and
thorough knowledge about the daily operations. This was consistent with the goals of
participatory action research. According to Eden & Huxham (1996), PAR allows
researchers to become deeply involved with the organization and engage them with the
research questions.
The case company lacked a standard deployment strategy for conducting this study.
However, the quality manager gave the researcher the freedom to choose an appropriate
approach. After discussions with team members and staff who had worked on the
analysis issue, it emerged the best option was to use an action research approach. Firstly,
it was evident that the quality manager had data and information that was critical in
understanding the problem. Secondly, prior attempts to deal with the problem had

30
proved to be ineffective hence the issue was not simple in nature. Initially, the quality
manager was focused on testing a big data tool that could automate data mining from a
vast number of notifications. This was the entry point of the research project. Python
software was identified as an ideal tool for this purpose since it is popular in the big data
analysis field, readily available, free, and was being utilized by other data analysts within
the company.
The researcher proposed a project management approach called ‘experiential learning’
which is a second-order tool and technique in project management (Cavanagh, 2017).
This approach is very useful in executing complex projects hence chosen for this study.
It comprises discrete learning activities namely inquiry, execution, reflection, and
analysis which take place both within each phase and over the complete project life cycle.
At the inquiry stage, short face to face meetings were chosen as the mode of inquiry to
facilitate familiarization with the situation and the stakeholders. Another tool employed
was a project diary which kept track of all the issues discussed and changes made to the
project. Furthermore, there were weekly meetings with the quality manager to update
him on the progress. Reflection and analysis were carried out throughout the inquiry and
execution which is referred to as ‘learning in experience’ which is more beneficial than
‘learning from experience’ (Cavanagh, 2017).
The inquiry phase became the ‘compass’ of the researcher to determine in an exploratory
fashion the best way to analyse the NC notifications. As the project progressed beyond
the inquiry phase, emergent factors such as the quality of the data, the ERP catalogue
containing the data, and the data input method were important to the study. The goal
was to start the project in February 2019 and provide a report by end of August, however,
the scope changed during the project. The deliverables for the project were a prototype
analysis tool and a thesis style report documenting the process and findings with
practical recommendations.
4.3 Method
The AR approach adopted was based on Coghlan’s action research cycle comprising a
pre-step, main step, and meta step (Coughlan & Coughlan, 2002). The pre-step involves
understanding the context of the project. In this project, this was done in the first phase
of the project before starting the project. The main step comprises four basic steps as
depicted in Figure 13 below.

31
Figure 13: Action research cycles
The first step is diagnosing which involves identifying issues to work on, in this case, it
was done through initial interviews and gathering evidence from various sources, data
analysis was identified as the issue. Planning action is a subsequent step which is based
on the previous steps. In the study, it was done in collaboration with the stakeholders to
ensure the successful implementation of the plans. The next step is taking action, which
entails implementing the previous step. This study involved carrying out data analysis
following the three learning activities in the experiential learning approach (Cavanagh,

32
2017). Finally, the last step is evaluating action which entails reflecting on the outcomes
of the actions taken to inform the next course of action. In this study, a review of findings
was shared routinely after every analysis with the input from the stakeholders used to
inform the next research cycle.
The meta-step involves inquiring into each of the four main steps to ensure consistency,
understanding the process of inquiry, and shaping subsequent steps to conform to
develop actionable knowledge (Coghlan & Brannick, 2005). In this study, mirroring the
experiential learning, three AR cycles were designed where each cycle consists of the
general AR cycle model as highlighted in Figure 13 above.
Each research cycle contributes to the next phase as suggested by Coghlan & Brannick
(2005). Although the cycles occurred sequentially as they appear in this example, the
boundaries and direction of the cycles were not as distinct as represented in the diagram.
There were multiple iterations within and between the cycles. This approach is proposed
by Coghlan & Brannick (2005) as a systemic approach to implementing change in a large
system. It follows Beckhard’s framework of change which comprises four phases namely:
determine the need for change, determine the future state, assess present in terms of the
future to determine the work to be done, and managing the transition (Coghlan &
Brannick, 2005, pp. 93-97). In this study, only the first three phases are utilized. Each
phase is discussed in detail in the subsequent subchapters.
4.3.1 Action Research Cycle 1 (Analysis I)
Since the aim of the study was to solve a practical problem by the researcher
collaborating with the company, hence the first phase was a collaborative diagnosis of
the current situation. In a PAR such as this study, the researcher is encouraged to be
more flexible rather than being bound by well-known research methods. The methods
chosen are justified by the need of the researcher to obtain useful knowledge and involve
all stakeholders (Coghlan & Brydon-Miller, 2014).
The first step was to agree on the relationship between the key stakeholders which would
play a vital role in establishing the internal validity of the study. This study took into
account the values, beliefs, and intentions of the stakeholders from the case company
and treated all of them as collaborators. The data access was agreed upon with the
condition that all company data could not be shared externally.

33
Next, the scoping was done which confined the study to NC management. Appropriate
data for analysis was chosen and agreed upon by all stakeholders. The first few weeks
involved collecting relevant data in production and investigation into the current
processes and practices. The data came from many sources including meeting minutes,
questionnaires, semi-structured interviews, company documents, and observations.
4.3.2 Action Research Cycle 2 (Analysis II)
The problem formulation from the first research cycle led to identifying relevant theory
for NC data analysis. Initially, the problem had been identified as NC notification
analysis. However, after a trial and error approach with the analysis, we identified the
challenge was converting the data to actionable knowledge to assist in the decision
making process. The Pareto approach combined with the FMEA helped in identifying
and prioritizing potential improvement areas in managing NCs. The Pareto approach is
primarily used to identify the vital few and trivial many. Based on these solutions, the
production managers then choose which solutions are aligned to their objectives. This is
the identification part which precedes prioritization.
The domain experts then develop an FMEA risk analysis called RPN to develop weighted
values for the NCs. This approach quantifies the NC notifications which are qualitative.
Furthermore, it also provides a means of knowledge utilization by incorporating the
FMEA analysis which requires input from the production experts and staff. By doing so,
it becomes possible to identify the potential target issues for improvement.
The theory in this second research cycle combines aspects of both business intelligence
and decision making. After selecting appropriate data, the KKD method is employed
which is referred to as business intelligence when in business support and decision
making context (Fayyad, et al., 1996). In this context, the KDD methodology is limited to
the discovery of interesting patterns due to the qualitative nature of the data. The
decision-making is covered by the multi-objective optimization theory which includes
decision-maker input to quantify the qualitative data hence give it a richer context and
convert it to actionable knowledge. Finally, the evidence-based theory was used to
develop the theoretical framework for the study. This simply means combining the
findings from the first research cycle with the method obtained from the literature
review.

34
The approach was discussed with the stakeholders and they agreed to proceed with it to
analyse the deviations from specific locations within production. This informed the next
cycle which combined both research cycles with a prototype analysis based on the actual
data.
4.3.3 Action Research Cycle 3 (Analysis III)
This action research cycle involved the design of a risk prioritization matrix (RPM). The
RPM is a modification of the risk priority number (RPN) which is a product of the
severity, occurrence, and detectability of failures equated as (RPN = S*O*D). Although
useful for identifying the most serious risks, it is criticized that it suffers from
oversimplification. It is argued that using the RPN does not account for the relative
weight of risks for each attribute hence leading to inconsistencies (Ravi Sankar & Prabhu,
2001).
For the matrix, the attributes chosen were frequency related attributes for the X-axis and
risk-related attributes for the y-axis. In this study, the attributes chosen were based on
the literature review example. It would have been quite accurate to utilize the actual
workers' knowledge, but they were unable to provide support. The data for the analysis
was from actual data that was gathered from the previous research cycles.
Finally, the proposed scenario was compared to the current scenario with the inclusion
of the stakeholders. Despite the lack of involvement in the attribute development phase,
the team members gave positive feedback and identified the gaps the solution overcame.
The most fundamental issue this approach would address was risk management. In the
current scenario based on the risk map used in the organization, most of the deviations
are given a low priority risk (R4). However, there are challenges in determining the
severity of these issues within this category. The RPM approach demonstrated the ability
to provide actionable insight into these deviations. Furthermore, the utilization of
knowledge from the work centre as well as the visualization of the matrix was perceived
as very positive contributions for deviation management.
From these three cycles, it is evident that different sources of data were utilized. This
stems from the need to incorporate different forms of knowledge as argued by (Saunders,
et al., 2016). These forms of knowledge are incorporated within each research cycle. The
first cycle contributes to ‘experiential knowledge’, whereas the second cycle generates
theoretical knowledge. These are then combined with the practical knowledge
(knowledge from the practical application) in the third cycle to develop actionable

35
knowledge that is beneficial to practitioners and academically robust (Saunders, et al.,
2016). The next subsection details the data sources for this study.
4.4 Data collection
This study utilized both primary and secondary data as the main sources. The data
collection was embedded in the action research cycles. The primary sources were internal
data from the company comprising governing documents, ERP data, questionnaires, and
observations. Access to this data was secured by joining the company at the beginning of
this study. The secondary sources were obtained from multiple sources which comprised
journal articles, books, and internet sources. The secondary data was sourced using a
library, an institutional database, and the internet.
There are different types of observations based on the approach of the researcher. For
this study, the researcher became part of the organization hence participant-observer
was the approach chosen. Furthermore, there are different types of participant
observation based on two distinct dimensions. The first relates to whether the identity of
the researcher is revealed or concealed from the participants. The second is the nature
of participation of the researcher which ranges from complete participation to complete
observer. This study took the form of participant-as-observer where the researcher took
part and revealed their identity (Saunders, et al., 2016). The observational data was from
meetings, informal discussions, and feedback from stakeholders. The inclusion of this
data was to capture the reflections of both the researcher and the stakeholders. The data
is presented in grey boxes; see Figure 14 below for an example.
Figure 14: Example of an observation box for including observational data
The next subsection delves into the data collected based on the three research cycles. The
choice of data collected was influenced by both the researcher and the stakeholders. This
will be reflected in the observation notes.
Observation – Negotiating the access to data
Before commencing the study, we signed a non-disclosure agreement to safeguard
proprietary data for the company. Furthermore, I had to disclose my status and
intentions as a researcher prior to engaging with other stakeholders. This was a means
of requesting consent. Finally, I had to keep personal identities anonymous to comply
with data legislation known as the GDPR.

36
4.4.1 Data Collection (AR 1)
The data collected in the first research cycle was from primary data sources. The data
collection for this stage was primarily for familiarization. The aim was to understand the
organization and particularly understand the quality management structure, procedures,
and routines. Moreover, this would assist in understanding the current challenges the
quality department faced with analysing quality deviation data. The data collection for
this purpose lasted throughout the research process.
This stage informed the later data collection stages and formed the current state analysis.
The different sources used can be seen in Table 2 below.
Evident from Table 2 below, the company documentation came in different forms. The
information gathered in this phase was primarily the quality management function
within the context of the company, current working processes, definitions,
responsibilities, and the obligations both legal and corporate the department had to
adhere to. However, the data gathered was qualitative hence the need to involve
stakeholders to contextualize the information. This approach to data collection enables
triangulation which strengthens the validity of this study (Yin, 2013). After an initial
review of the internal company documents, some issues were singled out as ‘perceived’
constraints that led to challenges in carrying out a systematic analysis of nonconformity
deviations with insightful findings.
The main issues arising from this phase were the quality of the NC data and the analysis
tool called QlikView. The data quality was questioned based on previous audits and
informed judgment of the quality management team. It was evident some of the
notifications had generic labels such as “any manpower related issue” and “missing
material” which are problematic when performing analysis to determine causes of the
deviations. During analysis, the data lacked consistency when drilling down to common
causes or common defects. This issue was more complex to diagnose hence it was decided
another analysis software could be tested. The quality manager was interested in testing
software that had big data analytics capability.
This led to the publishing of a questionnaire to the quality inspectors to understand their
views of the data they input in the SAP. The main aim of the questionnaire was to
establish which data was more credible and could be utilized in the analysis to find
common issues. It would also provide a structured way of collecting views about the use
of SAP in making notifications. From the standpoint of the quality managers, the SAP

37
was too rigid since it was standardized for a global environment hence challenging to
localize the application of the software.
Table 2: Data collection for AR1

38
The software chosen for analysing the notifications was Python. Other than being
capable of big data analytics, Python many advantages. Firstly, it is free hence there was
no need to secure resources for purchasing. It is easy to learn and has a huge user base
who offer support and upload support material online for free. The software has access
to extensive libraries and third-party modules which makes it both powerful and reduces
the amount of code required.
4.4.2 Data Collection (AR 2)
The data collected in this research cycle was from secondary data sources. The data
collection for this stage was to model a possible solution based on published literature.
This approach is known as best practices which are usually associated with world-class
manufacturing. The underlying premise is the performance improvement can be
achieved through the adoption of programs that work in other companies (Voss, et al.,
1997). Table 3 below summarizes the data collection sources based on the topics and
their domain in management literature highlighting their contribution to this study.
The data sources were mainly books, journal articles from the various fields, and
observations from stakeholders. During this phase, the main contribution of the data was
to develop a theoretical approach which was the ‘best practice’ based on empirical
evidence. Inclusion of the evidence-based empirical part was to generate a framework
for incorporating the theoretical solution into a practical solution for the case company
as espoused by proponents of PAR (Coghlan & Brannick, 2005; Eden & Huxham, 1996).
Observation – Main challenges
The SAP catalogue contains too many variables and some options are too generic
which end up being problematic during analysis. The analysis itself is problematic
with very little to no insight generated after hours of work. The idea of big data
analysis has been toyed with, but the required resources are a big hurdle to exploring
this option. This could be a perfect opportunity to explore this option.

39
Table 3: Data collection for AR2
The framework developed in this phase was then used to compare the current state of
the case company and the proposed theoretical approach. Furthermore, a test case was
also used based on the actual data to determine its applicability. This formed the final
research cycle which is discussed in the next subchapter.

40
4.4.3 Data Collection (AR 3)
This research cycle entailed gathering feedback from domain experts via face to face
meetings and discussions to compare and critique the theoretical approach developed
from the previous research cycle. The theoretical approach was demonstrated utilizing
the actual data from the first research cycle (nonconformity deviations) and the domain
experts were to express their expectations on what they wished to explore during the
analysis of the data.
The data collected in this stage contributed to organizational evidence as well as giving
an organizational context which was part of the conceptual framework developed in
Chapter 3. Furthermore, this stage enabled the conversion of the theoretical approach to
a practical approach for this situation. This approach of combining different sources of
data is called triangulation which enables the researcher to reveal the ‘reality’ of the data.
It also adds to the validity and credibility of the data collection, analysis, and
interpretation (Saunders, et al., 2016).
Another important issue tackled was the focus of the data analysis. The quality manager
narrowed the data to be analysed to one workshop. This type of sampling is a non-
probability technique called ‘typical case sampling’ which is usually used as part of a
research project to provide an illustrative case (Saunders, et al., 2016). It is argued this
method is not intended to be definitive. Narrowing the analysis to one work centre
enabled a deeper analysis and quick access to information since there was cordial
cooperation between the work centre and the quality department.
Observation – What kind of analysis is needed?
The analysis should lead to actionable knowledge which could lead to informed decision
making. The information should be able to be utilized by the quality department. Any
type of analysis that can overcome the current challenge is worth looking into. There
have been case studies on how big data analytics could potentially improve analysis
however, the challenge is modelling the analytics for our specific context. Theoretical
solution will have to be tested using the current data we have to determine its validity
and practicability before deciding which would be the best solution. Involving various
stakeholders is quite important since there are other ongoing initiatives which may
overlap with this research. This will also maximize utilization of expert knowledge and
reduce resource competition with other similar initiatives.

41
4.5 Analysis strategy
This section describes how the data collected was analysed in the subsequent chapter.
For this study, the analysis technique utilized is called analytic induction which is a
branch of explanation building or testing analysis techniques (Saunders, et al., 2016). It
is argued these techniques focus on building and testing an explanation which
differentiates them from thematic analysis and template building.
Analytic induction is inductive meaning the conclusion is based on evidence from
observation thus creating a gap in the logical arguments. It is argued its key characteristic
is an incremental approach to build and test an explanation or theory (Saunders, et al.,
2016). In this study, this will be achieved through the analysis of the NC notifications as
prescribed in the quality directive. To counter the ‘gap’ in the logical arguments, the data
from the literature review and observations are utilized in the study. Since the main aim
of the study was exploratory, it would not be possible to select the appropriate theory
without the intervention of the stakeholders. However, the theory selection was at the
discretion of the researcher hence complementary to the observations. The observations
contributed to the incremental approach since they informed the next step for analysis
whereas the theory provided deductively generated tools for analysis.
Observation – What kind of data to collect?
The choosing of data to be collected and analysed was of great importance for both the
researcher and the stakeholders. An important aspect discussed throughout this phase
was the quality of the data collected from the ERP system. This prompted the survey to
analyse the quality of data generated by the quality inspectors. However, the
respondents for the survey was such a small sample size which could not definitively
determine the quality of the non-conformity notifications. Hence the experiment was
tested using the existing data with the aim of unveiling the supportive/impeding factors
for the current challenges facing the analysis of the notifications. We agreed on a
purposeful sampling with the guidance of the stakeholders while the data collection was
left to the discretion of the researcher. This inclusion of feedback to all stages of data
collection increased the internal validity and reliability through enhancement of
methodological rigor and providing an error-correcting mechanism.

42
For this study, the analytical induction method was designed to allow for multiple
inquiries as illustrated in Figure 15 below.
Figure 15: Analysis strategy for this study
The different inquiries are as follows:
1. The organizational context was obtained from the data collection (AR1) which
comprised the directive, quality manual, training material about non-conformity
handling. This was to guide in designing an accurate environment for the
subsequent experimental analysis which was relevant in the case company.
2. The organizational evidence was obtained from the non-conformity directive
which was obtained during the data collection (AR1) and is currently enforced in
the company. The experiment was to adhere to the process steps to ensure
comparability.

43
3. The research evidence was obtained from a literature review focusing on relevant
literature applicable to this study.
4. The observational evidence was obtained from domain experts and practitioners
including the project stakeholders.

44
5 RESULTS
This chapter presents results from the empirical experimental analysis of INC (QI) data
based on the theoretical model developed in Chapter 3. This analysis is structured into
four distinct sections. The first section deals with data recording and the data obtained.
This is followed by the classification which is analysing the data. The third section is to
plan, perform, and verify where issues such as prioritization and decision making are
covered. Finally, close which signifies the end of the process. The chapter then continues
with a presentation of the results of the survey and ends with a summary of the findings.
5.1 Record
This section describes the data recording which entails documentation and collection of
the data. It covers the data type, nature, and issues arising from the data collection. The
empirical result is based on expert opinion and data analysis.
During the initial weeks of the project, the stakeholders chose the data to be analysed in
this study. They chose INC data due to the ease of access and lower degree of complexity
i.e. (the data was collected from the production line which was in the facility we were
situated). Moreover, other notifications included other business functions which would
make the analysis more challenging since we would need to involve more stakeholders.
The data obtained from the SAP was in the form of an excel file depicted in Figure 16
below. The file contained multiple fields which required the interpretation of the quality
manager to understand the importance of each field in the NC analysis. From the
records:
• The mandated fields from the NC Management directive were present.
• Some variables had both codes (numerical) and description(text) fields that
represented the same data e.g. (defect location and defect location text). These
variables are predefined in the SAP catalogue.
• Some text variables were free text which meant analysis for these fields would
require a different kind of analysis e.g. Natural Language Processing (NLP).
Moreover, most of the text was in Finnish which presented an analysis challenge
for the researcher.

45
• There was a presence of generic terms such as “any manpower related causes”
which could be problematic during classification.
• There were visibly empty fields and extremely unbalanced values for example in
the non-conformity cost.
Figure 16: Field values example of QI data
The dataset is summarised in Table 4 below.
Table 4: Summary of the QI data
To effectively employ data mining on this dataset, the Cross-Industry Standard Process
for Data Mining (CRISP-DM) process was followed. According to CRISP-DM, the data
mining life cycle consist of six phases which are adaptive i.e. the next phase is dependent
Attribute Description
Total number of notifications 1758
Number of columns 111
Datatype Mixed data

46
on the previous phase. Also noteworthy is the iterative nature of the process symbolized
by the outer circle of the process as seen in Figure 17 below (Larose & Larose, 2015).
Figure 17: CRISP-DM process (Larose & Larose, 2015, p. 7)
The CRISP-DM process stresses the importance of data understanding and data
preparation which could also be referred to as the pre-processing of data. This involves
data cleaning and data transformation to ensure the data is appropriate for analysis
which according to Larose & Larose (2015), could account for 10-60% of the time and
effort for the whole data mining process. For this study, the data understanding phase
was carried out in close cooperation with the quality manager to capture the business
challenge in its entirety. This methodology also factors in the business understanding
which is a critical step missing from other KD approaches.
The first review was the distribution of issues based on priority (risk level). The result is
depicted in Figure 18 below.

47
Figure 18: QI data grouped by risk level
It is evident most issues (90.04%) are considered as low risk (R4) issues. Based on these
findings, the quality manager decided we focus on the notifications ranked as R4 hence
the total number of notifications to be analysed was reduced albeit with little
significance. Moreover, the columns were reviewed, and an initial screening led to a
reduction of the columns considered relevant from 111 to 16 which represented an 85.6%
reduction in the number of columns utilized during data mining. The screening was
based on the existing analysis practice. The data type remained mixed type with most
fields representing labels describing the defect location, type, nature, etc.
The next step was data cleaning which involved identifying issues contained within the
data. The stakeholders highlighted very many issues regarding the quality of the data
such as:
1. Missing data – there were many missing values for the dataset ranging from
0.02% to 19% in some fields of the notifications which is considered problematic
in data analysis (Larose & Larose, 2015).
2. Misclassification problems – The stakeholders identified some potential
misclassification issues which could arise during data input. Misclassification in
this context means classification labels are not valid and consistent (Larose &
Larose, 2015). For example, the quality manager had advised against the use of

48
generic labels such as “any manpower related cause” yet it appeared in 21% in the
cause field.
These issues prompted a survey of the quality inspectors to understand their evaluation
of the quality notifications. The survey questions and responses can be seen in Appendix
1.
Based on these findings, we decided to focus on the defect location and the defect type in
the next phase of classification. Based on discussions between the stakeholders and
inspectors, there was a consensus on the quality of data in these fields. Moreover, issues
such as misclassification and missing were not evident after verification.
5.2 Classify
In this phase, the classification was done as summarized in Appendix 2. For ease of
analysis, four work centres were chosen based on convenience of access. In terms of risk,
all the issues had the same risk profile R4 which meant classification had to rely on other
factors. However, from the business point of view, understanding the risk of the quality
issues was a key factor in classification to effectively assign limited resources in the
subsequent steps. This prompted the adoption of the approach proposed in the literature
review part of this study. Furthermore, the analysis was reduced from four to one work
centre to reduce the complexity of analysis and ensure a smaller and effective cross-
functional team. The other motivation was the guaranteed buy-in from the selected work
centre manager.
The data collected for the chosen work centre (Conrod) can be seen in Appendix 2.
Although there were 132 issues in total, we only selected the top 8 issues based on the
data from the whole dataset as shown in Table 5 below.
Table 5: Conrod centre defects based on location and defect type

49
Making a Pareto for the same data resulted in Figure 19 below. It is evident that the top
three issues make up more than half the issues for this sample dataset. However, without
knowing the risk posed by the defects leads to decision-makers relying on intuition. To
utilize this data, a risk analysis ought to be employed. For this case, we developed a risk
matrix based on FMEA and AHP as described in Section 3.2 in the literature review.
Figure 19: Pareto for top 8 issues in Conrod WorkCentre
For this study, we developed the matrix with the aim of scenario building without the
inclusion of the Conrod workers. This was due to the time limitation and the study
coincided with the summer holiday for the main workers. Conducting an FMEA with the
summer trainees was deemed not a feasible option. Scenario building is fundamental for
exploring and understanding uncertainty in the business environment (Burt, 2010). The
matrix was made up of a construct of attributes based on the information contained in
the notification as can be seen in Tables 6 and 7 below.
The X-axis is comprised of attributes relating to the frequency of occurrence of issues.
The frequency is weighted based on the location and type of defect. They are summed
and an average frequency called normalized frequency is then calculated. This
normalized frequency then becomes the X-axis for the matrix. Conversely, the Y-axis
comprises attributes relating to the risk aspect of issues. Risk in this case is subjective
based on the overall effect of the fault from both the production and customer
perspective.
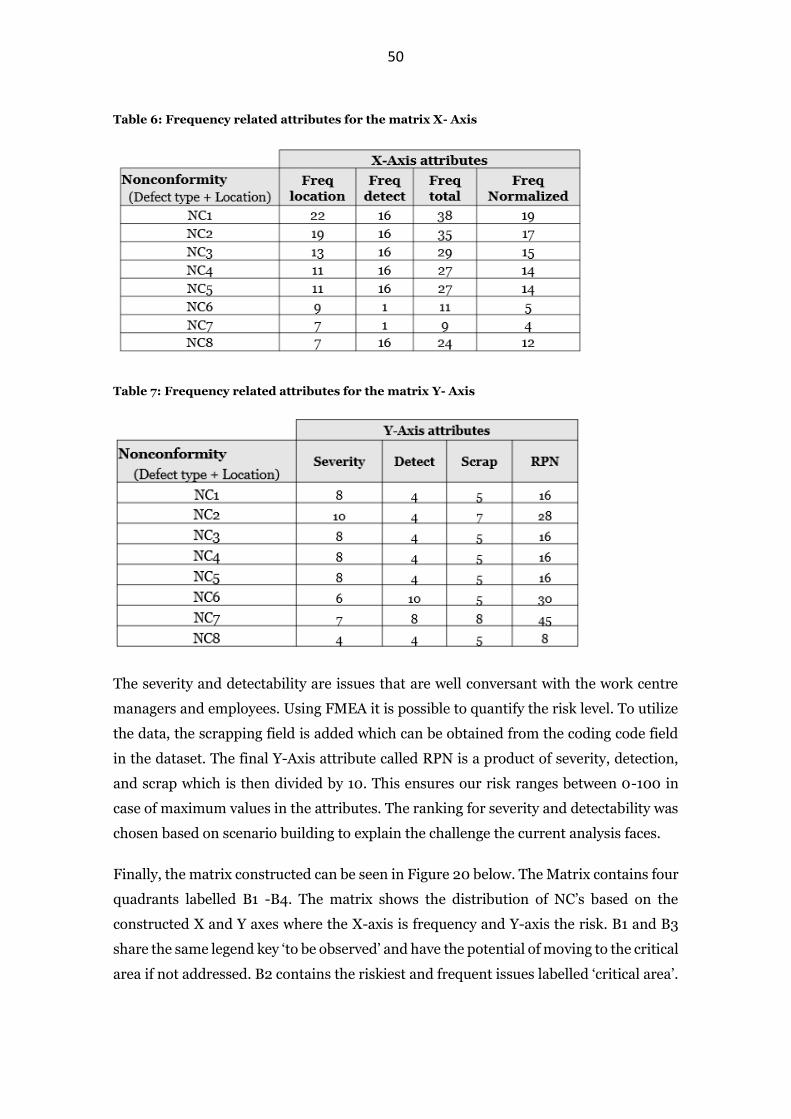
50
Table 6: Frequency related attributes for the matrix X- Axis
Table 7: Frequency related attributes for the matrix Y- Axis
The severity and detectability are issues that are well conversant with the work centre
managers and employees. Using FMEA it is possible to quantify the risk level. To utilize
the data, the scrapping field is added which can be obtained from the coding code field
in the dataset. The final Y-Axis attribute called RPN is a product of severity, detection,
and scrap which is then divided by 10. This ensures our risk ranges between 0-100 in
case of maximum values in the attributes. The ranking for severity and detectability was
chosen based on scenario building to explain the challenge the current analysis faces.
Finally, the matrix constructed can be seen in Figure 20 below. The Matrix contains four
quadrants labelled B1 -B4. The matrix shows the distribution of NC’s based on the
constructed X and Y axes where the X-axis is frequency and Y-axis the risk. B1 and B3
share the same legend key ‘to be observed’ and have the potential of moving to the critical
area if not addressed. B2 contains the riskiest and frequent issues labelled ‘critical area’.

51
B4 represents an area in the matrix with low risk and frequency. This classification is
more informative for decision-makers since they can easily comprehend what are the top
issues before delving into the next step which includes a deeper analysis. Using the
matrix, the next step is the plan, perform, and verify phase.
Figure 20: Conrod WorkCentre NC Matrix
5.3 Plan, perform and Verify
From the matrix in Figure 20 above, the quality manager can choose the Corrective
Action and corrections relevant for solving the issues. The rule of thumb as postulated in
the literature part is doing Corrective Actions for the big issues to prevent them from
reoccurring. For this matrix, these issues were situated inside the B2 quadrant followed
by B1 and B3. This could range from a root cause analysis which is very intensive to
simpler techniques such as problem-solving. After diagnosis, the corrective actions are

52
applied, and the matrix is monitored. If the correct actions are applied, the NC ought to
shift either due to reduced frequency, reduced risk or both.
The desired outcome is a shift of the NC from B2 to B4 however, since it is a continuous
improvement process, it could first move to either B1 or B3 which is an improvement
from B2. In this phase, the quality department takes an active role in developing
appropriate actions. Once the issue is resolved then we move to the final phase which is
close.
5.4 Close
In this phase, the matrix is reviewed and if the issue is resolved, the solution is stored in
a database that can be retrieved in case of similar issues arising in the future. The closing
phase also entails reflection of lessons learned which could also be stored in a database.
This practice enables the expertise, knowledge, and experience of employees to be
captured which can be utilized later. This is especially useful considering such knowledge
is only acquired through a long time of experience and training which costs the
organization.
Close in this context could mean an issue has been successfully moved into B4 from any
of the other quadrants. Since quality issues in our setting are bound to occur, there will
always be other issues requiring a similar treatment process. It also marks the end of an
analysis cycle leading to the restarting of the process akin to a PDCA cycle.
Observation – Empirical findings?
The empirical findings for this section were primarily based on the literature review
part. The input from the stakeholders was the choice of data to be included in the
analysis. This led to obtaining the results presented. This approach was presented to
the stakeholders who acknowledged the novelty of the idea. Previous attempts using
big data analytics methods were unsuccessful due to an array of factors ranging from
complex coding of algorithms to outputs that at best generated only visual aids rather
than data informed solutions.
The quality manager was cautiously accepting of this solution. His reservations were
mostly based on the data quality issues that he is privy to and the effect is has to the
whole analysis process. Another area of concern was the lack of a systemic approach
to the current data quality issues that are prevalent in the SAP data.

53
5.5 Survey results
This section presents data collected from the survey to quality inspectors regarding the
recording of the NC notifications. The survey concluded that the quality of the
notifications cannot be definitively determined. The survey had different categories as
shown below in Table 8 where the category was the general theme and description field
elaborates the issues covered in each category. The Survey initially targeted 21 quality
inspectors and 3 supervisors, however, only 9 people viewed the survey and out of those
only 7 answered.
Table 8: Summary of survey issues.
The lack of a consensus was evident in the survey responses. For example, more than
half of the respondents (71 %) found it easy to work with SAP to create notifications yet
57% was either neutral or disagreed with the ease of use of the catalogue in creating
notifications. This can be seen in Figure 21 below. Furthermore, there was a possibility
of the survey suffering from translation errors since the survey was only conducted in
English whereas the inspectors were more fluent in other languages. To reduce this error,
the survey questions would have had Finnish and Swedish equivalent translations. This
however would not have been possible due to a lack of resources for the translation
service.

54
Figure 21: Response from the survey regarding ease of use for SAP and catalogue
The results for the data input category can be seen in Figure 22 below. The cause code
and defect coding code have the highest ranking for ease of locating the associated code
as shown. More than half of the quality inspectors agreed that they include optional text.
However, the percentage of respondents who answered neutrally was significantly large
which could mean the uncertainty is too large to make a valid claim. In the cause text for
example if we assume all the neutral respondents meant they disagree with the
statement, then the negative responses would become more than the positive responses.
Figure 22: Response from the survey regarding data input for QI notifications
Similarly, the data reliability category as can be seen in Figure 23 below had high neutral
responses which would affect the validity of the results. Consequently, the survey was

55
dropped in the rest of this study. However, the stakeholders had a meeting with the
inspectors to discuss some of the pain points when it comes to creating notifications in
the SAP. The biggest issue identified was the catalogue since it contained multiple
choices which could affect the quality of notifications.
Figure 23: Response from the survey regarding data reliability for QI notifications
The meeting with quality inspectors and supervisors revealed some inconsistency in the
data due to confusing terminologies in the catalogue. For example, an issue such as a
dimensional error could be labelled as dimensional/tolerance issue yet at the same time
one could choose an option such as “hole too small” or “hole big”. These different
variations also have different codes in the catalogue. This leads to challenges in
determining classification accuracy for the data which is a known challenge in the field
of computing. The difficulty arises from irrelevant or misinformative features such as in
our example which negatively impact the computational results (Michalak, et al., 2011).

56
5.6 Summary of findings
The results presented in this chapter comprised of the empirical results from an
experimental analysis developed from the literature review. These results were validated
using feedback collected from the stakeholders during presentation meetings and the
researcher's reflections. The experimental analysis was modelled based on
organizational evidence and expert opinion. In this case, the NC directive was followed
which groups analysis activities into record; classify, plan, perform and verify and close.
The findings suggest the theoretical approach is possible for the quality management for
the case company.
Also included in this chapter are results from the survey. The survey was carried out to
understand the data source and identify potential issues in the data before analysis. The
results of the survey were not conclusive although a follow-up meeting led to gathering
insightful information regarding data challenges.
The next chapter will focus on the empirical results and how it relates to our research
questions. We will also reflect on the merit and demerit of our approach concerning the
overall notification analysis challenge.
Observation – Survey
Although the results were not utilized in this study, the post survey meeting with the
quality supervisor and inspectors led to a better understanding of the data and helped
in determining the next course of action. In our case, we decided a minimalist approach
to the data since there was no way of determining the reliability of the current data
collected.
The survey method in this case was not the most effective tool to elicit the kind of data
we needed to develop a practical solution. The meeting also provided more relevant
information which was useful in redirecting the study towards the final solution. This
drove the study towards using FMEA as a data collection tool for risk analysis.
Furthermore, it led to the revelation that despite having the data it was not sufficient to
understand the operational risk posed by the deviations.

57
6 DISCUSSION
This study set out to explore the possibility of incorporating data analytics in a quality
management system to improve NC management. From the results in Chapter 5, it is
evident that it is possible to utilize data analytics in quality management but improving
NC management requires more than analytical capabilities. Initially, we developed four
sub-research questions (see Chapter 1.2) which were answered throughout the study.
6.1 Findings linked to theory and previous studies
To understand and contextualize the results, there is a need to link the findings to the
theories discussed in Chapter 3. This section explores and discusses the relationship
between the research questions and our findings.
6.1.1 Features of Quality Management and business implications (RsQ1)
The first sub-question was examining features of QM for this study and the business
implications. This was addressed in both Chapters 1 and 2. NC management is a well-
understood feature of a QMS and the choices made regarding this study were
satisfactorily covered. For the case company, there were four different types of internal
notifications hence limiting the study to one type of deviation had its pros and cons. The
merits were discussed earlier hence we will focus on some demerits. The type of analysis
conducted for other types of deviations could be different. If that is the case, then the
solution proposed is only limited to analyse one set of deviations. Another drawback
could be sub-optimization which is prevalent in operations management. It is postulated
in systems thinking that optimizing a subsystem may not necessarily lead to an overall
improvement in the whole system. In our case the one type of notification (QI) is a
subsystem of the internal notifications, hence there is a danger that improving this
analysis might not be enough to significantly improve NC management.
6.1.2 Theoretical framework for adoption of data analytics (RsQ2)
The next sub-question was addressing a theoretical framework that conceptualizes the
adoption of data analytics. For this study (see Figure 12 in Chapter 3.4), the framework
is not specific to data analytics. The reason being the main topic is quality management
and the study was required to be applicable to fit the context of the case company. Hence
the study had to factor in these aspects besides the data analytics. This is evident with
the use of the Pareto method and FMEA as part of the solution. Typically, these tools are
more prevalent in quality management than in the data science field. Despite these

58
divergent topics, the framework managed to achieve the goal of adopting data analytics
into the analysis of the nonconformities hence adequately addressing this sub-question.
The data analytics and quality management are situated within the research evidence.
However, the framework is too general to contribute to theory building in either domain
in this study. Conversely, we did manage to demonstrate that an evidence-based
approach offers flexibility for research and provides a basis for using triangulation as a
research method.
6.1.3 Factors affecting adoption of data analytics (RsQ3)
The third sub-question was identifying the supporting and impeding factors for the
adoption of data analytics. In this study the challenges that emerged could be grouped
into three main categories namely:
I. Data challenges – these relate to the nature of data such as complexity and
quality. These issues were identified in the record stage of the NC data collection
and storage.
II. Process challenges – these relate to the data preparation, cleansing, and
subsequent analysis associated with the classification of the NC dataset.
III. Management challenges – these relate to management issues such as data
ownership and resource allocation. These issues cover the whole NC
management scope from recording to closing.
These issues are further discussed in detail below.
6.1.3.1 Challenges for data analytics adoption
1) Data challenges
Data challenges were the first issues to come across in this study. Based on our findings,
the notifications suffered from high dimensionality issues. This was mainly due to the
use of a global catalogue in the SAP system which contained many labels even for similar
issues such as the dimensionality example in Chapter 5. Given the SAP is a global ERP
system for the case company, it was not possible to modify the catalogue to fit the local
context. Furthermore, the analysis needed to combine more than one field of data which
lead to a multilabel – multiclassification problem which is a major problem in data
analysis.

59
The data quality issues identified in this study stemmed from incomplete fields and low-
value data. For the notifications, there is no standard approach in dealing with missing
labels in the dataset. This could potentially lead to misclassifications or wrong analysis
both of which are unwanted outcomes. Low-value data emerged from generic labels such
as “material missing” which could not be utilized in further analysis. The inconclusive
survey is further evidence as to the presence of data quality issues.
Another issue that was not tackled in this study was the presence of another system for
managing issues on the shop floor. In the assembly workshops, quality issues were
tracked in a separate IT system that was independent of the SAP system. From a QM
perspective, the data in the SAP represents only a portion of the whole dataset since they
do not have access to the other system. This could contribute to the sub-optimization
problem alluded to previously.
The presence of a Pareto-like distribution function indicates the presence of complexity
which is ubiquitous with natural and social systems. When conducting a Pareto analysis
there is a risk of biases. In our analysis, for example, we only chose two variables
although our data contained 111 columns. The assumption that the FMEA and AHP will
generate accurate quantitative values for analysis could also be considered a bias. Such
biases if not properly addressed could lead to wrong analysis and interpretation of the
data.
Data issues are inherent with data analysis in any system. The issues discussed are not
exhaustive regarding our case, however, based on the analysis approach we chose these
were the main issues identified. When carrying out the analysis, these issues should be
dealt with to increase the accuracy and value of the analysis. Failure to address them
could lead to wrong analysis which in turn would generate misleading insights. This
would eventually result in the wrong prioritization of quality improvement initiatives.
Such a scenario has the potential of worsening the NC management thus a negative
impact on the QMS.
2) Process challenges
These challenges were encountered during data processing and analysis from the data
capture to presenting the results. In this study, the case was interdisciplinary since it was
anchored in the quality management domain, but it was utilizing a data science approach
and was addressing it using managerial lenses.

60
As with all interdisciplinary research, it lacked a straightforward solution. Success
depended on the collaboration with stakeholders and there was lack of experience in
undertaking interdisciplinary projects particularly for the researcher. These challenges
persisted throughout this study. The key takeaway from this challenge was there are
differences in communicating issues from different domains. For example, our challenge
was to improve the NC management through better data analysis. The same problem
framed from a data scientist perspective could be called a multi label multi classification
problem. The importance of understanding these different viewpoints is when
communicating with different stakeholders. This also led to a focus on prioritization
solutions rather than mining insights from other valuable data sources such as the
description field which had very detailed information about the defects.
Another challenge was determining the data mining technique to use. There are various
ways of ‘mining’ data in data analytics however the applicability varies with the context.
For instance, this case required actionable insights that would help quality management
decision-makers in prioritizing their focus. Using “black box”2 algorithms or statistical
methods would have elicited suspicions since they would be curious as to how the results
were obtained. Rather, our approach was quite simple to interrogate and suspicious
results could be easily recognized. However, there might exist a better data extraction
method, and identifying this is a continuous challenge.
Data analysis and modelling was also a major challenge in this study. Given the unique
features of quality management, choosing an analysis and modelling strategy for the
notifications proved challenging. Choosing between frequency and the cost of defects
was one of the pain points. From a QM perspective reducing the deviations could lead to
improved quality and reduction of cost of quality. However, from a financial perspective
tackling the most expensive deviations leads to a reduction in the cost of the quality. For
this study, the frequency was chosen over cost due to the earlier argument that even small
defects can cause a greater effect if left unabated.
Finally, the data interpretation posed the final challenge. During the first analysis
iterations, our results did not provide any new value addition. Instead, the results were
2 “Black box” means a system that hides its internal logic to the user i.e. not able to be interpreted by a human.

61
tantamount to the results obtained from the current analysis. The breakthrough came
when we tried to identify the reasons why the results were not yielding any new insights.
This led to the analysis solution presented in Chapter 5. With the new approach, there
was consensus among the stakeholders the results could add value to the analysis. From
our case, we can postulate that it is important for a data analyst to work closely with
business owners to overcome data analytics challenges. Data analytics challenges are
situational. Having feedback from stakeholders greatly reduced these challenges in our
case.
3) Management challenges
Management challenges related to data analytics revolve around data access,
management, and governance. The issues identified included quality of the data, data
ownership, and data management which are discussed in this subchapter. These issues
are classified as management challenges because they require the support of top
management to be resolved. These challenges affect the data throughout the whole
analytics chain from data input to analysis.
The data quality issue was the first to be identified. Interestingly, there seemed to be
unanimity regarding the quality of data for the notifications, however, there was also
dissension on the cause of it. From the quality inspector’s perspective, the issue arose
from the catalogue being used in the SAP system. The project stakeholders felt the issues
stemmed partly from the catalogue and partly from human error. Data analysts argued
that the quality of data was largely due to a lack of a data strategy. Based on our findings,
it was not possible to objectively determine the cause of the poor data quality although
we identified data challenges associated with it. Managing data quality within an
organization poses a huge challenge, firstly, because there is no universal definition of
data quality. Assessing the quality also requires choosing metrics, selecting tools, and
developing quality rules and thresholds. This leads to the second issue identified, data
ownership.
Based on the data quality issues, the stakeholders chose to focus on the data ownership
to unearth the responsible parties of data quality. The findings were predictable such
that the ownership was not well defined. In our case, issues such as catalogue ownership
were beyond the QM team hence, they could not enforce a data quality management
strategy for the data contained in the SAP. Furthermore, there lacked a structured,
documented approach to data quality management. Lack of clear ownership is a

62
prevalent issue in data management which exacerbates the data analysis challenge if not
addressed early i.e. before data input and collection. The issue of data ownership is best
handled when designing a data strategy which ideally should be supported by the top
management.
Data management is an elusive concept analogous to quality management. Hence it
suffers from similar issues such as determining which processes, tools, and practices to
follow and how to determine the return on investment. Although companies such as
McKenzie argue for the value in data analytics, many companies are yet to be able to
demonstrate the return on investment. Furthermore, there are many initiatives currently
riding the management wave such as business transformation, digitization, and
sustainability. Lacking a quantifiable business case for data management means the
managers are not keen on focusing their efforts on this endeavour.
Combining these issues, it is palpable that NC analysis for the case company is a colossal
challenge for the quality department. Identifying these issues proved to be a
breakthrough to overcome the limitations imposed by them. The issues were typical in a
data analysis context. However, adding a quality management lens made the challenges
unique and situational. In this study, the QM perspective shifted the challenge from a
data analysis problem to a decision-making problem that stemmed from risk
management. In our case, over 90% of the defects were classified into one risk group
(R4). The NC directive does not explicitly address the issue of handling these low priority
risks. Moreover, the stakeholders raised questions about the risk categorization for
example if a low-risk defect potentially resulted in high damage cost, what mechanism
would be used to resolve such an issue. This led to choosing the FMEA combined with
AHP as our solution.
6.1.3.2 Support for data analytics adoption
Despite the challenges discussed above, there are supporting indicators on the support
for data analytics. The first is the strategy adopted to improve NC management as
mentioned in Chapter 2. It is argued that strategic initiatives receive support from
management hence increasing their success rate. A positive response to the analytical
solution proposed in this study could be interpreted as support for the adoption of data
analytics. This is supported by the initial desires espoused by the project stakeholders to
utilize big data analytics in this project.

63
The other supporting evidence for the adoption of data analytics is the QMS system. The
company has been ISO 9001:2015 certified since 2015. It is argued that this standard is
in line with modern business and quality management practices. The clauses that foster
this notion include risk-based thinking, organizational knowledge, organizational
context, and continuous improvement. These clauses though not specific for data
analytics, do seem to create an enabling environment for it. This holds for also other
modern business practices such as Business Intelligence (BI), digitization, among others.
1) Risk-based thinking
The systemic approach to risk was one of the key changes in the ISO 9001:2015 revision.
The risk-based approach promotes companies to become more proactive rather than
reactive when handling risks. In previous versions, there was a clause on preventive
actions but in the updated version the company is expected to incorporate risk in the
whole management system. Adopting this approach enables organizations to also
identify improvement areas since the risk analysis is tied to their objectives.
A typical risk-based approach involves identifying the risks based on your
context/objectives and analysing these risks to understand the impact on your objectives.
This is followed by planning actions to address these risks. These could be incorporated
into a PDCA cycle where this is repeated continuously. Understanding how the changes
in context affect the effectiveness of the plans creates an opportunity to improve. ISO
9001:2015 (sub-clause 9.1.3) stipulates analysis and evaluation of appropriate data and
information whose results should evaluate the effectiveness of actions taken to address
risk and opportunities. This corroborates with the solution proposed in this study.
Hence, we can deduce that the adoption of risk-based thinking is an enabler for the
adoption of data analytics.
An important aspect of risk-based thinking is the emphasis on risk evaluation. In this
study, our dataset contained risk ranking at the business level despite being operational
data. Consequently, the type of analytics capability that could be adopted was descriptive
analytics which is a summary of raw data. To achieve the next level of analytics i.e.
diagnostic analytics which can enable businesses to delve deeper and resolve issues, then
risk-based thinking acts as a catalyst. For this case, the adoption of FMEA and AHP
enabled risk evaluation at the operational level prompting a deeper understanding of
defect notifications.

64
2) Organizational context and knowledge
Organizational context means both internal and external factors affecting an
organization. It is important to understand this concept before embarking on strategic
planning. Both internal and external contexts can influence the organization however the
organization cannot always fully control these factors. For example, customer
complaints can force companies to change policies such as product returns and customer
support. Regulatory changes could affect the way the business operates regarding
taxation, type of products, and services offered by the company. Contextual issues are
associated with variability which is symbolic of uncertainty. These uncertainties can be
diverse, complex, and highly unpredictable which poses challenges for organizations. To
overcome these challenges, organizations need risk management. Hence, organizations
need to develop a risk management plan for each organizational contextual issue based
on their unique risk profile. For our study, we compared the current internal factors with
the internal factors obtained from the literature review. It was evident that the
operational risk required more data for more insightful data analysis. A key tenet in data
analytics is combining data from many sources, therefore the organizational context is
an enabler for data analytics.
Organizational knowledge is a key feature of the revised ISO standard which is adopted.
Due to the vast and complex nature of the topic, the guidelines give a general approach
to knowledge management in the organization. The determination of what is
“knowledge” and how it will be managed is at the discretion of the organization.
However, they are required to demonstrate they are utilizing knowledge management
elements as part of their quality system. Our proposed solution utilizes KDD as part of
the analysis which is part of KM. This supports the implementation of our analysis.
Another important aspect of KM is the type of knowledge. Reflecting on our case, the
type of knowledge contained in the notifications is ‘explicit knowledge’3. Our solution
proposes using FMEA and AHP to collect ‘Implicit knowledge’4. Capturing this
knowledge elevates the analysis from descriptive analytics to diagnostic analytics.
3 Explicit knowledge is knowledge that is articulated and captured in form of text, table, diagrams etc. 4 Implicit knowledge is knowledge that can be articulated but has not yet been articulated.

65
3) Continuous improvement
According to the ISO 9001:2015, organizations must strive to determine and select
opportunities for improvement in meeting customer requirements and satisfaction. This
requirement is the crux of this thesis. The main challenge for the case company was
prioritizing and determining improvement opportunities backed by data analysis.
During discussions with the quality managers, they cited “data analysis challenges” and
“firefighting” as barriers to continuous improvement. Firefighting is usually associated
with a lack of strategic planning whereby issues are dealt with as they arise without
prioritization. Developing a strategic plan requires a thorough understanding of the
situation. For decision-makers, ideal decisions require to be backed by data as well as
intuition (experiential knowledge). Challenges to data analysis lead to sole dependence
on intuition which hinders the development of a strategic plan. It is evident that the two
are somewhat interconnected and solving the data analysis challenge holds the key to
solving both issues.
The solution proposed in this study addresses the data analysis challenge aimed at
prioritizing and identifying defects that could be targeted for corrective actions. In the
example analysis in our findings, we demonstrated the ability to identify the most
frequent and risky issues in the work centre. This could not be done prior to developing
the risk matrix. Since the matrix utilizes data analytics, this implies this clause supports
the utilization of data analytics.
From the discussions above, it is evident that the ISO 9001:2015 does support the use of
data analytics. Although the standard does not explicitly state data analytics, we have
managed to demonstrate how the different clauses can relate to the topic. The support of
the current QMS for our solution is very advantageous. Based on this, we can be able to
answer our main research question about the possibility of incorporating data analytics
in QM and if it could lead to an improvement in NC management. According to this
study, it is possible to incorporate data analytics in QM. In our findings, we demonstrated
how data analytics could be utilized with other QM tools to also improve NC management
by prioritizing relevant issues. Furthermore, we utilized knowledge management (FMEA
and AHP) which also improves understanding the contextual issues thus contributing to
improved NC management.

66
6.2 Method discussion
This section only discusses the findings linked to the used methods. However, the
methods are discussed in detail in Chapter 4.
6.2.1 Action research
This thesis has demonstrated that an action research study can be conducted for research
in operations management. The study did fulfil the themes as stated in the research
methodology section 4.2 by (Coughlan & Coughlan, 2002). It further demonstrated
progressive illumination and cyclic nature through the iterations made from identifying
the challenge to developing the solution.
The study also displays the support of changing from a traditional cause and effect
relationship to a logic of practice. McNiff & Jack (2001), argue that new epistemology
requires a dialectical form of logic which involves question and answer where a solution
always contains a new problem. In our study, for example, the identification of suitable
data led to the problem of choosing an analysis method. After selecting the Pareto
approach the analysis led to an optimization problem. This continued until we arrived at
a satisfactory solution for the stakeholders. The term satisfactory in this context means
the solution is not perfect but manages to address some of the prior challenges.
This thesis showed that an action researcher needs to be flexible and requires social
skills. Although the study started as a quality management study which is part of
operational management research, it ended up being a multidisciplinary study
incorporating data analytics (data science) and evidence-based management (mostly
medicine). Working with the stakeholders required understanding their pain points and
different views and learning to adjust communication based on the stakeholder’s
viewpoint. Another aspect of social skills is building networks. An example in this study
is the survey deployed to the inspectors. The only respondents in the survey were
working for a quality supervisor who was involved throughout this research and had a
rapport with the researcher. This demonstrates the success of action research is
dependent on the social skills of the researcher and their ability to build networks within
the organization they are conducting research.

67
It took time to understand all the aspects of NC management and how to improve it. This
confirmed the issues highlighted in the literature review (Chapter 3.1.1). This study was
a learning process that generated insights about the current handling of data and what
is needed to improve NC analysis in the case company.
6.2.2 Weaknesses and uncertainties
This study is based on the method of AR which is sometimes branded as “consultancy
masquerading as research” (Coughlan & Coughlan, 2002, p. 237). To avoid such claims
the study ought to have differentiated itself more explicitly from a consultancy. For
example, the use of theoretical justifications rather than empirical justifications supports
the study to be action research. Contrarily, the data collection and documentation were
not as rigorous as is required in conducting research. This was partly due to stringent
data access laws enforced in the company (GDPR) as well as gaining trust and openness
from the stakeholders. The use of observations was partly to overcome this.
Another weakness of the AR approach is the threat to validity. It is argued that the lack
of impartiality of the researcher is a prominent threat to validity. Working as part of the
quality team throughout this thesis might have influenced this study. Quality issues are
famously dependent on the point of view as argued by (Garvin, 1984). Furthermore, their
solution arrived at in this study was based on convenience for both the researcher and
the stakeholders. During the literature review, there were other alternative approaches
to incorporating AHP to FMEA called fuzzy logic. However, the fuzzy logic theory was
difficult to understand even for the researcher hence it was not considered in this study.
To reduce these biases, there was a constant interaction throughout the research with
the stakeholders to capture their perspectives and views.
A key uncertainty was with the data collected from stakeholders, quality inspectors
survey, and observations. This is due to the sample of the participants. The stakeholders
comprised mainly quality experts with less involvement of production experts. This
creates uncertainty since involving more production experts might have generated
different results. The survey results only came from inspectors working under one quality
supervisor who was part of the stakeholders in the project. The uncertainty is they could
have given socially desirable (perceived as correct or wanted) rather than independent
answers. This was considered during the study and contributed to rendering the results
from the questionnaire as “inconclusive”.

68
A fundamental weakness in this study is its specificity. The case is situated in a very niche
market (around 4 competitors globally) due to the technical expertise and capital
requirements. The complexity is also very context-specific for this case. To compound
the problem, quality management is already considered a complex and challenging
phenomenon irrespective of the industry. It could be argued such specific conditions
could limit the generalizability and transferability of the study to other industries or even
other management domains such as supply chain management.

69
7 CONCLUSION
This chapter presents the conclusion of the study and final recommendations for future
research. It also emphasizes the key takeaway from the study.
7.1 Conclusions from findings
A general conclusion regarding the main question is that data analytics is applicable in a
quality management setting, but the challenge lies in the data analysis. In our case
company for example, using the current tools and practice for data analysis can only
determine the frequency of deviations albeit with a degree of uncertainty owing to the
quality of the data. For the data analysis to meet the requirements and expectations of
the quality department more data is required.
We managed to demonstrate the classification challenge arises from a broad
classification of risk. To overcome this challenge, further risk analysis needs to be
conducted to rank issues based on their risk and occurrence. This supplementary data
could enable the quality department to analyse the data using frequency and risk to
determine the severity of defects. This approach would improve the prioritization and
decision making of the quality department. Given the limited resources of the quality
department, they could use this approach to determine which issues deserve either
corrective actions or corrections. They could also use these two variables for plotting
issues on a 2 by 2 matrix for visualization (see Figure 20 Section 5.2).
We can also conclude that the supporting factors for the adoption of big data analytics
overwhelm the impeding factors. This means the adoption of this approach is likely to
get support from top management which is a key ingredient for the success of such a
project.
Finally, we can conclude that the case company is a learning organization. This can be
inferred from the commissioning of a study towards improving their quality
management. Taking an AR approach solidifies this claim. Unlike consultancy, AR
involves the stakeholders and researcher throughout the research project. This nurture’s
learning for both parties and the results are the fruition of this process. The findings of
the study also triggered a data consciousness which has led to an interest in the analysis
of other data sources to understand the data and how to improve it throughout the
organization.

70
7.2 Recommendations and future research
This section presents some recommendations for the company and directions for future
research. The recommendations are based on the experiences and findings of this study.
The case company could immensely benefit from collaboration with institutions of
higher learning to develop their data analytics abilities. This study is such an example
where a real business case generated an innovative solution. It is evident that the
company is operating in a very niche market hence their data analytics needs cannot be
met with general data analytics solutions. To develop these data analytics capabilities,
both data analysts and business experts need to collaborate in achieving this. Since the
company has business experts already, they could collaborate with institutions looking,
for example, for training opportunities or thesis work for their students. The advantage
of this scenario is a win-win for both parties. Companies will enhance their data analytics
capabilities and might even scout future talent and employees. The learning institutions
will benefit from providing real-life work experience for their studies and bridge the gap
between education and industries.
The field investigated in this study is rapidly evolving and constantly changing. Despite
these changes, one indispensable resource is data. The access and management of data
are crucial for companies keen on leveraging data analytics to improve business
performance. The ability to make sense of data, both internally and externally will be
crucial across all business fields. It is predicted this will be one of the key drivers of
competitive advantage as more industries and companies invest in this field. To fully
harness the data analytics capabilities, future studies could utilize this approach to
explore other data sources or even extend this approach to other domains such as supply
management. A narrower scope focusing on the data quality or different analytic
technologies could give more in-depth insights. Unfortunately, that would limit
generalization as encountered in this study.
Finally, there were interesting emergent research topics in the literature review. Though
there is significant coverage of quality management in management research, there are
few studies that explore quality management in project-based industries. Given the
organizational differences between project-based and product-based organizations,
there are opportunities to create a discourse that could lead to the creation and
development of existing organizational theories. There is also room for the development
of data analytics topics using managerial lenses. For this study, the adoption aspect could

71
also be a valid topic for research. Although some factors affecting the adoption were
discovered, there may be more factors that were not highlighted. It would also be
interesting to study if the adoption of data analytics to improve quality management can
be a source of competitive advantage.
7.3 Final Remarks
This study demonstrated a real business case of a company interested in adopting data
analytics to overcome issues with their current quality management practice. Although
the case was situated in the quality management domain, interrogating the current
challenges enabled the discovery of the multidisciplinary nature of the problem. Some of
these issues which included the availability of data, data quality, and data management
were well known but ideas on how to overcome them lacked.
To overcome these challenges there need to be cross-functional teams of experts in the
different domains (QM, data science, management). This is reflected in this study with
the setup of the stakeholders and how the roles changed as the study progressed. After
establishing the team, it became possible to properly define the business challenge which
better utilized the data collected by the quality management team to make informed
decisions regarding handling notifications. Identifying the right business challenge is a
complex issue but if done correctly then can provide new insights as demonstrated in the
study.
The link between analytics and quality management was found in re-evaluating the
collected data and adding the knowledge of the business practitioners to give a richer
context of the data. To aid in decision making, the new data was presented in a visual
chart (risk prioritization matrix). It was interesting to note the managers liked the visual
representation of the data. Research in data visualization could be relevant to understand
insights managers needs for example when creating dashboards.
Using AR as a research method enabled bridging the gap between theory and practise. I
aspire this study to pave way for other researchers to adopt and contribute to this
research method in the management field. I also hope it inspires others to research some
of the topics covered. I believe there is a need for more studies on project-based
organizations since they face unique challenges from traditional organizations.

72
APPENDIX 1
QI DATA QUALITY SURVEY RESULTS
Themes
Questions
1 = Strongly agree 2 = Agree 3 = Neutral 4 = Disagree 5 = Strongly disagree 1 2 3 4 5
1 It is easy to use SAP to enter QI 4 1 1 1 0
It is easy to use the SAP catalogue when creating notifications
1 2 2 1 1
2 It is easy to find all the mandatory fields 1 2 2 1 1
It is easy to locate relevant defect location code
0 2 3 2 0
It is easy to locate relevant defect type code 1 2 2 2 0
I usually include defect type text 2 2 2 1 0
It is easy to locate relevant cause code 0 4 2 1 0
I usually include cause text 2 1 2 2 0
It is easy to locate relevant defect coding code
0 5 2 0 0
It is easy to describe issues in the description text
1 4 2 0 0
3 Most accurate information is contained in defect location code
0 3 2 1 1
Most accurate information is contained in defect type code
0 4 2 0 1
Most accurate information is contained in defect cause code
0 2 3 1 1
Most accurate information is contained in description field
2 2 3 0 0
It is easy to identify issues using the codes 0 2 2 3 0
It is easy to identify repeat issues using the codes
0 3 3 1 0
It is easy to identify issues using description
1 2 2 2 0
It is easy to identify repeat issues using description
0 3 2 2 0
Survey total population: 21
Total number of respondents: 7

73
APPENDIX 2
DEFECT CLASSIFICATION
COMPONENT DEFECT FREQUENCY
Big end bearing housing Scratches, grooves 12
Bearing housing, piston pin Scratches, grooves 10
Connecting rod bottom end bearing housing
Scratches, grooves 7
Mating surface for middle part, cap Scratches, grooves 6
Mating surface for cap, middle part Scratches, grooves 6
Pinhole for cap, middle part Dimension/measure over tolerance 5
Oil hole, web Steps 4
Mating surface for web, middle part
Scratches, grooves 4
Mating surface for cap, middle part Vibration signs 4
Big end bearing housing Surface machining defects 3
Big end bearing housing Other reason 3
Mating surface for web, middle part
Dimension/measure over tolerance 3
Connecting rod with screws Scratches, grooves 3
Other, web Dimension/measure over tolerance 2
Connecting rod bottom end bearing housing
Treating method defect 2
Bearing housing, piston pin Assembly defects 2
Other, web Other reason 2
Big end bearing housing Dimension/measure over tolerance 2
Connecting rod bottom end Other reason 2
Bearing housing, piston pin Other reason 2
Connecting rod with screws Other reason 2
Mating surface for nuts, cap Scratches, grooves 2
Crankshaft, counterweights Scratches, grooves 1
Outer surface, machined cap Other reason 1
Oil hole, web Machining defect 1
Screw hole for web, middle part Thread 1
Mating surface for cap, middle part Machining defect 1
Pinhole, web Run-out 1
Piston, incl. gudgeon pin Document missing 1
Mating surface for middle part, web
Scratches, grooves 1
Connecting rod with screws Structural defect 1
Bearing housing, piston pin Dimension/measure over tolerance 1
Screw threads, web Machining defect 1
Teeth, web Scratches, grooves 1
Outer surface, machined web Tightening defect 1
Pinhole for cap, middle part Hole big 1
Teeth, cap Steps 1

74
REFERENCES
Abbott, L., 1955. Quality and Competition: An Essay in Economic Theory. The Annals of the American Academy of Political and Social Science, 1(304), pp. 158-159.
Atkinson, R., 1999. Project management: cost, time, and quality, two best guesses and a phenomenon, its time to accept other success criteria. International Journal of Project Management, Vol. 17(6), pp. 337-342.
Barends, E., Rousseau, D. & Briner, R., 2014. Evidence-Based Management: The Basic Principles, Amsterdam: Centre for Evidence-Based Management.
Barney, J., 1991. Firm resources and sustained competitive advantage. Journal of Management, 1(17), pp. 99-120.
Berk, J. & Berk, S., 2000. Quality management for the technology sector. Boston: Newnes.
Bhaskar, R., 1978. A realist theory of science. New York: Harvester Wheatsheaf.
Blaikie, N., 2000. Designing Social Research: The Logic of Anticipation. illustrated, reprint ed. Oxford: Polity Press.
Blichfeldt, B. S. & Andersen, J. R., 2006. Creating a Wider Audience for Action Research: Learning from Case-Study Research. Journal of Research Practice, 2(1).
Boiral, O., 2012. ISO 9000 and organizational effectiveness: A systematic review. Quality Management Journal, 19(3), pp. 16-37.
Burt, G., 2010. Revisiting and extending our understanding of Pierre Wack's the gentle art of re-perceiving. Technological Forecasting and Social Change, 77(9), pp. 1476 - 1484.
Cavanagh, M., 2017. Second-Order Project Management. Available from: ProQuest Ebook Central ed. Farnham: Routledge.
Choi, D. H., Ahnb, B. S. & Kim, S. H., 2005. Prioritization of association rules in data mining: Multiple criteria decision approach. Expert Systems with Applications, Volume 29, pp. 867-878.
Coghlan, D. & Brannick, T., 2005. Doing Action Research in your own organization. 2nd ed. London: Sage.
Coghlan, D. & Brydon-Miller, M., 2014. The SAGE Encyclopedia of Action Research. Vols.1-2 ed. London: SAGE Publications Ltd.

75
Coughlan, P. & Coughlan, D., 2002. Action research for operations management. Action research for operations management, 22(2), pp. 220-240.
Crosby, P. B., 1979. Quality is free: The art of making quality certain. New York: New American Library.
Davis, J., 2004. Writing an action research thesis: One researcher’s resolution of the problematic of form and process. Queensland: QUT Post Graduate Research Conference.
Dean, J. W. J. & Bowen, D. E., 1994. Management Theory and Total Quality: Improving Research and Practice through. The Academy of Management Review, 19(3), pp. 392-418.
Dominik, K., Rok, V., Borut, R. & Peter, B., 2018. Big data analytics for operations management in engineer-to-order manufacturing. Procedia CIRP, Volume 72, pp. 209-214.
Donauer, M., Peçasc, P. & Azevedoa, A., 2014. Nonconformity tracking and prioritisation matrix: an approach for selecting nonconformities as a contribution to the field of TQM. Production Planning & Control: The Management of Operations, 26(2), pp. 1-19.
Eden, C. & Huxham, C., 1996. Action Research for Management Research. British Journal of Management, 7(1), pp. 75-86.
Fayyad, U., Piatetsky-Shapiro, G. & Smyth, P., 1996. The KDD process for extracting useful knowledge from volumes of data. Communications of the ACM, 39(11), pp. 27-34.
Feigenbaum, A., 1951. Quality control: principles, practice, and administration. New York: McGraw-Hill.
Fei, T., Qinglin, Q., Ang, L. & Andrew, K., 2018. Data-driven smart manufacturing. Journal of Manufacturing Systems, 48(C), pp. 157-169.
Fonseca, L. M., 2015. From quality gurus and TQM to ISO 9001:2015: a review of several quality paths. International Journal for Quality Research, 9(1), p. 167–180.
Furusten, S., 2013. Institutional Theory and Organizational Change. Cheltenham, Gloucestershire: Edward Elgar Publishing Limited.
Garvin, D., 1988. Managing Quality: The Strategic and Competitive Edge. New York: The Free Press.
Garvin, D. A., 1984. What does "product quality" really mean? Sloan Management Review, 26(1), pp. 25-43.

76
Garvin, D. A., 1987. Competing on the Eight Dimensions of Quality. Harvard Business Review, 65(6), pp. 101 - 109.
Given, L. M., 2008. The SAGE Encyclopedia of Qualitative Research Methods. Thousand Oaks: SAGE Publications.
Grant, R. M., 1996. Prospering in dynamically competitive environments: Organizational capability as knowledge integration. Organization science, 7(4), pp. 375-387.
Guba, E. G. & Lincoln, Y. S., 1994. Competing paradigms in qualitative research. In: Handbook of qualitative research. Thousand Oaks: Sage Publications, pp. 105-117.
Gülser, K., İnci, B. & Murat, C. T., 2011. A review of data mining applications for quality improvement in manufacturing industry. Expert Systems with Applications, 38(10), pp. 13448-13467.
Hackman, J. & Wageman, R., 1995. Total quality management: empirical, conceptual, and practical issues. Administrative Science Quarterly, 40(2), pp. 309-342.
Hansson, J. & Klefsjö, B., 2003. A core value model for implementing total quality management in small organisations. The TQM Magazine, 15(2), pp. 71-81.
Hassan, A., Shariff Nabi Baksh, M. & Shaharoun, A., 2000. Issues in quality engineering research. International journal of Quality & Reliability Management, 17(8), pp. 858-875.
Hoyle, D., 2001. ISO 9000 Quality Systems Handbook. 4th ed. Oxford: Butterworth-Heinemann.
International Organization for Standardization, 2015. ISO 9001:2015 Edition- Management, Quality, and Value. Geneva: ISO.org.
ISO quality, 2015. Quality management principles, Geneva: iso.org.
ISO, 2005. ISO 9000:2005 Quality management systems -- Fundamentals and vocabulary. [Online] Available at: https://www.iso.org/standard/42180.html [Accessed 11 April 2019].
Jacob, D., 2017. Quality 4.0 Impact and Strategy Handbook: Getting Digitally Connected to Transform Quality Management, s.l.: LNS Research.
Josephine, Y. & Wilkinson, A., 2002. The long and winding road: The evolution of quality management. Total Quality Management, 13(1), pp. 101 - 121.
Juran, 1951. Quality control handbook. New York: McGraw - Hill.

77
Karmarkar, U. S. & Pitbladdo, R. C., 1997. Quality, class, and competition. Management Science, 43(1), pp. 27-40.
Kuhn, T. S., 1962. The structure of scientific revolutions. 18th ed. Chicago: University of Chicago Press.
Larose, D. & Larose, C., 2015. Data Mining and Predictive Analytics. New York: John Wiley & Sons.
Lu, J., Ruan, D. & Zhang, G., 2007. Multi-Objective Group Decision Making: Methods, Software and Applications with Fuzzy Set Techniques. eBook: Imperial College Press.
Lydon, B., 2014. Automation.com. [Online] Available at: https://www.automation.com/automation-news/article/the-4th-industrial-revolution-industry-40-unfolding-at-hannover-messe-2014 [Accessed 16 February 2019].
Maynes, E. S., 1976. The Concept and Measurement of Product Quality. In: N. E. Terleckyj, ed. Household Production and Consumption. Cambridge: NBER, pp. 529 - 584.
McKinsey Global Institute & McKinsey Analytics, 2016. The Age of Analytics: Competing in a Data-Driven World, McKinsey & Company.
McNiff, J. & Jack, W., 2001. Action Research in Organisations. Florence: Routledge.
Michalak, K., Kwasnicka, H., Watorek, E. & Klinger, M., 2011. Selection of numerical and nominal features based on probabilistic dependence between features. Applied Artificial Intelligence, 25(8), pp. 746-767.
Ngo, Q. H. & Robert, H., 2016. A Data-based Approach for Quality Regulation. Procedia CIRP, Volume 57, pp. 498-503.
Nuchpho, P., Nansaarng, S. & Pongpullponsak, A., 2014. Risk Assessment in the Organization by using FMEA Innovation: A Literature Review. s.l., Proceedings of the 7th International Conference on Educational Reform (ICER 2014), Innovations and Good Practices in Education: Global Perspectives, pp. 781-789.
Oliver, C., 1997. Sustainable competitive advantage combining institutional and resource-based views. Strategic Management Journal, 18(9), pp. 697-713.
Perry, C., 2004. Action research in marketing. ProQuest eBook Central: Emerald Publishing Limited.
Pfeffer, J. & Sutton, R. I., 2006. Hard Facts, Dangerous Half-Truths, and Total Nonsense Profiting from Evidence-Based Management. Strategy and Leadership, 34(2), pp. 35-42.

78
Pierre, B. et al., 2014. Optimization in Engineering Sciences: Approximate and Metaheuristic Methods. ProQuest eBook Central: John Wiley & Sons, Incorporated.
Ravi Sankar, N. & Prabhu, B., 2001. Modified approach for prioritization of failures in a system failure mode and effects analysis. International Journal of Quality & Reliability Management, 18(3), pp. 324 - 336.
Reed, R., Lemak, D. & Montgomery, J., 1996. Beyond process: TQM content and firm performance. Academy of Management Review, 21(1), pp. 173-202.
Reeves, C. A. & Bednar, D. A., 1994. Defining Quality: Alternatives and Implications. Academy of Management, 19(3), pp. 419-445.
Rousseau, D. M., Manning, J. & Denyer, D., 2008. Evidence in Management and Organizational Science: Assembling the Field’s Full Weight of Scientific Knowledge Through Syntheses. The Academy of Management Annals, 2(1), pp. 475-515.
Rousseau, M. D., 2006. Is there such thing as "Evidence-Based Management”? Academy of Management Review, Volume 31, pp. 256-269.
Rowley, J., 2007. The wisdom hierarchy: representations of the DIKW hierarchy. Journal of Information Science, 33(2), pp. 163-180.
Rui, S. & Voss, C. A., 2002. Quality management re-visited: a reflective review and agenda for future research. Journal of Operations Management, 20(1), pp. 91-109.
Saunders, M., Lewis, P. & Thornhill, A., 2009. Research Methods for Business Students. 5th ed. Essex: Pearson Education Limited.
Saunders, M., Lewis, P. & Thornhill, A., 2016. Research Methods for Business Students. 7th ed. New York: Pearson.
Schwab, K., 2016. The Fourth Industrial Revolution. Geneva: World Economic Forum.
Sousa, R. & Voss, C. A., 2001. Quality Management: Universal or Context Dependent? Production and Operations Management, 10(4), pp. 383-404.
Storey, J., ed., 1994. New Wave Manufacturing Strategies: Organizational and Human Resource Management Dimensions. ProQuest eBook Central: SAGE Publications.
Susman, G. I. & Evered, R. D., 1987. An Assessment of the Scientific Merits of Action Research. Administrative Science Quarterly, 23(4), pp. 582-603.

79
Tim, O., 2008. Sustainable competitive advantage or temporary competitive advantage: Improving understanding of an important strategy construct. Journal of Strategy and Management, Vol. 1(Issue: 2), pp. pp.168-180.
Vincent, S. & O'Mahoney, J., 2018. Critical realism and qualitative research: an introductory overview. In: The sage handbook of qualitative business and management research methods: history and traditions. London: SAGE Publications, pp. 201-216.
Voss, C., Ahlstrom, P. & Blackmon, K., 1997. Benchmarking and operational performance: some empirical results. International Journal of Operations & Production Management, 17(10), pp. 1046 - 58.
Wang, Z. & Rangaiah, G. P., 2017. Application and Analysis of Methods for Selecting an Optimal Solution from the Pareto-Optimal Front obtained by Multiobjective Optimization. Industrial & Engineering Chemistry Research, 56(2), pp. 560-574.
Weckenmann, A., Akkasoglu, G. & Werner, T., 2015. Quality management – history and trends. The TQM Journal, 27(3), pp. 281-293.
Wernerfelt, B., 1984. A Resource-Based View of the Firm. Strategic Management Journal, pp. 171-180.
Yin, R., 2013. Validity and generalization in future case study evaluations. Evaluation, 19(3), pp. 321-332.