data liberation initiative overview of the national accounts gylliane gervais march 2009
TRANSCRIPT

Data Liberation Initiative
Overview of the national accounts
Gylliane Gervais
March 2009

Contents
A reminder about seasonal adjustment• What is the System of National Accounts
• The Canadian System of National Accounts
• A few key concepts (production, output, value added…)
• 3 ways of estimating GDP
• Major aggregates
• Income, assets, wealth, deficit, debt
• Value, volume and price
• Economic growth and recessions

TerminologyTerms used interchangeably in STC (correct term underlined)• System of National Accounts, SNA• Industry, economic activity
– ‘ISIC of all economic activities, Rev. 3’• Goods and services, products, commodities• Goods (national accounts), merchandise (international trade)• Services, non-merchandise trade (obsolete)• Value added of an industry, GDP of an industry
– ‘Monthly GDP by industry’, ‘‘Tourism GDP’• National income, GNP (obsolete)• Mixed income, net income of unincorporated business• Public administration, administration, government• Gross fixed capital formation, investment in fixed capital• ‘Provincial’ encompasses provinces and territories
Why seasonal adjustment?
• Many human and economic activities are seasonal, i.e. vary with the season
• The seasonality present in a time series obscures its fundamental trend
• Without seasonal adjustment, it would be impossible to make comparisons with previous month or quarter
• Therefore, it would be impossible to identify– Recessions– Turning points in the economic cycle

Time series and their components
• Time series: a sequence of values of one variable taken at equally spaced time intervals
– Time interval: weekly, monthly, quarterly– Variable: Employment, retail sales, GDP, etc
• Virtually all time series contain some seasonality– Even births!
• Virtually all time series are seasonally adjusted at STC– Index of industrial production, first published in 1926, was
seasonally adjusted– Exceptions: most financial series, most price indexes
Time series and their components
• Trend: long-term upward (downward) movement observed in the data over several decades
• Cycle: sequence of smooth fluctuations around the long-term trend with alternating periods of expansion and contraction
• Trading-day effect –Number of working or trading days in month varies with
calendar• Seasonality: Intra-year (monthly, quarterly) fluctuations
which repeat more or less regularly from year to year• Moving holidays: Easter, Ramadan • Irregular component: Strikes, hurricanes, etc.


What is seasonal adjustment?
• To seasonally adjust a series is to decompose it into its components in order to remove seasonality and all other calendar related effects:– Seasonal component– Trading day effect– Moving holidays
• Programs currently used for this purpose– X-11-ARIMA (developed at Statistics Canada) – X-12-ARIMA (developed at U.S. Bureau of Labor Statistics)

Causes of seasonality
• Climatic seasonality–Due to seasonal variations in the climate–Example: Consumption of heating oil
• Institutional seasonality–Due to social conventions and administrative rules–Example: Effect of Christmas on retail sales
• Induced seasonality–Due to seasonality in other activities–Example: output of the food processing industry
• In most cases, combined result of all three types–Example: employment
Causes of evolving seasonality
• Technological change– Ex.: development of construction materials and techniques
better adapted to winter
• Institutional change– Ex.: Extension of store hours and opening days
• Change in the composition of series– Ex.: provincial employment becoming more industrialized
and less dependent on primary industries (e.g. fishing, agriculture) which typically display more seasonality
• Seasonality tends to be less pronounced over time on account of technological and institutional changes

Seasonal adjustment at STC
• Done with X-11-ARIMA (old) or X-12-ARIMA (new)• X-12-ARIMA deemed superior, also more flexible• Adoption of X-12-ARIMA results in minor revisions • Programs already switched to X-12-ARIMA
– Retail and wholesale, manufacturing, services, tourism
• Programs switching to X-12-ARIMA in near future– Quarterly GDP, income and expenditure accounts: June 2009– Monthly GDP by industry: October 2009– International trade: January 2010– Labour Force Survey: January 2010

Seasonal adjustmentin the national accounts
Series are published in 2 formats:• Unadjusted (without seasonal adjustment, or ‘raw’)
– Quarterly GDP is about 25% of level of annual GDP
• Seasonally adjusted “at annual rates”– In the U.S. also, but generally not– So beware when making international comparisons!
• “At annual rates” means converted to annual level– Monthly series are multiplied by 12, quarterly series by 4– Comparable in level to counterpart annual series
• Official estimates are the seasonally adjusted ones

What are the national accounts (SNA)?
A set of macro-economic accounts showing:• Transactions between economic transactors, grouped into
sectors, and between them and the rest of the world…– Households and Non-profit institutions– Corporations (financial and non-financial)– Governments – Rest of the world or ‘Non-residents’
• Production of goods and services
• Generation, distribution, consumption of income and wealth
• Economic growth
• Presented as tables of time series
• Often revised

What are the national accounts?
Major aggregates, expressed……in total, by sector, industry and/or region…at current prices and/or constants
• Output, intermediate consumption, value added• Output and product (GDP) • Income, wealth, assets• Expenditure, deficit, debt • Saving, saving rate• Capital formation (or investment)

What are the national accounts?
• Rearrangement and aggregation of financial statements of individual transactors in the market economy
National accounting Business accounting
Production account Income Statement
} Income & expend. accounts Retained earnings statement
Financial accounts ↔ Change in financial position st.
National balance sheet ↔ Balance sheet

How are they used?
• Answer the economic information requirements– of public and private sectors– of policy and decision makers alike
Public sector
• Macroeconomic policy– In a broad sense (fiscal and monetary policy, budget…) – In a strict sense
• GDP part of equalization payments and HST allocation formulas
• Economic forecasting (models)• Improvement of economic statistics

How are they used?
Private sector• Gauging economic trends (overall and by industry)• Market analysis, simulations
International institutions• Policy formulation or coordination
– G8, IMF, OECD
• Setting country quotas in international organisations– UN and agencies, OECD, OAS, European Union
• Comparison of development levels– GDP in terms of ‘Purchasing power parities’ (World Bank, UNDP)
• International guidelines– Development aid: 0.6% of GDP

Why do we call the SNA a ‘system’?
• Common concepts based on international guidelines– SNA'93 : UN, IMF, World Bank, OECD and European Union
• SNA’93 replaced SNA’68, which replaced SNA’53• SNA’08 already released, to be implemented in coming years
– International (or North American) classifications• Accounts, industries, products, assets, consumption…
• Formal accounting coherence– Balancing item of 1st account is opening item of 2nd…
• Identical or coherent estimates
• System reinforced by– Common release dates– Common revision policy

Historical context
• Development of national accounting driven by great depression of 1930s – By how much did income fall since 1929? – How to avoid another depression?
• John Maynard Keynes General Theory 1936– Product (Y) = C + G + I +X – M– What is best policy to ensure stable growth?
• Increasing demands with World War II– How to finance the war effort?
• Canada, U.S. and U.K. played central role

The Canadian SNAIncome and Expenditure Accounts Division• Canadian economic accounts (quarterly)
– GDP in terms of income and expenditure– Sector accounts (all those with data presented by sector)
• Income and expenditure, capital acc., financial accounts• National balance sheet
– Labour income (monthly)– Productivity measures
• Provincial economic accounts (annual)– GDP income and expenditure– Partial sector accounts (no financial accounts or balance sheet)
• Other estimates– Underground economy– Unpaid household work, volunteering – Tourism– Purchasing power parities (with Prices Division)

The Canadian SNA (cont’d)Industry Accounts Division• Input-Output tables, annual, Canada and provinces• GDP by industry, annual, Canada and provinces• GDP by industry, monthly, Canada• Inter-provincial trade flows• Impact models (simulations)
Environment Accounts and Statistics• Origin: notion of green GDP• Environment and natural resource accounts
– Based on Input-Output tables– Ex.: emissions of greenhouse gases by industry
• Stock of natural resources– Forests, gas, petroleum…, eventually in National balance sheet

The Canadian SNA (cont’d)
Balance of Payments Division• Balance of international payments
– ‘Current account’ (receipts and payments)1. Goods 2. Services (travel, transportation, commercial, gov’t.) 3. Investment income (interest, etc.)4. Transfers (ex. foreign aid)
– ‘Financial and capital account’ (Change in Canadian assets abroad and vice versa)
1. Direct investment (ex. purchasing a company)2. Portfolio investment (shares, bonds)3. Other investment (loans)
• International investment position• All broken down by category and region of the world

The Canadian SNA (cont’d)
Public Institutions Division• Public sector universe
– Equivalent of business Register for public sector
• Comparable public finance statistics– Income, assets, liabilities, debt, employment, labour income– Expenditure by function (protection, health, education…)– All entities (ministries, agencies, enterprises…)– All levels (federal, provincial, local, CPP…)
• Provincial: also includes colleges and universities, hospitals• Local: municipalities, school boards
– Quarterly and fiscal year data– 3 major clients: SNA, finance ministries and IMF
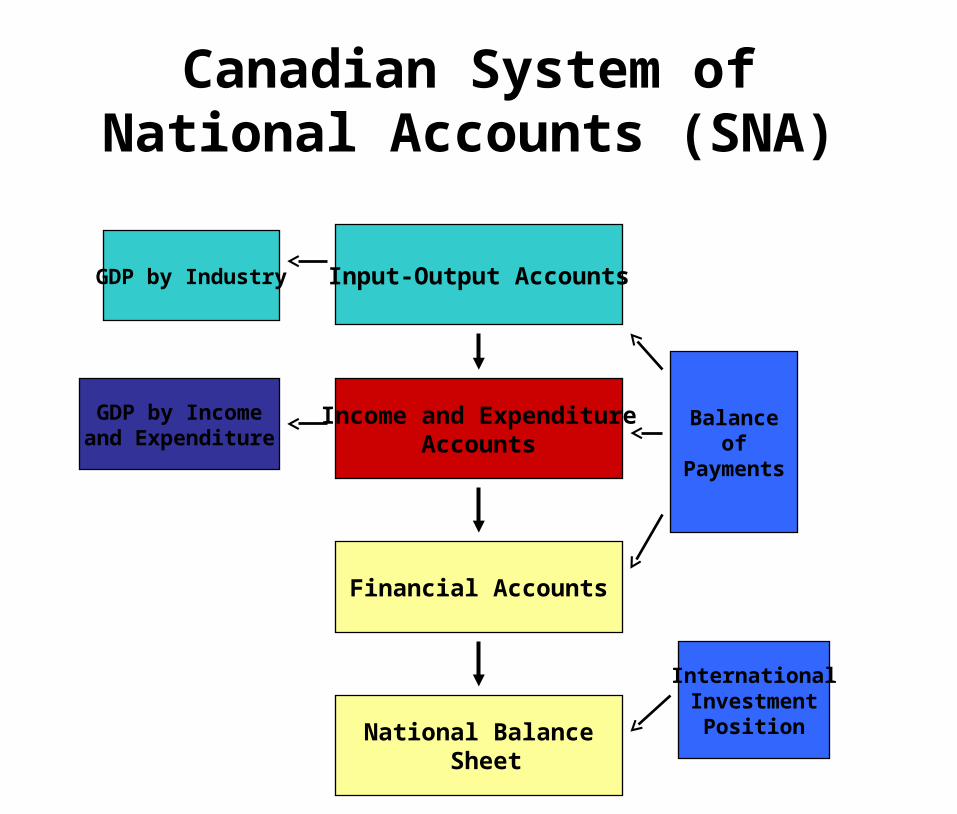
Canadian System of National Accounts (SNA)
Input-Output Accounts
Income and ExpenditureAccounts
Financial Accounts
Balanceof
Payments
InternationalInvestment
Position
GDP by Industry
National Balance Sheet
GDP by Incomeand Expenditure

System of Provincial Accounts
Provincial Input-Output Accounts
Provincial Economic Accounts
Interprovincial Trade Flows
Provincial GDPby Industry
Provincial GDP by Income
and Expenditure

Milestones in the developmentof the Canadian SNA
• Balance of Payments 1939
• Annual Income and Expenditure Accounts 1952
• Quarterly Income and Expenditure Accounts 1953
• Financial Flows and Balance Sheets 1968
• Input-Output Tables 1969
• Provincial Economic Accounts 1977
• Inter-provincial trade flows 1993
• Complete Provincial GDP by three methods 1995
• Annual Provincial Input-Output Accounts 1999

Production, output, value added, product
In a given industry or in a business:
Output• Total sales (essentially)
Intermediate consumption (IC)• Goods and services consumed in the production process, bought
from other businesses• Synonyms: intermediate expenditure, intermediate inputs
Value added (VA)• Value created as part of the production process, split into:
– Labour income (essentially wages) – Operating surplus (= VA less wages)
Output – IC = VAOutput = VA + IC
Production, output, value added, product
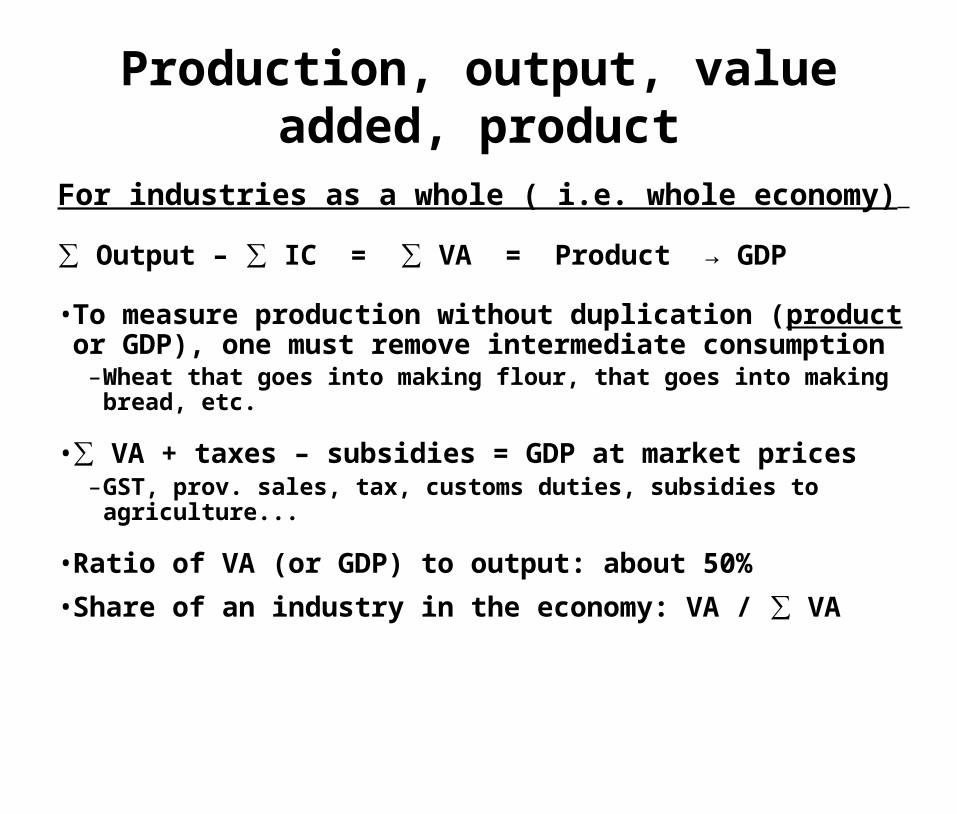
For industries as a whole ( i.e. whole economy)
∑ Output – ∑ IC = ∑ VA = Product → GDP
• To measure production without duplication (product or GDP), one must remove intermediate consumption
– Wheat that goes into making flour, that goes into making bread, etc.
• ∑ VA + taxes – subsidies = GDP at market prices– GST, prov. sales, tax, customs duties, subsidies to agriculture...
• Ratio of VA (or GDP) to output: about 50%
• Share of an industry in the economy: VA / ∑ VA
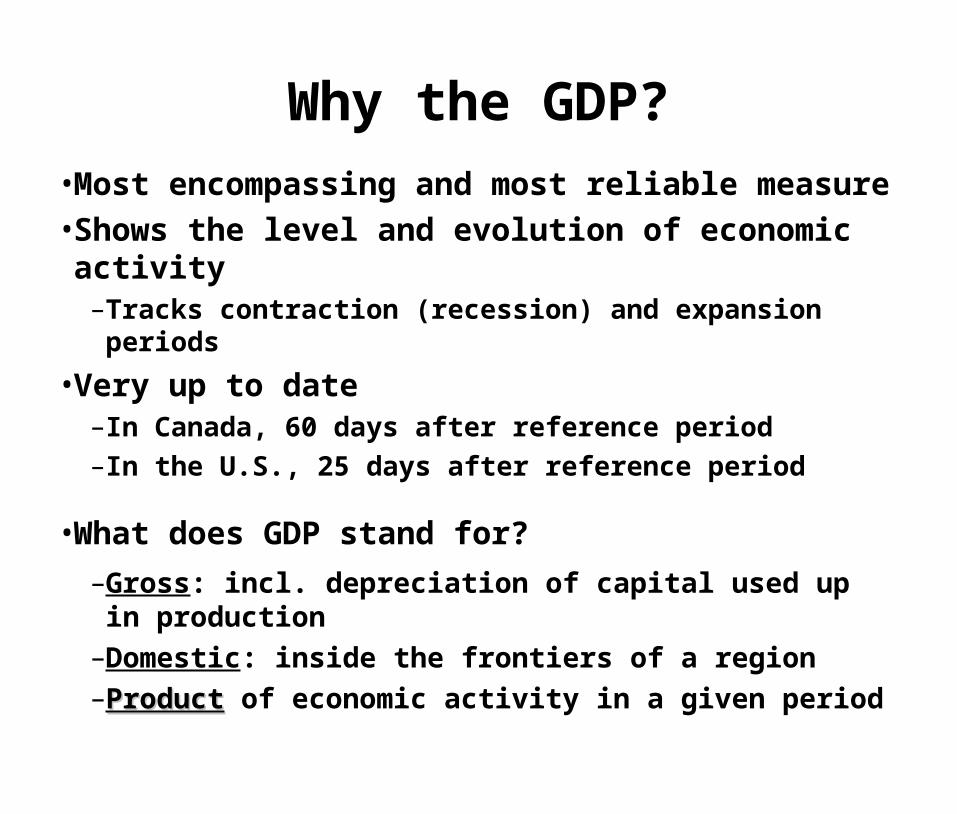
Why the GDP?• Most encompassing and most reliable measure• Shows the level and evolution of economic activity
– Tracks contraction (recession) and expansion periods
• Very up to date– In Canada, 60 days after reference period– In the U.S., 25 days after reference period
• What does GDP stand for?– Gross: incl. depreciation of capital used up in production– Domestic: inside the frontiers of a region– ProductProduct of economic activity in a given period

Production boundaryIn theory, GDP includes• All market output that can be sold at significant prices
– Destined to be sold or not– Legal (‘above ground’ and underground, including barter) – Illegal (drugs and prostitution, yes, robbery, no)
• Non market output, free or sold at non significant prices– Valued as the sum of costs– All the output of governments and NGOs, etc.– Goods produced by households that could be sold
• Own-account agricultural production• Construction of dwellings• Rent imputed on owner-occupied dwellings
• Production boundary evolves over time– GDP is larger by definition in SNA’93 than SNA’68

Production boundaryIn practice, GDP includes
• Almost all market output– Some underground / illegal transactions explicitly
• Canada: tobacco smuggling ( 0.1% of GDP in 1992-93) • Colombia: production of coca leaf and cocaine• France: tax evasion by small businesses (3% of GDP in 2000)
– Prostitution captured in part implicitly
• Main omission: unpaid household work– Major debate with feminists– 30-50% of GDP in 1992, depending on the method, falling– Similar case: volunteer work (1.4% of GDP in 2000)

Underground economy• What is the underground economy?
– Market output hidden to evade taxes and regulations– Implies tax evasion
• Underground economy vs. informal economy– Informal: emphasis on precariousness rather than tax evasion
• Underground economy vs. tax evasion– Tax evasion of incomes from abroad has nothing to do with
underground economy in Canada
• Tax evasion vs. tax avoidance– One is illegal, the other is legal
• Transactions: undeclared (to taxation) vs. unmeasured– Certain undeclared income is captured in GDP. Ex.: rents
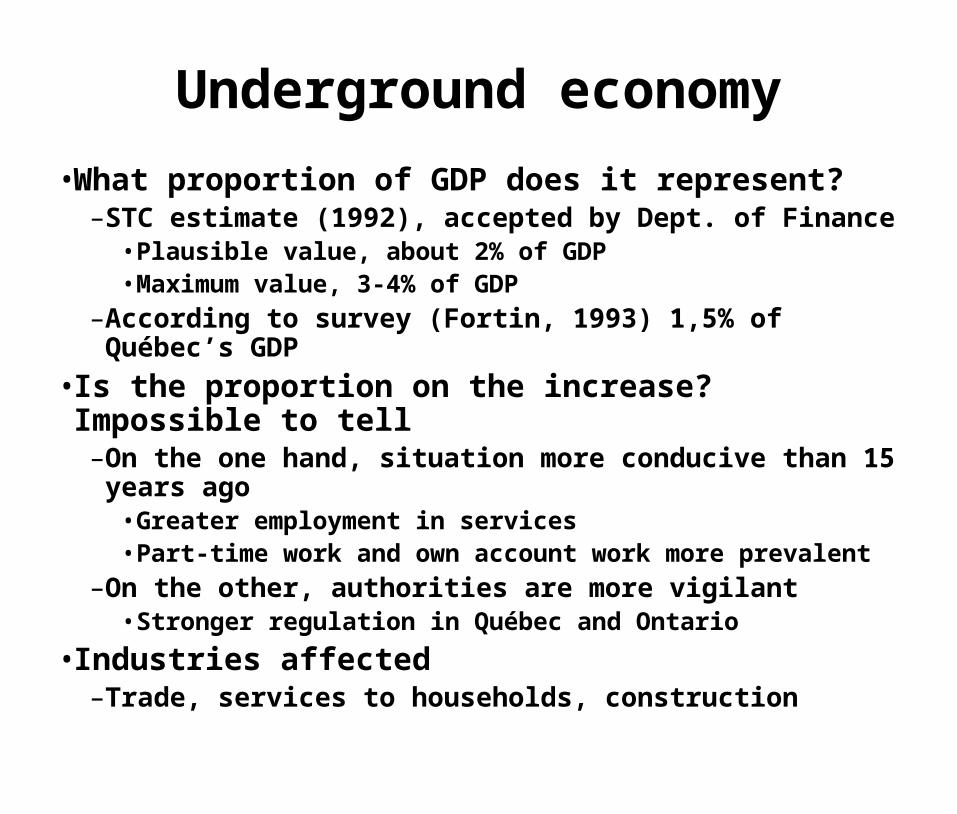
Underground economy
• What proportion of GDP does it represent?– STC estimate (1992), accepted by Dept. of Finance
• Plausible value, about 2% of GDP• Maximum value, 3-4% of GDP
– According to survey (Fortin, 1993) 1,5% of Québec’s GDP• Is the proportion on the increase? Impossible to tell
– On the one hand, situation more conducive than 15 years ago• Greater employment in services• Part-time work and own account work more prevalent
– On the other, authorities are more vigilant• Stronger regulation in Québec and Ontario
• Industries affected– Trade, services to households, construction
Underground economy
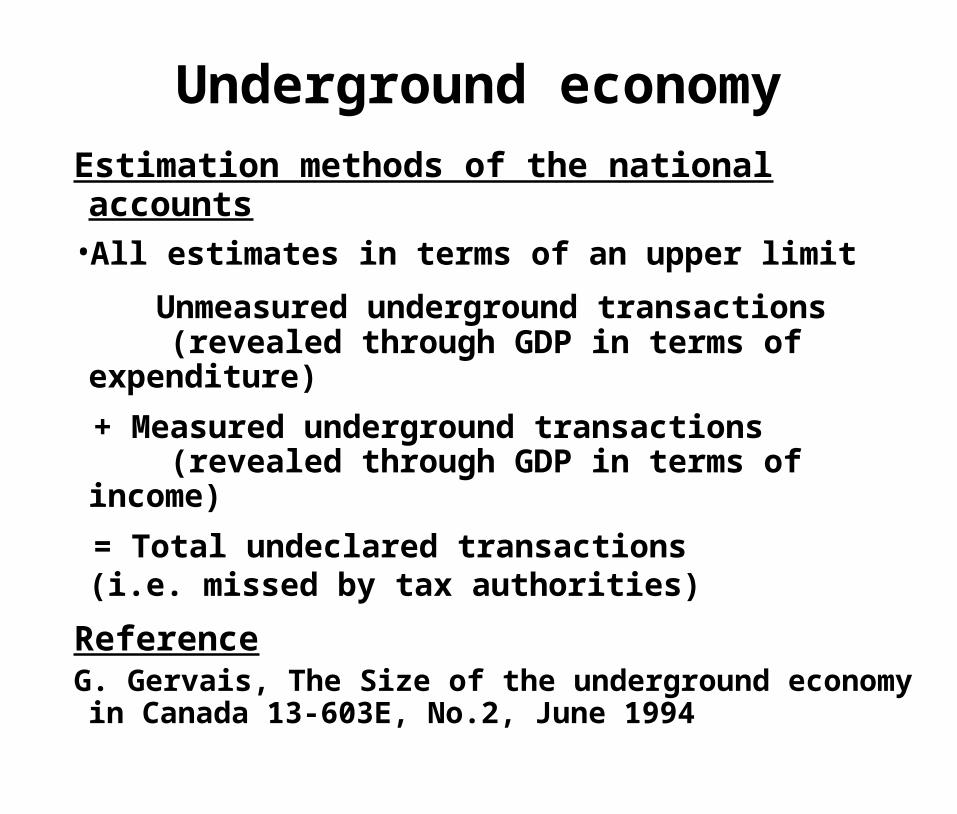
Estimation methods of the national accounts • All estimates in terms of an upper limit
Unmeasured underground transactions (revealed through GDP in terms of expenditure)
+ Measured underground transactions (revealed through GDP in terms of income)
= Total undeclared transactions(i.e. missed by tax authorities)
ReferenceG. Gervais, The Size of the underground economy in Canada
13-603E, No.2, June 1994

The 3 measures of GDP, simplified
1. Production or value added (VA) method• Sum of value added (in each industry)• VA = Output – IC• ∑ VA = Product (Y) = GDP• Also called ‘supply’
2. Income method • Sum of incomes of factors of production = GDP• Wages + profits + mixed income + investment income• So, VA = wages, profits, etc.
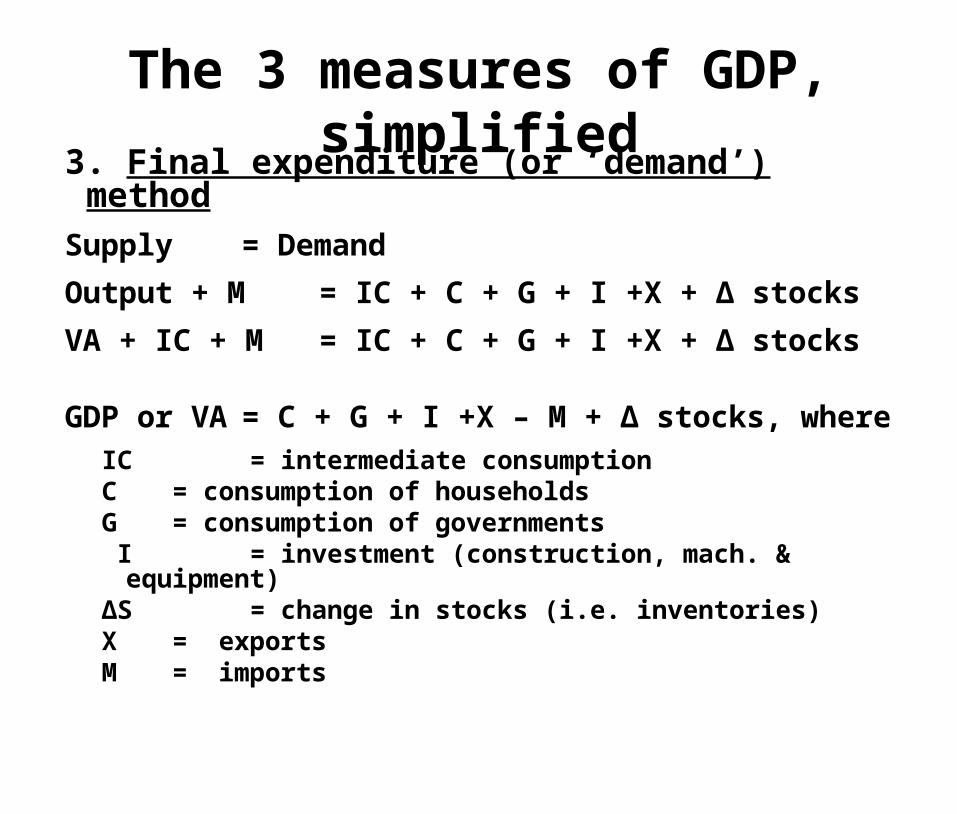
The 3 measures of GDP, simplified3. Final expenditure (or ‘demand’) methodSupply = Demand
Output + M = IC + C + G + I +X + ∆ stocks
VA + IC + M = IC + C + G + I +X + ∆ stocks
GDP or VA = C + G + I +X – M + ∆ stocks, whereIC = intermediate consumptionC = consumption of householdsG = consumption of governments I = investment (construction, mach. & equipment)∆S = change in stocks (i.e. inventories)X = exportsM = imports

The 3 measures of GDP, simplified• Production or value added method
– VA obtained by subtraction, then summation of VAs– By industry
• Income method– By summation– GDP estimated essentially by sector
• Wages and mixed income (households)• Profits (corporations and government enterprises)• Interest and investment income (households and gov’t.)
• Expenditure method-By summation– GDP estimated mostly by sector (except exports and imports)
• Consumer expenditure (households)• Government current expenditure• Investment and stocks (gov’t., businesses and households)
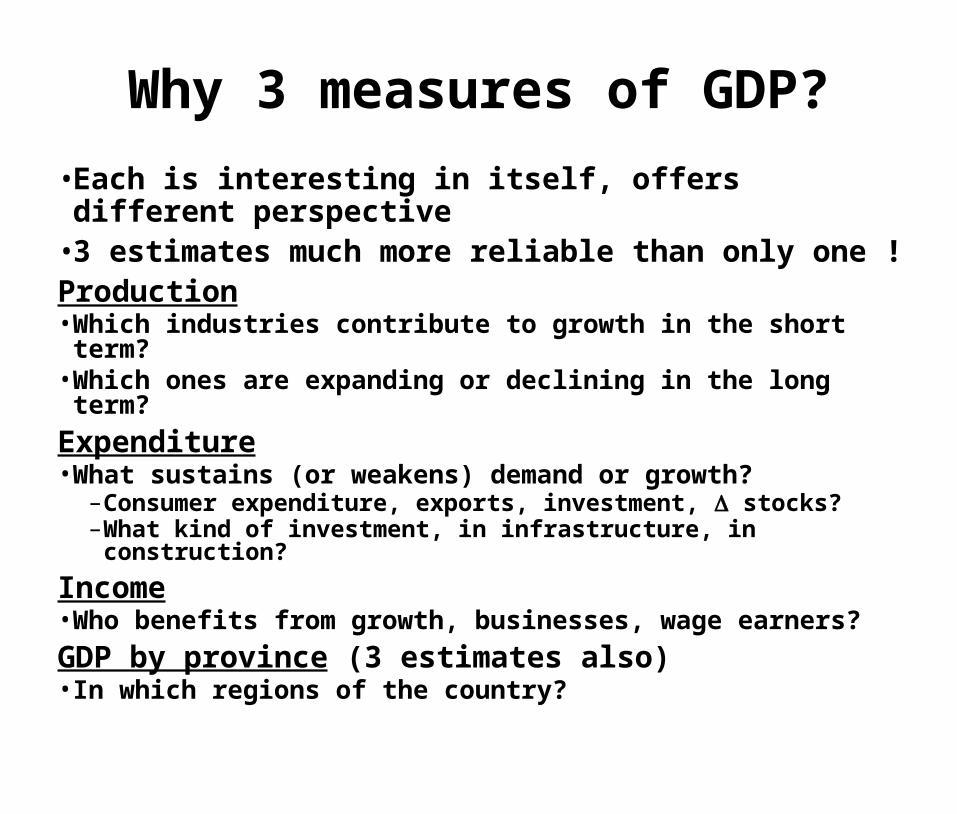
Why 3 measures of GDP?
• Each is interesting in itself, offers different perspective• 3 estimates much more reliable than only one !Production• Which industries contribute to growth in the short term?• Which ones are expanding or declining in the long term?
Expenditure• What sustains (or weakens) demand or growth?
– Consumer expenditure, exports, investment, stocks? – What kind of investment, in infrastructure, in construction?
Income• Who benefits from growth, businesses, wage earners?
GDP by province (3 estimates also)• In which regions of the country?

Production Expenditure Income
Canada X X X United States X X Japan X X Australia X X X New Zealand X X Austria X X1
Denmark X X X2
Finland X X1 X2
France X X1 X2
Germany X X1 X2
Italy X X1
Netherlands X X1
Norway X X1 X2
Spain X X1
Sweden X X Switzerland X X1
Turkey X X United Kingdom X X X 1. Change in stocks mainly residual
2. Operating surplus mainly residual
Source : OECD, 1995
Methods used to estimate quarterly GDP
billion $ %
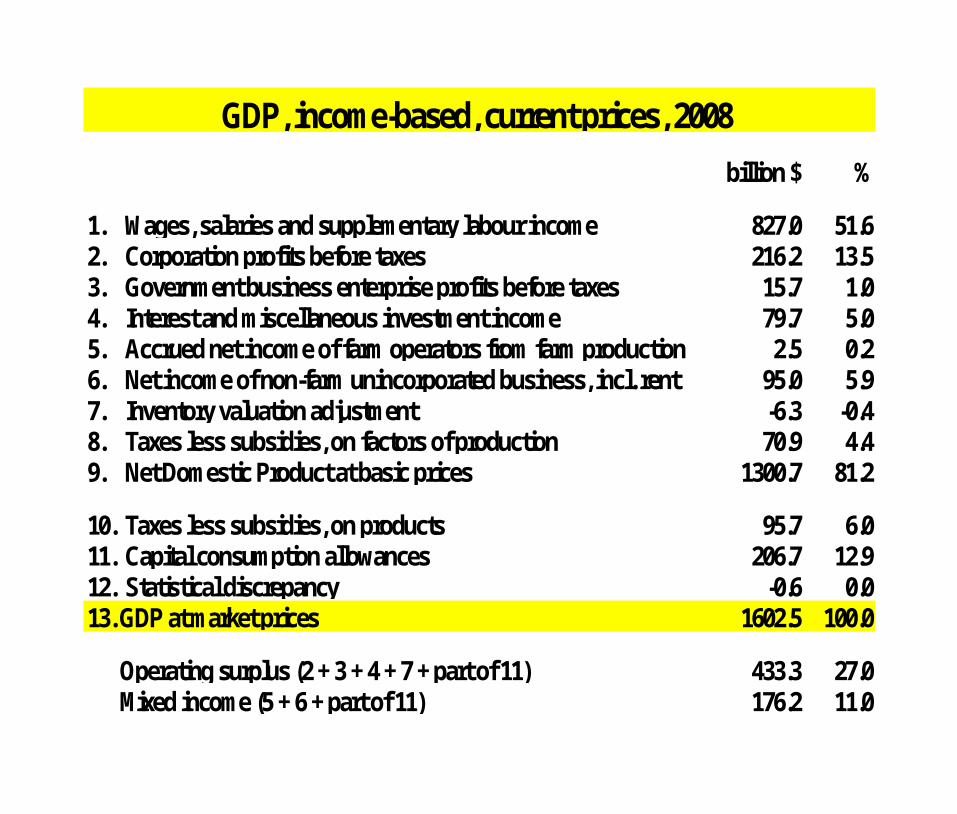
1. Wages, salaries and supplementary labour income 827.0 51.62. Corporation profits before taxes 216.2 13.53. Government business enterprise profits before taxes 15.7 1.04. Interest and miscellaneous investment income 79.7 5.05. Accrued net income of farm operators from farm production 2.5 0.26. Net income of non-farm unincorporated business, incl. rent 95.0 5.97. Inventory valuation adjustment -6.3 -0.48. Taxes less subsidies, on factors of production 70.9 4.49. Net Domestic Product at basic prices 1300.7 81.2
10. Taxes less subsidies, on products 95.7 6.011. Capital consumption allowances 206.7 12.912. Statistical discrepancy -0.6 0.013. GDP at market prices 1602.5 100.0
Operating surplus (2 + 3 + 4 + 7 + part of 11) 433.3 27.0 Mixed income (5 + 6 + part of 11) 176.2 11.0
GDP, income-based, current prices, 2008

billion $ % 1. Personal expenditure on consumer goods and services 893.0 55.7
Durable goods 111.8 7.0Semi-durable goods 71.1 4.4Non-durable goods 216.7 13.5Services 493.4 30.8
2. Government current expenditure on goods and services 314.0 19.63. Government gross fixed capital formation, incl. stocks 51.6 3.24. Business gross fixed capital formation 310.6 19.4
Residential structures 108.1 6.7Non-residential structures 95.6 6.0Machinery and equipment 106.9 6.7
5. Business investment in inventories 7.0 0.4Non-farm 4.9 0.3Farm 2.0 0.1
6. Exports of goods and services 559.8 34.9Goods 489.9 30.6Services 69.8 4.4
7. Deduct: imports of goods and services -534.1 -33.3Goods -442.7 -27.6Services -91.4 -5.7
8. Statistical discrepancy 0.6 0.09. GDP at market prices (1 + 2 + 3 + 4 +5 + 6 - 7 + 8) 1,602.5 100.010. Final domestic demand (1 + 2 + 3 + 4) 1,569.3 97.9
GDP expenditure-based, current prices, 2008

Quarterly GDP and final domestic demand

Ind. 1 Ind. 2Whole econ.
Ind. 1 Ind. 2Whole econ.
1. Production 100.0 100.0 100.0 633 216 2,545• Market production of goods 95.2 2.3 41.6 603 5 1,060• Market production of services 3.1 10.8 50.2 20 23 1,277• Margins on goods purchased for resale 1.7 86.9 8.2 11 188 208
2. Less: Intermediate consumption 71.3 39.0 52.2 452 84 1,328• Raw materials 52.8 4.1 22.6 335 9 575• Utilities 1.9 1.1 1.3 12 2 33• Financial services and rent 2.7 9.0 5.4 17 19 137• Transportation 1.7 1.6 3.8 11 4 96• Professional services, IT 4.0 10.8 5.9 25 23 150• Other goods and services 6.4 12.5 13.3 41 27 339
3. Equals : Value added (1 - 2) 28.7 61.0 47.8 182 132 1,217
4. Plus : Taxes less subsidies on production 625. Equals : GDP at basic prices (3 + 4) (i.e. monthly GDP by industry) 1,279
6. Plus : Taxes less subsidies on products 947. Equals : GDP at market prices (5 + 6) (i.e. GDP income or expenditure) 1,373
Industry 1 : Manufacturing; Industry 2 : TradeNB: Monthly GDP by industry is at constant prices only
% billion $
GDP in terms of production or value added, current prices, 2005

Canada 2002
Canada 2008
Colombia 2007
Goods-producing industries 32.4 29.5 39.0Agriculture, forestry, fishing and hunting 2.2 2.2 9.2Mining and oil and gas extraction 5.0 4.6 5.0Utilities 2.7 2.5 3.0Construction 5.4 6.0 5.8Manufacturing 17.9 14.9 16.0
Service-producing industries 67.6 70.5 61.0Wholesale trade 5.2 5.8Retail trade 5.5 6.1Transportation and warehousing 4.7 4.7 7.5Information and cultural industries 3.6 3.7 n.d.Finance, insurance and real estate 19.0 20.1 13.2
Finance and insurance 8.2 8.7 5.4Owner-occupied dwellings 7.6 8.1Other rentals (incl. paid rent) 3.3 3.3
Professional, scientific and technical services 4.5 4.8 6.0Educational services 4.8 4.9 2.6Health care and social assistance 6.4 6.5 3.2Accommodation and food services 2.4 2.3 1.7All other services (except public administration) 5.8 6.1 3.2
Public administration 5.8 5.6 10.1Value added, whole economy 100.0 100.0 100.0
13.5
7.8
Value added by industry, in %

Main industrial sectors' contributionto total growth – December 2008

GDP, GNP, national income
Various types of income• Income from production, or factor income
– Wages, profit, mixed income (unincorporated businesses)
• Property income – Interests, dividends
• Transfer income (or expenditure) (unrequited)– Taxes, social benefits (contributions), pensions…
• Total, incomes from production = GDP = domestic income• Domestic income + net income from abroad = national income• National income synonym of GNP (obsolete term)• In Canada, GDP exceeds GNP by about 3%

Assets, wealth, saving, deficit…
Economic asset • Tangible or intangible good from which one can draw income• The income (loss) is not constant and varies with the asset
– Profit, interest, royalties…
Wealth• Assets accumulated over time• Estimated in the National balance sheet
Saving, deficit, saving rate, debt• Saving = Total income less current expenditure and transfers• Deficit = Negative saving (current spending current income)• Disposable income = total income less transfers to government• Saving rate = saving / disposable income• Debt = Deficits accumulated over time

Flows and stocksFlows
•Value over a given period– Day, month, year
•Income or expenditure – Wage, pension, exports…– Any payment or receipt…
•Change in stocks (GDP)
•Deficit (expend. income)
•GDP and financial accounts
•Balance of payments – Sales to non-residents– Purchases from non-residents
Stocks•Value at a given date
– December 31, for example
•Wealth– Financial or non-financial assets– Financial liabilities
•Value of stocks
•Debt
•National balance sheet
•International investment position– Assets of Canadian business abroad– Assets of foreign business in
Canada
Nomenclature of assets
Non financial assets• Produced assets (by man)
– Tangible fixed assets• Buildings, engineering works• Machinery and equipment, vehicles• Cultivated assets (orchards, cattle…)
– Intangible fixed assets (software, films… )– Stocks (raw materials, finished products, work in progress)– Valuables (gold, art objects…)
• Tangible non-produced assets– Land (built or cultivated)– Mineral reserves (petroleum, gas, other minerals)– Natural resources (forests, water, fish…)
• Intangible non-produced assets (patents…)

Nomenclature of assetsFinancial assets and liabilities• By instrument
– Monetary gold, reserves of a country in US dollars– Deposits, cash– Loans, short or long term – Shares, bonds– Asset-backed commercial paper, etc.
• Measured at book value and / or market value• Very complex, especially in times of crisis
Financial accounts• Change in financial assets and liabilities
National balance sheet• Value of financial assets/liabilities + non-financial assets

Nomenclature of assets
• Included in the National balance sheet–Tangible fixed assets (buildings, machinery & equipment)– Stocks– Land (built or cultivated)
• Natural assets, estimated by Environment Division– Petroleum, natural gas, coal– Mineral exploited commercially (iron, copper, zinc, etc.)– Forests– Will be added to National balance sheet eventually– Additional table on CANSIM once a year
• Assets not estimated in Canada– Cultivated assets (cattle, orchards…)– Films, art objects, patents...

National balance sheet• Shown for 4 major sectors and some 30 sub-sectors (mainly
financial and government) 1. Households, 2. Admin., 3. Businesses, 4. Non-residents– Banks, insurance co’s, mutual funds, federal, provincial, etc.
• National wealth – Total value of non financial assets in the economy
• National net worth– National wealth less claims held by foreigners– About $180,000 per capita in 2008
• Household debt– Mortgages + consumer credit
• Indebtedness– Households About 20% of net worth in the 2000s, now 25%– Admin. (all) 35% of GDP in 2008 (about 90% in mid-1990s)

Household assets: Canada vs. U.S.

Household debt in % of net worth


Value, volume and price
Value = Quantity (or volume) * price• GDP (and almost all other monetary values) can be expressed at
current or constant prices
• Exceptions: financial values (whether flows or stocks)
Current prices• A value at prices prevailing in the period being referred to• Synonyms: nominal terms, nominal value, nominal
Constant prices• A value at prices prevailing in a fixed reference or base period,
called the base year– Currently, the base year is 2002
• Synonyms: volume, real terms, 2002 prices…

Value, volume and price
• Change of GDP at current prices, combined effect of–Change in the volume of goods and services produced
Change of GDP in volume, or at constant prices
–Change in their sale price
• Economic growth, phenomenon both–Real (increase or decrease in material production)
–Monetary (increase or decrease in prices)
• The most important is real growth

Value, volume and price
• To measure real growth, one must remove the effect of price change in GDP at current prices
• How? By dividing each series of GDP at current prices by an appropriate price index
• This procedure is called deflation – Also applied to retail sales, manufacturing output, etc.
• We deflate GDP ‘production’ (750 series)
GDP ‘expenditure’ (450 series)
• To this end, thousands of price indexes are used
• GDP in terms of income is not deflated

Value, volume and price
• Increase in prices over time : inflation
• Decrease in prices over time : deflation
• Inflation rate:– In theory: change in prices of all products– In practice: change in prices of a very large basket of products– Represented by a global price index
• CPI all items• Implicit price index of GDP (GDP $ current / GDP $ constant)
• Therefore deflation denotes both:– A decrease in prices– Removing price change from a series at current prices

Why carry out deflation?
• On the one hand, inflation skews our perception– Is the increase in value due to prices, to quantities or both?
• Example : gasoline consumption– In nominal terms, + 50% Jan. ‘07 to July ‘08, then big drop– In real terms, stagnating or decreasing
• On the other hand, the inflation rate is important in itself– Fundamental for monetary policy
• So deflation of GDP gives us 2 key variables:– GDP in real terms– More global measure of inflation than the CPI
• Better in theory, not necessarily in practice

Growth and growth ratesEconomic growth• Increase in the volume of output over a given period• Concretely, change in real GDP (i.e. at constant prices)• Constant prices changed to Chain Fisher volume index, 2001
– Expressed as ‘Chained (2002) dollars’ in the tables– Deemed more accurate, but series do not add to totals
• 3 ways to express change in real quarterly GDP– Quarterly change (seasonally adjusted data)
• In relation to preceding quarter– Annualised quarterly change
• Quarterly rate compounded to an annual rate– Year over year change
• In relation to same quarter of previous year

Q 4 2007 Q 3 2008 Q 4 2008Change
in %
1,325.9 1,330.4 1,319.1
Quarterly rate = Q4 2008 / Q3 2008 -0.8
Annualised rate = (Q4 / Q3)*(Q4 / Q3)*(Q4 / Q3)*(Q4 / Q3) -3.4
Annual rate = Q4 2008 / Q4 2007 -0.5
3 ways of expressing the growth rate of real GDPData seasonally adjusted at annual rates, in billion $

Real GDP growth rate in 2008: 3 ways
ChangeAnnualized
change
Year-over-year
change
First quarter 2008 -0.2 -0.9 1.5Second quarter 2008 0.1 0.6 0.7Third quarter 2008 0.2 0.9 0.3Fourth quarter 2008 -0.8 -3.4 -0.72008 0.5 ... 0.5
%
Real GDP, Chained (2002) dollars

Income ExpenditureProduction
(by industry)
Quarterly Quarterly MonthlyGDP at market prices
Current prices X XChained 2002 dollars X2002 Constant prices X
GDP at basic pricesChained 2002 dollars X2002 Constant prices X
Summary: the various estimates of GDP
Standard measure: GDP at market pricesStandard growth rate: Change in GDP at market prices, chained 2002 dollars In green: Official estimateIn yellow: Alternative

Recession, stagnationRecession• Decrease of seasonally adjusted real GDP in at least
2 consecutive quarters• Affecting several categories of demand
– Consumer expenditure, investment, exports…
• … and several industries – Manufacturing, trade, transportation…
• Usually announced by STC as soon as 2nd quarter decrease
Stagnation• No precise definition• Seasonally adjusted real GDP virtually stationary

Recession or stagnation since 1961Recession• 3e quarter 1981 to 4e quarter 1982
– Duration: 6 quarters– Between the 2 peaks: 9 quarters
• 2e quarter 1990 to 1er quarter 1991– Duration: 4 quarters– Between the 2 peaks: 13 quarters
Periods of stagnation– 1st quarter 1970 to 1st quarter 1971– 3rd quarter 1974 to 1st quarter 1975– 3rd and 4th quarters 1976– 2nd and 3rd quarters 1980– 1st to 4th quarter 1986– 2nd and 3rd quarters 1995– 2nd and 3rd quarters 2001 (slight recession in the U.S.)– 1st and 2nd quarters 2008

Annual % change in GDP, 1980-2008

CANSIM - Table directory Table directory provides a table listing… Section – Economic Accounts
Available subsections:•Balance of international payments •Leading indicators •Financial and wealth accounts •Gross domestic product by industry •Income and expenditure accounts •Input-output accounts •Labour income •Productivity measures •Provincial and territorial economic accounts •Government finance, revenues and expenditures •Interprovincial and international trade flows •Tourism account •Satellite account of nonprofit institutions and volunteering

Statistics by subject - Economic accounts …provide up-to-date portraits of national, provincial and terr. economies…, based on internationally recognized set of economic accounting conceptsSubtopicsView resources (Daily releases, data tables, publications, and more ...)Economic accounts (general) Balance of international payments Environmental and resource accounts Financial and wealth accounts Government financial statistics Gross domestic product Income and expenditure accounts Input-output accounts Leading indicators Productivity accounts Tourism account
Featured productsEconomic accounts (overview) National economic accounts Canadian Economic Accounts Quarterly Review Provincial and Territorial Economic Accounts Review Latest Developments in the Canadian Economic Accounts Canadian Economic Observer Teachers & students: Learning resources for business studies…