data literacy cubes guide - nasa · 2020-02-03 · data literacy cubes guide this guide provides...
TRANSCRIPT
Data Literacy Cubes Guide This guide provides resources for students to practice and apply data literacy skills with My NASA Data resources including new Data Literacy Cubes.
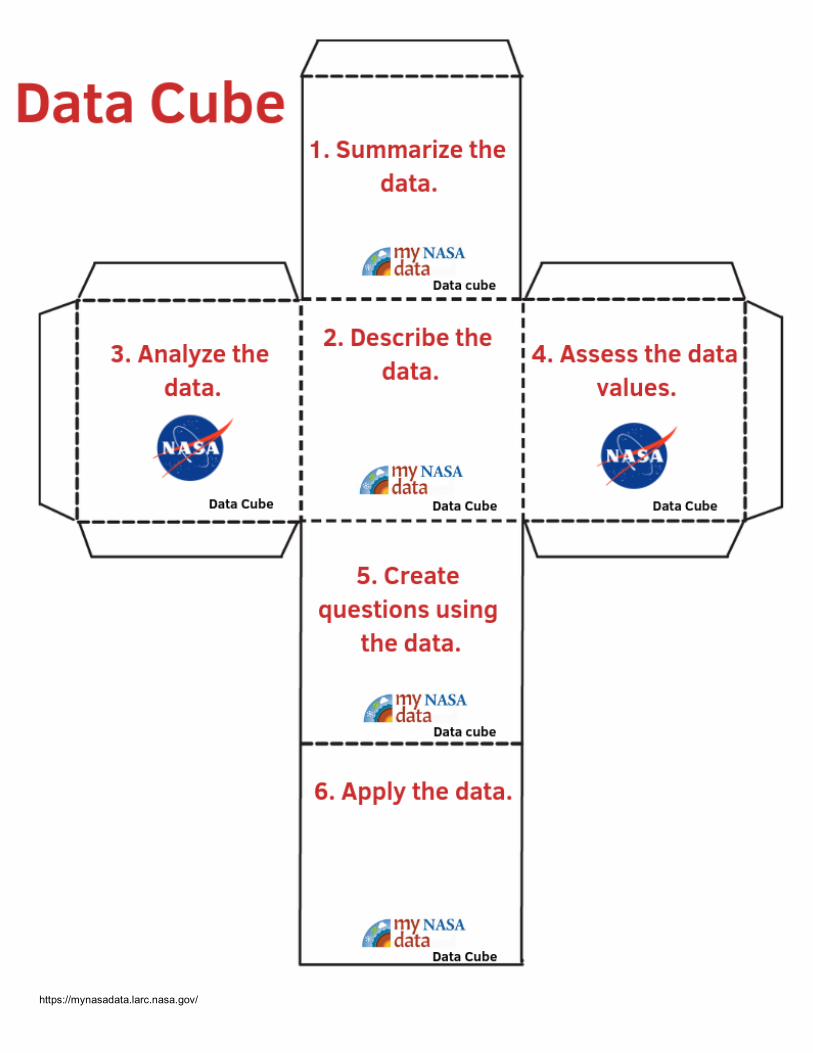
Data Literacy Cube set includes: o Cube templates for three topics
§ Maps § Graphs § Data
o Leveled questions supporting each topic § Advanced § Intermediate § Beginner § English Language Learners
How to use the Data Literacy Cubes and Leveled Questions: o Use the templates, or make cubes with other materials o Select My NASA Data maps, graphs or data for the activity o Roll cubes (or a number cube) and answer appropriate
questions
https://mynasadata.larc.nasa.gov
National Aeronautics and Space Administration
https://mynasadata.larc.nasa.gov
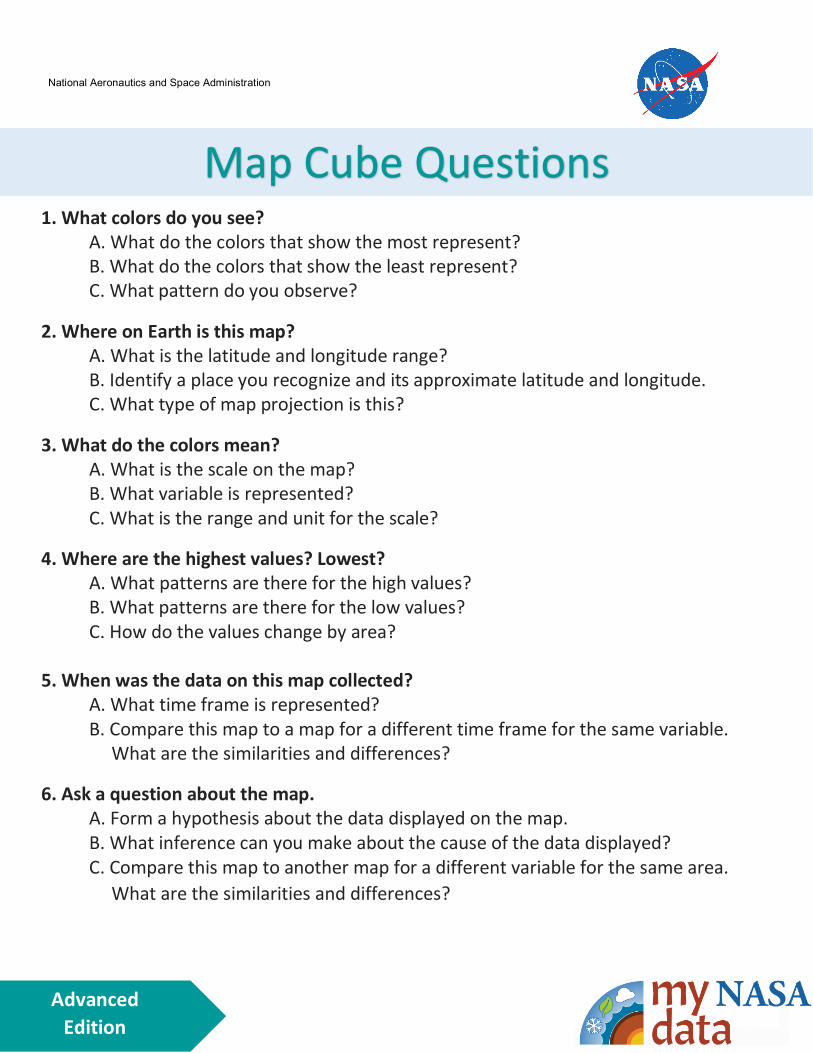
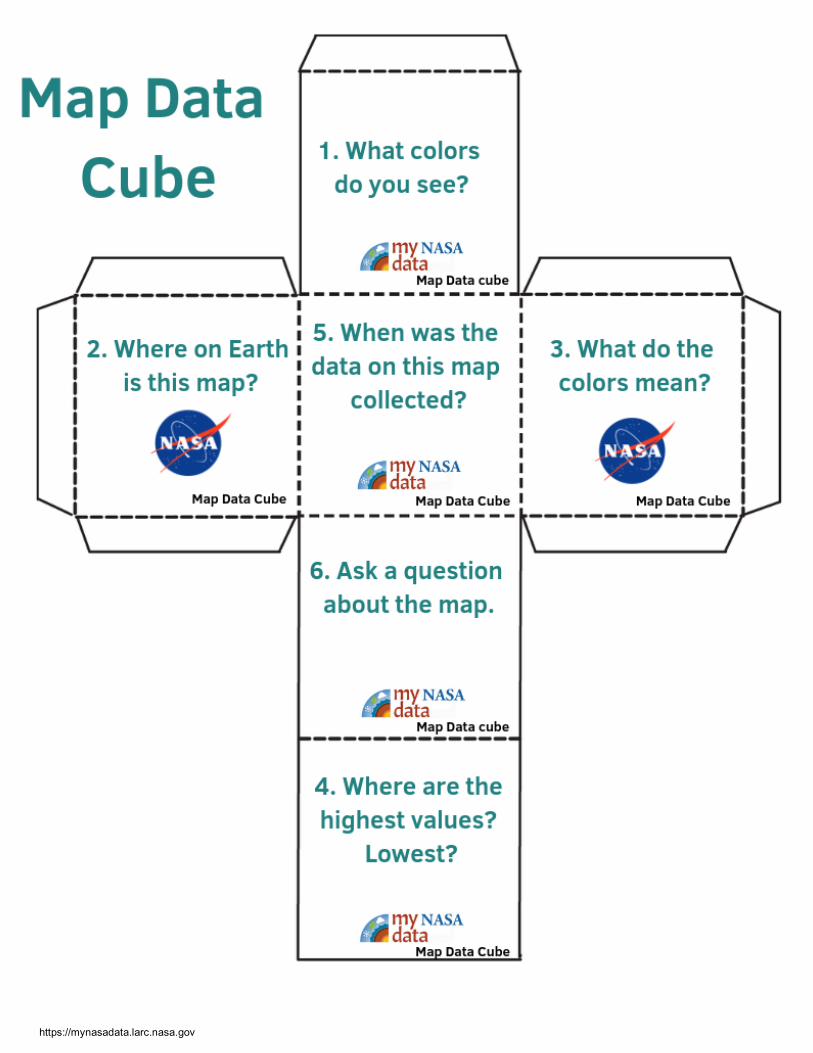
1. What colors do you see? A. What do the colors that show the most represent? B. What do the colors that show the least represent? C. What pattern do you observe?
2. Where on Earth is this map? A. What is the latitude and longitude range? B. Identify a place you recognize and its approximate latitude and longitude. C. What type of map projection is this?
3. What do the colors mean? A. What is the scale on the map? B. What variable is represented? C. What is the range and unit for the scale?
4. Where are the highest values? Lowest? A. What patterns are there for the high values? B. What patterns are there for the low values? C. How do the values change by area?
5. When was the data on this map collected? A. What time frame is represented? B. Compare this map to a map for a different time frame for the same variable. What are the similarities and differences?
6. Ask a question about the map. A. Form a hypothesis about the data displayed on the map. B. What inference can you make about the cause of the data displayed? C. Compare this map to another map for a different variable for the same area. What are the similarities and differences?
Map Cube Questions
National Aeronautics and Space Administration
Advanced Edition
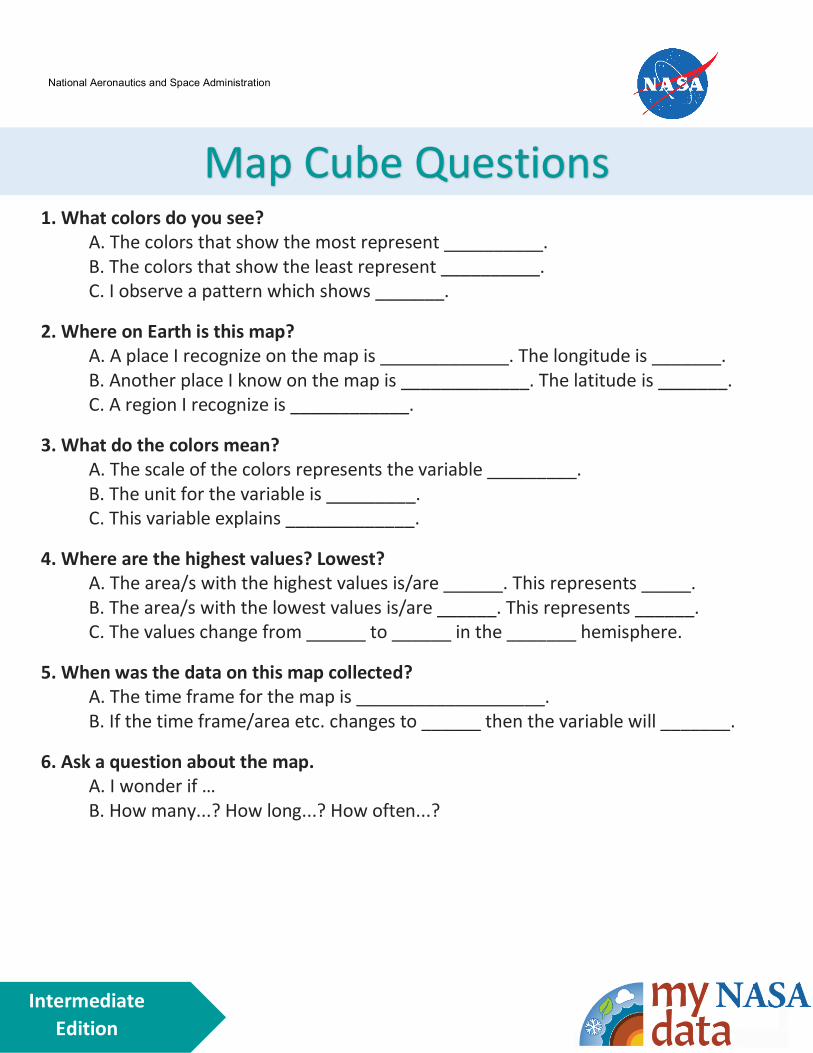
Map Cube Questions 1. What colors do you see?
A. The colors that show the most represent __________. B. The colors that show the least represent __________. C. I observe a pattern which shows _______.
2. Where on Earth is this map? A. A place I recognize on the map is _____________. The longitude is _______. B. Another place I know on the map is _____________. The latitude is _______. C. A region I recognize is ____________.
3. What do the colors mean? A. The scale of the colors represents the variable _________. B. The unit for the variable is _________. C. This variable explains _____________.
4. Where are the highest values? Lowest? A. The area/s with the highest values is/are ______. This represents _____. B. The area/s with the lowest values is/are ______. This represents ______. C. The values change from ______ to ______ in the _______ hemisphere.
5. When was the data on this map collected? A. The time frame for the map is ___________________. B. If the time frame/area etc. changes to ______ then the variable will _______.
6. Ask a question about the map. A. I wonder if … B. How many...? How long...? How often...?
National Aeronautics and Space Administration
Intermediate Edition
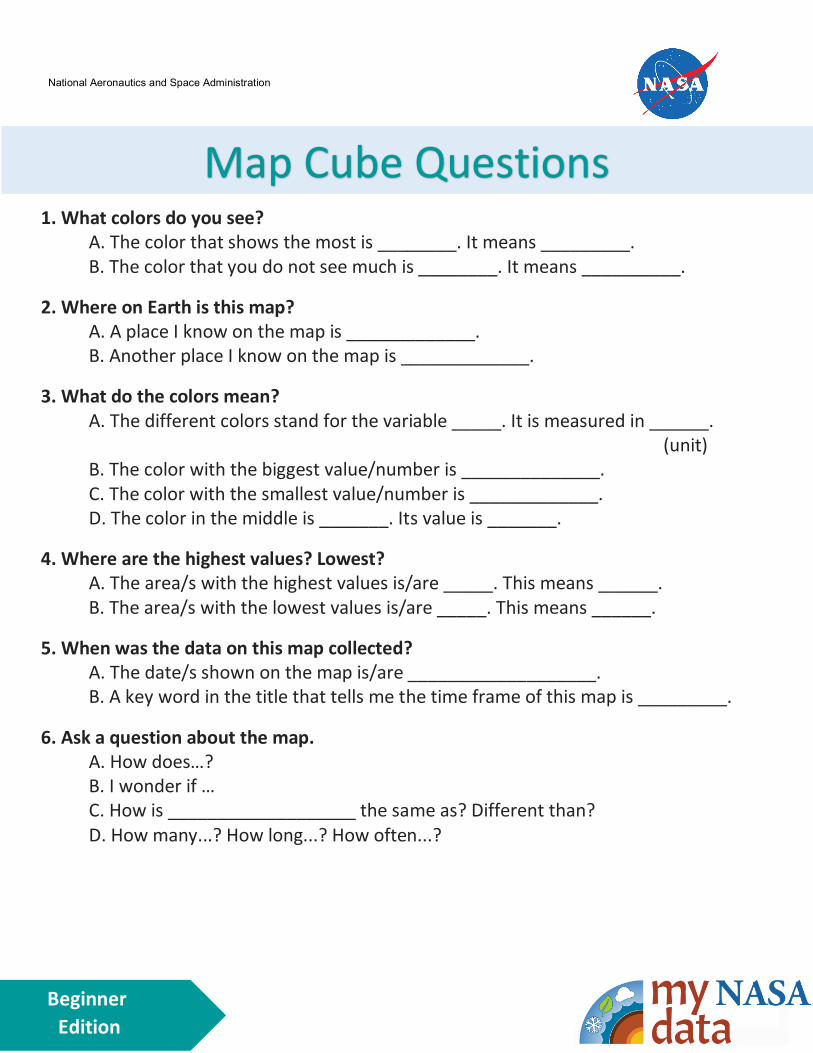
1. What colors do you see? A. The color that shows the most is ________. It means _________. B. The color that you do not see much is ________. It means __________.
2. Where on Earth is this map? A. A place I know on the map is _____________. B. Another place I know on the map is _____________.
3. What do the colors mean? A. The different colors stand for the variable _____. It is measured in ______.
(unit) B. The color with the biggest value/number is ______________. C. The color with the smallest value/number is _____________. D. The color in the middle is _______. Its value is _______.
4. Where are the highest values? Lowest? A. The area/s with the highest values is/are _____. This means ______. B. The area/s with the lowest values is/are _____. This means ______.
5. When was the data on this map collected? A. The date/s shown on the map is/are ___________________. B. A key word in the title that tells me the time frame of this map is _________.
6. Ask a question about the map. A. How does…? B. I wonder if … C. How is ___________________ the same as? Different than? D. How many...? How long...? How often...?
Map Cube Questions
National Aeronautics and Space Administration
Beginner Edition
Map Cube Questions
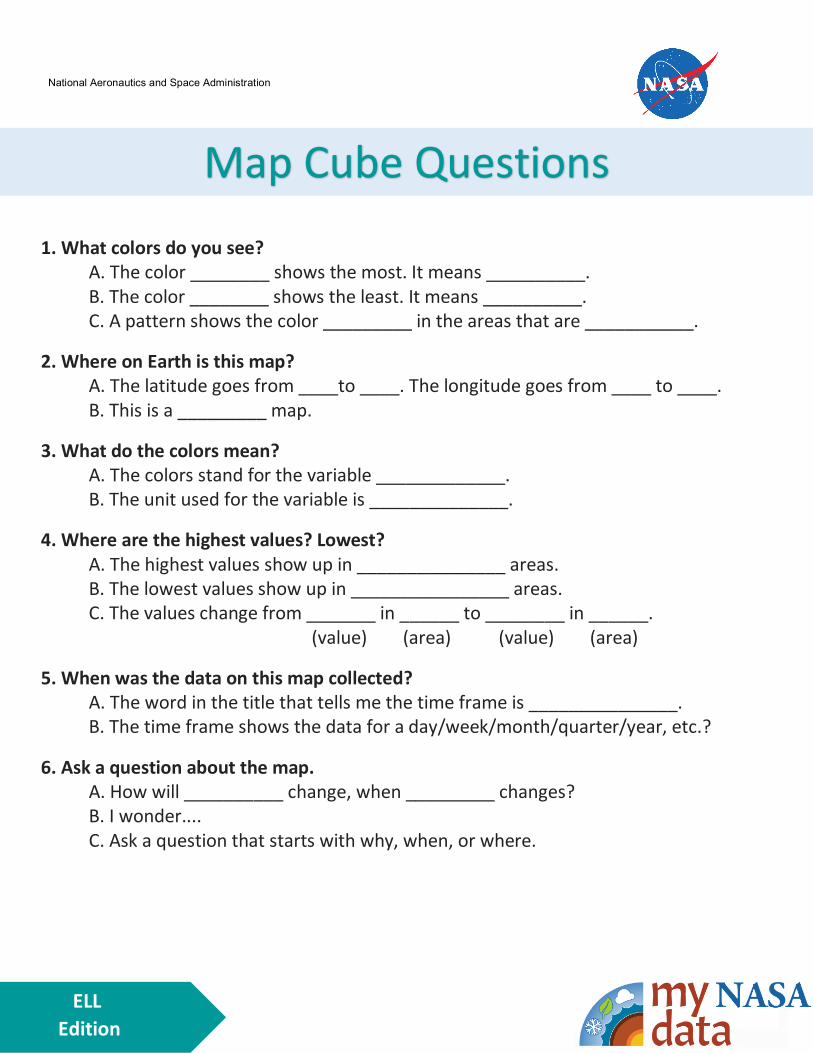
1. What colors do you see? A. The color ________ shows the most. It means __________. B. The color ________ shows the least. It means __________. C. A pattern shows the color _________ in the areas that are ___________.
2. Where on Earth is this map? A. The latitude goes from ____to ____. The longitude goes from ____ to ____. B. This is a _________ map.
3. What do the colors mean? A. The colors stand for the variable _____________. B. The unit used for the variable is ______________.
4. Where are the highest values? Lowest? A. The highest values show up in _______________ areas. B. The lowest values show up in ________________ areas. C. The values change from _______ in ______ to ________ in ______.
(value) (area) (value) (area)
5. When was the data on this map collected? A. The word in the title that tells me the time frame is _______________. B. The time frame shows the data for a day/week/month/quarter/year, etc.?
6. Ask a question about the map. A. How will __________ change, when _________ changes? B. I wonder.... C. Ask a question that starts with why, when, or where.
National Aeronautics and Space Administration
ELL Edition

https://mynasadata.larc.nasa.gov
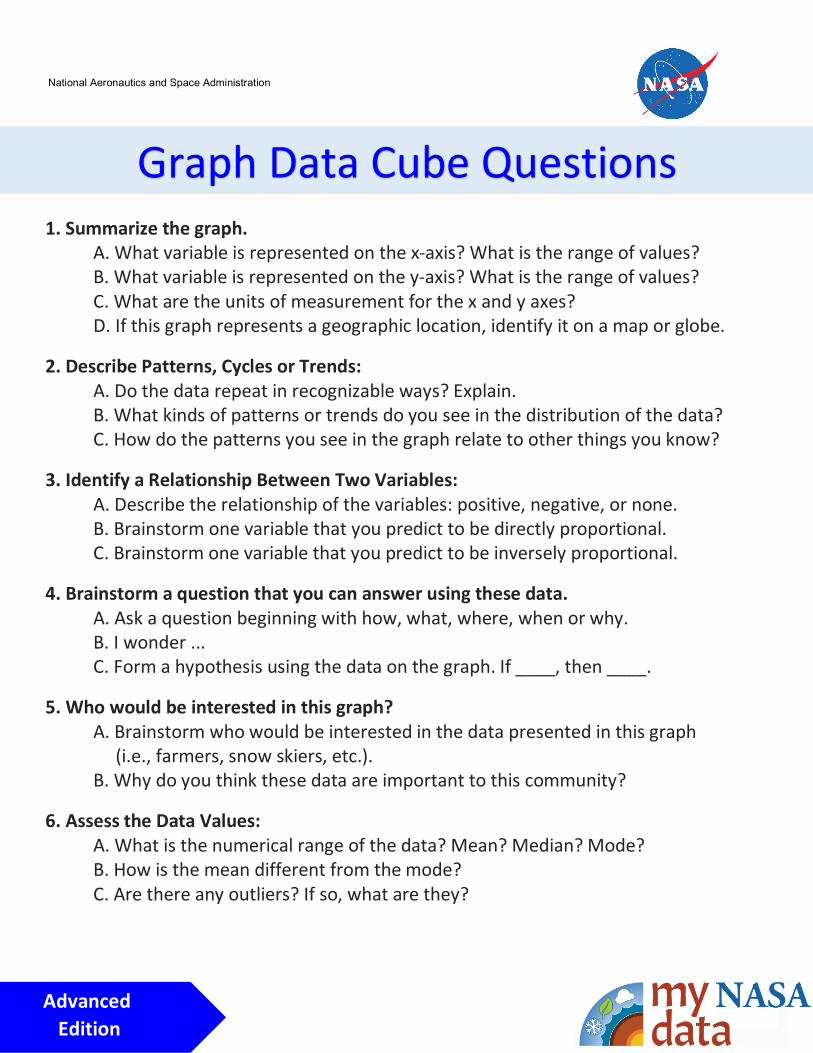
1. Summarize the graph. A. What variable is represented on the x-axis? What is the range of values? B. What variable is represented on the y-axis? What is the range of values? C. What are the units of measurement for the x and y axes? D. If this graph represents a geographic location, identify it on a map or globe.
2. Describe Patterns, Cycles or Trends: A. Do the data repeat in recognizable ways? Explain. B. What kinds of patterns or trends do you see in the distribution of the data? C. How do the patterns you see in the graph relate to other things you know?
3. Identify a Relationship Between Two Variables: A. Describe the relationship of the variables: positive, negative, or none. B. Brainstorm one variable that you predict to be directly proportional. C. Brainstorm one variable that you predict to be inversely proportional.
4. Brainstorm a question that you can answer using these data. A. Ask a question beginning with how, what, where, when or why. B. I wonder ... C. Form a hypothesis using the data on the graph. If ____, then ____.
5. Who would be interested in this graph? A. Brainstorm who would be interested in the data presented in this graph (i.e., farmers, snow skiers, etc.). B. Why do you think these data are important to this community?
6. Assess the Data Values: A. What is the numerical range of the data? Mean? Median? Mode? B. How is the mean different from the mode? C. Are there any outliers? If so, what are they?
Graph Data Cube Questions
National Aeronautics and Space Administration
Advanced Edition
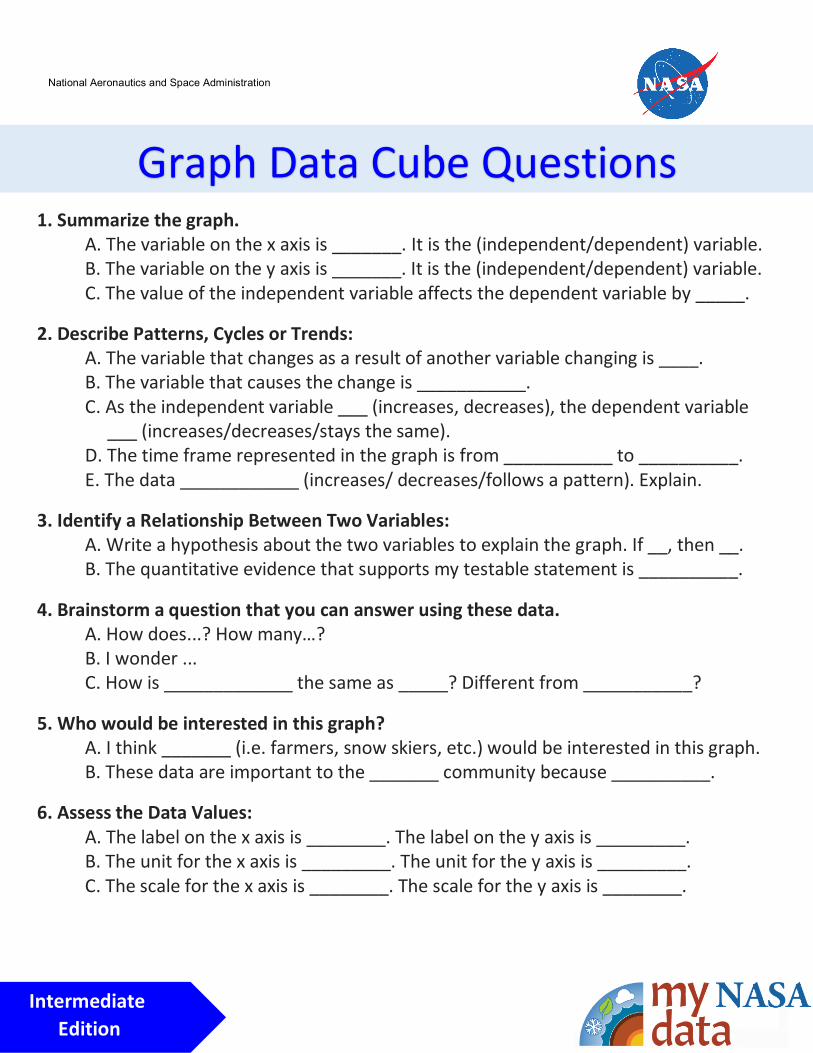
1. Summarize the graph. A. The variable on the x axis is _______. It is the (independent/dependent) variable. B. The variable on the y axis is _______. It is the (independent/dependent) variable. C. The value of the independent variable affects the dependent variable by _____.
2. Describe Patterns, Cycles or Trends: A. The variable that changes as a result of another variable changing is ____. B. The variable that causes the change is ___________. C. As the independent variable ___ (increases, decreases), the dependent variable ___ (increases/decreases/stays the same). D. The time frame represented in the graph is from ___________ to __________. E. The data ____________ (increases/ decreases/follows a pattern). Explain.
3. Identify a Relationship Between Two Variables: A. Write a hypothesis about the two variables to explain the graph. If __, then __. B. The quantitative evidence that supports my testable statement is __________.
4. Brainstorm a question that you can answer using these data. A. How does...? How many…? B. I wonder ... C. How is _____________ the same as _____? Different from ___________?
5. Who would be interested in this graph? A. I think _______ (i.e. farmers, snow skiers, etc.) would be interested in this graph. B. These data are important to the _______ community because __________.
6. Assess the Data Values: A. The label on the x axis is ________. The label on the y axis is _________. B. The unit for the x axis is _________. The unit for the y axis is _________. C. The scale for the x axis is ________. The scale for the y axis is ________.
Graph Data Cube Questions
National Aeronautics and Space Administration
Intermediate Edition
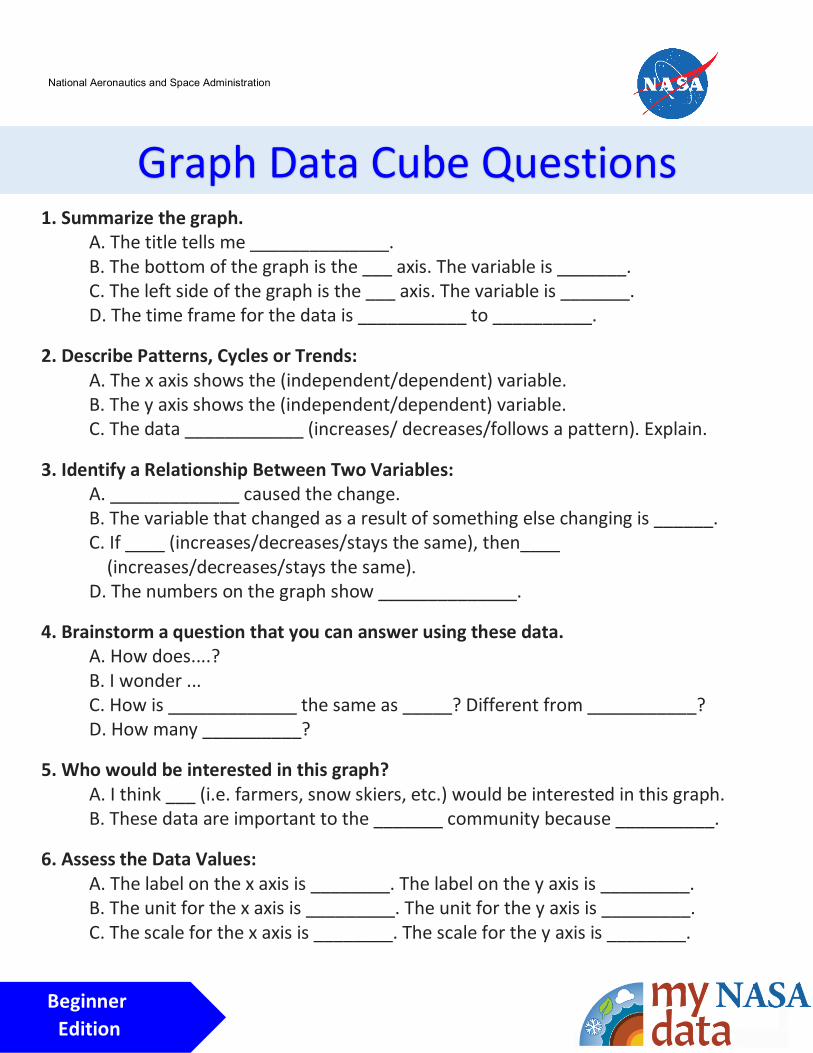
Graph Data Cube Questions 1. Summarize the graph.
A. The title tells me ______________. B. The bottom of the graph is the ___ axis. The variable is _______. C. The left side of the graph is the ___ axis. The variable is _______. D. The time frame for the data is ___________ to __________.
2. Describe Patterns, Cycles or Trends: A. The x axis shows the (independent/dependent) variable. B. The y axis shows the (independent/dependent) variable. C. The data ____________ (increases/ decreases/follows a pattern). Explain.
3. Identify a Relationship Between Two Variables: A. _____________ caused the change. B. The variable that changed as a result of something else changing is ______. C. If ____ (increases/decreases/stays the same), then____ (increases/decreases/stays the same). D. The numbers on the graph show ______________.
4. Brainstorm a question that you can answer using these data. A. How does....? B. I wonder ... C. How is _____________ the same as _____? Different from ___________? D. How many __________?
5. Who would be interested in this graph? A. I think ___ (i.e. farmers, snow skiers, etc.) would be interested in this graph. B. These data are important to the _______ community because __________.
6. Assess the Data Values: A. The label on the x axis is ________. The label on the y axis is _________. B. The unit for the x axis is _________. The unit for the y axis is _________. C. The scale for the x axis is ________. The scale for the y axis is ________.
Beginner Edition
National Aeronautics and Space Administration
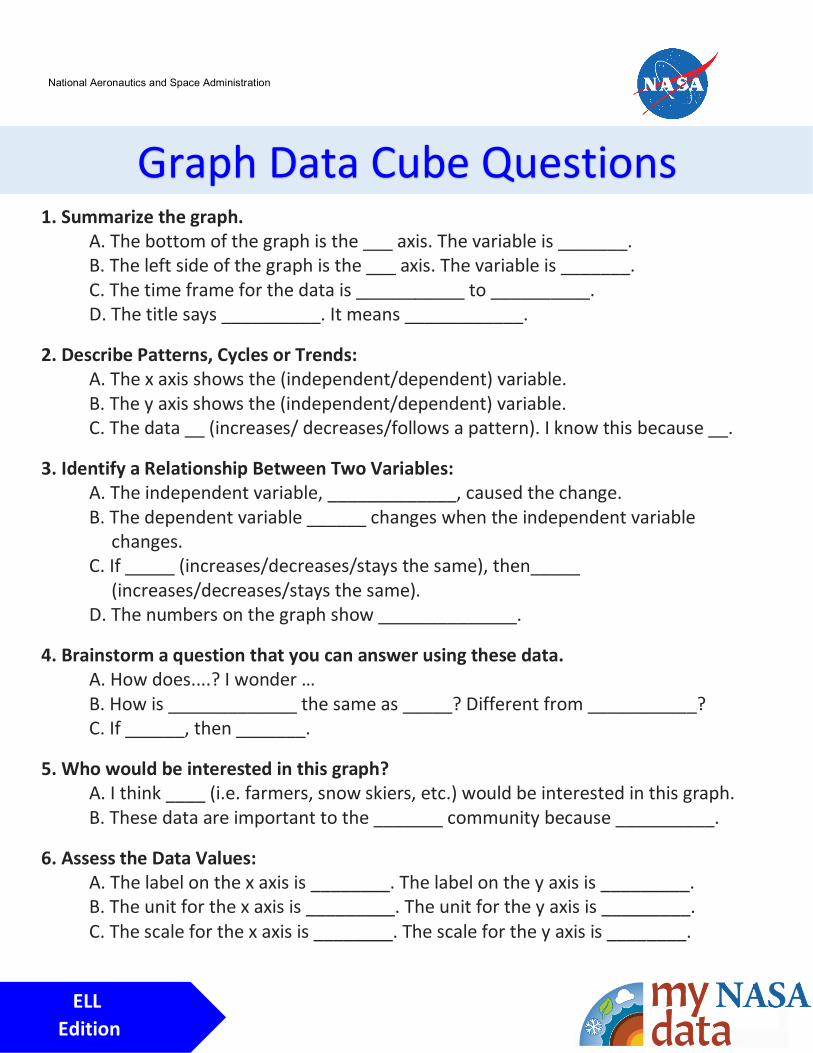
Graph Data Cube Questions 1. Summarize the graph.
A. The bottom of the graph is the ___ axis. The variable is _______. B. The left side of the graph is the ___ axis. The variable is _______. C. The time frame for the data is ___________ to __________. D. The title says __________. It means ____________.
2. Describe Patterns, Cycles or Trends: A. The x axis shows the (independent/dependent) variable. B. The y axis shows the (independent/dependent) variable. C. The data __ (increases/ decreases/follows a pattern). I know this because __.
3. Identify a Relationship Between Two Variables: A. The independent variable, _____________, caused the change. B. The dependent variable ______ changes when the independent variable changes. C. If _____ (increases/decreases/stays the same), then_____ (increases/decreases/stays the same). D. The numbers on the graph show ______________.
4. Brainstorm a question that you can answer using these data. A. How does....? I wonder … B. How is _____________ the same as _____? Different from ___________? C. If ______, then _______.
5. Who would be interested in this graph? A. I think ____ (i.e. farmers, snow skiers, etc.) would be interested in this graph. B. These data are important to the _______ community because __________.
6. Assess the Data Values: A. The label on the x axis is ________. The label on the y axis is _________. B. The unit for the x axis is _________. The unit for the y axis is _________. C. The scale for the x axis is ________. The scale for the y axis is ________.
National Aeronautics and Space Administration
ELL Edition
https://mynasadata.larc.nasa.gov/
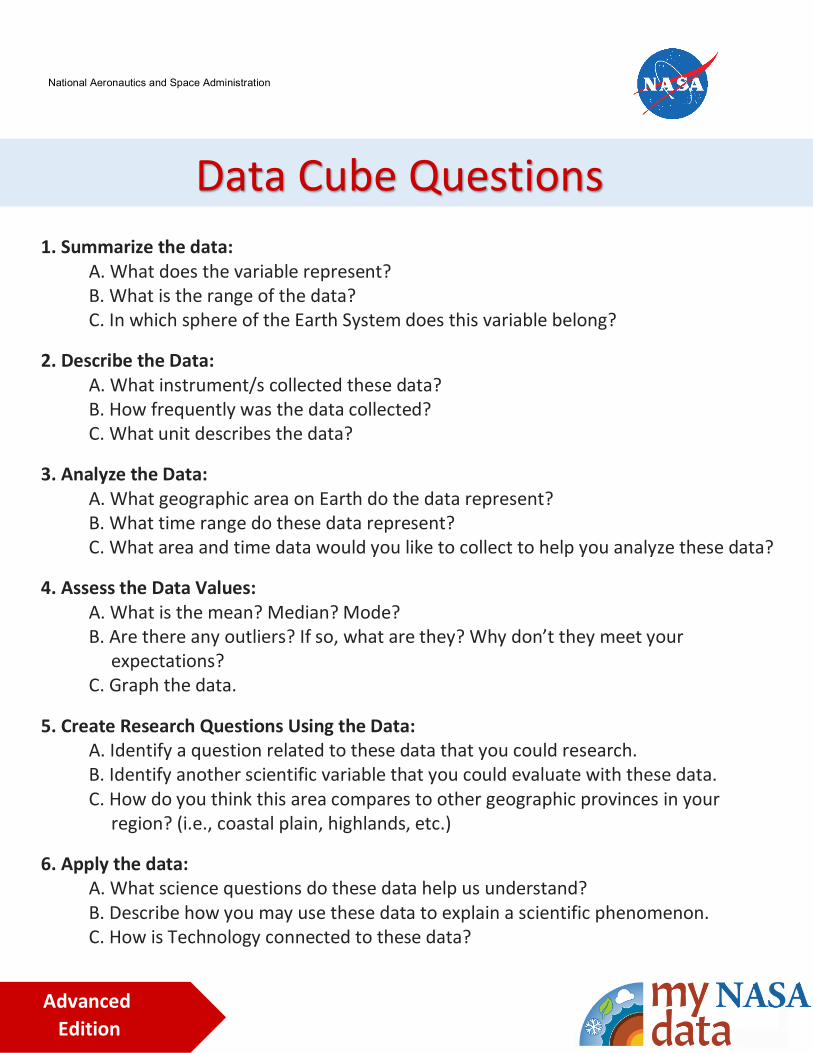
Data Cube Questions 1. Summarize the data:
A. What does the variable represent? B. What is the range of the data? C. In which sphere of the Earth System does this variable belong?
2. Describe the Data: A. What instrument/s collected these data? B. How frequently was the data collected? C. What unit describes the data?
3. Analyze the Data: A. What geographic area on Earth do the data represent? B. What time range do these data represent? C. What area and time data would you like to collect to help you analyze these data?
4. Assess the Data Values: A. What is the mean? Median? Mode? B. Are there any outliers? If so, what are they? Why don’t they meet your expectations? C. Graph the data.
5. Create Research Questions Using the Data: A. Identify a question related to these data that you could research. B. Identify another scientific variable that you could evaluate with these data. C. How do you think this area compares to other geographic provinces in your region? (i.e., coastal plain, highlands, etc.)
6. Apply the data: A. What science questions do these data help us understand? B. Describe how you may use these data to explain a scientific phenomenon. C. How is Technology connected to these data?
D. How is Engineering connected to these data?
National Aeronautics and Space Administration
Advanced Edition

Data Cube Questions 1. Summarize the data:
A. The variable is ____________. It represents _________. B. The range of the data is from __________ to _________. C. The independent variable is _________. The dependent variable is _______.
2. Describe the Data: A. The ________________ instrument collected these data. B. The data are collected every ______ (day, week, month, quarter, year, etc.). C. The unit used to describe the data is ____________.
3. Analyze the Data: A. The geographic area of Earth that is represented is _____________. B. The time range is from _________ to __________. C. This variable belongs in the ____________ sphere of the Earth System.
4. Assess the Data Values: A. The average is ________. The median is ________. The mode is ________. B. The measure of central tendency that best represents the data is the ________ (mean, median or mode). This is because ___________. C. The highest value is ____________. The lowest value is __________.
5. Create Questions Using the Data: A. These data make me wonder ____________. B. I would like to compare __________ with these data because _______. C. How do these data affect another sphere in the Earth System?
6. Apply the data: A. These data help us understand ________________. B. These data can explain the phenomenon of __________ because ________. C. Technology is related to these data because _____________. D. Engineering is connected to these data because _________. E. Graph the data.
National Aeronautics and Space Administration
Intermediate Edition

1. Summarize the data: A. The data are displayed in a (table, chart, etc.) _________. B. The title tells me the data are about __________. C. The data measures ____________. D. The lowest value is __________. E. The highest value is __________.
2. Describe the Data: A. The data were collected using _______ (i.e. thermometer, instrument, etc.). B. The data are collected every ________ (day, week, month, quarter, year, etc.). C. The unit used to describe the data is ____________.
3. Analyze the Data: A. The geographic area of Earth where the data were collected is ___________. B. The time range is from _________ to __________. C. These data show that _________.
4. Assess the Data Values: A. The mean is ________. The median is ________. The mode is ________. B. The highest value is ____________. The lowest value is __________. C. This variable belongs in the ____________ sphere of the Earth System.
5. Create Questions Using the Data: A. I wonder ... B. If ___ changed, I think the data would (increase/decrease/stay the same) ___. C. How does....? D. Why ...?
6. Apply the data: A. These data help us understand ________________. B. These data can explain why ___________. C. Graph the data.
Data Cube Questions
National Aeronautics and Space Administration
Beginner Edition
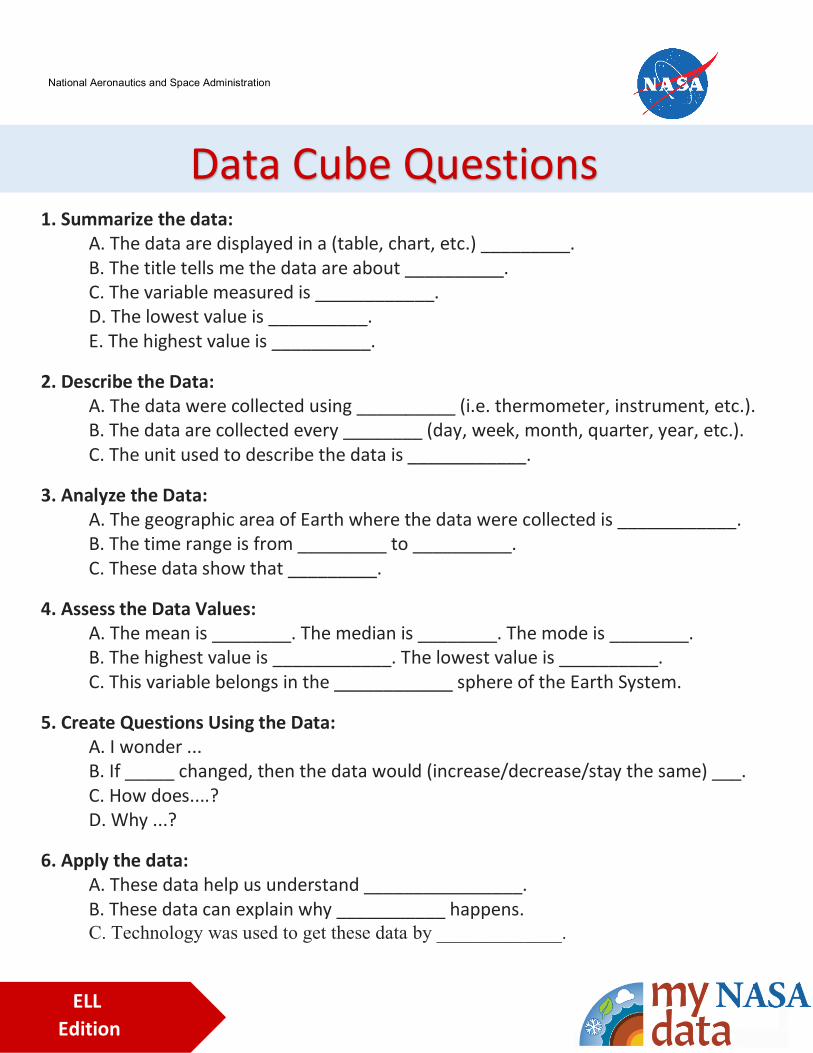
Data Cube Questions 1. Summarize the data:
A. The data are displayed in a (table, chart, etc.) _________. B. The title tells me the data are about __________. C. The variable measured is ____________. D. The lowest value is __________. E. The highest value is __________.
2. Describe the Data: A. The data were collected using __________ (i.e. thermometer, instrument, etc.). B. The data are collected every ________ (day, week, month, quarter, year, etc.). C. The unit used to describe the data is ____________.
3. Analyze the Data: A. The geographic area of Earth where the data were collected is ____________. B. The time range is from _________ to __________. C. These data show that _________.
4. Assess the Data Values: A. The mean is ________. The median is ________. The mode is ________. B. The highest value is ____________. The lowest value is __________. C. This variable belongs in the ____________ sphere of the Earth System.
5. Create Questions Using the Data: A. I wonder ... B. If _____ changed, then the data would (increase/decrease/stay the same) ___. C. How does....? D. Why ...?
6. Apply the data: A. These data help us understand ________________. B. These data can explain why ___________ happens. C. Technology was used to get these data by _____________.
National Aeronautics and Space Administration
ELL Edition