data management & analysis for vaccine- preventable
TRANSCRIPT

DATA MANAGEMENT & ANALYSIS FOR VACCINE- PREVENTABLE DISEASES SURVEILLANCE

01
“Public health surveillance is the continuous and systematic collection, analysis and interpretation of health-related data needed for the planning, implementation and evaluation of public health practice.” [WHO, 1]
➡ There are many ways to conduct VPD surveillance, based on the setting, the characteristics of the diseases and the objectives of surveillance. [WHO, 2]
This document focuses on the general principles of data management that apply to most settings and irrespective of the software being used.
Vaccine- preventable diseases surveillance
➡ The specific objectives of vaccine-preventable diseases (VPD) surveillance include [WHO, 2]:
• Detecting epidemics/outbreaks to inform public health response (e.g. vaccination campaign) • Estimating the burden of disease (e.g. incidence, mortality) • Informing policy decisions (e.g. vaccine introduction, change of schedule) • Setting research priorities (e.g. vaccine development) • Assessing progress towards disease control, elimination, or eradication • Identifying gaps in immunization programmes • Identifying risk factors for a disease • Describing the epidemiology and natural history of the disease

M/F
02 ➡ If the Case Reporting Form (CRF) or Case Investigation Form (CIF) has not yet been designed, check if national or international recommendations exist to define which data elements should be recorded and how. At the global level, recommended data elements are available in the Surveillance Standards for VPD surveillance.[WHO, 2] If the CRF/CIF is already available, use it to extract the list of elements to be collected.
Setting up a data system for VPD surveillance
The World Health Organization (WHO) has developed a number of data manage-ment systems for the surveillance of VPD such as polio, measles, yellow fever, pediatric bacterial meningitis/pneumonia, and rotavirus. These systems also include laboratory components to facilitate the linkage of laboratory data with clinical data. Whether you use a system provided by WHO or not, the following principles should be applied when setting up a data system for VPD surveillance.
➡ Recommendations on how to code data elements may already exist. If not available, apply the following rules when defining the format of data elements to be collected.
• Store only one data element per variable (e.g. first and last names separately) • Do not store the same information in more than one variable • Use codes that have a meaning to avoid data entry errors (e.g. M/F for gender) • Define how to code unknown or missing values as these have different meanings
➡ Identify the future users of the system (e.g. clinicians, nurses, laboratory staff, surveillance officers, data managers), what their role will be and how they will interact with the system.

0
TEST
02➡ For case-based surveillance, define a mechanism to collect and report the absence of cases (“zero-reporting”) as it is important to differentiate the absence of cases from an interruption of surveillance activities. For example, this could be done through a separate dataset summarizing the number of cases for each reporting period. The value 0 would indicate the absence of cases while an empty number of cases would indicate that surveillance was interrupted.
➡ For case-based surveillance (e.g. collection of data at the individual level, as opposed to aggregate surveillance), pay particular attention to the process to create and manage unique case identification numbers (ID) as these are critical for this type of surveillance.
• Clinicians, surveillance officers, and laboratory staff may use different sets of IDs. It is essential to make sure one ID is shared among all staff involved in surveillance so that the data they generate can be linked. Surveillance may work very well on the clinical and laboratory sides but difficulties in linking data because of inadequate case ID management may result in poor quality surveillance data • Define who will generate case IDs, when and how. Ensure that this process allows the case ID to be available to all staff involved in surveillance and to be used on all documents, electronic records and specimens related to the patient • When multiple surveillance sites share or report to the same electronic data system, ensure that there is a process to avoid the use of the same case ID by these different sites. One solution could be to integrate a code associated with each site as part of the case ID • Avoid reusing the same IDs each year. If you do so, integrate the year in the case ID itself to avoid duplicates • A potential format for case IDs could be ISO3CODE_SITECODE_YEAR_XXXXXX but it may include more or different elements when necessary (e.g. province or district codes)
Remember: case IDs CANNOT be missing or duplicated in case-based surveillance
➡ Test the system extensively together with all future users and make appropriate modifications before implementation.

03
Data entry
➡ Before entering data, review the CRF/CIF to ensure that all mandatory variables are filled in adequately. If you notice missing data, errors or inconsistencies, actively follow up with the relevant surveillance staff immediately. When data are not yet available (e.g. lab result, outcome), document these missing elements and follow up at a later date.
➡ Take your time when entering data to ensure accurate data entry.
➡ Regularly stop and check the data you entered, especially if the CRF/CIF is long.
➡ If you are unsure of how to enter a value, check with the data provider. Do not make assumptions.
➡ Enter data on a regular basis; do not wait to receive more cases to enter data as the longer you wait, the more difficult it may be to go back to the patient to obtain missing data elements. This also applies to data received from laboratories which should be linked with clinical data as soon as possible.
➡ Once data have been entered, write the date on the CRF/CIF to keep track of records that were entered.
➡ If available and authorized, keep a copy of the paper CRF/CIF and other records in a safe place. You may also scan documents and keep an electronic copy. Return documents that need to be returned to other departments.
Data entry is the basic but critical process of inputting information into a computer database. Below is a summary of good practices to be applied before, during and after data entry to ensure the accuracy of the data.

04
Data validation & data quality
Producing high quality VPD surveillance data is dependent on the work of many individuals and their ability to work together as a team. Regular meetings should be held between clinicians, nurses, surveillance officers, epidemiologists, laboratory staff, data managers and any other staff involved in surveillance to discuss issues and bottlenecks and to identify solutions.
➡ Routinely run data analyses to identify data validity and consistency errors, such as
• Missing values
• Incorrect coding of categorical variables
• Invalid dates (e.g. wrong format or future dates)
• Invalid numeric values (e.g. not in acceptable range, decimal not allowed)
• Inconsistencies between variables (e.g. age not consistent with dates of birth/onset, date of vaccination before date of birth)
Inconsistencies or errors may be identified at the time of data entry but data managers should also do the following

04
➡ Follow up on invalid or missing information (e.g. laboratory results) to improve accuracy and completeness of the data.
➡ Have someone other than the data entry person (e.g. surveillance officer) verify random records to check the accuracy of data entry against the CRF/CIF.
➡ Provide data quality feedback to all surveillance staff or other data providers so they can review and improve their data processes.
➡ Review data linking issues and identify their causes. The most common cause is the use of different case IDs by clinicians and laboratory staff.
➡ Periodically review the data to identify recurrent problems (e.g. one field always missing). This may indicate that some part of the workflow is not functioning well. Work with all surveillance staff to improve the situation.
➡ Compute data quality indicators relevant to the disease(s) being monitored. For example, the proportion of cases that are laboratory-confirmed is often used to assess the robustness of surveillance data.

05
Data security and confidentiality
➡ Back up your data on a regular basis to prevent data loss in case of hardware or software failure.
➡ If possible, keep your database backups in two different locations (ideally on site and off site, or online if it is allowed).
➡ Ensure you collect data according to national data protection legislation. Storing personal information such as patients’ names may not be allowed.
➡ Set up user rights on the computer or appli-cation/database handling the data to prevent unauthorized access.
➡ Keep multiple previous versions of your database so you can go back and identify when an error occurred.
VPD surveillance databases should be backed up to avoid data loss and protected to maintain patients’ confidentiality.

0
10
20
30
40
50
60
70
80
06
Data analysis
➡ Include a clear title and a legend to describe the content of the chart ➡ Label both axes including units if relevant ➡ Include the date on which the chart was generated and/or the date of the last data update ➡ Where possible, avoid pie charts or 3D graphs that may be more difficult to read.
The epidemiological curve is the most common graph used in disease surveillance. It shows the number of cases of a given disease through time and is thus used to monitor disease patterns (e.g. seasonality) and trends.
Num
ber
of c
onfir
med
mea
sles
cas
es
Month of onset | Based on measles surveillance data as of YYYY-MM-DD
Confirmed measles cases (2016-2018)
In this section, you will find examples of common graphics created using VPD surveillance data to monitor disease trends and patterns or the impact of vaccine introduction. Note that the charts can be used for a variety of different VPDs, but they are not all applicable to all VPDs.
Good practices for building a chart
0
100
200
300
400
500
600
700
40+ years25-39 years15-24 years10-14 years5-9 years1-4 years<1 year
06
Num
ber
of c
onfir
med
mea
sles
cas
es
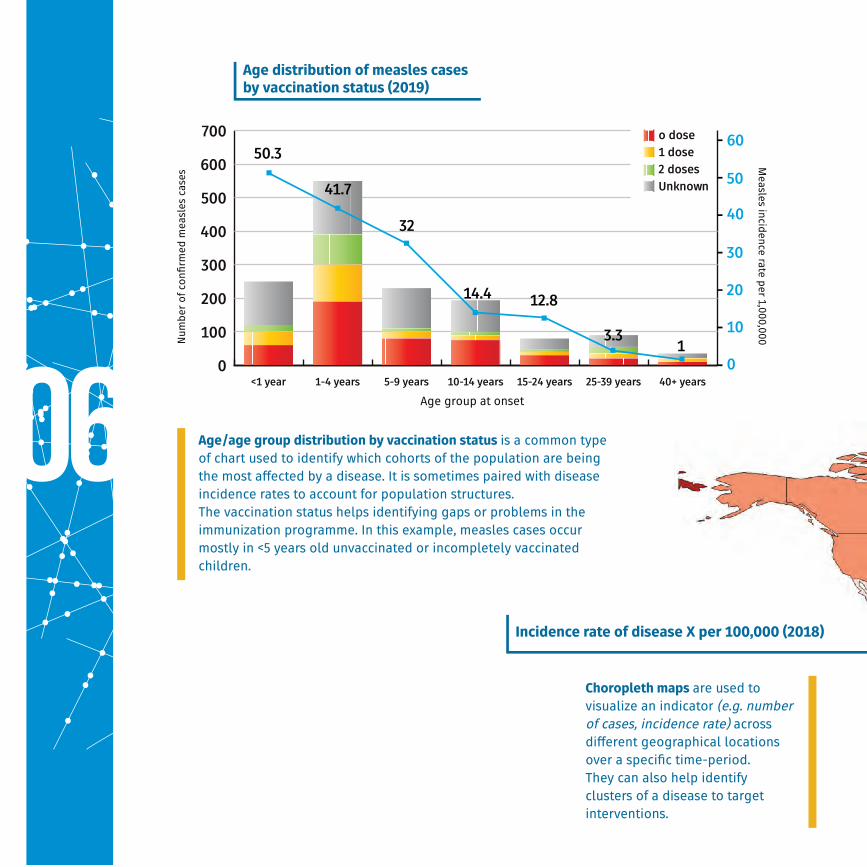
Age distribution of measles cases by vaccination status (2019)
Incidence rate of disease X per 100,000 (2018)
Age group at onset
Measles incidence rate per 1,000,000
Choropleth maps are used to visualize an indicator (e.g. number of cases, incidence rate) across different geographical locations over a specific time-period. They can also help identify clusters of a disease to target interventions.
Age/age group distribution by vaccination status is a common type of chart used to identify which cohorts of the population are being the most affected by a disease. It is sometimes paired with disease incidence rates to account for population structures. The vaccination status helps identifying gaps or problems in the immunization programme. In this example, measles cases occur mostly in <5 years old unvaccinated or incompletely vaccinated children.

0
1000
2000
3000
4000
5000
6000
7000
8000
9000
10000
201520142013201220112010
Pediatric diarrhea cases tested positive for rotavirus
Pediatric diarrhea cases tested negative for rotavirus
44% 44%42%
30% 30%17%
Pathogen positivity charts are often used in syndromic surveillance to compare the frequency of pathogen detection between different groups or in the same group through time. In this example, rotavirus positivity among pediatric diarrhea cases decreased through time, illustrating the impact of vaccine introduction.
Num
ber
of p
edia
tric
dia
rrhe
a ca
ses
Year of onset | Based on rotavirus surveillance data as of YYYY-MM-DD
Rotavirus positivity among pediatric diarrhea cases (2010-2015)
Rate>50 (38 countries or 19%)
10<Rate<50 (47 countries or 24%)
5<Rate<10 (16 countries or 8%)
1<Rate<5 (36 countries or 18%)
Rate<1 (50 countries or 26%)
No data
Not available
“The boundaries and names shown and the designations used on this map do not imply the expression of any opinion whatsoever on the part of the World Health Organization concerning the legal status of any country, territory, city or area nor of its authorities, or concerning the delimitation of its frontiers or boundaries. Dotted and dashed lines on maps represent approximate border lines for which there may not yet be full agreement”
07
Use of the data by WHO
The collection, analysis and dissemination of public health data form a core part of WHO’s mandate. When reported to WHO, VPD surveillance data are used.
➡ To monitor vaccine-preventable diseases trends at regional and global level
➡ To produce country, regional and global surveillance bulletins
➡ To produce burden of disease and immunization coverage estimates
➡ To monitor the impact of vaccine introduction
➡ To inform policy decisions (e.g. Strategic Advisory Group of Experts on Immunization, SAGE)
➡ To monitor immunization goals and targets (e.g. Global or Regional Vaccine Action Plans)
➡ To create country profiles and dashboards (see WHO websites)
08
Useful resources and links
References
• [WHO, 1] World Health Organization (WHO) -Public Health Surveillance
https://www.who.int/topics/public_health_surveillance/en/
• [WHO, 2] Surveillance standards for vaccine-preventable diseases, second edition
https://www.who.int/immunization/monitoring_surveillance/burden/vpd/standards/en/
Global resources
• WHO Immunization & Surveillance Data & Statistics
https://www.who.int/immunization/monitoring_surveillance/data/en/
• Global Health Observatory-Immunization
https://www.who.int/gho/immunization/en/
• Global Vaccine Action Plan
http://apps.who.int/gho/cabinet/gvap.jsp
Regional resources
• African Health Observatory
http://www.aho.afro.who.int/en
• WHO AMRO/PAHO Immunization and Surveillance Data & Statistics
https://www.paho.org/hq/index.php?option=com_content&view=article&id=2043:
data-statistics-immunization&Itemid=2032&lang=en
• WHO EMRO Regional Health Observatory
http://rho.emro.who.int/
• WHO EURO Immunization and Surveillance Data & Statistics
http://www.euro.who.int/en/health-topics/disease-prevention/
vaccines-and-immunization/data-and-statistics
• WHO SEARO Immunization and Surveillance Data & Statistics
http://www.searo.who.int/immunization/data/en/
• WHO WPRO Health Information and Intelligence Platform
https://hiip.wpro.who.int/portal/Dashboards/Immunization.aspx
Acknowledgements
The development of this document was coordinated
by Sebastien Antoni of the World Health Organization,
Geneva (WHO HQ) with the support from colleagues from
WHO Regional Offices and HQ including (in alphabetical order):
Hossam Ashmony (WHO EMRO)
Benjamin Bayutas (WHO WPRO)
Jethro Chakauya (WHO AFRO)
Adam L. Cohen (WHO HQ)
Marta Gacic-Dobo (WHO HQ)
Reggis Katsande (WHO AFRO)
Josephine Logronio (WHO WPRO)
Kayla Mariano (WHO WPRO)
Mick Mulders (WHO HQ)
Aboubacar N’Diaye (WHO AFRO)
Tomoka Nakamura (WHO HQ)
Bernard Ntsama (WHO AFRO)
Claudia Ortiz (WHO AMRO/PAHO)
Carilu Pacis (WHO AMRO/PAHO)
Minal K. Patel (WHO HQ)
Alain Poy (WHO AFRO)
Fatima Serhan (WHO HQ)
Keith Shaba (WHO AFRO)
Md. Sharifuzzaman (WHO SEARO)
Simarjit Singh (WHO EURO)

Design: lcaandco agency Printed in France Icons : Bloomua
The production of this document was supported by GAVI, The Vaccine Alliance