data max for windowstm - unofficial windows reinstallation and
TRANSCRIPT

r
Ft.t,
JOBIN YVON .SPEX
Instrunnewitis a.m.., Inc_
With
Data Max for Windows TM
Hardware Operation ManualUse in Conjunction with DataMax and GRAMS/386®(or GRAMS/32® ) Software Manuals
Instruments S A., Inc.3880 Park AvenueEdison, New Jersey 08820
World Witte Wet)http://www.isainc.com
PDF compression, OCR, web optimization using a watermarked evaluation copy of CVISION PDFCompressor
Part Number - 81004
Copyright May 1995 Instruments S.A., Inc., JOBIN YVON/SPEXDivision. All rights Reserved. Portions of the software described inthis document Copyright © Microsoft Corporation and GalacticIndustries Corporation. All rights Reserved.
No part of this document may be reproduced, stored in a retrievalsystem, or transmitted in any forrn by any means, including electronicor mechanical, photocopying and recording without prior writtenpermission of Instruments S.A., Inc., JOBIN YVON/SPEX Division.Requests for permission should be submitted in writing.
Information in this document is subject to change without notice anddoes not represent a commitment on the part of the vendor.
Revised December 1996.
PDF compression, OCR, web optimization using a watermarked evaluation copy of CVISION PDFCompressor

TABLE OF
CONTENTS
CHAPTER I INTRODUCTION
TERMS AND CONVENTIONS 1-1
WHAT THIS MANUAL CONTAINS 1-3
For More Information 1-4
CHAPTER II WHEN YOUR FLUOROMAX-2ARRIVES
SELECTING A LOCATION 2-1
UNPACKING AND INSTALLING 2-2
CHAPTER III SYSTEM DESCRIPTION
SPECTROFLUOROMETER OPERATION OVERVIEW 3-1Measurement Options 3-2
Optical Components 3-2Illuminator 3-2
Spectrometers 3-3
Sample Compai 3-3
Computer System and Software 3-4
FluoroMax-2 2-3
Computer 2-5
System Interface 2-7
Software 2-7
PDF compression, OCR, web optimization using a watermarked evaluation copy of CVISION PDFCompressor

Xenon Lamp Spectrum 5-1
Water Raman Spectrum 5-4
CHAPTER VI OPTIMIZING YOUR RESULTS
II
Table of Contents FluoroMax-2 with DataMax
CHAPTER IV GETTING STARTED
POWERING UP YOUR SYSTEM 4-1
CALIBRATING THE FLUOROMAX-2 4-2
Using Default Experiments 4-2Excitation 4-2Emission 4-4
Specifying Parameters 4-7
CHAPTER V ACQUIRING DATA
CHECKING INSTRUMENT PERFORMANCE 5-1
IMPROVING THE SIGNAL-TO-NOISE RATIO 6-1
Optimum Integration Time 6-2
Scanning a Region Multiple Times 6-3
Selecting the Appropriate Bandpass 6-3
Smoothing Data 6-3
SAMPLE PREPARATION 6-4
CUVETTE PREPARATION 6-5
COLLECTION METHOD 6-5
OPTIMIZING SIGNAL DETECTOR VOLTAGE 6-6
RUNNING AN UNKNOWN SAMPLE 5-6
Determining the Optimal Excitation and Emission Wavelengths 5-6
PDF compression, OCR, web optimization using a watermarked evaluation copy of CVISION PDFCompressor

CHAPTER VII
ISA-SUPPLIED FILES
DM3000F CORRECTION FACTOR FILE CONVERSION
Excitation
Emission
USER-GENERATED FILES
Emission
Excitation
CORRECTION FACTORS
USING CORRECTION FACTORS 7-15
During Acquisition 7-15
After Acquisition 7-15
CHAPTER VIII ACCESSORIESTrigger Accessory 8-4
Cells 8-4
CUN ettes 8-5
Dewar Assembly 8-6
Fiber Optic Accessories 8-6
Filters and Accessories 8-7
Holders 8-8
Injection Port 8-11
Lamp 8-12
Photomultiplier Tube 8-12
Pola rizers 8-12
Shutter 8-14
Ill
7-4
7-4
7-13
Fluor°Max-2 with DataMax Table of Contents
7-1
7-2
7-2
7-3
PDF compression, OCR, web optimization using a watermarked evaluation copy of CVISION PDFCompressor

CHAPTER I
Introduction
TheFluor°Max-2 is a self-contained, fully operational spectrofluorometer system.
The output of the system is vievved on a PC, and hard-copy documentation can beobtained through the use of an optional printer or plotter. All FluoroMax-2
functions are under total control of DataMax spectroscopy software.
The combination of time-tested, performance-proven hardware with the powerful dataacquisition and manipulation software yields a system suitable for a wide variety ofapplications. The best way to master the system is to read the instruction manuals prior tobeginning. if you are familiar with the operation of the original FluoroMax, you will haveno problem adapting to the FluoroMax-2. If this is your first exposure, you will beamazed at how easy it is to achieve reproducible results.
Terms and ConventionsDataMax software is an easy-to-use WindowsTm-based data acquisition program which,when combined with the power of GRAMS/386R (or GRA,MS/32R), provides superiorpost-processing capabilities. Communication with the software is achieved through theuse of menus, toolbars, and dialog boxes. DataMax adheres to all standard WindowsTM
rules. and the terms used in this manual are consistent with those of otherWindowsTm-based programs.
PDF compression, OCR, web optimization using a watermarked evaluation copy of CVISION PDFCompressor

For additional information regarding operation within a WindowsTM environment, refer tothe WindowsTM user manual delivered with the system.
The DataMax and GRAMS/386C) (or GRAMS/320) manuals which accompanied thesystem contain detailed information about the software.
The convention used in this manual to distinguish different software features, operations,etc. appears in the table below.
Additional symbols and conventions are used to draw your attention to special conditions.They are presented below.
This manual is divided into logical sections of information, and it includes step-by-stepdirections for performing certain operations. A brief description of each chapter follows:
1-2
Item Text Example
Software menuitems
Define Experiment Select Define Experiment
Sequence of menuitems
Define Experiment/Excitation Scan
Execute the menu sequenceDefine Experiment/ExcitationScan
Hardware controls Start Press the START buttonFilenames mcorrect Save the file as MCORRECTField Name Scan Units Toggle Scan Units to
NanometersKeyboard Key enter Press ENTER
SymbollAnnotation Meaning
Hazardous condition(s) exists. Furtherinformation regarding the hazards andprecautions follow the symbol within thisdocument.
Warnings appear wherever there is a danger thatimproper execution of a procedure may damagethe equipment. ISA is not responsible fordamage arising out of improper handling ofequipment.
Warning!
This annotation is used to draw your attentiongeneral information that should be considered. Itappears throughout this document.
Important
Introduction FluoroMax-2 with DataMax
PDF compression, OCR, web optimization using a watermarked evaluation copy of CVISION PDFCompressor

FluoroMax-2 with DataMax Introduction
What this Manual Contains
Chapter 1
Chapter 2
Chapter 3
Chapter 4
Chapter 5
Chapter 6
Chapter 7
Chapter 8
IntroductionGives a broad overview of the software operation,describes how this manual is organized, and outlineswhere information can be found.
When Your FluoroMax-2 ArrivesThis chapter describes unpacking your instrument,connecting the cables and installing the software onyour computer.
System DescriptionDiscusses how the system works, describes eachcomponent and introduces the DataMax software. Youshould read this section for an overall view of thesystem and its operation.
Getting StartedExplains how to initialize your system. Step-by-stepinstructions tell you how to turn on the system andcalibrate the FluoroMax-2 using either the default scanparameters or by specifying the parameters. All usersshould read this section before proceeding.
Acquiring DataExplains why and how to check instrumentperformance, and how to run a sample. We recommendthat you follow these instructions to acquire waterRaman and lamp spectra. This will verify, instrumentperformance and help you to become familiar with theoperation of your FluoroMax-2.
Optimizing Your ResultsIncludes instructions for improving signal-to-noise ratio.hints for sample and cuvette preparation, andsuggestions for selecting the best collection methodbased on fluorescence application.
Radiometric Correction FactorsDisLusses using ISA-supplied files versus user-generated files, for which detailed instructions forgenerating the factors are included, and outlines theprocedures for correcting data during and afteracquisition. You should read this section beforeapplying correction factors to your data.
AccessoriesIn this chapter you will find a description of eachoptional accessory available for the FluoroMax-2.
PDF compression, OCR, web optimization using a watermarked evaluation copy of CVISION PDFCompressor

Introduction FluoroMax-2 with DataMax
Chapters 9, 10 and 11 Maintenance, Troubleshooting, and TechnicalSpecificationsThese sections contain the procedure for changing andfocusing the lamp, describe common problems andremedies, and list specifications of the FluoroMax-2 andthe controlling computer.
Appendix A BibliographyList of useful reference books dealing with variousaspects of fluorescence spectroscopy.
Appendix B GlossaryList of useful terms related to fluorescencespectroscopy.
Appendix C Record of Xenon Lamp Use
Index
For More InformationA DataMax software manual and a GRAMS/386g (or GRAMS/32g) software manual,which together describe all menus, options and parameters in detail, are included withyour system.
Technical support is available for both hardware and software troubleshooting. Prior tocontacting the service department, however, complete the following steps.
If this is the first time the problem has occurred, try turning off thesystem and accessories, and, after a cool-down period, turningeverything back on.
Make sure all accessories attached are properly configured and, whenappropriate, turned on.
Following the instructions in Chapter 4, Acquiring Data (Checking5:).stem Performance), execute a lamp scan and a water Raman scan tomake sure the system is properly calibrated. Print the spectrum foreach and note the peak intensities.
Review Chapter 10, Troubleshooting, to see if your problem isdiscussed.
Visit our Web Site at http://w-ww.isainc.com/fluor to see if yourquestions are addressed in the Systems or FAQs sections of the site.
1-4
PDF compression, OCR, web optimization using a watermarked evaluation copy of CVISION PDFCompressor

FluoroMax-2 with DataMax Introduction
Make an attempt to duplicate the problem and write down the stepsrequired to do so. The service engineers will make an attempt to dothe same with a test system. Depending on the nature of the problem,a service visit may not be required.
If an error dialog box pops up in DataMax, write down the exact errordisplayed.
Access DataMax and from the Help/About menu at ISA Main(Instrument Control Center), locate the Version of software.
Make a note of the instrument's serial number and instrumentconfiguration, including all accessories.
If you require further assistance, and are in the United States, please call us at (908) 494-8660 [FAX no. (908) 549-5157]. Customers outside the United States should contacttheir local distributor.
If you call for assistance, you should be in a position to access the FluoroMax-2 and thecomputer. Be prepared to provide the following information:
Ire Software type and version number.
FluoroMax-2 serial number.
SI List of accessories.
Type of computer (including hard drive space, memoryavailable, etc.) in use.
Vi Description of hardware symptoms or exact errormessage presented by the software.
If you do not have the answers to these questions, technical support will be unable toprovide you with telephone service.
PDF compression, OCR, web optimization using a watermarked evaluation copy of CVISION PDFCompressor

Introduction FluoroMax-2 with DataMax
Keeping
this document and the software manuals near the system and referring tothem often will ensure that all needed information is readily available. Acomplete familiarization with the hardware and the software is necessary to
avoid unneeded senice calls. The system and software are designed to perform optimallywith minimum care and maintenance. If, however, a problem is detected, refer to theTroubleshooting and Maintenance sections of this manual as well as the softwaremanuals prior to contacting the Fluorescence Service Department. Often, the manualswill reveal the cause of the problem and a solution; thereby eliminating the need forservice.
PDF compression, OCR, web optimization using a watermarked evaluation copy of CVISION PDFCompressor

CHAPTER II
When Your FluoroMax-2 Arrives
TheFluoroMax-2 spectrofluorometer system is delivered in a single packing crate.
The crate is designed to provide maximum protection during shipping, whileallowing easy access to the system to facilitate unpacking. If a PC has been ordered
as a part of the system, the PC will be delivered in several clearly labeled boxes. Allcables necessary for installation are included along with manuals.
Examine the shipping boxes carefully. Any evidence of damage should be noted on thedelivery receipt and signed by representatives of the receiving and carrier companies.While Instruments S.A., Inc., is not responsible for damage occurring during transit, thecompany will make every effort to aid and advise.
Selecting a LocationBefore unpacking the FluoroMax-2. select its permanent location. For proper operation.the location should include the following.
1.A stui d table capable of supporting a mass of Surface and Roomat least 65 kg (145 lbs). Requirements
Ambient temperature rangina from 15°C to 30°C (60°F to 85°F) with amaximum fluctuation of +2°C.
An ambient relative humidity of less than 75%; excessive humiditycan damage the delicate optics.
Low dust levels.
Because there are no exhaust fans or connections on the back of the instrument, the rearof the FluoroNlax-2 can be placed directly against a wall. However, for adequate cooling,the vents located on the left and riaht sides of the instrument should not be covered.blocked, or otherwise obstructed.
Al-U-10112h proper physical parameters and environment areessential to the operation of the spectrofluorometer, the Electrical Requirements
system's electrical requirements must also he taken intoconsideration.
PDF compression, OCR, web optimization using a watermarked evaluation copy of CVISION PDFCompressor

When Your FluoroMax-2 Arrives FluoroMax-2 with DataMax
The FluoroMax-2 requires a line voltage of 110'V/60Hz or 220V/50Hz. The line voltagemust be maintained to within ±5%.
Instruments S.A., Inc., is not responsible for damage due to line surges and voltagefluctuations. A surge protector is strongly recommended for minor power fluctuations.For more severe voltage fluctuations, a generator or an uninteruptible power supply(UPS) is suggested. Improper line voltages can severely damage the equipment.
Your instrument is equipped with a three-conductor power cord that is connected to thesystem frame (earth) ground. This ground provides a return path for fault current due toequipment malfunction or external faults. For all instruments, ground continuity isrequired for safe operation. Any discontinuity in the ground line can make the instrumentunsafe for use. Do not operate this system from an ungrounded source.
The following list contains all of the components which must be connected to an ACpower source.
ComputerPrinter (optional)MonitorFluoroMax-2
Make sure enough outlets are available in the selected installation area prior to setting upthe system.
Unpacking and InstallingOnce a location has been decided upon, unpack and assemble the equipment. To avoidexcessive moving and handling, the equipment should be unpacked as close as possible tothe selected location.
Warning!
The spectrofluorometer system is a delicate instrument. Mishandling mayseriously damage its components.
It is important to note that many public carriers will not recognize a claim for concealeddamage if it is reported later than 15 days after delivery. In case of a claim, inspection byan ag.ent of the carrier is required. For this reason, the original packing material should beretained as evidence of alleged mishandling or abuse. While Instruments S.A., Inc.,assumes no responsibility for damage occurring during transit, the company- will make
every effort to aid and advise.
Follow the instructions presented below to unpack and assemble the system.
2-2
PDF compression, OCR, web optimization using a watermarked evaluation copy of CVISION PDFCompressor

FluoroMax-2 with DataMax When Your FluoroMax-2 Arrives
RuoroMax-2The spectrofluorometer system is contained in a single packing crate. Upon opening thecrate, you will find:
When the instrument is removed from the crate, it will need to be temporarily rested on asturdy surlace in such a way as to allow access to the shipping bolts beneath the unit. Anarrow table or bench is recommended, and the instrument should be placed crosswise onthe surface. Make sure this surface is available prior to removing the Fluor°Max-2 fromthe packing crate.
Proceed w ith the following unpacking instructions.
Carefully ply off the top of the FluoroMax-2 shippingcrate.
Remove all inside braces.
Using the two canvas straps (and a coworker or two),carefully lift the instrument from the crate and rest it ona sturdy surface, exposing all shipping bolts.
Package Contents
QtY. Item
Fluor°Max-24 Leveling legs
Communication cablePower cordBoot disk
PDF compression, OCR, web optimization using a watermarked evaluation copy of CVISION PDFCompressor

When Your FluoroMax-2 Arrives FluoroMax-2 with DataMax
Important
To computer(RS232)
Remove the four shipping bolts from the underside of theplywood platform.
Slide the plyvvood platform out of the way.
Install the four leveling legs in the bottom plate of theFluoroMax-2.
To protect the table from scratches, place a footpad onthe bottom of each leveling leg.
Place the instrument in its permanent resting spot.
Level the spectrofluorometer.
Remove the safety disk from the floppy drive and insertthe boot disk.
Inspect for previously hidden damage and notify thecarrier and Instruments S.A., Inc., if any is found.
If damage is detected. DO NOT operate the unit
Check the packing list to verify that all components andaccessories are present.
Plug one end of the power cord into the proper receptacleon the left side (facing the unit) of the spectrofluorometer.
Fuse &AC Power
PDF compression, OCR, web optimization using a watermarked evaluation copy of CVISION PDFCompressor

FluoroMax-2 with DataMax When Your FluoroMax-2 Anrives
Plug one end of the communication cable into theconnector (COM1) on the left side panel of theFluoroMax-2 (near the power cord).
If your system includes the Trigger accessory, plug oneend of the trigger cable into the remaining FluoroMax-2connector.
Allow the unconnected ends of the cables to dangle freely;they will be connected in a later step.
After the instrument is unpacked and placed in its permanent location, it must beconnected to the computer.
ComputerThe information gathered by the spectrofluorometer system is both displayed andcontrolled by the PC (and the driving software). The PC used may be purchased fromInstruments S.A., Inc., or another supplier. In any event, however, the computer and itsaccessories will be delivered with assembly instructions. The following instructions aregeneral. For detailed infoimation, refer to the documentation delivered with the computer.
The computer system is generally packed in two boxes. One box contains the CPU (heartof the system) and the other contains the monitor. It is also possible that you havereceived a printer or a plotter with the system. If so, it is packed in a separate box. InGeneral. the contents of the containers include
Package Contents
1 Mouse
As an option, a printer ma.' be included with the system.
The location of the computer (relative to the FluoroMax-2) is restricted by the length ofthe connecting (RS-232) cable. The computer should be placed on a table next to thespectrofluorometer system close enough so that the connecting cable is not drawn taut.but far enough away to minimize the danger of inadvertent spills ruining the computer.
QtY. Item
CPUColor monitorPower cablesKeyboard
PDF compression, OCR, web optimization using a watermarked evaluation copy of CVISION PDFCompressor

When Your FluoroMax-2 Arrives FluoroMax-2 with DataMax
To unpack and assemble the computer system,
I. Open the box containing the CPU.
Remove the CPU from the box and place it where it willbe permanently located.
Remove the safety disks from the floppy drives and putthem in a safe place. If the system ever has to be shippedor relocated, these safety disks will be needed.
Remove the keyboard from the box and insert the roundconnector in the round receptacle on the CPU.
Remove the power cord from the box and insert thethree-prong connector in the three-prong receptacle atthe rear of the computer.
Carefully remove the monitor from its box.
Rest the monitor on the top of the CPU (unless it is atower case).
AC Powe.
Keyboard, Mouseand MonitorConnections
NTITERITIN 11
LI° Printer
COM2 C OM I
To FluoroMax-2
May be'connl:etedto ISA accessory
RS232To Computer
2-6
Remove the power cord from the box, and insert thethree-prong plug into the rear of the monitor.
The free end of the cable which is captive to the monitorshould be inserted into the connector at the rear of thecomputer.
Tighten the thumbscrews/screw s on the cable to makesure a secure fit is achieved.
AC PowerTrigger Accessoly
PDF compression, OCR, web optimization using a watermarked evaluation copy of CVISION PDFCompressor
FluoroMax-2 with DataMax When Your FluoroMax-2 Arrives
If a printer accompanied the system,
Unpack the printer and assemble the componentsaccording to the instructions in the printer manual.
Using the cable that arrived with the printer, attach theprinter to the appropriate connector at the rear of theCPU.
System InterfaceWith all the equipment unpacked and the cables attached, the only steps remaining are tointerface the computer and spectrofluorometer and to supply power to the individualcomponents.
To interface the system,
Attach the free end of the communication cable danglingfrom the side of the spectrofluorometer, to COM1 (firstserial port) of the computer.
Plug the pov er cords from the monitor, computer,spectrofluorometer, and the printer into properlygrounded receptacles.
If a Trigger box accessory is included, attach the free endof the Trigger box cable to the Trigger box.
Install any accessories that arrived Ni it h the system usingthe instructions that accompanied the accessoty. (Refer toChapter VIII for a detailed list of accessories.)
Supplying power to the system is the final phase in the hardware assembly procedure.The spectrofluorometer is now completely assembled and ready for the next phase.
SoftwareThe spectrofluorometer system is controlled by the DataMax spectroscopy softwareoperatinu within the WindowsTm environment. If you have purchased the computer andsoftware from ISA, the software installation has already been performed. If youpurchased the computer from a different source, you will have to perform the installation.Detailed software installation instructions can be found in the DataMax software manual.The instructions contained in this section are general.
Before the DataMax spectroscopy software can be installed. however, DOS (Version 3.2or higher) and WindowsTM (Version 3.1) must already be installed and operatingproperly. Refer to the DOS and WindowsTM manual that came with the computer forinstallation instructions.
PDF compression, OCR, web optimization using a watermarked evaluation copy of CVISION PDFCompressor
When Your FluoroMax-2 Arrives FluoroMax-2 with DataMax
If you are unsure what version of DOS is installed on your system,
Access the CAPrompt.
Type "ver" and press ENTER.
The DOS version will be written to the screen.
The DataMax software is supplied on several disks. The disks are sequentially numberedand during the installation procedure, you will be prompted to insert the appropriate diskinto the floppy drive.
To install the DataMax spectroscopy- software,
Turn on the computer.
Insert Disk 1 into the floppy drive (either A: or B:,depending on the configuration of the computer).
Disk 1 contains a program that copies the files from the floppy disks to your hard diskand creates necessary subdirectories.
Run the installation program by
Executing the SETUP file on Disk 1.
The computer will access the floppy drive, begin to read the files, and write informationto the screen. You will see an "Installing ISA" message at the beginning of theinstallation procedure.
Once the installation begins, you will be given an opportunity to customize theinstallation, Follow the instructions on the screen to complete the installation.
For detailed information about installing, launching and operating DataMax forWindowsTM. refer to the software manual.
Theassembly of the hardware and installation of the software are simple procedures
which combined should not take more than an hour. This one hour of labor,carefully planned. yields a complete spectrofluorometer system capable of
producing accurate reproducible fluorescence and phosphorescence data. If problems areencountered durina installation, or subsequent to installation, refer to the Troubleshootingand Maintenance sections of this manual for guidance.
PDF compression, OCR, web optimization using a watermarked evaluation copy of CVISION PDFCompressor

CHAPTER II
System Description
Thissection describes the basic operating principles of the FluoroMax-2
spectrofluorometer, its components, and the DataMax software, through whichyou specify the parameters of your experiment, display and process data, and
perform data management functions.
The electronic and optical components of the FluoroMax-2 are in separate compartmentswithin the same unit to allow for easy assembly and servicing.
Spectrofluorometer Operation OverviewLight from the 150W xenon lamp enters the excitation spectrometer, which deliversmonochromatic liaht to the sample compartment. Prior to reaching the samplecompartment. however, 8% of the light is directed to the reference photodiode via aquartz beam splitter. The beam splitter also acts as a transparen, barrier to prevent dustfrom getting inside the delicate optical components. Light emitted from the sample isdispersed by the emission spectrometer and directed to the signal photomultiplierdetector. This signal is then amplified and displayed on the computer monitor.
Light
LYSource
ReferencePhotodiode
ExcitationSpectrometer
Beam Splitter
Sample
---5Emission
Spectrometer
SignalDetector 1--..-
(PMT)
SIMPLIFIED BLOCK DIAGRAM
PhotonCountingAmplifier
Display
PDF compression, OCR, web optimization using a watermarked evaluation copy of CVISION PDFCompressor

System Description FluoroMax-2 with DataMax
Measurement Options
The combination of state-of-the-art spectrometers and independent operation allows forspecification of a variety of measurement types. For instance, by stepping either or bothspectrometers through a spectral region and recording the signal intensity as a function ofwavelength, a simple spectrum is obtained. Scanning the emission spectrometer whileexciting the sample with a fixed wavelength of light produces a spectrum of the lightemitted or transmitted by the sample. Scanning the excitation spectrometer with theemission spectrometer at a fixed wavelength yields an excitation spectrum. If bothspectrometers are scanned simultaneously, reflectance or synchronous data can beacquired.
Optical ComponentsThe optical system consists of seven main components: light source, excitationspectrometer, reference photodiode, sample compartment, coupling optics, emissionspectrometer, and detector. The electronics are contained a separate compartment. Asimplified block diagram showing the layout of these components follows.
1 = Source2 = Excitation Spectrometer3 = Reference Photodiode4 = Sample Compartment
Legend
IlluminatorThe source is a 150W continuous ozone-free xenon lamp. Illumination from the lamp iscollected by an elliptical mirror and directed toward the entrance slit of the excitationspectrometer.
5 = Coupling Optics6 = Emission Spectrometer7 = Emission Detector8 = Electronics
PDF compression, OCR, web optimization using a watermarked evaluation copy of CVISION PDFCompressor

FluoroMax-2 with DataMax System Description
Spectrometers
The FluoroMax-2 is equipped with modified Czerny-Turner spectrometers in both theexcitation and emission positions. Czemy-Turner spectrometers maintain high resolutionover the entire spectral range. In each spectrometer a grating disperses the light from200nm to 900nm. The gratings in the excitation and emission spectrometers have agroove density of 1,200 grooves/mm and are blazed at 330nm and 500nm, respectively.
The entrance and exit ports of each spectrometer have continuously adjustable (in0.025mm increments), computer-controlled slits. The slits of the excitation spectrometerdetermine the amount of light passing through the excitation spectrometer to the sample.The emission spectrometer slits control the intensity of the fluorescence signal recordedby the signal photomultiplier detector. Adjusting slit widths selects the intensity andwavelength spread (bandpass) of light. The bandpass is calculated using the followingequation:
Bandpass (in nm) = slit width (in mm) x system dispersion
The dispersion of the FluoroMax-2 with 1,200 groove/mm gratings is 4.25nm/ram.
The table below shows several standard slit widths along with the bandpass for each.
Sample Compartment
A mirror focuses and directs the light from the excitation spectrometer to the sample inthe sample compartment. Before the light enters the sample compartment, however, abeam splitter directs 8% of the light from the excitation spectrometer to the referencephotodiode, and the remaining light continues to the sample. Fluorescence from thesample is then collected and directed to the emission spectrometer. By ratioing thefluorescence signal to the reference signal, correction can be made for variations in lightintensity as a function of wavelength.
Liztht exiting the emission spectrometer is monitored by a signal photomultiplier detectoroperated in the photon-counting mode. The standard PMT detector (Model R1 527P) issensitive to 680nm. The optional red-sensitive PMT detector (Model R928Pphotomultiplier tube) extends the wavelength range to 850=. Note that the upperwavelength limit of the detector is the upper limit of detectability.
SLIT WIDTH BANDPASS ROUNDED
0.5mm 2.125nm 2.0nm1.175mm 4.994nm 5.0nm2.00mm 8.500= 8.5nm
PDF compression, OCR, web optimization using a watermarked evaluation copy of CVISION PDFCompressor

System Description Fluor°Max-2 with DataMax
Emission correction factors are generated for the detector provided with the system. If theR1 527P detector is included, the emission correction factors extend from 290nm to750nm. If the R928 detector is included with the system, then the emission correctionfactors extend from 290nm to 850nm.
Computer System and SoftwareThe FluoroMax-2 includes a built-in computer that controls the spectrometers and otherhardware. It communicates through a serial (RS232) port to the external computer(through which you issue commands). Any computer that meets the requiredspecifications can be used as the controlling (external) computer. Computerspecifications and software requirements are listed in Chapter XI of this manual.
All FluoroMax-2 functions are controlled by the DataMax software, which communicatesbetween a PC-compatible computer and the FluoroMax-2. The DataMax software enablesyou to specify experimental parameters, acquire and display data, manage files, processdata, specify hardware components, control the spectrometers, and supply high voltage tothe signal detector.
The DataMax software is a Windows-based program, which means you have access to allthe powerful WindowsTm-environrnent functionality. In addition, DataMax is built on thesolid foundation ofGRAMS/3860 (or GRAMS/32R) which means you have access tosuperior post-processing functions as well. For a complete description of DataMax andGRAMS/386® (or GRAMS/32®), refer to the software manuals delivered with your
stem. For additional information regarding fluorescence principles and applications,refer to the documents listed in the Bibliography of this manual.
Although
the FluoroMax-2 and its accompanying software are not complicated touse, the sophisticated research and design implemented in this series ofinstrumentation consist of some of the most intricate interactions of software and
hardware for fluorescence applications. The unit is small but packed with full-featuredfunctionality. The development and evolution of the FluoroMax-2 followed the path ofthe field arowing and changing to keep pace with the industry. The result of which isthe easy to use, simple to maintain ISA FluoroMax-2.
After becoming familiar with the design, operation, and optical configuration of thesystem, you should feel a certain level of comfort with the system. The following chapterreveals detailed information regarding the proper operation of the system.
PDF compression, OCR, web optimization using a watermarked evaluation copy of CVISION PDFCompressor
CHAPTER IV
Getting Started
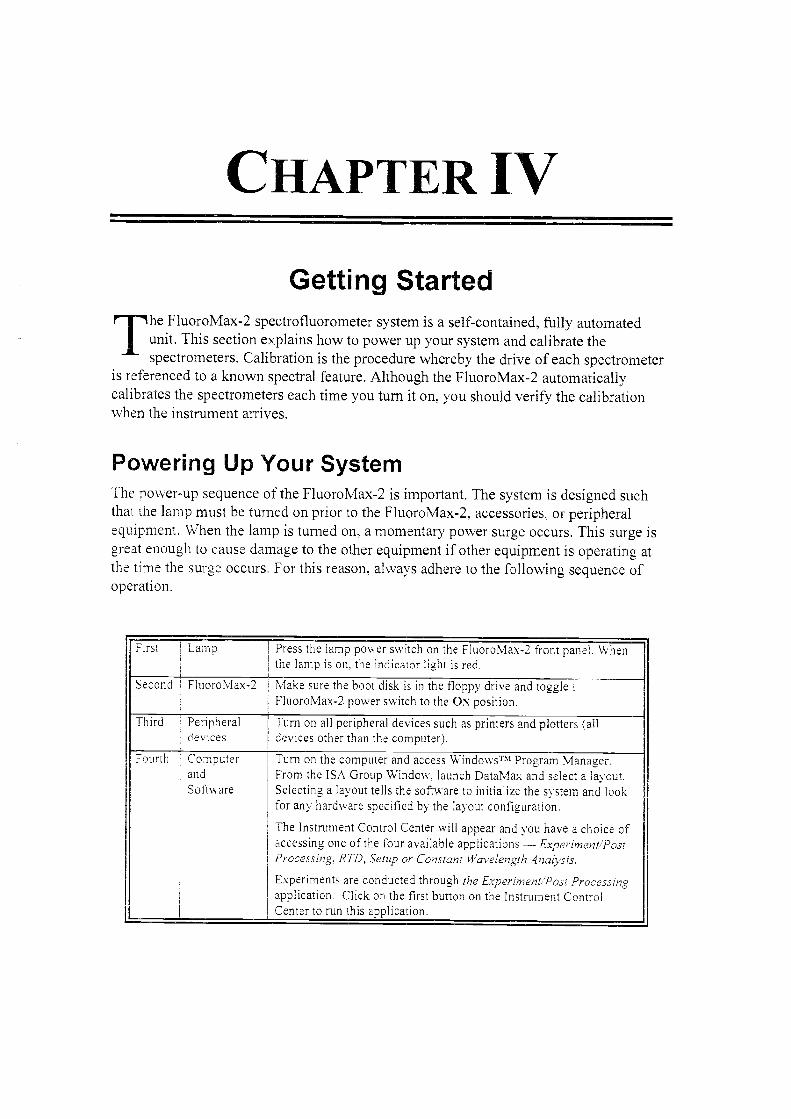
TheFluoroMax-2 spectrofluorometer system is a self-contained, fully automated
unit. This section explains how to power up your system and calibrate thespectrometers. Calibration is the procedure whereby the drive of each spectrometer
is referenced to a known spectral feature. Although the FluoroMax-2 automaticallycalibrates the spectrometers each time you turn it on, you should verify the calibrationwhen the instrument arrives.
Powering Up Your System"lhe nower-up sequence of the FluoroMax-2 is important. The system is designed suchthat the lamp must be turned on prior to the FluoroMax-2, accessories, or peripheralequipment. When the lamp is turned on, a momentary power surge occurs. This surge isgreat enough to cause damage to the other equipment if other equipment is operating atthe time the surge occurs. For this reason, always adhere to the following sequence ofoperation.
First Lamp Press the lamp power switch on the FluoroMax-2 front pane' Whenthe lamp is on, the indicator light is red.
Second FluoroMax-2 Make sure the boot disk is in the floppy drive and toggle 1FluoroMax-2 power switch to the ON position.
Third Peripheraldevices
Turn on all peripheral devices such as printers and plotters (a Idevices other than the computer).
Fourth ComputerandSoftware
Turn on the computer and access WindowsTM Program Manager.From the ISA Group Window, launch DataMax and select a layout.Selecting a layout tells the software to initialize the system and lookfor any hardware specified by the layout configuration.
The Instrument Control Center will appear and you have a choice ofaccessing one of the four available applications Experiment/PostProcessing, RTD, Setup or Constant Wcrvelength Analysis.
Experiments are conducted through the Experiment/Post Processingapplication. Click on the first button on the Instrument ControlCenter to run this application.
PDF compression, OCR, web optimization using a watermarked evaluation copy of CVISION PDFCompressor

Getting Started FluoroMax-2 with DataMax
Calibrating the FluoroMax-2After turning on your instrument, you should reference each spectrometer drive to aknown spectral feature. This is done by acquiring xenon lamp and water Raman spectra.Two ways to do this are:
Use default experiments.All scan types have default experiments. When you access the ExcitationAcquisition dialog box or the Emission Acquisition dialog box, you will noticethat the default parameters are consistent with those of a standard lamp scanand water Raman scan, respectively. The excitation spectrometer isreferenced to the xenon lamp peak occurring at 467.1nm. The emissionspectrometer is calibrated by acquiring a water spectrum using an excitationwavelength of 350nm and then referencing the spectrometer to the 397nmpeak in the resulting water Raman spectrum.
Specify the calibrating wavelength and other parameters.This way gives you the option of referencing the spectrometers to peaks otherthan those in the xenon lamp and water Raman spectra.
Either method is acceptable.
Calibration of the spectrometers is necessary only when the reference peaks do not occurat the appropriate positions in the calibration spectra. The following procedures explainho\A to deteiiiiine if the spectrometers are calibrated as well as how to proceed with thecalibration.
Using Default ExperimentsTwo default experiments are provide to help automate calibration verification. By simplyretrievin2 either the Excitation Acquisition or the Emission Acquisition dialog box, youcan execute a scan that will produce a spectrum indicative of spectrometer calibrationstatus.
The procedures for performing the calibrations are outlined in the following sections.
Excitation
Verify the calibration of the excitation spectrometer by executing the default experiment.
To do this, make sure the lid of the sample chamber is securely in place and, fromthe Main Menu of the Experiment/Post Processing application,
1. Select Collect/Experiment.
PDF compression, OCR, web optimization using a watermarked evaluation copy of CVISION PDFCompressor

FluoroMax-2 with DataMax Getting Started
This retrieves the default Emission Acquisition dialog box. For calibration andcalibration verification, always access the excitation spectrometer first.
2. Click on the Exp Type button and select the ExcitationAcquisition experiment type.
txperimenL__ I \ DATALIFEdflt1 exp
Scan Start(nni) 1250 000
Increment(nm) Ii 000
Enussion(nm) 165a ano
Number of Scans 1
-Sample and Real Time Processing Info
'Xenon Lamp Profile
Setug File...
1Co_rrection___
Start Time
Blank_
(1 Immediate C Del ay
Excitation Acquisition
antaFtle..
Scan Ead(nm) 1600 000
'4-117:ati°41 (s) 10 100
SigHTlids
Dark Offset
4-3
Slits ..
Poi s ,
AutoSave OExp
Default Excitation Acquisition dialog box
Notice that the parameters for the Excitation Acquisition dialog box are complete andeven the text in the Sample and Real Time Processing Info field identifies the defaultexperiment as a lamp scan.
Enter a name for the Data File.
Click Run to execute the scan.
Your spectrum should resemble the following:
Example of a lamp sean spectrum
awl
467=I 5.000e-02
en 3.75(1e-02
2.500e-02
L2
WaNelength (nm)
PDF compression, OCR, web optimization using a watermarked evaluation copy of CVISION PDFCompressor

Getting Started Fluor°Max-2 with DataMax
This part of the procedure is used to verify the calibration of the excitation spectrometer.
If the maximum peak is at 467+0.5nm, the excitation monochromator is calibrated.
If the peak is determined to be outside of the acceptable range, make a note of thewavelength indicated; y-ou must move the monochromator to the correct wavelength andinform the software of its location, as described below.
To calibrate the excitation monochromator,
Click on the RTD button on the Instrument Control Center.
The monochromator position displayed in the RTD application is the wavelength positionof the end of the xenon lamp scan.
Reposition the excitation monochromator to the wavelengthindicated by the peak of the xenon lamp scan by entering theobserved peak position in the Monos dialog box on the RTDControl Panel. (Once complete, close the RTD application.)
Access the Setup application by clicking on the Setup button onthe Instrument Control Center.
Click on the ¡excitation monochromator Grating image.
From the Grating/Turret dialog box that appears,
Click on the Calibrate button.
This retrieN es the Calibration dialog box.
Enter the actual xenon lamp scan peak (467.1nm) and click OK.
The excitation monochromator should now be calibrated.
Click OK to close the Grating/Turret dialog box.
Close the Setup application.
Confirnit that the excitation monochromator is calibrated byrunning another lamp scan. This time the peak should occur atthe correct wavelength.
The following discussion describes the calibration procedure for the emissionmonochromator.
Emission
Once the excitation spectrometer has been calibrated, the emission spectrometer can becalibrated. A water Raman scan is used to verify the calibration of the emissionmonochromator.
PDF compression, OCR, web optimization using a watermarked evaluation copy of CVISION PDFCompressor

To calibrate the emission spectrometer,
Insert a water-filled cuvette in the sample compartment.
From the Main Menu of the Experiment/Post Processing application,
Select Collect/Experiment.
Scan Start (nm)
lncrernent(nm)
Excitation Om)
Setup_File..
DATALIFE dlit0.exp
1350 000
Sarnple and Real Time Processing Info
Water I7leiman Scan for Emission Sensitivity
Ene-cZ3:-Lj.,Start Time
C ; Immediate
Default Emission Acquisition dialog box
This retrieves; the default Emission Acquisition dialog box. Notice that the parameters forthe ElniSSi011 Acquisition dialog box are complete and even the text in the Sample andReal Time Processing Info field identifies the default experiment as a water Raman scan.
Enter a name for the Data File.
Click Run to execute the scan.
The resulting spectrum should resemble the following:
I 2 .20%.+03
I .6 MN-05
1 1 CCe-Cr3
55000.0CC
) nonx
C Delay
Emission Acquisition
LtataFffe...
&anal&
VisTekaati (am)
4-5
Dark Offset D Points- 86
Example of a water Raman scan spectrum
isnce1
ExP TSPe-
365 000 Sc-an End(nm) 1450 000 AtariSave asive
ji 000IntegrationTime (s) 10 100 Exp
Fluor°Max-2 with DataMax Getting Started
PDF compression, OCR, web optimization using a watermarked evaluation copy of CVISION PDFCompressor

Getting Started Fluor°Max-2 with DataMax
To verify that the system is calibrated, with the spectrum displayed on the screen,
5. Identify the peak.
If the peak wavelength is 397nm, the emission monochromator is calibrated.
If the peak is not 397nm, make a note of the wavelength indicated; you must move themonochromator to the correct wavelength and inform the software of its location,described below.
To calibrate the emission monochromator,
Click on the RTD button on the Instrument Control Center.
The monochromator position displayed in the RTD application is the wavelength positionof the end of the water Raman scan.
Reposition the emission monochromator to the wavelengthindicated by the peak of the water Raman scan by entering theobserved peak position in the Monos dialog box on the RTDControl Panel. (Once complete, close the RTD application.)
Access the Setup application by clicking on the Setup button onthe Instrument Control Center.
Click on the emission monochromator Grating image.
From the Grating/Turret dialog box that appears,
Click on the Calibrate button.
This retrieves the Calibration dialog box.
Enter the actual peak of the water Raman scan (397nm) andclick OK.
The emission monochromator should now be calibrated.
Click OK to close the Grating/Turret dialog box.
Close the Setup application.
Confirm that the emission monochromator is calibrated byrunning another water Raman scan. This time the peak shouldoccur at the correct wavelength.
Althouh using the default experiments is a quick and accurate means by which tocalibrate the FluoroMax-2, some users prefer to set specific parameters based on theknown peak wavelerwth of a sample. A description of the method for calibrating the unitwithout usinu the supplied default experiments follows.
4-6
PDF compression, OCR, web optimization using a watermarked evaluation copy of CVISION PDFCompressor
FluoroMax-2 with DataMax Getting Started
Specifying ParametersTo verify the calibration of and perform a calibration routine by specifying theparameters, each spectrometer drive must be referenced to a known spectral feature.Although we strongly suggest calibrating the spectrometers with respect to a lamp scanand a water Raman scan, any parameters can be used.
Chapter V provides complete instructions, including suggested parameters, for running alamp scan and a water Raman scan. Use the procedure outlined there to perform acalibration procedure using known peak values. If the spectrum displayed shows a peaklocated at a wavelength other than the expected peak, use the calibration routinesdescribed above to reposition the monochromators.
Calibration
of the FluoroMax-2 is performed automatically when the system isinitialized. Calibration verification, hovvever, is conducted by one of two means:either the default experiments for excitation and emission acquisition scans can be
executed or excitation and emission scans of samples with known peaks (vv-e recommendusing a lamp scan and a water Raman scan) can be conducted and the parameters for thescans can be customized for the specific sample. Each spectrometer is calibratedindependent of the other, and accuracy can only be guaranteed if the excitationspectrometer is calibrated first.
Once the calibration routines are executed and it is certain that the information acquiredusing the spectrofluorometer is accurate, experiments can be perfaimed.
The following chapter discusses data acquisition.
PDF compression, OCR, web optimization using a watermarked evaluation copy of CVISION PDFCompressor

CHAPTER V
Acquiring Data
Thissection describes the complete procedure for running a sample with your
Fluor°Max-2 spectrofluorometer, from checking instrument performance toselectin:: the appropriate emission and excitation wavelengths for a sample whose
characteristics are unknown. In addition, step-by-step instructions are included for theacquisition of lamp and water Raman spectra. These spectra should be acquired each daybefore you run your samples to verify instrument performance. We strongly recommendthat all users become proficient at acquiring these spectra. By doing so, you will not onlybecome familiar with the operation and software of the FluoroMax-2, but you will alsonotice that the acquisition of all spectra follow a similar series of steps.
Checking Instrument PerformanceEach day. after you turn on your system. you should run a xenon lan.,- spectrum and awater P,aman spectrum to verify system performance. If you follow the instructionspresented in this chapter and your system is working properly, these spectra will look likethose in the Performance Test Report included with your instrument. The performancespectra were acquired using a 150W xenon lamp as the source and 1,200 groove/mmzratings blazed at 330nm and 500= in the excitation and emission spectrometers,respectively. If the xenon lamp and water Raman spectra that you acquire do not resemblethe ones in the Performance Test Report, refer to Chapter X, Troubleshooting.
It will take about five minutes to acquire the xenon lamp and water Raman scans. Thesespectra should be retained so that you can monitor the performance of the system overtime. We recommend making copies of the form in Appendix C and using it to keeptrack of system usage.
Xenon Lamp SpectrumAs the xenon lamp ag.es, water Raman spectra will have a progressive1,7 lower peakintensity. During the lifetime of the lamp, the lamp vill stabilize at approximately 80% ofits original intensity. Keep a record of the time the lamp is in use on copies of the foimprovided in Appendix C of this manual. From this record, you will be able to deteiminewhen the lamp is near the end of its lifetime. The maximum lifetime of the 150W lamp is1,500 hours.
PDF compression, OCR, web optimization using a watermarked evaluation copy of CVISION PDFCompressor

Important
Each time the lamp is turned on is equivalent to one hour of use; we, thereforesuggest leaving the source turned on between brief periods of instrumentinactivity.
The xenon lamp spectrum shows the spectral output of the xenon lamp. From thestructure of the spectrum at 467.125nm, you can determine if the excitation spectrometeris properly calibrated. To obtain a xenon lamp spectrum, first
Power up the system:
Supply power to the xenon lamp by pressing the LAMPswitch on the front panel of the FluoroMax-2.
Turn on the FluoroMax-2 by pressing the POWER switchlocated to the right of the LAMP switch.
The red sensor on the front panel will light indicating that the lamp is on.
Turn on all other system components such as the printeror plotter.
Turn on the computer, and access the Main Menu of theExperinzent/Post Processing application within theDataMax software.
NOTE: Both the lamp scan and the water Raman scan are includedas default experiments for the Excitation Acquisition andEmission Acquisition scan types respectively.
The following instructions are provided for those who prefer toenter a different set of parameters or vv-ho have lost, corrupted, ordeleted the original default experiments.
Set the parameters of the experiment to acquire a xenon lamp spectrum:
Select Collect/Experiment, from the Main Menu.
Click the Exp Type button.
Choose Excitation Acquisition from the Experiment Typedialog box.
This retrieves the Excitation Acquisition dialog box. Under normal conditions, thisdialog box appears with the default lamp scan parameters. Either change theseparameters to reflect your current needs, or run the experiment usina the existingparameters. If you have inadvertently damaaed the file, you can enter the parametersshown below.
Acquiring Data FluoroMax-2 with DataMax
PDF compression, OCR, web optimization using a watermarked evaluation copy of CVISION PDFCompressor

Default parameters for lamp scan
Once the data acquisition parameters have been entered,
Make sure the excitation shutter is open and theexcitation monochromator slits are set at 0.5mm.
Press the Run button to execute the experiment.
The spectrum you acquire should look similar to the one shown below.
Example of a xenon lamp scan
Locate the maximum peak.
If the maximum peak is at 467 ±0,5nm, the system is calibrated. If the peak is determinedto be outside of the acceptable ranze, the spectrometers must be recalibrated. SeeChapter IV for the recalibration procedure.
Experiment Type Excitation Acquisition
Number of Scans 1
Start 230nmEnd 800nmIncrement 0.5nmIntegration Time 0.1 secondEmiss Mono 450nmAcquisition Mode RAuto Zero No
iData File Lamp
FluoroMax-2 with DataMax Acquiring Data
PDF compression, OCR, web optimization using a watermarked evaluation copy of CVISION PDFCompressor

Water Raman Spectrum
A water Raman spectrum can be used to evaluate system throughput and determine if theemission spectrometer is properly calibrated. You should retain the spectra forcomparison with the Performance Test Report and performance evaluation of the system.
NOTES: Before acquiring a water Raman spectrum, you should have verified that themost intense peak of the lamp spectrum occurs at 467 ±0.5nm.
Both the lamp scan and the water Raman scan are included as default experiments for theExcitation Acquisition and Emission Acquisition scan types respectively.
The following instructions are provided for those who prefer to enter a different set ofparameters or who have lost, corrupted, or deleted the original default experiments.
To acquire a water Raman spectrum,
Make sure the lamp is turned on, and insert a water-filledcuvette into the sample holder.
To ensure lov, background signal, we recommend using twice-distilled water from whichoraanic and inorganic contaminants have been removed.
Select Collect/Experiment from the Main Menu of theExperiment/Post Processing application.
This retrie es the Emission Acquisition dialog box.. Under normal conditions,this dialog box appears with the default water Raman parameters. Either changethese parameters to reflect your current needs, or run the experiment using theexisting parameters. If you have inadvertently damaged the file, you can enter theparameters shown below.
Default parameters for lamp scan
5-4
Experiment Type Emission Acquisition
Number of Scans 1
Expt. Title Standard H20 Raman scanStart 365nmEnd 450=Increment 0.5=Integration Time 0.5 secondExcit Mono 350=Acquisition Mode S
Auto Zero NoData File Waterra
Acquiring Data FluoroMax-2 with DataMax
PDF compression, OCR, web optimization using a watermarked evaluation copy of CVISION PDFCompressor

Note: To compare spectra and evaluate long-term system performance, use thesame experiment parameters (integration time, slit widths, etc.) each time youacquire a water Raman spectrum.
Make sure the excitation shutter is open and the slits areset at 1.1750mm (5nm bandpass).
Press the Run button.
Your spectrum should appear similar to the one pictured below:
Example of a water Raman scan
Note: The minimum water Raman specification is 200,000 cps (abovebackground) at 397nm with a 5nm bandpass (slits set to 1.175 mm) and anexcitation -wavelength of 350nm. A gradual decrease in the intensity of thewater Raman peak is normal over the lifetime of the lamp.
If the maximum peak is at 397mn. the system is calibrated. If the peak is determined to beoutside of the acceptable range, the ,,pectrometers must be recalibrated. See Chapter IVfor the recalibration procedure.
FluoroMax-2 with DataMax Acquiring Data
PDF compression, OCR, web optimization using a watermarked evaluation copy of CVISION PDFCompressor

Acquiring Data FluoroMax-2 with DataMax
Running an Unknown SampleAfter you have run the xenon lamp and water Raman performance spectra, you are readyto run your sample. The basic steps are outlined below.
When the scan is complete, the information is saved automatically to disk and it is alsoretained in the computer's memory. Several options for data manipulation exist. The datacan be viewed in a variety of formats, printed, or, by using the powerful arithmeticfeatures, a myriad of calculations and spectrum math/algebra can be performed.
The sections which follow provide detailed instructions regarding running a sample andoptimizing the collected data.
Determining the Optimal Excitation and Emission WavelengthsThe optimum excitation wavelength is the wavelength at which the highest sensitivitywill be produced for a particular sample. The optimum excitation and emission
avelenzths are known for many samples. However, for a sample whose vvavelengthpositions are unknown, you must determine these wavelengths to obtain the best possibleresults when you run the sample.
5-6
Basic Steps
Turn on the lamp.The indicator is red when the lamp is on.After the lamp is on, turn on the FluoroMax-2 and allperipheral devices.Turn on the computer.
I. Access the Instruntent Control Center of DataMax andopen the Experiment/Post Processing application.Place your sample in the sample compartment andsecure the sample chamber lid.Supply high voltage to the signal detector.Depending on your system configuration, you vvill haveeither a programmable or a preset high voltage source.Between 950V and 1,050V is typically used (contingent ontype of signal detector). If you have a programmable highvoltage source, make sure the voltage is set within this limit.The programmable excitation shutter opens and closesautomatically. (The default slit settings are 1.0mm,which corresponds to a 4.25 nm bandpass.)
. Select a scan type.
. Specify data acquisition parameters including a dataname and comment, if desired.Unless you already know the optimum data excitation andemission wavelengths, you will first have to determinethem. (Refer to the procedure outlined below.)
10. Run your experiment.
PDF compression, OCR, web optimization using a watermarked evaluation copy of CVISION PDFCompressor

FluoroMax-2 with DataMax Acquiring Data
The method used to determine the excitation and emission wavelengths consists of firstrunning an emission scan and observing the peak emission value. Once this value hasbeen obtained, it is necessary to acquire an excitation scan using the peak emission valuedetermined by running the emission scan.
To discover the preliminary emission maximum,
Verify that all system components have been turned on. Ifyou have not checked instrument performance, werecommend acquiring a lamp spectrum and a waterRaman spectrum, as outlined in this manual, beforeproceeding.
Place the sample in the sample compartment. Make surethe sample chamber lid is completely closed.
Enter the Experiment/Post Processing application fromthe Instrument Control Panel.
Click Collect/Experiment to retrieve the EmissionAcquisition dialog box.
Turn on the high voltage to the signal detector.
Depending on )our system configuration, you will hal. e either aprogrammable or a preset high voltage source. If you have a presetvoltage supply, the voltage setting was established at the factorand no adjustments are necessary. If you have a programmablehigh \ oltage source. unless you changed the value, the defaultvoltage should be used. The high voltage reading will be either950V or 1.050V.
Set the excitation and emission slits to 1.0mm(corresponds to a 4.25nm bandpass).
The objective of this phase of the procedure is to acquire a preliminary emission scanusing a "guessed- excitation wavelength. Once the emission peak is determined, thisvalue will be used to obtain the optimal excitation wavelength (wavelength at which thehighest sensitivity will be produced for a particular sample) As long as the "guessed"excitation wavelength position is in the absorption region, an emission scan can bemeasured.
Specify the data acquisition parameters.
Enter the START and END wavelengths for the scan, andthe other parameters. (Don't forget to enter a Data Filename.)
If you are uncertain of an excitation wavelength. use 300= (thewavelength at which many samples absorb lisht).
5-7
PDF compression, OCR, web optimization using a watermarked evaluation copy of CVISION PDFCompressor

Note: To minimize Raleigh scatter in your emission scan, the STARTposition should usually be offset by at least 15nm from the excitationwavelength when the bandpass is 5nm. For example, if you have entered300nm as the excitation wavelength, enter 315nm for Start. Set the Endwavelength to 550nm. To acquire the spectrum quickly, enter 2nm forIncrement and 0.1second for Integration Time. For AcquisitionMode, enter "s" (signal detector).
Run the scan.
With your preliminary emission spectrum displayed on the screen,note the greatest intensity.
Either
Record the wavelength at which this occurs. This is youremission maximum.
Note: If the signal level exceeds 4 x 10⁶ cps, decrease the slit widths by50%. If you do not see an obvious peak, increase the excitationwavelength and the Start and End points by 25nm, and acquire anotheremission scan.
Or
10. Repeat this procedure until you find an obvious emissionpeak.
The next step is to use the recently discovered emission maximum to determine theoptimal excitation wavelength for the sample. The procedure for plotting the optimalexcitation spectrum is very similar to the procedure outlined above.
To determine the optimal excitation wavelength,
Click on Collect/Experiment.
The Ernissicn Acquisition dialog box will appear.
At the Emission Acquisition dialog box, click on the ExpTipe button and choose the Excitation Acquisition.
Specify the data acquisition parameters:
For Excitation, enter the emission maximum deterrnined inStep 10 above; enter 250nm for the Start of the scan; enterthe emission maximum less 15nm (i.e., if the emissionmaximum was determined to be at 450nm, enter 435nm) forthe End of the scan; and select "s/r" as the Acq uisitionMode.
5-8
Acquiring Data FluoroMax-2 with DataMax
PDF compression, OCR, web optimization using a watermarked evaluation copy of CVISION PDFCompressor

FluoroMax-2 with DataMax Acquiring Data
Using this mode produces a spectrum corrected for variations in lamp intensity withrespect to time.
Set the excitation and emission slits to the same settings asfor the emission scan. It is important to make sure thatthe emission maximum did not exceed 4x10⁶cps whenusing mode "s".
Enter the remaining parameters, the Data File nameand, if desired, any comments desired that willdistinguish this experiment from others.
Run the scan.
The resulting spectrum displays intensity versus wavelength and shows the maximumexcitation wavelength.
Optimized excitation and emission spectra of a 1 x 10⁻⁸ M anthracene solution are shownin the following plot. Because the acquisition modes were different for the excitation andemission scans, the data intensity had to be normalized. Notice that the excitation andemission scans are virtually mirror images of one another. (NOTE: The mirror image ruleapplies to 80% of fluorescence compounds.)
e
4.000e+06
3.000e-06
2.000e+06
I _000e+06
0.00
EmissionAnthracene
30C 350
Normalized spectra
5-9
ExcitationAnthracene
400
Wavelength (nm)
450
smar
500
Oncethe procedure for collecting data has been mastered, it is necessary
familiarize yourself with ways to optimize the output to ensure that theinformation portrays data regarding the sample and not information that can be
attributed to hardware anomalies or the solvent blank. The next chapter discusses ways to
PDF compression, OCR, web optimization using a watermarked evaluation copy of CVISION PDFCompressor

Acquiring Data FluoroMax-2 with DataMax
optimize the signal and outlines the method of determining the best (plateau) voltage (ifyour system is equipped with a programmable voltage supply) at which to operate thesignal detector.
PDF compression, OCR, web optimization using a watermarked evaluation copy of CVISION PDFCompressor

CHAPTER VI
Optimizing Your Results
/nmost cases, the spectra that you acquire will characterize the excitation and
emission of the fluorescent species. However, occasionally you may need to improvethe quality of your data or you may encounter a "problem sample," one that
fluoresces weakly, or has a low quantum yield. This section describes techniques whichvvill help you optimize your results. These techniques include increasing the signal-to-noise ratio, deteimining the best voltage (when applicable) for the detector, using theappropriate detection mode, and cleaning euvettes properly.
Improving the Signal-to-Noise RatioThe quality of acquired data is determined largely by the signal-to-noise (S/N) ratio. Thisis especially true for weakly fluorescing samples with low quantum yields. The S/N ratiocan be improved by:
Usinz, the appropriate integration time.
Scanning a region several times and averaging the results.
Changing the bandpass by adjusting the slit widths.
Mathematically smoothing the data.
The sections which follow discuss the alternatives for improving the S/N ratio and theadvantages and disadvantages of each.
PDF compression, OCR, web optimization using a watermarked evaluation copy of CVISION PDFCompressor

Optimizing Your Results FluoroMax-2 with DataMax
Optimum Integration TimeThe length of time during which photons (displayed as signal intensity) are counted andaveraged for each data point is referred to as the integration time. A portion of this signalis due to noise and dark counts (distortion inherent to the signal detector when highvoltage is applied). By increasing the integration time, the signal is averaged longer,
resulting in a better S/N ratio. This ratio is enhanced by a factor of t1/2, where t is the
multiplicative increase in integration time. For example, doubling the integration timefrom one second to two seconds increases the S/N ratio by over 40% as shown below.
For an integration time of 1 second,
S/N = tS/N = (1)'S/N = 1
For an integration time of 2 seconds,
S/N = (2)S/N = 1.415 or approximately 42%
Because it determines the noise level in your spectrum, use of the appropriate integrationtime is important for qualitative results. To select an appropriate integration time, firstfind the maximum fluorescence intensity by acquiring a preliminary scan using anintegration time of 0.1 second and a bandpass of 5nm. From this preliminary scan, notethe maximum intensity and select the appropriate integration time from the table below.
S/N = ty,
Note: This table should be used only as a guide for wavelength scans. Theoptimum integration time for other measurements, such as time base,polarization, phosphorescence lifetimes, and anisotropy may be different.
Integration time can be set throuah the experiment acquisition dialog box for each scantype. Refer to the software manual to learn more about setting the integration time.
6-2
Signal Intensity(Counts per Second)
EstimatedIntegration Time
(Seconds)
1.000 to 5.000 2.0
5.001 to 50,000 1.0
50,001 to 500,000 0.1
500.001 to 4,000,000 0.05
PDF compression, OCR, web optimization using a watermarked evaluation copy of CVISION PDFCompressor

FluoroMax-2 with DataMax Optimizing Your Results
Scanning a Region Multiple TimesScanning a specified region more than once and averaging the results enhance the S/N
ratio. In general, the S/N ratio improves by n1/4, where n is the number of scans.
To scan a region multiple times, specify the number of scans in the Number of Scansfield in the experiment dialog box.
Number at ScansStacked r Summed r. Averaged
Number of Scans option
Notice that for any number greater than one, you also have a choice of how the scans willbe handled and displayed by the software. Refer to the DataMax software manual foradditional information.
Selecting the Appropriate BandpassThe bandpass (wavelength spread) affects the resolution of your spectra. If the bandpassis too broad, narrow peaks may be unresolved. For example, if you have two 2-nm peaks5nm apart and a bandpass of lOnm, you will see one broad peak, instead of two well-defined ones.
By adjusting the slit widths, you can control the measured fluorescence intensity andbandpass of the light. The slits of the excitation spectrometer determine the amount oflight that will pass through the excitation spectrometer to the sample. The emissionspectrometer slits control the amount of fluorescence recorded by the signal detector.
If you are working with biological samples that photobleach when exposed to highexcitation light, it may be necessary to narrow the excitation slits and open the emissionslits. Making these adjustments prevents the sample from photobleaching, but still allowsyou to collect a high enough signal.
Bandpass can be calculated using the following formula:
Bandpass (nm) = Slit Width(mm) x Dispersion(nrn/mm),
where the Dispersion of the FluoroMax-2 is equal to 25nm/mm.
Smoothing DataSmoothing, the data improves the appearance of your spectrum. GRAMS/386Tm pro\ idesvarious op',ions for smoothing your data. To access the Smooth function, select Smoothfrom the Arithmetic menu at the Main Menu. This brings up a dialoz box that allows youto select the type of smoothing you want to implement.
PDF compression, OCR, web optimization using a watermarked evaluation copy of CVISION PDFCompressor

Optimizing Your Results FluoroMax-2 with DataMax
Smoothing Functions
amoothing °penman FourierSavitsky-Golay
r:Liicel I
6-4
Reba
GRAMS/386Tm Smoothing Functions dialog box
Refer to the Galactic® manual for GRAMS/386Tm (or GRAMS/32Tm) to learn more
about this feature.
In general, to select the proper number of points for wavelength scan types, first locate
the arca that requires smoothing 1/4 usually this is a peak. Determine the number of datapoints that make up the peak and then smooth the data using the number ofpoints closest
to this number. To avoid artificially enhancing the data, it is important to use theappropriate number of points to smooth the data. For example, selection of too large anumber results in the background being smoothed into the peak.
Sample PreparationThe typical fluorescence or phosphorescence sample is a solution which is analyzed in astandard cuvette. However, the cuvette itself may contain materials that fluoresce. To
prevent interference, we recommend using non-fluorescing fused silica euvettes whichhave been cleaned using the procedure outlined in the following section.
If only a small sample volume is available and the intensity of the fluorescence signal ishigh, dilute the sample and analyze it in a 4m1 cuvette. However, if fluorescence is weakor if trace elements are to be determined, we recommend using a reduced volume cellsuch as our 50111 or 250u1 cells. A lml capacity cell (5mm x 5mm) is also available.
Solid samples are usually mounted in the Model 1933 Solid Sample Holder, and thefluorescence is collected from the front surface of the sample (see Chapter VIII,Accessories). The method of mounting the solid sample depends on the particular sample.Thin films and cell monolayers on coverslips can be placed directly in the solid sampleholder. Minerals. crystals, vitamins, paint chips, and similar samples are usually ground
into a powder to make a homogeneous mixture. The powder is packed into the depressionof the solid sample holder. If it is very fine or resists packing (and therefore falls outwhen the holder is put into its vertical position), the powder can be held in place with athin quartz co), erslip or blended with potassium bromide for better cohesion.
Solid samples. such as crystals, are sometimes dissolved in a solvent and analyzed insolution. Solvents, however, may contain organic impurities which fluoresce and maskthe signal of interest. For this reason, use high-quality, HPLC-grade solvents. Ifbackground fluorescence persists, recrystallize the sample to eliminate organic impuritiesand then dissolve it in an appropriate solvent for analysis.
For reproducible results. some samples may require additional treatment. For example,proteins, cell membranes. and cells in solution need constant stirring to pre-vent settling.Other samples are temperature sensitive and must be heated or cooled to ensure
PDF compression, OCR, web optimization using a watermarked evaluation copy of CVISION PDFCompressor
FluoroMax-2 with DataMax Optimizing Your Results
reproducibility in emission signals. (A thermostatted cell holder with a magnetic stirrer isavailable: See Chapter VIII, Accessories, for more information.)
Cuvette PreparationSample cells should always be cleaned thoroughly before use to help minimizebackground contributions. The recommended cleaning procedure is described below.
CleaningSoak the cuvettes for 24 hours in chromic acid, whichcleans the cuvettes.
Rinse with deionized water.
Prepare a cleaning solution by adding 20 pellets ofpotassium hydroxide to 100m1 of HPLC-grade methanol.
Soak the cuvette in the potassium hydroxide solution for5 hours.
Rinse well with deionized water. (This removes chromiumions, which can quench fluorescence.)
Important: Soaking the cuvettes in the potassium hydroxidesolution for a longer period causes etching of the cuvette surface,which results in scatter problems when the cuvettes are used.
Soak the cuvettes for the last day in concentrated nitricacid.
After cleaning,
Store cuvettes in nitric acid until you are ready to usethem and rinse them with deionized water before use.
The procedure outlined for cleaning and preparing cuvettes for use is a simple procedurethat. if followed, can eliminate having to rerun experiments as a result of uncleancuvettes.
Collection MethodThe two basic collection methods are Right Angle (RA) and Front Face (FF). Thestandard FluoroMax-2 comes equipped with the RA option only. To implement the FFoption. a Model 1933 Solid Sample Holder must be purchased.
In right angle detection, the fluorescence is collected at a 90-degree ande to the incidentexciting beam. RA detection is used primarily for clear solutions. FF detection is used foroptically dense solutions such as hemoglobin and for solid samples. In FF detection,
6-5
PDF compression, OCR, web optimization using a watermarked evaluation copy of CVISION PDFCompressor

Optimizing Your Results FluoroMax-2 with DataMax
fluorescence is collected off the front surface of the cuvette; or the solid sample. Inner-filter and reabsorption characteristics of opaque samples preclude RA detection.
Using the appropriate collection method for the type of sample under test is imperativefor accurate results.
Optimizing Signal Detector VoltageThe emission signal detector requires an applied voltage to operate. This voltage is eitherset at the factory (standard FluoroMax-2 configuration) or can be set by the user (with theoptional programmable voltage supply). If your system is equipped with a programmablevoltage supply, clicking the HV button from any experiment dialog box within theExperiment/Post Processing application retrieves a high voltage dialog box with optionsfor setting (or changing) the high voltage. The operating voltage of the detectordetermines the sensitivity of the detector. To achieve the highest sensitivity possible forthe programmable voltage supply-, you can determine the plateau voltage for the signaldetector and use this voltage instead of the default voltage (1,050V for the standard1527P detector and 950V for the optional R928P).
Important
The procedure for determining the optimum voltage is applicable only to thosesystems containing a programmable voltage supply.
Systems which contain a preset voltage supply were calibrated at the factory priorto shipping and the optimum voltage has already been established and set.
Plateau VoltageThe plateau voltage is the voltage at which the signal intensity is maximized and the darkcount intensity is minimized. It takes approximately 30 minutes to acquire the data and15 minutes to display the data in the form of two data files.
The procedure for determining the plateau voltage begins with composing a table of darkcounts and corresponding si2nal intensities at incremental voltages. From this table, agraph is drawn, and the point at which the signal intensity is maximized and the darkcount intensity is minimized is observed. This is considered the plateau voltage, and it isthe point at which the highest sensitivity of the detector is achieved.
PDF compression, OCR, web optimization using a watermarked evaluation copy of CVISION PDFCompressor

To record the values, you will need to construct or photocopy the following table:
Setting up your instrument
Turn on the lamp, the Fluor°Max-2 spectrofluorometer,peripherals, and computer.
From the Experiment/Post Processing application, run axenon lamp spectrum and a water Raman scan to ensurethat the system is functioning properly (refer to ChaptersIV and V).
Enter the DataMax RTD application.
Set the slits of the excitation and emission spectrometersto a bandpass of 5nm.
Insert a cuvette filled with distilled water in the sampleholder.
Set the monochromator post .-ms at 350nm for theexcitation and 397nm for the -mission.
Place the High Voltage and Intensity dialog boxes on theRTD control panel.
Set the high voltage to 650 1- Olt&
The default voltage, if it has not been adjusted is 950V or 1.050V depending on the signaldetector. During the procedure. this value will be incremented and the results noted.
High Voltage(Volts)
Signal Intensity(cps)
Dark Counts(cps)
650700750800850900950
1,0001,0501,1001,1501,200
FluoroMax-2 with DataMax Optimizing Your Results
PDF compression, OCR, web optimization using a watermarked evaluation copy of CVISION PDFCompressor
Optimizing Your Results FluoroMax-2 with DataMax
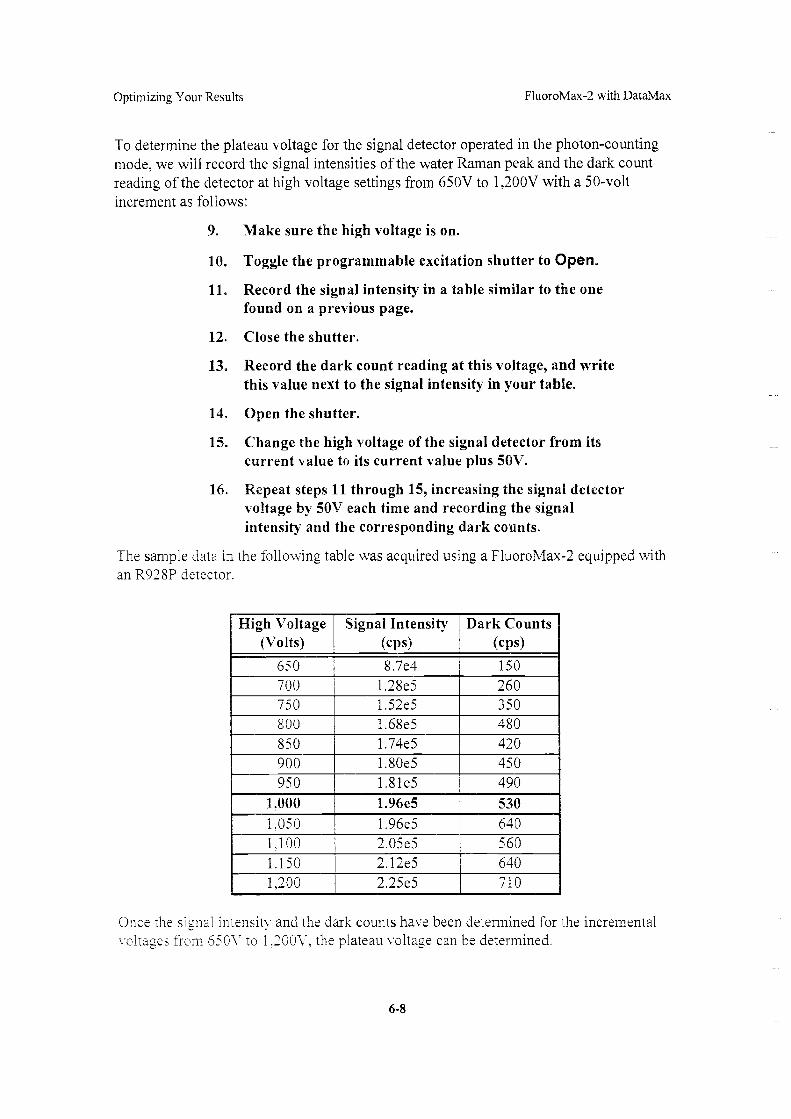
To determine the plateau voltage for the signal detector operated in the photon-countingrnode, we will record the signal intensities of the water Raman peak and the dark countreading of the detector at high voltage settings from 650V to 1,200V with a 50-voltincrement as follows:
Make sure the high voltage is on.
Toggle the programmable excitation shutter to Open.
Record the signal intensity in a table similar to the onefound on a previous page.
Close the shutter.
Record the dark count reading at this voltage, and writethis value next to the signal intensity in your table.
Open the shutter.
Change the high voltage of the signal detector from itscurrent value to its current value plus 50V.
Repeat steps 11 through 15, increasing the signal detectorvoltage by 50V each time and recording the signalintensity and the corresponding dark counts.
The sample data in the following table was acquired using a FluoroMax-2 equipped withan R928P detector.
Once the siz-nal intensity and the dark counts have been determined for the incrementalvoltaaes from 650V to 1,200V. the plateau voltage can be determined.
6-8
High Voltage(Volts)
Signal Intensity(cps)
Dark Counts(cps)
650 8.7e4 150
700 1.28e5 260750 1.52e5 350800 1.68e5 480850 1.74e5 420900 1.80e5 450950 1.81e5 490
1,000 1.96e5 530
1.050 1.96e5 640
1.100 2.05e5 5601.150 2.12e5 6401,200 2.25e5 710
PDF compression, OCR, web optimization using a watermarked evaluation copy of CVISION PDFCompressor

FluoroMax-2 with DataMax Optimizing Your Results
17. From the data obtained, construct tvvo graphs: SignalIntensity versus High Voltage and Dark Counts versusHigh Voltage.
Graphs of the above data are shown below, combined into one stacked line graph.
Signa!x 10' cps
2.2
2
1.4
1,2
600 700 800 900 1000 1103 1200High Voltage
From the graphs, it can be determined that at approximately 1,000V there is a peak in thesignal intensity without a significant increase in the dark counts value. Therefore, thepoint at which there is maximum voltage and minimum dark counts is 1,000V 3/4 theplateau voltage for this detector.
Thischapter has covered the various means by which to optimize spectral results,
including improving the signal-to-noise ratio of a spectrum, determining theplateau voltage of the signal detector (when a programmable voltage supply is in
the system). as well as various other procedures. Using the procedures outlined in thischapter will provide zood fluorescence results which can be reproduced time and timeagain.
6-9
800
700
600
Dark 500Countscps 400
300
200
100
PDF compression, OCR, web optimization using a watermarked evaluation copy of CVISION PDFCompressor

CHAPTER VII
Correction Factors
Gratings,
detectors and other spectrometer components such as mirrors, lenses andbeam splitters have response characteristics that are functions of wavelength.These characteristics may be superimposed on spectra, thereby yielding a
potentially misleading trace. For accurate intensity comparisons, such as those requiredfor quantum yield measurements, response characteristics must be eliminated.
Through the software, you can specify whether spectra will be acquired eitheruncorrected or corrected. For routine fluorescence assays where standards are measuredfollowed by the concentrat:Aa determination of unknowns, it is acceptable to acquireuncorrected spectra. In this application, relative fluorescence measurements will giveaccurate concentrations. When characterizing new fluorescent compounds or measuringthe quantum yield in a complex mixture, it is necessary to acquire corrected spectra.
Before applying correction factors, we recommend subtracting the dark counts (darkcounts are not wavelenth dependent) and the spectrum of the blank from the data (referto the software manual for specific instructions).
To use correction factors. either (1) select the ones supplied with the software. (2) corvertDM3000F correction factors. or (3) select a set generated , I your facility, as detailed inthe following section. The following sections describe both using the existing correctionfactors and generating and using new correction factors.
ISA-Supplied FilesSupplied AAith your instrument are sets of excitation and emission correction factors thatenable you to eliminate the wavelength response characteristics of the FluoroMax-2.These files', XCORRECT and MCORRECT, are included on a separate disk with yoursoftware and should be copied to your hard disk. They mu be in the same directory asthc data that are to be corrected. Note that the excitation coi-rection range is from 240nrnto 600nm, and the wavelength range for emission correction factors is from 290= to750nm v,ith the standard R1527P signal detector and 290nm to 850= with the optionalR928P siznal detector.
!Filenames include a three-letter extension. For the sake of clarity, we have omitted the extensions in thismanual. Refer to the software manual for specifics regarding extensions
PDF compression, OCR, web optimization using a watermarked evaluation copy of CVISION PDFCompressor
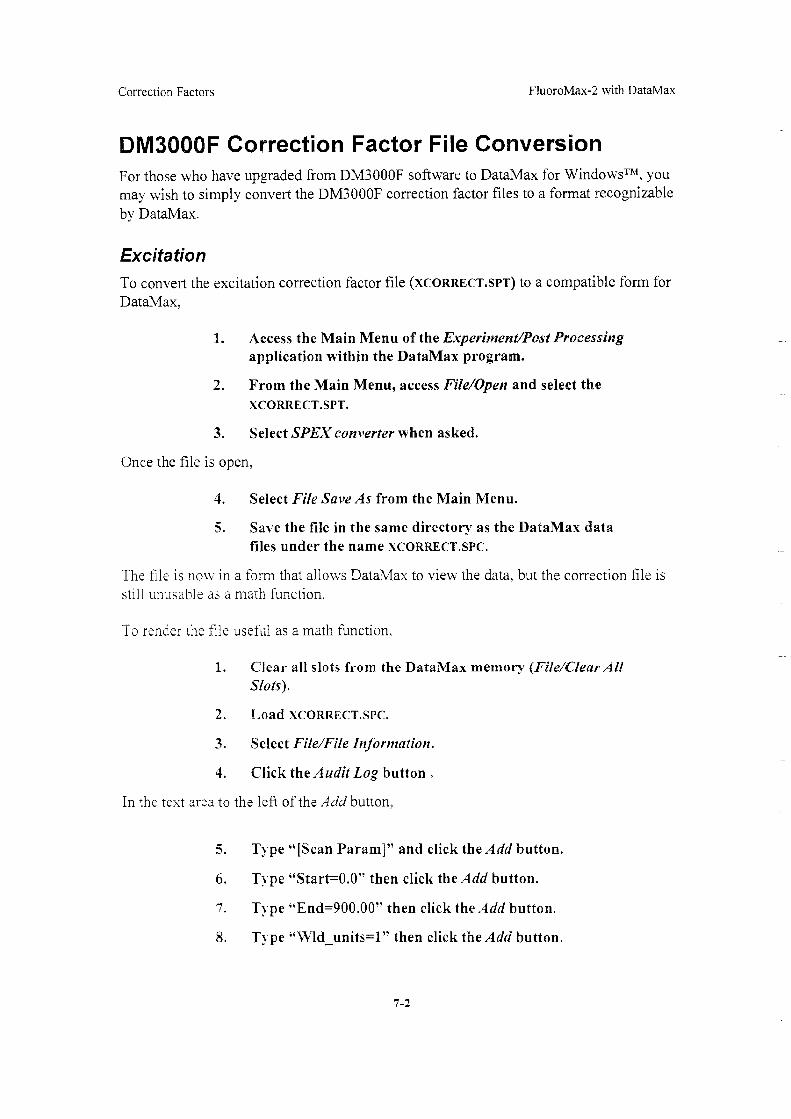
Correction Factors FluoroMax-2 with DataMax
DM3000F Correction Factor File ConversionFor those who have upgraded from DM3000F software to DataMax for WindowsTm, youmay wish to simply convert the DM3000F correction factor files to a format recognizableby DataMax.
ExcitationTo convert the excitation correction factor file (XCORRECT.SPT) to a compatible form forDataMax.
Access the Main Menu of the Experiment/Post Processingapplication vvithin the DataMax program.
From the Main Menu, access File/Open and select theXCORRECT.SPT.
Select SPEX converter when asked.
Once the file is open,
Select File Save As from the Main Menu.
Save the file in the same directory as the DataMax datafiles under the name XCORRECT.SPC.
The file is nov,- in a form that allows DataMax to view the data, but the correction file isstill unusable as a math function.
To render the file useful as a math function,
Clear all slots from the DataMax memory (File/Clear AllSlots).
Load XCORRECT.SPC.
Select File/File Information.
Click the Audit Log button
In the text area to the left of the Add button,
Type "[Scan Param]" and click the Add button.
Type "Start=0.0" then click the Add button.
7, Type "End=900.00" then click the Add button.
8. Type "Wld_units=1" then click the Add button.
7-2
PDF compression, OCR, web optimization using a watermarked evaluation copy of CVISION PDFCompressor

FluoroMax-2 with DataMax Correction Factors
Click OK.
Click Save (overwrite the original XCORRECT.SPC ifasked).
You now have correction factor files for DM3000F (XCORRECT.SPT) as well as forDataMax (XCORRECT.SPC).
EmissionTo convert the DM3000F emission correction factor file (MCORRECT.SPT) to acompatible form for DataMax,
Access the Main Menu of the Experiment/Post Processingapplication within the DataMax program.
From the Main Menu, access File/Open and select theMCORRECT.SPT.
Select SPEX converter when asked.
Once the file is open,
Select File Save As from the Main Menu.
Save the file in the same directory as the DataMax datafiles under the name XCORRECT.SPC.
The file is now in a form that allows DataMax to view the data, but the correction file isstill unusable as a math function.
To render the file useful as a math function,
Clear all slots from the DataMax memory (File/Clear AllSlots).
Load MCORRECT.SPC.
Select File/File Information
Click the Audit Log button .
In the text area to the left of the Add button.
Type "[Scan Param]" and click the Add button.
Type "Start=0.0" then click the Add button.
7-3
PDF compression, OCR, web optimization using a watermarked evaluation copy of CVISION PDFCompressor

Type "End=900.00" then click the Add button.
Type "Wld_units=1" then click the Add button.
Click OK.
Click Save (overwrite the original MCORRECC.SPT ifasked).
You now have correction factor files for DM3000F (MCORRECT.SPT) as well as forDataMax (MCORRECT.SPC).
User-Generated FilesIf desired, correction factors can be generated instead of using the ones supplied with theequipment. Emission factor correction files and excitation factor correction files require adifferent procedure for generation. These procedures are described in step-by-step detailin the sections which follow.
EmissionEmission correction factors should be updated periodically or whenever a different sig,naldetector or gratings are installed. The correction factors can either be updated by the useror by a representative from the ISA Fluorescence Service Department at your location. Tomake arrangements for a senrice representative to update the emission correction factors.call our service department. To update the correction factors on your own, follow theinstructions contained in the following sections.
One way to generate correction factors for your instrument is to scan the spectrum of astandard lamp. Since the actual irradiance values of the standard lamp as a function ofwavelength are known, simply ciividing the irradiance values by the lamp spectrumacquired on the spectrofluororneter results in a set of relative correction factors. This filecan then be applied to the raw fluorescence data. The emission correction factor fileN1CORRECT was acquired in this manner.
The general procedure, outlined on the following pages. consists of:
I. Obtaining a lamp scan;
Calculating, the irradiance values in photon units;
Entering the irradiance values into a data file;
3. Dividing the irradiance spectrum by the lamp scan to obtain thecorrection factors;
and
Normalizing the correction factor data file.
7-4
Correction Factors Fluor°Max-2 with DataMax
PDF compression, OCR, web optimization using a watermarked evaluation copy of CVISION PDFCompressor
Fluor°Max-2 with DataMax Correction Factors
To generate emission correction factors, several items are needed: a calibrated standardlamp, appropriate holders, and a catter assembly. ISA offers two kits3/4the Model 1908Standard Lamp Accessory and the Model 1908M0D Scatter Assembly. The Model 1908is a complete correction factor kit, while the Model 1908M0D Scatter Assembly isprovided for users who already have a calibrated standard lamp and a constant currentpower supply.
The Model 1908 Standard Lamp Assembly is a complete correction factor kit whichincludes the following items:
200 Watt quartz-tungsten halogen filament lamp with irradiance values
Constant Current Power Supply with lamp holder
1908M0D Scatter Assembly
The Model 1908MOD Scatter Assembly includes:
Lamp Mount Assembly and Mask with Square Center
Scatter Block with neutral density filter and reflectance plate
To obtain a corrected lamp scan,
From the software, turn off the high voltage to theemission photomultiplier.
Secure the scatter fixture in the sample chamber so thatlight is directed toward the right angle (RA) collectionpath.
Slide the mask over the scatter fixture mirror so that thesquare hole is vertically centered over the reflective plate.
PDF compression, OCR, web optimization using a watermarked evaluation copy of CVISION PDFCompressor

Correction Factors FluoroMax-2 with DataMax
4. Attach the lamp holder as shown in the following figure,securing it to the sampling module with the two longthumbscrews.
Lamp Holder
Without touching the outside of the standard lamp (uselens paper or cotton gloves), attach the two wire ends ofthe lamp to the holder. Make sure the nipple of the lampis pointed upward and that the filament is verticallycentered over the fixture.
With the slits closed, connect the two wire leads from theconstant current power supply to lamp holder. Attach thered wire to the red clip and the black wire to the blackclip located on the sides of the lamp holder.
Turn on the constant current power supply and wait untilthe current ramp function is 6.500amps. This may takeup to two minutes. For valid irradiance values, it iscritical that the lamp current is maintained at 6.500amps.
Caution: Avoid looking directly into the lamp radiation.wear protective eyeglasses to shield against ultravioletlight.
8. Turn off the room lights.
PDF compression, OCR, web optimization using a watermarked evaluation copy of CVISION PDFCompressor

FluoroMax-2 with DataMax Correction Factors
Set the emission spectrometer to 550nm and bothemission slits to a 5nm bandpass.
Note: The spectrometer is set to 550nm because when gratingsblazed at 500nm are used in the emission spectrometer, this is thewavelength of maximum intensity.
Turn on the high voltage to the signal detector and makesure the shutter is open.
Observe the intensity of the signal detector (This can bedone through the RTD application.)
Note: The signal level should not exceed 2x10⁶ cps, the linearrange of the detector when operated in the photon-counting modeof detection. If necessary, open or close the emission slits to adjustthe signal intensity.
A good emission correction factor file depends on ample signal at both high and lowpoints of the lamp spectrum.
Set the emission spectrometer to 290nm, the wavelengthat which the standard.lamp has its lowest light output.
Check the "s" signal to be sure that there is sufficientintensity above the dark counts.
To determine the dark counts, place the sample lid overthe mask to block light to the detector.
Enter the follow ing in the Data Acquisition Parametersmenu of an emission scan.
Run the standard lamp spectrum and title this fileSTDL AMP.
7-7
Parameters Value
Number of Scans 1
Start 290nmEnd 750 or 850nm
depending onPMT detector
Increment 5nmIntegration Time 5secExcitation Position Does Not MatterAcquisition Mode s
Auto Zero No
PDF compression, OCR, web optimization using a watermarked evaluation copy of CVISION PDFCompressor

Correction Factors Fluor°Max-2 with DataMax
When the scan is complete,
Place the lid over the mask to block the light between thestandard lamp and the scatter fixture.
Run another scan using the same parameters, and namethis file BLANK. This data file represents the extraneousdark counts of the system and is a straight line with lowintensity.
Using the Arithmetic menu, subtract BLANK fromSTDLAMP and title this file STDLAMP2.
The diagram below, is a view of the blank and the standard lamp spectra. Notice that theblank is almost non-existent. Because of the low intensity of the blank file, the blank-subtracted file, STDLAMP2, will resemble the STDLAMP file.
1.20c+06
9.00e+05-
n
t 6.00c-05
p 3.00e+OS1
S
0.0000
STDLAMP
Your spectrum should appear similar to the one pictured above. Its actual appearance,however, depends on the photomultiplier in the system. The lamp scan shown above wasacquired with an R928P red-sensitive photomultiplier. A different photomultiplier willalter the shape of the lamp spectrum.
It is possible to obtain emission correction factors for the region between 250nm and290nm. However, because the gratings are extremely inefficient in this ran2e and thestandard lamp output is low, generating these factors is somewhat more involved.
The next phase of determining the values for the emission correction factors has to dowith irradiance values.
Irradiance values for a standard lamp, packaged with the lamp, are usually expressed in
10-6W/cm2 nm. However, with photon-counting systems like the FluoroNlax-2
spectrofluorometer, data are usually corrected in units of photons/sec cm2 nm.
arelengTh (nrn)
PDF compression, OCR, web optimization using a watermarked evaluation copy of CVISION PDFCompressor
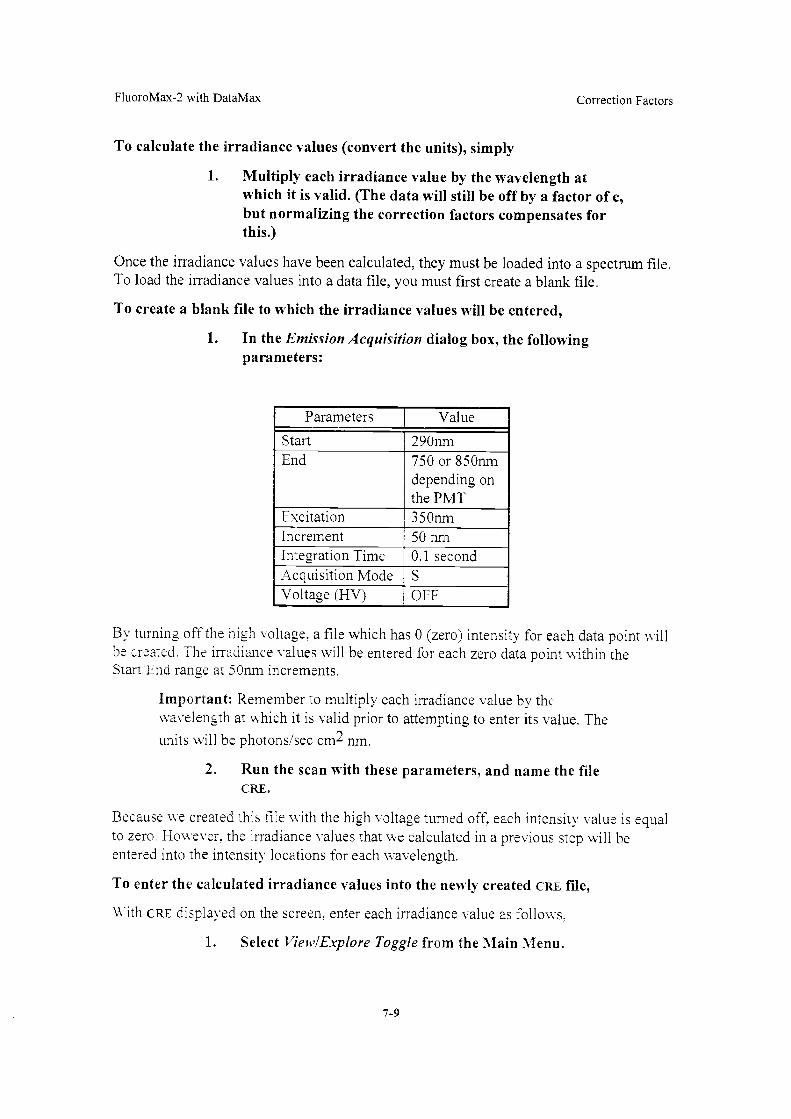
FluoroMax-2 with DataMax Correction Factors
To calculate the irradiance values (convert the units), simply
1. Multiply each irradiance value by the wavelength atvvhich it is valid. (The data will still be off by a factor of c,but normalizing the correction factors compensates forthis.)
Once the irradiance values have been calculated, they must be loaded into a spectrum file.To load the irradiance values into a data file, you must first create a blank file.
To create a blank file to vvhich the irradiance values will be entered,
In the Emission Acquisition dialog box, the followingparameters:
By turning off the high voltage, a file which has 0 (zero) intensity for each data point willbe created. The irradiance values will be entered for each zero data point within theStart End ran2e at 50nm increments.
Important: Remember to multiply each irradiance value by thewavelength at which it is valid prior to attempting to enter its value. The
units will be photons/sec cm2 nrn.
Run the scan with these parameters, and name the fileCRE.
Because we created this file with the hizh voltage turned off, each intensity value is equalto zero, However, the irradiance values that we calculated in a previous step will beentered into the intensity locations for each wavelength.
To enter the calculated irradiance values into the newly created CRE file,
A,Vith CRE displayed on the screen, enter each irradiance value as follows,
1. Select ViewlExplore Toggle from the Main Menu.
Parameters Value
Start 290nmEnd 750 or 850nm
depending onthe PMT
Excitation 350nrnIncrement 50 nrnIntegration Time 0.1 secondAcquisition Mode S
Voltage (HV) OFF
PDF compression, OCR, web optimization using a watermarked evaluation copy of CVISION PDFCompressor
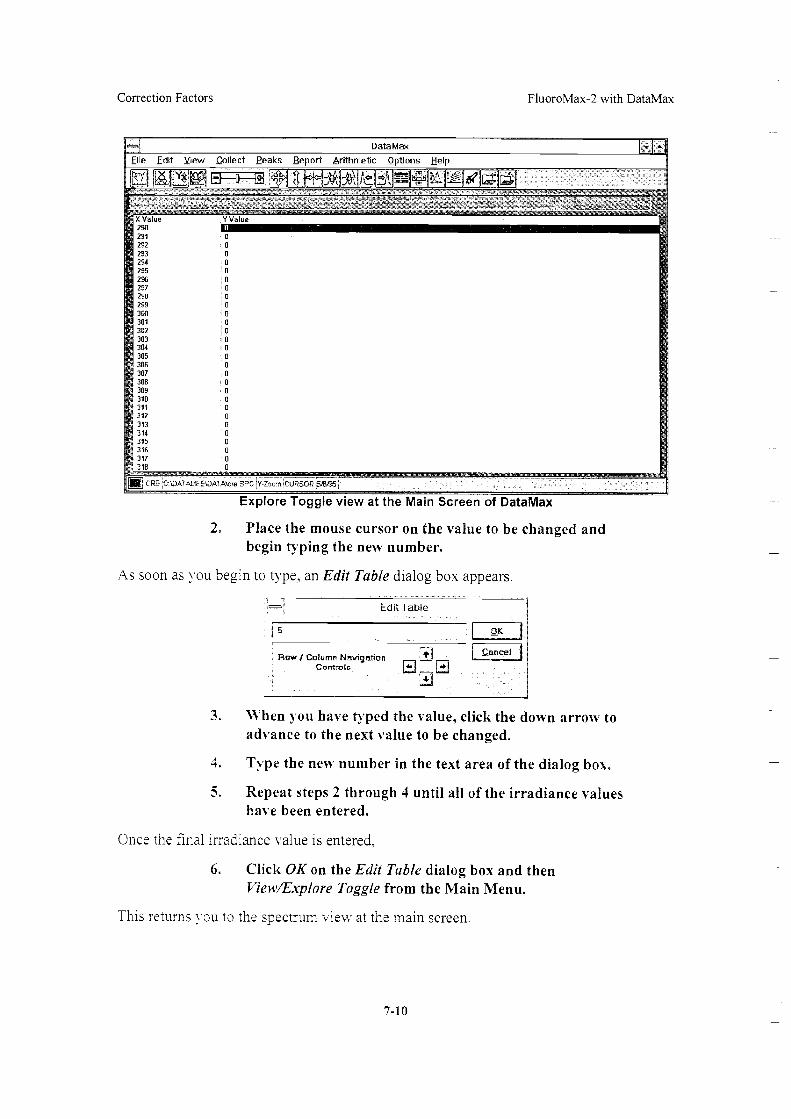
Edit View Lollect Eeaks Report Arithmetic
X Value290291
292293294295296297298299300301302303304
305306307
308309
310311312
313314315316
317318
CRE C ZATALIFBOATA\cre SPC 'Y Zoom tURSOP 5,13/35
Explore Toggle view at the Main Screen of DataMax
2. Place the mouse cursor on the value to be changed andbegin typing the new number.
As soon as you begin to type, an Edit Table dialog box appears.
When you have typed the value, click the dovvn arrow toadvance to the next value to be changed.
Type the new number in the text area of the dialog box.
Repeat steps 2 through 4 until all of the irradiance valueshave been entered.
Once the final irradiance value is entered,
Click OK on the Edit Table dialog box and thenView/Explore Toggle from the Main Menu.
This returns you to the spectrum view at the main screen.
7-10
Correction Factors FluoroMax-2 with DataMax
PDF compression, OCR, web optimization using a watermarked evaluation copy of CVISION PDFCompressor

FluoroMax-2 with DataMax Correction Factors
7. From the Main Menu, click File/Save as and save thisnew file as CRE.
The CRE file has the irradiance values incremented every 50nnn. Since the STDLAMP2 fileacquired previously was incremented at 5nm, to calculate the actual correction factors, itis necessary for the irradiance file to have a 5nm increment.
Create another blank file - this time, however, enter 5nm for the Increment instead of50nm; title this file IRR (as described below):
1. In the Emission Acquisition dialog box, enter thefollowing parameters:
B. , turning off the high voltage, a file which has 0 (zero) intensity for each data pointbe created. The irradiance values will be entered for each zero data point within theStart/End range at 5= increments.
Run the scan with these parameters, and name the fileIRR.
Because we created this file with the high voltage turned off, each intensity value is equalto zero. Hov,ever, the irradiance values that we calculated in a previous step will beentered into the intensity locations for each wavelength.
When this scan is complete, the scan range will be from 300= to 850nm with anincrement of 5=. All data points will have intensity values of 0 cps.
Using the Arithmetic menu, add the constant 1 to the 1RRfile and save it under the same name (this causes theoriginal, IRR , to be ovenvritten).
Multiply IRR by CRE and save the resulting file as IRR(this causes the original IRR file to be overwritten).
Parameters Value
Start 290nmEnd 750 or 850nm
depending onthe PMT
Excitation 350nmIncrement 5 nmIntegration Time 0.1 secondAcquisition Mode S
Voltage (HV) OFF
PDF compression, OCR, web optimization using a watermarked evaluation copy of CVISION PDFCompressor
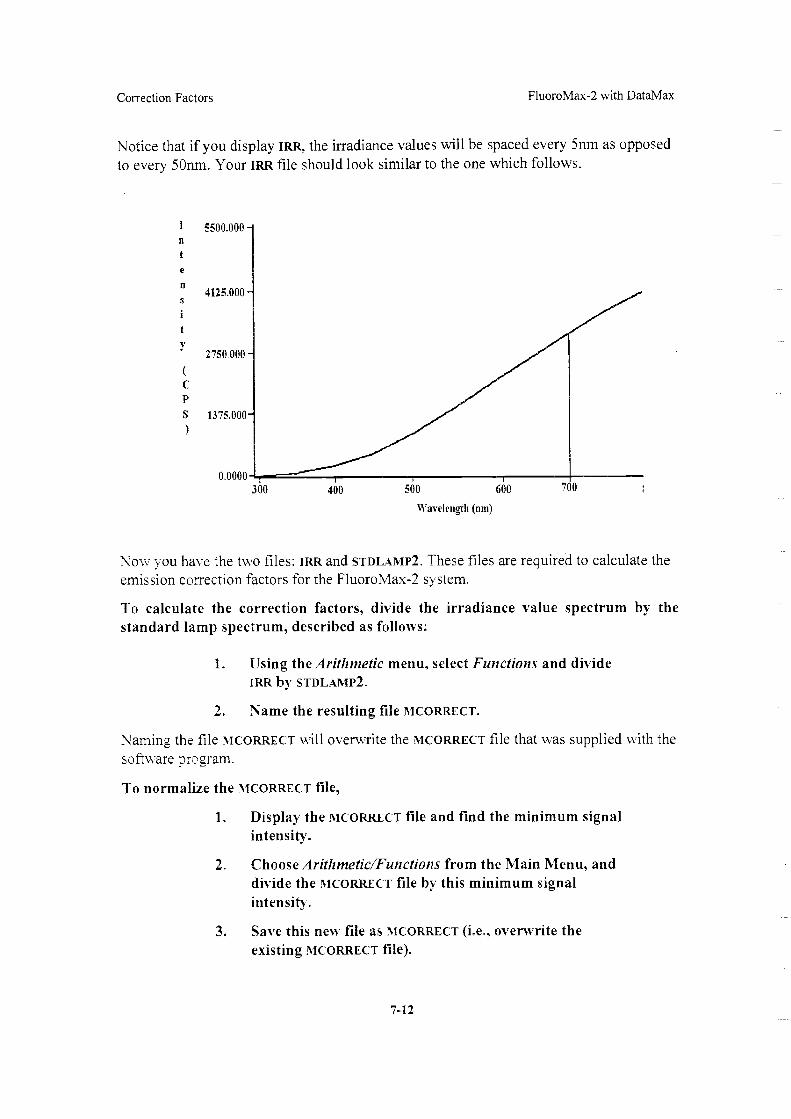
Correction Factors FluoroMax-2 with DataMax
Notice that if you display IRR, the irradiance values will be spaced every 5nm as opposedto every 50nm. Your IRR file should look similar to the one which follows.
S 1375.000
0.0000300 400 500 600 700
Wavelength (mm)
NOW you have the tv1/4.o files: IRR and STDLAMP2. These files are required to calculate theemission correction factors for the FluoroMax-2 system.
To calculate the correction factors, divide the irradiance value spectrum by thestandard lamp spectrum, described as follows:
Using the Arithnzetic menu, select Functions and divideIRR by STDLAMP2.
Name the resulting file MCORRECT.
Naming the file MCORRECT will overwrite the MCORRECT file that was supplied with thesoftware program.
To normalize the MCORRECT file,
Display the MCORRECT file and find the minimum signalintensity.
Choose Arithmetic/Functions from the Main Menu, anddivide the MCORRECT file by this minimum signalintensity.
Save this new file as N1CORRECT (i.e., overwrite theexisting MCORRECT file).
7-12
1
e
5500.000
4125.000
Y2750.000
PDF compression, OCR, web optimization using a watermarked evaluation copy of CVISION PDFCompressor

This process normalizes the correction factor file such that the minimum intensity ofMCORRECT will be lcps.
MCORRECT contains the emission correction factors for the system. The correction factorfile should look similar to the following:
200.000
150.000
100.000
50.000
8.080e3 0 40
Comparison between the standard 1527Pand optional R928P photonultipliers.
Signal Detector1527P -->
Standard
50 6Wavelength (nm)
70 13
The correction factors shown above were acquired for a FluoroMax-2 system withgratings blazed in the visible region in the emission spectrometer and either standard(1527P) or optional (R928P) signal detector. Note that corrected emission data can beacquired to 850nm with the R928P detector.
Note: The correction factor file generated at ISA was produced byentering the irradiance values every- 5nm and then doing a fifth-orderpolynomial fit of data every 50nm. This results in a smoother and moreaccurate correction.
Once the emission correction factors have been determined, it may be necessary todetermine the excitation correction factors. The procedure which follows describes themethod for obtaining excitation correction factors.
ExcitationThe reference pliotodiode handles the 95% of excitation correction from 240nm to 850=when a ratio acquisition mode is selected (e.g., sir). However more accuratemeasurements require that compensation be applied for the difference in optical pathbetween the photodiode detector and the sample. The light going to the sample is onlytransmitted through one window before impining on the sample. The reflection spetralcharacteristics of the window and the mirror are the main contributors to the excitationcorrection factor curve.
An excitation con-ection factor file extending from 240nm to 600nm can be produced byacquirina and excitation scan of rhodamine-B. A different dye must be chosen to correctbeyond 600nm.
1. Fill a cuvette with a solution of rhodamine-B.
7-13
Signal Detector14928P -->
Optional
FluoroMax-2 with DataMax Correction Factors
PDF compression, OCR, web optimization using a watermarked evaluation copy of CVISION PDFCompressor

Correction Factors FluoroMax-2 with DataMax
The final concentration should be 8 grams/liter of laser-grade rhodamine-B in1,2-Propanediol.
Place the cuvette in the standard cell holder within thesample chamber of the FluoroMax-2.
Set the excitation and emission spectrometers to 467nmand 650nm, respectively.
The excitation spectrometer is positioned at 467nm because the largest lamp spike occursat this wavelength.
Set the two slits on the excitation spectrometer to 0.5mm.
Open the shutter.
Set the excitation spectrometer to 560nm and theemission spectrometer to 630nm.
Adjust the slits on the emission spectrometer until asignal intensity of no greater than 4 x 10⁶ counts/secondis achieved. (Observe the signal through the RTDapplication.)
The slit width discovered in this step will be used to run the scan.
Close the excitation shutter. This will prevent light fromreaching the detector.
Retrieve the Excitation Acquisition dialog box from theExperiment/Post Processing application.
Using the parameters obtained in the previous steps andthose show n below, complete the Data AcquisitionParameters dialog box as follovvs.
Execute the scan and save the file as XCORRECT. Doing sowill replace the XCORRECT file that was shipped with yoursystem.
Parameters Value
Start 240=End 600Emission 630nmIncrement 5 =Intearation Time 5.0 secondAcquisition Mode SIR
Voltage (HV) OFF
PDF compression, OCR, web optimization using a watermarked evaluation copy of CVISION PDFCompressor

Fluor°Max-2 with DataMax Correction Factors
Note: The xenon lamp spectrum has a low signal intensity at 250nm. Ifzeroes are encountered at the lower wavelength end of the spectrum, openthe excitation slits a little wider.
If no zeroes are encountered, invert the data by using theArithmetic menu to divide the spectrum into 1.
Normalize the data by locating the minimum data pointand dividing the file by that value.
Save the normalized file as XCORRECT. This will overwritethe existing excitation correction factor file.
Using Correction FactorsOnce the excitation and emission correction files have been created they are stored ondisk in the same directory as the program files. These files can be selected either beforean experiment is conducted and the data will be corrected as it is collected, or the filescan be selected at the completion of an experiment and the data can be corrected after it iscollected. The following sections describe both scenarios.
During AcquisitionTo acquire corrected emission data automatically, simply enter (or select) MCORRECT inthe Correction File dialog box (accessed by clicking the Correction button located oneach acquisition screen). To acquire corrected excitation data, enter or select XCORRECT.
After AcquisitionTo apply the correction factors after the data have been acquired, multiply the data file bythe appropriate correction factor file (MCORRECT or XCORRECT).
To do this, make sure the trace to which the arithmetic will be applied is currentlyactive and,
Select Arithmetic/Functions from the Main Menu.
The Math Functions dialog box appears.
Execute the correction:
For Function, select Multiply.
For Operand, select Term File*K.
Click on the New Term File button.
'7-15
PDF compression, OCR, web optimization using a watermarked evaluation copy of CVISION PDFCompressor

Correction Factors Fluor°Max-2 v., ith DataMax
From the SPC-Select New Term File dialog box,choose the correction factor file (XCORRECT.SPC orMCORRECT.SPC) and click OK.
Replace the "0" in the text area K with a "1".
Click the OK button.
From the Math Functions pop-up dialog box thatappears, click on Add New.
The screen will split to show the result of the calculation as traceNumber I and the original file as trace Number two.
I. Make sure the first spectrum is active (click on thetrace) and select file/save as to name (the default nameis math fune.spc) the file.
The trace that appears on the screen is a product of the operation resulting in a correctedspectrum.
Usinaand being able to generate correction factors are essential to obtaining
reliable results. This chapter has discussed not only using the correction factorsfor emission and excitation (both durina and after data acquisition), but has also
outlined the procedure for generating new sets of factors. These factors should begenerated whenever a hardware change necessitates the generation of new factors.
7-16
PDF compression, OCR, web optimization using a watermarked evaluation copy of CVISION PDFCompressor

CHAPTER VIII
Accessories
Thissection describes each optional accessory. These accessories enable you to
customize your FluoroMax-2 for specific applications. For information aboutthese and new fluorescence accessories, please call us or yotu- local representative.
The following list represents all the accessories that are available for the SPEX brandFluoroMax-2 spectrofluorometer. Two charts of accessories are included on the followingpage. The first chart is an alphabetized list of accessories, and the second list is arrangedaccording to model numbers. The descriptions which follow are alphabetized exceptwhere logical order dictated otherwise.
For additional infoiniation or product literature on any of these items, contact your localsales representative.
PDF compression, OCR, web optimization using a watermarked evaluation copy of CVISION PDFCompressor

FLU0R0MAX-2 ACCESSORIES (ALPHABETIZED)
ITEM MODEL
ACCESSORY, TRIGGER TRIG-15125ADAPTER for 50u1 Micro Cell I923AADAPTER for 250u1 Micro Cell 1924ACELL, HPLC FLOW, 20u1 1955CELL, MICRO, 250u1, Cylindrical, Quartz(Requires Model 1924A Adapter)
1924
CELL, MICRO, 50u1, Cylindrical , Quartz (RequiresModel 1923A Adapter)
1923
CELL, REDUCED-VOLUME, 1 ml, 5mmx5mm,(Includes Adapter and Magnetic Stirrer)
QC-SK
CUVETTE, 4m1, Quartz, Capped 1920CUVETTE, 4m1, Quartz, Stoppered 1925
DEWAR, Liquid Nitrogen Assembly 1970FIBER OPTIC BUNDLE, 1 Meter, Bifurcated,Randomized (For Use with Model 1950F)
1950-1M
FIBER OPTIC BUNDLE, 2 Meters, Bifurcated,Randomized (For Use with Model 1950F)
1950-2M
FIBER OPTIC BUNDLE, 5 Meters, Bifurcated,Randomized (For Use with Model 1950F)
1950-5M
FIBER OPTIC PLATFORM (Requires Fiber OpticBundle)
1950F
FILTER SET, CUT-ON 1939KVFILTER KIT SET and Holder (Includes Models1939F and 1939KV)
1939M
HOLDER, Filter 1939FHOLDER. Four-Position, Automated, Thermostattedwith Magnetic Stirrer
1972
HOLDER. Monolayer Coverslip CM-MHHOLDER. Single-Cell, Thermostatted, Front-Facewith Magnetic Stirrer
1967
HOLDER, Solid Sample 1933
HOLDER, Thermostarted Single-Cell \N ith MagneticStirrer
1962A
INJECTION PORT 1966LAMP, Xenon Replacement, 150W Ozone-Free 1905-0FRPHOTOMULTIPLIER, Red- Sensitive (R92 8P) 96455POLARIZATION ACCESSORY. Automated,L-F=at
1971
POLARIZATION ACCESSORY, Manual, L-Format 1964ASHUTTER. Emission: Lid Activated 1692F
Accessories FluoroMax-2 with DataMax
PDF compression, OCR, web optimization using a watermarked evaluation copy of CVISION PDFCompressor

8-3
FLUOROMAX-2 ACCESSORIES (BY MODEL NUMBERS)
MODEL ITEM
1692F SHUTTER, Emission; Lid Activated1905-0FR LAMP, Xenon Replacement, 150W Ozone-Free1920 CUVETTE, 4m1, Quartz, Capped1923 CELL, MICRO, 50u1, Cylindrical, Quartz (Requires Model 1923A
Adapter)1923A ADAPTER for 50u1 Micro Cell1924 CELL, MICRO, 250u1, Cylindrical, Quartz (Requires Model 1924A
Adapter)1924A ADAPTER for 250u1 Micro Cell1925 CUVETTE, 4m1, Quartz, Stoppered1933 HOLDER, Solid Sample1939F HOLDER, Filter1939KV FILTER SET, CUT-ON
1939M KIT, FILTER SET and Holder (Includes Models 1939F and1939KV)
1950-1M FIBER OPTIC BUNDLE, 1 Meter, Bifurcated, Randomized (For Usewith Model 1950F)
1950-2M FIBER OPTIC BUNDLE, 2 Meters, Bifurcated, Randomized (ForUse with Model 1950F)
1950-5M FIBER OPTIC BUNDLE, 5 Meters, Bifurcated, Randomized (ForUse with Model 1950F)
1950F FIBER OPTIC PLATFORM (Requires Fiber Optic Bundle)1955 CELL, HPLC FLOW, 20u11962.A HOLDER, Thermostatted Single-Cell with Magnetic StirrerI 964A POLARIZATION ACCESSORY, Manual, L-Format1966 INJECTION PORT
1967 HOLDER, Single-Cell, Thermostatted, Front-Face with MagneticStirrer
1970 DEWAR, Liquid Nitrogen Assembly1971 POLARIZATION ACCESSORY, Automated, L-Format1972 HOLDER, Four-Position, Automated, Thermostatted with Magnetic
Stirrer96455 PHOTOMULTIPLIER, Red-Sensitive (R928P)CM-MH HOLDER, Col, erslipQC-SK CELL, REDUCED-VOLUME, lml, 5mmx5rnm. (Includes Adapter
and Magnetic Stirrer)TR1G-15 '25 ACCESSORY, TRIGGER
FluoroMax-2 with DataMax Accessories
PDF compression, OCR, web optimization using a watermarked evaluation copy of CVISION PDFCompressor

Model TR1G-15/25 External Trigger Accessory
The TRIG-I 5/25 accessory permits the fluorescence systems to be operated with almostany external trigger stimulus. Data acquisition can be synchronized with external eventseither automatically following a voltage pulse (minimum 3V above ground) or manuallyby pushing a button on the end of a cable that is attached to the trigger accessory.Multiple trigger events are recorded and stored with the associated data file. A TTLtrigger output is also provided for activating external devices such as a stopped-fiow unit.The front panel (see figure below) has four sets of banana-jack inputs for twoindependent trigger inputs, Trigger I and Trigger 2.
LED I LED 2 LED 3Trigger I Power Trigger 2
Model TRIG-15/25 External Trigger Accessory
There are two sets of jacks for each of these tWO trigger inputs: an upper set for manualswitch inputs and a lower set for pulsed voltage inputs. These two types of inputs (switchcontact and active pulse) can be used simultaneously, but any one event will be ignoredwhile the interface is activated by another.
Although the standard FluoroMax-2 spectrofluorometer system is equipped andconfigured to enable a broad spectrum of samples to be run and a wide variety ofexperiments to be performed, the available accessory: increases performance profile of thesystem.
Model 1923 Micro Cell (with Model 1923A Adapter)
This non-fluorescing fused silica cylindrical cell holds a 50u1 volume. This cell will notaccept a magnetic stirrer. The 1923A Adapter is required to be able to mount in astandard lOmm by lOmm cell holder.
Accessories FluoroMax-2 with DataMax
Switch 1
Pulse
4-- Switch 2
4 Pulse 2
PDF compression, OCR, web optimization using a watermarked evaluation copy of CVISION PDFCompressor

FluoroMax-2 with DataMax Accessories
Model 1955 HPLC Flow Cell
With a sample capacity of 20u1, this non-fluorescing HPLC fused silica cell is ideal foron-line monitoring of fluorescent samples. The cell maintains high sensitivity because ithas a large aperture for collecting the excitation light to the sample and fluorescenceemission from the sample.
The flat sides allow maximum throughput while keeping the scattering of the incidentradiation to a minimum. The cell fits in a standard cell holder.
Model 1924 Micro Cell (with Model 1924A Adapter)
This non-fluorescing fused silica square cylindrical cell holds a 250u1 volume. Amagnetic stirrer cannot be used with this cell. The 1924A Adapter is required to enablemountina in the standard lOmm by lOmm cell holder.
Model QC-SK Reduced 'Volume Sample Cell
This non-fluorescing fused silica cell is selected for samples with a maximum volume oflml. The square cross section of the sample cavity is 5mm. The precise imagingcapability of the excitation light focused onto the sample allows for high sensitivity Theadapter and a "flea" magnetic stirrer are included.
Model 1920 Quartz 4m1 Capped Cuvette
This non-fluorescing fiised silica cell is selected for samples with a maximum volume of4m1. The square cross-section of the sample cavity is lOmm. The cell includes a Tefloncap that can be secured to prevent sample evaporation.
12.5mmlo
K.:0
gig WAIF
FluorescentRadiatio n
PDF compression, OCR, web optimization using a watermarked evaluation copy of CVISION PDFCompressor
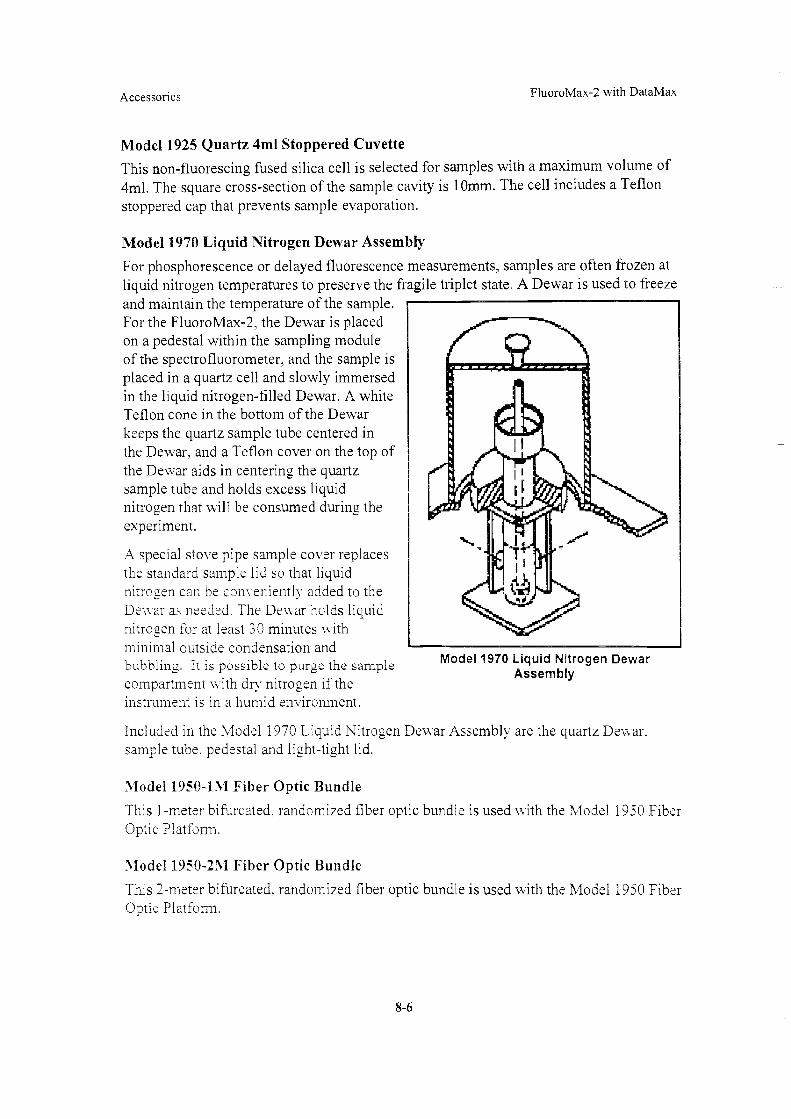
Model 1925 Quartz 4m1 Stoppered Cuvette
This non-fluorescing fused silica cell is selected for samples with a maximum volume of4m1. The square cross-section of the sample cavity is lOmm. The cell includes a Teflonstoppered cap that prevents sample evaporation.
Model 1970 Liquid Nitrogen Dewar Assembly
For phosphorescence or delayed fluorescence measurements, samples are often frozen atliquid nitrogen temperatures to preserve the fi-agile triplet state. A Dewar is used to freezeand maintain the temperature of the sample.For the FluoroMax-2, the Dewar is placedon a pedestal within the sampling moduleof the spectrofluorometer, and the sample isplaced in a quartz cell and slowly immersedin the liquid nitrogen-filled Dewar. A whiteTeflon cone in the bottom of the Dewarkeeps the quartz sample tube centered inthe Dewar, and a Teflon cover on the top ofthe Dewar aids in centering the quartzsample tube and holds excess liquidnitrogen that will be consumed during theexperiment.
A special stove pipe sample cover replacesthe standard sample lid so that liquidnitrozen can be con\ eniently added to theDewar as needed. The Dewar holds liquidnitrogen for at least 30 minutes v,ithminimal outside condensation andbubbling. It is possible to purge the samplecompartment with dry nitrogen if theinstrument is in a humid environment.
Included in the Model 1970 Liquid Nitrogen Dewar Assembly are the quartz Dewar,sample tube, pedestal and light-tight lid.
Model 1950-1M Fiber Optic Bundle
This 1-meter bifurcated, randomized fiber optic bundle is used with the Model 1950 FiberOptic Platform.
Model 1950-2M Fiber Optic Bundle
This 2-meter bifurcated, randomized fiber optic bundle is used with the Model 1950 FiberOptic Platform.
Model 1970 Liquid Nitrogen DewarAssembly
Accessories Fluor°Max-2 with DataMax
PDF compression, OCR, web optimization using a watermarked evaluation copy of CVISION PDFCompressor

FluoroMax-2 with DataMax Accessories
Model 1950-5M Fiber Optic Bundle
This 5-meter bifurcated, randomized fiber optic bundle is used with the Model 1950 FiberOptic Platform.
Model 1950F Fiber Optic Platform
This accessory is used for remote fiber optic sensing in the region between 250nm and850nm. It provides remote fiber optic sensing for samples that cannot be positioned in thesample chamber.
Light from the excitation spectrometer is focused onto the fiber optic bundle and thendirected to the sample. The fluorescence is then collected by the accessory and redirectedto the emission port in the sample compartment.
1939F Filter
The holder consists of two parts: a mounting fixture placed in the sample chamber, andthe 1939F filter holder. The randomized, bifurcated fiber optic bundle is available in threelengths: 1, 2 and 5 meters. When ordering these, please use the following part numbers:1950-1M, 1950-2M, and 1950-5M.
N1odel 1939KV Cut-On Filter Set
The Model 1939KV Cut-On Filter set consists of five 1-inch diameter filters withdifferent cut-on waveleng_ths. To properly position the filter, the Model 1939F FilterHolder is required.
Cut-on filters are used to eliminate second-order effects of the gratings. For example, ifsample excitation is at 300run, a second-order peak will occur at 600nrn. If your emissionspectrum extends from 400nm to 650nm, a sharp spike will occur at 600nm. This peak isthe second-order peak of the excitation spectrometer. To remove this unwanted peak in
8-7
PDF compression, OCR, web optimization using a watermarked evaluation copy of CVISION PDFCompressor

Accessories FluoroMax-2 with DataMax
the emission spectrum, place a 350nm filter in the emission slot. Cut-on filters aretypically used for phosphorescence measurements, where second-order effects are likelyto be found.
Model 1939M Filter Set Kit with Holder
This accessory includes Model 1939F Filter Holder for 1-inch diameter filters and Model1939KV Filter set consisting of five 1-inch filters.
Model 1939F Cut-On Filter Holder
Cut-on filters are used to eliminate second-order effects of the gratings. Refer to eitherModel 1939KV Cut-On Filter Set for a detailed description of the placement of the filterholder and thc interaction of the cut-on filters and the holder.
Model 1972A Automated Four-PositionThermostatted Cell Holder
The Model 1972A Automated Four-PositionThermostatted Cell Holder, (pictured left) keeps asample at a constant temperature from -10°C to 80°C.
The temperature of the sample is maintained by aliquid mixture pumped through from an externalcirculating temperature bath (not included).
The holder also includes a magnetic stirrer, enablingyou to mix a turbid or a viscous sample while it ispositioned in the light beam
PDF compression, OCR, web optimization using a watermarked evaluation copy of CVISION PDFCompressor

FluoroMax-2 with DataMax Accessories
Model CM-MH Monolayer Coverslip Holder
The Model CM-MH Monolayer Coverslip holder consists of a cuvette insert that willhold a coverslip (2mm x7 mm) in the provided cuvette.
RotatableMount
SS Outlet
Coverslip
Two leads (outlet and inlet) permit the cells to be perfused with media. The CM-MH isused in conjunction with the front-face accessory.
Model 1967 Thermostatted Front-Face Single-Cell Holder vvith Magnetic Stirrer
Niodel 1933 Solid Sample Holder
The Model 1933 Solid Sample Holder is designedfor samples such as thin films. powders, pellets,microscope slides, and fibers. The holder consistsof a base, upon which a bracket, spring clip, andsample block rest.
To mount this accessoly,
Remove the current holder,
Position the base on the posts andtighten the two thumbscrevvs.
For samples such as pellets, crystals, creams, gels, powders and similar materials,
fill the well of the block and place a quartz coverslip or Teflon film over the well tohold the sample in place \ h e n vertically positioned. Carefully insert the block
8-9
SS Inlet
Model 1933 Solid Sample Holder
PDF compression, OCR, web optimization using a watermarked evaluation copy of CVISION PDFCompressor

Accessories FluoroMax-2 with DataMax
between the bracket and spring clip such that the fluorescence will be collected fromthe front surface of the sample.
If your sample is a thin film, microscope slide, fiber or other material,
place the material on the block on the side opposite that of the well, and insert theblock between the bracket and spring clip. The fluorescence emitted by the samplewill be directed to the emission port in the sample compartment.
Model 1962A Single -Position Thermostatted Cell Holder with Magnetic Stirrer
The Model 1962A Single-Position Thermostatted Cell Holder keeps a sample at aconstant temperature from -15°C to 100°C. The temperature is maintained by an ethyleneglycol-water mixture pumped through from an external circulating temperature bath (notincluded). The holder also includes a magnetic stirrer, enabling you to mix turbid orviscous samples.
Model 1962A Single -Position Thermostatted Cell Holder
To install the Model 1962A Single-Position Holder, remove the current holder from theposts, replace with this accessory. and tighten the two thumbscrews and attach the 1/2-inchtubing to the brass inlets on the bottom of the holder.
Important: Failure to clamp these hoses securely may result in floodingand damage to the optics and electronics of the instrument.
To use this accessory, place your sample in a lOmm x lOmm cuvette and insert amagnetic stirring bar (available from Bel-Art Products, Pequannock, NJ). Allow thesample to reach the desired temperature. Turn on the magnetic stirrer and select theappropriate speed. The speed at which the sample should be mixed depends on theviscosity of the sample.
8-10
PDF compression, OCR, web optimization using a watermarked evaluation copy of CVISION PDFCompressor

FluoroMax-2 with DataMax Accessories
Note: Selecting too high a speed may create a vortex, which could affectthe reproducibility of the measurement.
Run your experiment as usual. If the data appear to have noise spikes, adjust the speedand rerun the scans.
Model 1966 Injection Port
The Model 1966 Injection Port allows additions to be made to the sample cuvette using apipetter or other injection device without removing the FluoroMax-2 cover.
CoverPort
With the injector in place, a lock-tight seal is achieved, preventing both light and air toreach the sample.
4.11t=
Injector(Not Included)
Cover
PDF compression, OCR, web optimization using a watermarked evaluation copy of CVISION PDFCompressor
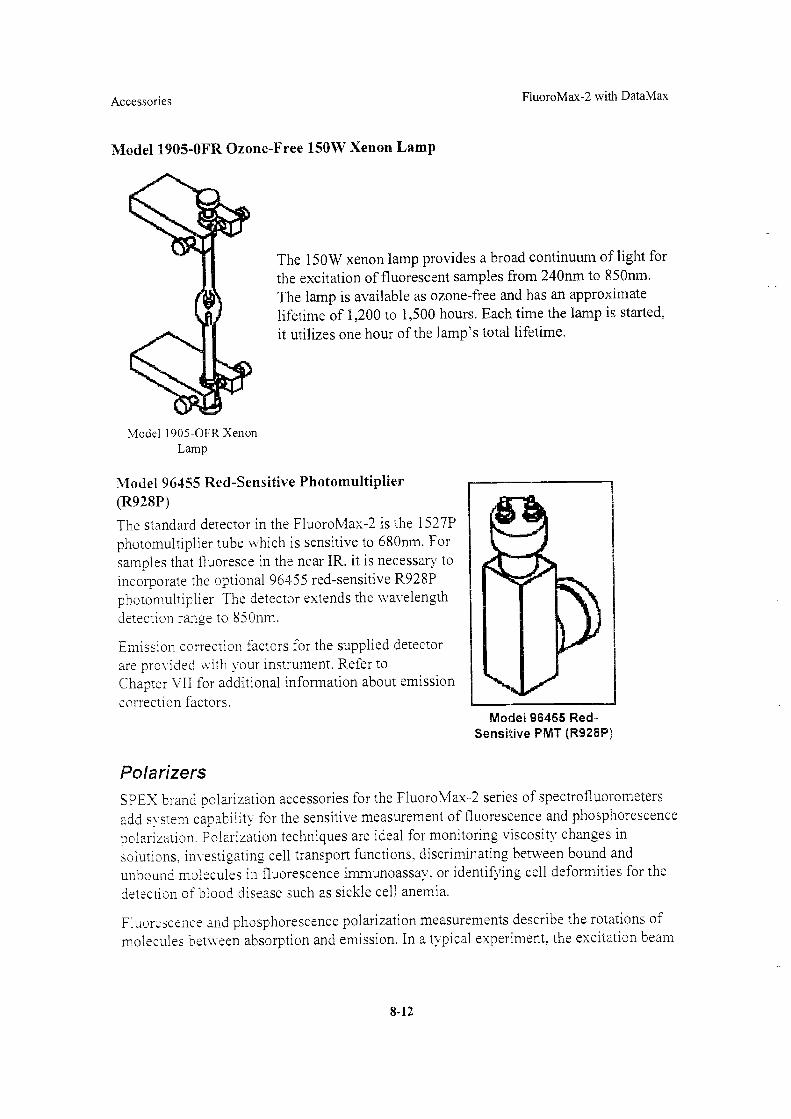
Model 1905-0FR Ozone-Free 150W Xenon Lamp
Model 1905-0FR XenonLamp
Model 96455 Red-Sensitive Photomultiplier(R928P)
The standard detector in the FluoroMax-2 is the 1527Pphotomultiplier tube which is sensitive to 680nm. Forsamples that fluoresce in the near IR, it is necessary toincorporate the optional 96455 red-sensitive R928Pphotomultiplier, The detector extends the wavelengthdetection ranae to 850nm.
Emission correction factors for the supplied detectorare pro\ ided with your instrument. Refer toChapter VII for additional information about emissioncorrection factors.
8-12
The 150W xenon lamp provides a broad continuum of light forthe excitation of fluorescent samples from 240nm to 850nm.The lamp is available as ozone-free and has an approximatelifetime of 1,200 to 1,500 hours. Each time the lamp is started,it utilizes one hour of the lamp's total lifetime.
Model 96455 Red-Sensitive PMT (R928P)
PolarizersSPEX brand polarization accessories for the FluoroMax-2 series of spectrofluorometersadd system capability for the sensitive measurement of fluorescence and phosphorescencepolarization. Polarization techniques are ideal for monitoring viscosity changes in
solutions, investigatin2 cell transport functions, discriminating between bound andunbound molecules in fluorescence immunoassay, or identifying cell defoimities for the
detection of blood disease such as sickle cell anemia.
Fluorescence and phosphorescence polarization measurements describe the rotations ofmolecules between absorption and emission. In a typical experiment, the excitation beam
Accessories FluoroMax-2 with DataMax
PDF compression, OCR, web optimization using a watermarked evaluation copy of CVISION PDFCompressor

Fluor°Max-2 with DataMax Accessories
is passed through a polarizing prism, and the emitted light is analyzed with anotherpolarizer that is oriented parallel or perpendicular to the excitation polarizer.
Polarization measurements yield information about molecular size, conformation,rigidity, and viscosity.
Each rolarization kit includes Glan-Thompson UY polarizers and manually controlledmor nt. Polarizers can be positioned horizontally, vertically, and at the magic anglesettings of 35 degrees and 55 degrees. Glan-Thompson polarizers offer a much widertransmission range than film polarizers, from about 215nm to about 2,300nm, and moreuniform polarization across wavelengths. And unlike film polarizers, they will not bleachout after prolonged exposure to UV excitation radiation.
Refer to the software manual for additional information about polarization capability.
The following polarizer options are available for the FluoroMax-2 spectrofluorometer.
Model 1971 Automated L-Format Polarization Accessory
The Model 1971 Automated Polarization Accessory permits complete control of yourpolarization experiments from the computer keyboard. The Model 1971 lets you automateall the necessary- polarizer rotations for measurement of VV, VH, HH, and HVcomponents.
The Model 1971 polarization kit includes two UV polarizers: one polarizes the excitationlight, and the other, positioned at ninety degrees to the incident light, analyzes thefluorescence or phosphorescence emission.
Model 1964A L-Format Manual Polarization Accessory
The simplest and most economical option, the model 1964A Polarization Kit includestwo 1:y polarizers: one polarizes the excitation light, and the other, positioned at ninetydegrees to the incident light, analyzes the fluorescence or phosphorescence emission.
Excitation Emission
Handle
Setscrews
Model 1939Filter Holder
The polarizers are manually positioned between measurements VV. VH, HH, and HV.
PDF compression, OCR, web optimization using a watermarked evaluation copy of CVISION PDFCompressor

Accessories FluoroMax-2 with DataMax
Model 1692F Computer Controlled Emission Shutter
The FluoroMax-2 can be equipped with a lid-activated emission shutter. Although it isnot provided standard because of the infrequency of its need, it can be included as anoption during purchase or it can be purchased later and installed by the customer.
Thislist of accessories is current to the date of publication. However, as industry
leaders conscience of the ever-changing needs of researchers, ISA continues todesign, manufacture, and improve accessories for its line. To find out what other
accessories may exist, feel free to contact the Fluorescence Department or your localsales representative.
PDF compression, OCR, web optimization using a watermarked evaluation copy of CVISION PDFCompressor

CHAPTER IX
Maintenance
yourFluoroMax-2 spectrofluorometer requires very little maintenance. The
outside panels may be wiped with a damp cloth to remove dust and fingerprints.The lamp is the only component that has to be replaced routinely. Regular
examination of lamp and water Raman spectra will serve as early indicators of thesystem's integrity. These two tests are described in Chapter V.
LampObtaining good spectral results is contingent upon the xenon lamp. After 1.200 to 1,500hours of use, the lamp output decreases significantly, indicating that the lamp should bereplaced. A new lamp will produce a peak intensity with a minimum of 200,000 cps;when the current lamp produces a peak intensity if less than 60,000 cps, it is time toreplace it. Replacing the lamp within the specified time may prevent a catastrophicfailure. It is advisable to keep a laboratory notebook by the FluoroMax-2 so that it isconvenient to record when the lamp is turned on and off. Remember, each time the lampis turned on. it constitutes one full hour of use. therefore, we suggest leaving the lamp onduring, brief periods of inactivity. Record the hours of use on the form in Appendix C.
ReplacementThe replacement xenon lamp is packed in the manufacturer's box and must be installed inthe lamp housing. Read all the packing material including instructions and precautionsbefore attempting to insert the lamp into the lamp housing. Do not remove the protectivecover from the replacement xenon lamp until instructed to do so.
Once the lamp has been replaced, it will require a burn-in period of a maximum of sixhours to stabilize, and after the burn-in period, the lamp must be adjusted for optimalsiznal intensity.
To replace and adjust the lamp. a Phillips screwdriver. a 1/8-inch Allen \\Tench, a 116-inch Allen wrench and a 3'16-inch Allen wrench are required.
Road and follow the cautions presented below whenever using or handling xenon lamps.
PDF compression, OCR, web optimization using a watermarked evaluation copy of CVISION PDFCompressor

Warning!Xenon lamps, by nature, represent an explosion hazard. Make sure the power isoff and all AC is disconnected from the system. Read and follow the cautionspresented below.
Xenon arc lamps are an explosion hazard. Wear goggles and protectiveclothing when opening the lamp housing and when handling the lamp.
The lamp power supply should not be connected to an AC power linewhile handling lamp leads. Lethal high voltages may exist.
The lamp will remain extremely hot for approximately one-half hourafter it has been turned off Do not touch the lamp or the metal unituntil the lamp has cooled.
Never look directly at the xenon arc or its reflection. Intense radiationcan peimanently damage eyes.
Do not touch the focusina lens, back scatter mirror, or the surface ofthe lamp. Fingerprints will be burned onto these surfaces when thelamp is ignited.
To replace the lamp,
Unplug the power cord of the Fluor°Max-2 from the Ni a 1 1 .
Disconnect the RS232 cable, trigger box cable (ifincluded), pow er cord and any other cables attached tothe unit.
Maintenance F1uor°Max-2 with DataMax
PDF compression, OCR, web optimization using a watermarked evaluation copy of CVISION PDFCompressor

/ /7Yaraft:e,r-2Arimmir.
o o
Shows three screws along the bottom and two behind the sample compartment
There are twenty-three screws securing the cover. Although all screws are Phillipshead screws, there are two different sizes and tvvo different types of screws securingthe cover. Make sure you keep the screws separate and return them to the properposition w hen the procedure is complete. The follovving list displays the screwpositions and quantities.
9-3
Qt. Position Size/Style
6 Top Rear 8.32x3/8"/Raised Head
/ Lower Left 8.32x318"/Raised Head
2 LOIN er Right
2 Top Behind Sample Compartment Lid (Countersunk) 8.32x3/8"/Flat Head
3 Along Front Bottom 8.32x3/8"/Raised Head
Open Sample Compartment to Access the Following
2 Left Side Top of Sample Compartment(Countersunk) 8.32x318"/Flat Head
2 Right Side Top of Sample Compartment(Countersunk) 8.32x3/8"/Flat Head
1 Left Front of Sample Compartment(Countersunk) 8.32x3/8"/Flat Head
Right Front of Sample Compartment(Countersunk) 8.32x3/8"/Flat Head
2 Front Below Sample Compartment 6.32x1/4"/Raised Head
FluoroMax-2 with DataMax Maintenance
PDF compression, OCR, web optimization using a watermarked evaluation copy of CVISION PDFCompressor

Maintenance FluoroMax-2 with DataMax
//Zuaralic7A-2
o
. Alkwo e
o
Shows screws surrounding the sample chamber
3. Remove each of the screws listed above, remembering tokeep them arranged in such a way as to facilitate re-assembly.
Some FluoroNlax-2 systems are equipped with an automatic magnetic stirrer. If thisis the case, the knob of the stirrer must be removed before the cover can be liftedoff.
9-4
o
o o
100i4ut_: E E
PDF compression, OCR, web optimization using a watermarked evaluation copy of CVISION PDFCompressor

FluoroMax-2 front panel
3 \
orr
Stir
Knob for stirrer
3. Use the 1/16-inch Allen wrench to loosen the setscrew inthe knob.
Loosen setscrew and remove knob
FluoroMax-2 with DataMax Mairitenance
PDF compression, OCR, web optimization using a watermarked evaluation copy of CVISION PDFCompressor

Maintenance Fluor°Max-2 with DataMax
4. When the knob turns freely, remove it and place it in asafe place.
Removing the knob exposes the knob post
Once the screws and the knob are removed, you can remove the cover of theFluoroMax-2.
Facing the system, place one hand on either side of theFluoroMaN-2, near the center with palms against the unit.
Lift the back so that the rear pops up.
Slide the entire cover fonvard far enough so that thefront of the col er clears the fittings belovv the samplecompartment.
Lift straight up, raising the cover above the FluoroMax-2.
Rest the cover on its rear on the floor (or other sturdysurface). Positioning the cover any other way will marthe surface of the cover or bend the frame.
The lamp housing is on the left (when standing in front of the speetrofluorometer).
Remove the four screws from the lamp housing cover andloosen the thumbscrew to remove the housing (see below)
PDF compression, OCR, web optimization using a watermarked evaluation copy of CVISION PDFCompressor

FluoroMax-2 with DataMax Maintenance
Four screws securethe housing
Lamp Housing
The lamp is held in place with four thumbscrews and the anode cable is secured to the topof the lamp by a thumb wheel. (Refer to the diagram on the following page.)
To replace the lamp,
Remove the thumb wheel at the top of the xenon lamp(leaving the post exposed) and position the anode cableout of the way.
Loosen the thumbscrews at the bottom of the xenon lamp.
While holding the post at the top of the lamp, loosen thethumbscrews at the top.
Remove the lamp from the assembly.
PDF compression, OCR, web optimization using a watermarked evaluation copy of CVISION PDFCompressor

Nipple should face rear
3Loosen thumb-screws at thetop of the lam
Xenon Lamp
Insert the new lamp in the assembly with the nipple (asshow n above positioned toward the rear of the assembly.Hold new lamp by end caps only.
Tighten the thumbscrews at the base of the lamp.
Place the anode cable over the exposed post at the top ofthe xenon lamp and tighten the thumb wheel that wasremoved in step 1.
Tighten the thumbscrews at the top of the lamp until"just tight" (these thumbscrews must accommodatevertical expansion).
Replace the lamp housing cover. Do not replace theFluoroMax-2 cover until all lamp adjustments are made.
Plug in the FluoroMax-2 pow er cable and any othercables removed (i.e., RS232. Trigger).
Turn on the lamp by pressing the ST ,iRT button on theFluoroMax-2.
.1 Remove thumb
/wheel and lift offanode cable.
2 Loosenthumbscrews atthe bottom of thelamp.
Fluor°Max-2 W ith DataM axMaintenance
PDF compression, OCR, web optimization using a watermarked evaluation copy of CVISION PDFCompressor

FluoroMax-2 with DataMax Maintenance
AdjustmentAfter the new lamp has been installed, you have two options:
either allow the lamp to bum in for six hours before continuing with thefollowing adjustment procedure.
Or
proceed with the adjustment procedure immediately after lampinstallation.
Note:
If you make the lamp adjustments immediately, after awhile, the counts will be less than originally measured. Ifthis presents a problem, perform the adjustment procedureagain.
Three Allen wrenches (1/8 in., 3/16 in, and 5/32 in.) are required to make theseadjustments.
The adjustment procedure is as follows:
Insert a water-filled cuvette in the sample compartment.
Acquire a water Raman scan using standard parameters(see Chapter V).
Either
If the peak intensity at 397= is 200,000 cps or greater above background, no furtheradjustment is necessary.
Secure the lamp housing cover and replace theFluoroMax-2 co-ver.
The FluoroMax-2 is ready for operation.
PDF compression, OCR, web optimization using a watermarked evaluation copy of CVISION PDFCompressor

Or
If the intensity is less than 200,000 cps, adjustments are required. The diagram belowshows each adjustment component (identified as items E, F, and G).
Tilt andCenter
Adjustments for optimizing the lamp
During this procedure, it is necessary to monitor the signal intensity. (Press F9 to displaythe Status Window.)
Turn off room lights.
Press F7 to open the shutter.
Turn on the high voltage by pressing F10.
Insert a 1/8-inch Allen wrench in E and insert a 3/16-inchAllen wrench in both F slots.
While turning wrenches slightly, observe the signalintensity.
When the intensity is at a maximum (greater than 200,000 cps, depending onspectrometer condition), the lamp is optimized.
Remove the Allen wrenches.
9-10
EFocus
MountinglLock
LETTER QTY. STYLE ADJUSTMENT
E 1 1/8" FocusF 2 3/16" Tilt and CenterG 2 5/32" Mounting/Lock
Maintenance FluoroMax-2 with DataMax
PDF compression, OCR, web optimization using a watermarked evaluation copy of CVISION PDFCompressor
FluoroMax-2 with DataMax Maintenance
10. Using the same parameters, acquire a water Raman scanand note the intensity.
At this point, there are three options:
A. If the signal is within specifications, no further adjustments arenecessary and the FluoroMax-2 is now ready to perform.
11. Secure the illuminator housing and replace theFluoroMax-2 cover and, if necessary, the knob for themagnetic stirrer.
B. If the signal is not within specifications,
11. Continue to make adjustments to improve the signal, asdemonstrated by the water Raman scan.
12. Once the signal is within specifications, no furtheradjustments are necessary and the FluoroMax-2 is nowready to perform.
13. Secure the illuminator housing and replace theFluoroMax-2 cover and, if necessary, the knob for themagnetic stirrer.
C. If you have made the adjustments and are unable to obtain a respectablesignal, you will need to check to make sure the xenon lamp is properlyfocused on the grating.
To verify this.
11. Locate the excitation monochromator, as shown below.
9-11
PDF compression, OCR, web optimization using a watermarked evaluation copy of CVISION PDFCompressor

Maintenance FluoroMax-2 with DataMax
v., cyOverhead view of the FluoroMax-2 with cover removed
12. Remove the screws on the top of the excitationmonochromator and lift off the cover. (Note: The DM303is attached to the excitation monochromator with velcro;detach it, if necessary, to access the screvvs on themonochromator lid.)
2-77==ti
-/ LY
Overhead view of the inside of the excitation monochromator
9-12
View grating fromrear of FluoroMax-2
PDF compression, OCR, web optimization using a watermarked evaluation copy of CVISION PDFCompressor

13. Observe the image on the front of the grating.
Theoretically, the light should fill the grating surface with an even image. When thelamp is improperly focused, the image on the grating is skewed and unevenly spread overthe face of the grating.
"Best Case Scenario" "Worst Case Scenario"
Examples of image on grating surface
Continue to make adjustments to E and F on the lamphousing while viewing the image on the grating surface.
When the image is as close to the "best case scenario" as shown above,
Using the same parameters, acquire a water Raman scanand note the intensity.
Once you have verified that the signal intensity is within specifications (per the waterRaman scan). no further adjustments are necessary and the FluoroMax-2 is now ready toperform.
Replace the monochromator cover.
Secure the illuminator housing.
Replace the FluoroMax-2 cover and the knob for themagnetic stirrer (if necessary).
TheFluoroMax-2 is a single unit attached to a PC which will provide years of
reliable service with minimal maintenance. Monitoring the lamp degeneration andreplacing it at regular intervals is the only maintenance required. Perfolming a
lamp scan and a water Raman scan each time the equipment is used will provide an earlyindication of the condition of the lamp. Following the procedure outlined in this chapterwill orovide all of the information required to make a decision regarding the proper timefor lamp replacement.
FluoroMax-2 with DataMax Maintenance
PDF compression, OCR, web optimization using a watermarked evaluation copy of CVISION PDFCompressor

CHAPTER X
Troubleshooting
yourFluoroMax-2 spectrofluorometer tsystem has been designed to operate
reliably and predictably. In the unlikely event that a problem does occur,however, please follow the steps listed below. Doing this ensures that the
problem is remedied as quickly as possible.
If this is the first time the problem has occurred, try turning off thesystem and accessories, and, after a cool-down period, turningeverything back on.
Make sure all accessories attached are properly configured and, whenappropriate, turned on.
Execute a lamp scan and a water Raman scan to make sure the systemis properly calibrated. Print the spectrum for each and note the peakintensities.
Review this chapter to see if your problem is discussed.
Visit our Web Site at http://www.isainc.com/fluor to see if yourquestions are addressed in the Systems or FAQs sections of the site.
Make an attempt to duplicate the problem and write down the stepsrequired to do so. The service engineers will make an attempt to dothe same with a test system. Depending on the nature of the problem,a service visit may not be required.
If an error dialou box pops up in DataMax, write down the exact errordisplayed.
Access DataMax and from the Help/About menu at ISA Main(Instrument Control Center), locate the Version of software,
:Make a note of the instrument's serial number and instrumentconfizuration, including all accessories.
PDF compression, OCR, web optimization using a watermarked evaluation copy of CVISION PDFCompressor

Troubleshooting Fluor°Max-2 with DataMax
If the problem persists or is not listed, call our Fluorescence Service Department at (908)494-8660.
When you contact the Fluorescence Service Department, you should have the purchasedate, serial number, and system configuration available and be prepared to supply thesoftware version as well. You will be asked to describe the malfunction and yourattempts, if any, to correct it.
10-2
PDF compression, OCR, web optimization using a watermarked evaluation copy of CVISION PDFCompressor

* Voltage settings are only applicable to systems that have a programmable voltage supply
10-3
Problem Possible Cause Remedy
Light is not reaching thesample.
Shutters closed. Using the software, open the shutter.
Slits are not open to the propervvidth.
Adjust the slits.
Lamp is not tumed on Tum on lamp by pressing LAMP rocker switch and then thePOWER button on the xenon lamp power supply front panel
Caution: If the lamp is not on a separate line,turn on the lamp (and fan) before you tum on therest of the components.
150W lamp 1.200-1,500 hrs.
Second-order effects due to thespectrometer.
Use cut-on filters to eliminate second-order peak.
Scattered light off the excitationwavelength.
Decrease the emission spectrometer slit widths.
Dirty. cuvette. Clean the cuvette using the procedure described inUsing solid sample holder. Rotate the holder to prevent direct scatter from entering
emission spectrometer.
Dark count is being divided bylow reference signal.
Toggle Yes in the Auto Zero field in the Data AcquisitionParameters menu and rerun the scan.
Stirrer speed is too fast. Use a slower speed.
Stirrer bar is too large; light bearnis striking it.
Use a smaller stirrer bar; additional stirrers are availablefrom BelArt Products, Pequannock, New Jersey.
Noisy spectrum (normalintegration time used).
Sample has large particulatematter which scatters lightirreaularly.
Filter sample or let sample stand to allow particulate matterto settle.
FluoroMax-2 with DataMax Troubleshooting
PDF compression, OCR, web optimization using a watermarked evaluation copy of CVISION PDFCompressor

Troubleshooting FluoroMax-2 with DataMax
Often, the spectrum reveals information regarding the hardware or software parameterswhich should be modified. The following spectra are presented with explanationsregarding problems responsible for their appearances.
Lamp ScanRunning a lamp scan verifies system integrity and indicates whether the correctparameters for the best possible trace are being used. The following spectrum shows thetrace resulting from a lamp scan (150W) being run with a known good lamp.
I 5.000e-02
e 3.750e-02
s. 2.500e-02
Y 1.25e-0(e
s) 0.0000
t 4.473e-01e
n 3.355e-01
2.236e-01
Y 1.118e-01
0.0000s)
4-467run
The following lamp scan spectrum shows poor resolution around the peak area.
Xenon lamp peaks arenot resolved
300 400 500 600 700 800
Wavelength (mm)
This resolution problem appears as a result of the slit widths being set too wide. Toresolve this problem, simply reduce the slit widths (this improves the resolution as wellas fine structure).
300 400 500 600
Wavelength (lint)
700 800
PDF compression, OCR, web optimization using a watermarked evaluation copy of CVISION PDFCompressor

FluoroMax-2 with DataMax Troubleshooting
Water Raman SpectraRunning a water Raman scan helps identify abnormalities as a result of accessoryproblems or calibration problems. The following spectrum is a typical water Ramanspectrum.
2.200e+05
1.650e+05
1.100e+05
55000.000
0.0000380 400 420
Wavelength (nm)
The following spectrum shows a "normal' water Raman spectrum superimposed on onethat exhibits signs indicative of a problem. In this instance, the water was contaminated,thus resulting in a high background.
4.00e+05
3.00e+05
2.00e+05
1.00e+05
(cp 0.0000s)
ContaminatedWater
CleanWater
380 400 420
Wavelength (nm)
If a spectrum similar to this is obtained after running a water Raman scan,
Rotate the cuvette 90 degrees and rerun the scan.
If the problem goes away, then the problem was due to the cuvette surface. Clean or use adifferent cuvette.
Or
Clean the cuvette and fill with fresh, double-distilleddeionized water.
If the problem goes away, then the problem was due to contaminated water.
10-5
PDF compression, OCR, web optimization using a watermarked evaluation copy of CVISION PDFCompressor

The scan which follows shows the standard water Raman scan with a "problem" scan.
2.000e+05
e 1.500e+05
1.000e+05
y 50000.000
s)0.0000
6.089e+06
4.567e+06
3.044e+06
1.522e+06
0.0000
380 400 420
Wavelength (Jun)
Notice the "problem" scan shows low intensity of water signal when compared with thesuperimposed typical water Raman scan.
To resolve this problem:
I. Make sure the cuvette is filled to the proper level andlight falls on the sample. Be sure that the meniscus is notin the light path;
Make sure that the excitation and emission slits are set tothe proper widths; and
Verify that the detector is set to the proper voltage (whena programmable voltage supply is in use).
In the following diagram, notice the high stray light in the water Raman spectrum.
380 400 420
Wave le ng th (m)
To correct this problem,
I. Inspect the cuvette surface for fingerprints and scratches.Clean the cuvette or use a new one.
2. Verify that the excitation and emission slits are setcorrectly for a water Raman scan.
Troubleshooting Fluor°Max-2 with DataMax
PDF compression, OCR, web optimization using a watermarked evaluation copy of CVISION PDFCompressor

FluoroMax-2 with DataMax Troubleshooting
3. Verify that the excitation spectrometer is at the correctposition.
Thissection is provided to facilitate and guide troubleshooting efforts. Follow the
suggestions given before contacting the Fluorescence Service Department. It isimportant to be as familiar with the system's software as well as its hardware. It is
advisable to eliminate any possibility of the problem being caused by user error prior toscheduling a service visit.
PDF compression, OCR, web optimization using a watermarked evaluation copy of CVISION PDFCompressor
Important
The FluoroMax-2 spectrofluorometer system is designed to comply with therequirements of the Low Voltage Directive 73/23/EEC and the EMC Directive89/336/EEC and, as of January 1, 1997, carries the CE marking accordingly. Thesystem was tested using standard (ISA-authorized) components, cables, etc.
The details and specifications for each component of the FluoroMax-2 spectrometerfollow .
Source 150W continuous ozone-free lamp
Optics All reflective optics for focusing at allwavelengths and precise imazing formicrosamples
Dispersion 4.25nrn/rnm
Spectrometers f/3.2 plane-grating Czerny-Tumer type
CHAPTER XI
Technical Specifications
TheFluor°Max-2 can be purchased with a computer system from ISA or the
computer can be purchased from another source and the Fluor°Max-2 interfacedvia an RS232 communications link. The information which follows provides
detailed infoimation regarding the specifications of the FluoroMax-2 spectrofluorometerand recommendations for computer specifications.
FluoroMax-2The specifications listed include the standard FluoroMax-2 configuration as well as a fewof the more common options. The ISA engineers, however, are constantly working toestablish new more efficient ways to accomplish designated tasks. If you require aconfig,uration different than the standard, feel free to contact ISA and discuss yourapplication needs with a Fluorescence Instrument Product Manager.
PDF compression, OCR, web optimization using a watermarked evaluation copy of CVISION PDFCompressor

Technical Specifications FluoroMax-2 with DataMax
Excitation wavelength range 0-950nm1200 groove/mm grating optimized for330nm
Emission wavelength range 0-950nm1200 groove/mm grating optimized for500nm
Wavelength accuracy 0.5nm
Minimum step size 0.0625nm
Wavelength repeatability 0.3nm
Resolution 0.3nm
Slit settings 0-30nm continuously adjustable fromcomputer
Signal detector Standard: Side on R1527P PMT 200 -680nm response linearity to 2 x 10⁶ cpsLess than 100 dark counts/secondOptional: Side on R928P PMT 180 -850= response linearity to 2 x 10⁵ cpsLess than 1000 dark counts/second
Reference detector Photodiode 200-980= range selected forstability
Sensitivity (water Raman signal) 200.000 cps at 397nm peak Ex = 350nmBandpass = 5nmIntegration Time = 1 sec
Signal-to-Noise Ratio A minimum of 2,000:1(signal-to-background noise)
High Voltage (Signal detector)
11-2
Either preset (standard) or programmable(option) voltage supplies are available.Programmable voltage supplies arenormally optimized at:
950V for R928P1,050V for 1527P
Preset supplies are set at the factory andcannot be reset by the customer.
PDF compression, OCR, web optimization using a watermarked evaluation copy of CVISION PDFCompressor

FluoroMax-2 with DataMax Technical Specifications
Display update Adjustable 0.1 sec to 160 seconds
Excitation shutter (standard) Computer-controlled
Integration time 1 msec to 160 sec
Step size 0.0625 - 100nm
Maximum Scan Speed 200nm/sec
Dimensions - FluoroMax-2 34.5 x 10.25 x 27 in. (w x h x d)88 x 26 x 69 cm (w x h x d)
Dimensions Sample compartment 6.5 x 10.25 x 10 in. (w x h x d)16.5 x 26 x 25.4 cm (w x h x d)
Weight 145 lbs (65 kg)
Ambient temperature range 15-30 C
Relative humidity maximum 75%
Power requirements 5 amps at 120V25 amps at 240V50/60 Hz single phase
PDF compression, OCR, web optimization using a watermarked evaluation copy of CVISION PDFCompressor

Technical Specifications FluoroMax-2 with DataMax
The areas of the unit that may be considered hazardous if proper precautions are not
taken, as outlined in this manual. are identified with a
symbol. These areas are shown below.
Outside of Unit
Electrocution Hazard
Electrocution Hvarcl
Exercise ALXenon Larnp Precautionsilas outlined in this manual)
FluoroMax-2 Left Side (facing unit)
Fluorolifax-2
Inside (Top) of Unit
11-4
FluoroMax-2 Rear
FluoroMax-2 Front
FluoroMax-2 with Coer Removed (facin2 unit)
PDF compression, OCR, web optimization using a watermarked evaluation copy of CVISION PDFCompressor
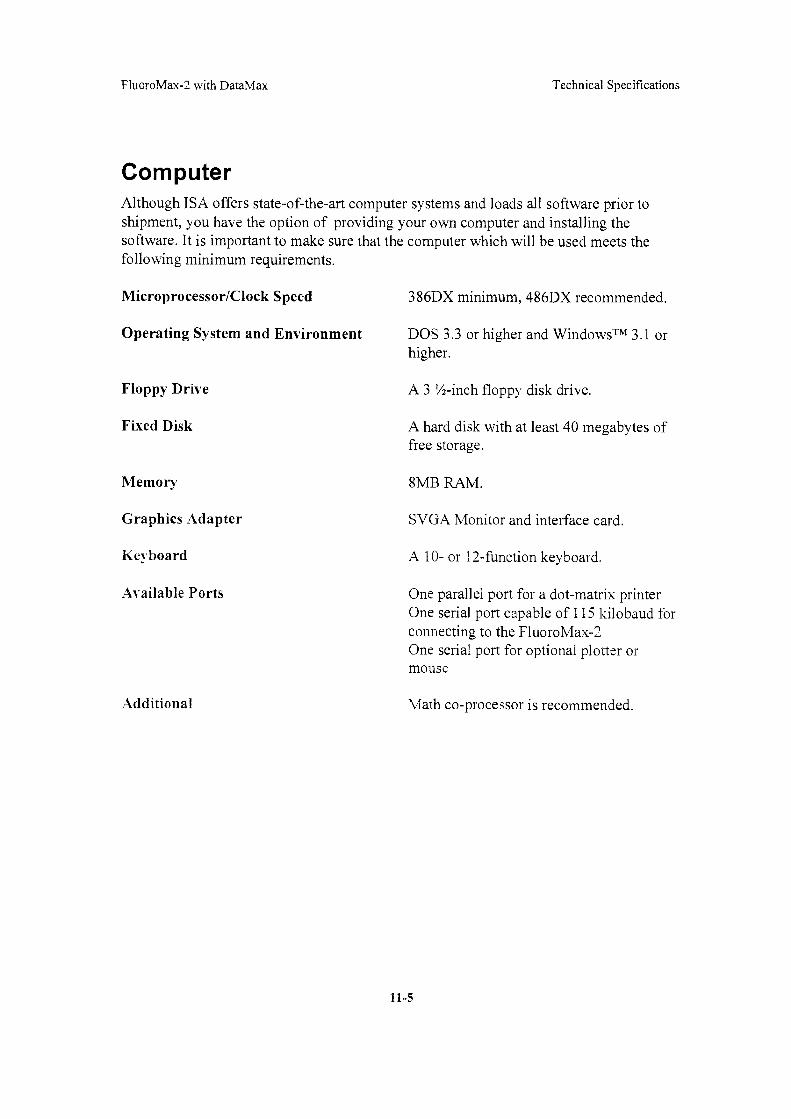
FluoroMax-2 with DataMax Technical Specifications
COMPUterAlthough ISA offers state-of-the-art computer systems and loads all software prior toshipment, you have the option of providing your own computer and installing thesoftware. It is important to make sure that the computer which will be used meets thefollowing minimum requirements.
Microprocessor/Clock Speed 386DX minimum, 486DX recommended.
Operating System and Environment DOS 3.3 or higher and WindowsTM 3.1 orhigher.
Floppy Drive A 3 1A-inch floppy disk drive.
Fixed Disk A hard disk with at least 40 megabytes offree storage.
Memory 8MB RAM.
Graphics Adapter SVGA Monitor and interface card.
Ke board A 10- or 12-function keyboard.
_Available Ports One parallel port for a dot-matrix printerOne serial port capable of 115 kilobaud forconnecting to the FluoroMax-2One serial port for optional plotter ormouse
Additional Math co-processor is recommended.
PDF compression, OCR, web optimization using a watermarked evaluation copy of CVISION PDFCompressor

APPENDIX A
Bibliography
PDF compression, OCR, web optimization using a watermarked evaluation copy of CVISION PDFCompressor

APPENDIX A
BibliographyHandbook of Fluorescence Spectra in Aromatic MoleculesBerlman, 1.B., Academic PressNew York, Vol. 1 (1965), Vol 11 (1971).
Theory and Interpretation of Fluorescence and PhosphorescenceBecker R., Wiley-Interscience (1969).
Biochemical Fluorescence: Concepts, Vol. 1Chen. R.F., et al. 408 (1965).
Biochemical Fluorescence: Concepts, Vol. HChen. R.F., et al. M. Dekker. New York (1970) 535 pp.
Fluorescence, Theory, Instrumentation and PracticeGuilbault. G.G.. editor Marcel Dekker, Inc., New York (1976).
Molecular Fluorescence SpectroscopyGuilbault, G.G., Cooper Anal. Chem. 8 71-205, (1977),Svehlag. Ed: Elsevier.
Practical Fluorescence: Theory, Methods and TechniquesGuilbault. G.G.. Marcel Dekker (1973).
Fluorescence and Phosphorescence AnalysisHercules, D.M., Editor Wiley-Interscience PublishersNew York, London, Sydney (1965).
The Luminescence of Biological SystemsJohnson, F.H., Amer. Assoc. Adv. Sci.Washington. D.C. (1955).
Fluorescence and Phosphorescence of Proteins and Nucleic AcidsKoney, S.U. Plenum PressNew York (1967).
PDF compression, OCR, web optimization using a watermarked evaluation copy of CVISION PDFCompressor

Bibliography FluoroMax-2 with DataMax
Fluorometric AnalysisKonstantinova-Schlezinger, M.A., Editor, Davis Publishing Co.New York (1965).
Nomenclature, Symbols, Units and Their Usage in SpectrochemicalAnalysis-VI Molecular Luminescence SpectroscopyMelhuish, W.H., Zander, M., Pure App. Chem. 53 1953 1981
Standardization & Fluorescence SpectrometryMiller, G.N., Ed; Chapman and Hall, 1981.
Luminescence of Organic SubstancesSchmillen, A., et alHellwege Verlag, Berlin (1967).
Modem Fluorescence SpectroscopyWehry, E.L., Ed; Plenum Press, New York (1976), Vol. 1 238 pp.
Modem Fluorescence SpectroscopyWehry, E.L., Ed; Plenum PressNew Yrok (1976), Vol II 459 p9.
Fluorescence Analysis: A Practical ApproachWhile, C.E., et al. Marcel Dekker (1970).
Luminescence Spectrometry in Analytical ChemistryWinefordner, J.D., et al, Wiley-Interscience PublishersNew York (1972).
Multifrequency Phase and Modulation FluorometryEnrico Grafton, David M. Jameson, Robert D. Hall,Ann. Rev. Biophys. Bioeng. 1984, 13, 105-124.
Recent Developments in Frequency-Domain FluorometryJoseph R. Lakowicz, Badri P. Melinal, Enrico Gratton.Analytical Instrumentation, 14(314), 193-223, 1985.
Excited State Lifetime MeasurementsJ.N. Demas. Academic PressNew York, 1983.
Advances in Multidimensional Luminescenceedited by Isiah M. \Varner and Linda B. McGowan. Jai PressFreenwich, Connecticut, 1991.
A-2
PDF compression, OCR, web optimization using a watermarked evaluation copy of CVISION PDFCompressor

FluoroMax-2 with DataMax Bibliography
Topics in Fluorescence Spectroscopyedited by Joseph R. Lakowicz. Plenum PressNew York, 1991.
Fluorescent and Lurninescent Probes for Biological Activity. A PracticalGuide to Technology for Quantitave Real-Time Analysis. edited by W.T.Mason. Academic Press-Harcourt Brace & Company.
A-3
PDF compression, OCR, web optimization using a watermarked evaluation copy of CVISION PDFCompressor

Bibliography FluoroMax-2 with DataMax
A-4
PDF compression, OCR, web optimization using a watermarked evaluation copy of CVISION PDFCompressor

APPENDIX B
Glossary
PDF compression, OCR, web optimization using a watermarked evaluation copy of CVISION PDFCompressor
Absorption
Absorbance
Bandpass
Bandpass Filter
Bioluminescence
APPENDIX B
Glossary3D Excitation/
Emission Display This maps a specified emission scan wavelength rangeusing various excitation wavelengths.
3D Synchronous/Offset scan A scan type vvhich maps a specified synchronous scan
using various offset wavelengths between thespectrometers.
Transition from the ground state to the excited singlet state.This process typically occurs on time scales of 10-15seconds.
A quantity defining the extent of absorption by a substance.Absorbance is expressed as -log T where T is thetransmittance of the sample. Absorbance is alsosynonymous with optical density (od) where
OD = e( )cxco ) = the extinction coefficient (M-1 cm-1)e = sample concentration (M)x = path length (cm)
The spread of light passing through the excitation andemission spectrometers. The wider the bandpass the higherthe siznal intensity.
Optical element which selectively transmits a narrawwavelength range of light.
Emission of light originating from a chemical reactiontaking place in a living organism.
PDF compression, OCR, web optimization using a watermarked evaluation copy of CVISION PDFCompressor

Blaze wavelength(of gratings)
Chemiluminescence
Color effect forpulse technique
Color effect for phase-modulation technique
Corrected Emission Scan
Corrected Excitation Scan
Correction Factors
Wavelength at which a grating is optimized for efficiency.Generally, the gratings are efficient to 2/3 before the blazewavelength to 2 times beyond the blaze wavelength. Theexcitation and emission gratings are blazed in the UV andvisible respectively.
Emission of light originating from a chemical reaction.
Time-dependent distribution of the lamp pulse
Phase of the excitation and the degree to which it is
modulated.
An emission scan corrected for the wavelengthcharacteristics of the emission spectrometer and theresponse of the signal detector. To obtain a correctedemission scan, an emission spectrum is multiplied by theemission correction factors. A set of emission correctionfactors is supplied with your instrument and stored underthe name MCORRECT.SPT on the software disks.
An excitation scan corrected for the wavelengthcharacteristics of the xenon lamp, the aging of the xenonlamp, and the gratings in the excitation spectrometer. Toobtain a corrected excitation scan, the detector signal isratioed to the reference signal which provides 95% of thecorrection. To obtain a completely correct scan, theexcitation scan acquired in the s/r acquisition mode ismultiplied by excitation correction factors. A set ofexcitation correction factors (XCORRECT.SPT) is includedon the software disks.
Used to compensate for the wavelength-dependentcomponents of the system, like the xenon lamp, gratings,and signal detector. Emission and excitation correctionfactors are included with the software and are titledXCORRECT.SPT and MCORRECT.SPT.
Glossary FluoroMax-2 with DataMax
Cut-on filter Optical component which passes light of a higherwavelength.
PDF compression, OCR, web optimization using a watermarked evaluation copy of CVISION PDFCompressor
Fluorescence lifetime The average length of time that a molecule remains in theexcited state before returning to the ground state.
FluoroMax-2 with DataMax Glossary
Cut-off filter Optical component which passes light of a lowerwavelength.
Dark counts Inherent background signal of the photomultiplier whenhigh voltage is applied. Cooling the detector decreases thedark current.
Demodulation (less modulated). Usually refers to the demodulatedemission relative to the excitation.
Demodulation Factor Can be calculated using the following equation:
[m = (Ba/bA)]
Emission scan Shows the spectral distribution of light emitted by thesample. During an emission scan, the excitationspectrometer remains at a fixed wavelength while theemission spectrometer scans a selected region.
Energy transfer The transfer of the excited energy from a donor to anacceptor. The transfer occurs without the appearance of aphoton and is primarily a result of dipole-dipoleinteractions between the donor and acceptor.
Excitation scan Shows the spectral distribution of light absorbed by thesample. To acquire an excitation scan, the excitationspectrum scans a selected spectral region while theemission spectrum remains at a fixed wavelength.
Extrinsic fluorescence Inherent fluorescence of probes used to study non-fluorescent molecules.
Flash lamp A lamp which provides pulsed light output used to excite asample. Can be either "free running" or "gated".
Fluorescence The emission of light or other electromagnetic radiationduring the transition of electrons from the excited singletstate to the ground state. Fluorescence typically occurs onthe time scale of 10-9 seconds.
PDF compression, OCR, web optimization using a watermarked evaluation copy of CVISION PDFCompressor

Glossary FluoroMax-2 with DataMax
Phosphorescence The emission of light or other electromagnetic radiationduring the transition of electrons from the triplet state to theground state. Phosphorescence is generally red-shiftedrelative to fluorescence and occurs on time scales rangingfrom 10°6 to several seconds. To enhance phosphorescencedetection, samples are often frozen at liquid nitrogentemperature.
Front-face detection A mode of detection in which fluorescence is collectedfrom the front surface of the sample. Front face detection isusually selected for samples such as powders, thin films,pellets, cells on a coverslip and solids.
Grating Optical element in the spectrometer which disperses thewhite light into a spectrum.
Intrinsic fluorescence The natural fluorescent properties of molecules.
Laser A monochromatic light source which provides highexcitation intensity.
Mercury lamp Light source which offers discrete narrow lines as opposedto a continuum. A mercury lamp can be used to check thespectrometer calibration.
Mirror Image Rule When the emission profile appears to be the mirror imageof the absorption spectrum.
Modulated light Light which travels in a sinusoidal manner with a specifiedfrequency.
Optical density effects Fluorescence intensities are proportional to theconcentration over a limited range of optical densities. Highoptical densities can distort the emission spectra as well asthe apparent intensities.
Phase angle The delayed relationship between the modulated emissionrelative to the excitation.
Phase modulation method A technique for measuring fluorescence lifetimes where asample is excited with light whose intensity is modulatedsinusoidally. The emission is a forced response to theexcitation.
PDF compression, OCR, web optimization using a watermarked evaluation copy of CVISION PDFCompressor

Pockels cell
Pulse sampling method
Raman scattering
Rayleigh scattering
Rayleigh-1) ndallscattering
Red-SensitivePhc omultiplier
Reference photodiode
Resolution
Right angle detection
A light modulator that transmits ultraviolet and visible lightwhich can be operated at variable frequencies. Highlycollimated excitation light is required to obtain a goodmodulation.
A technique for measuring fluorescence lifetimes where aninitial population of fluorophores are excited by infinitelyshort pulses of light. An advantage of this technique is thedirect recording of time-resolved emission spectra.
Scattering caused by vibrational and rotational transitions.Raman bands generally appear red-shifted relative to theincident electromagnetic radiation. The primarycharacteristic of Raman scatter is that the difference inenergy between the Raman peak and the incident radiationis constant in energy units (cm-l)
Light scattering from such particles as atoms or smallmolecules whose dimensions are much smaller than thewavelength of incident light. Scattered light is of the sameenergy as the incident light. The characteristics of Rayleighscatter is that the scatter radiation intensity is inverselyproportional to the 4th povver of the wavelength of incidentradiation.
Combination of Rayleig,h and Tyndall scatter. These twoscattering phenomena cannot be separated so that if themolecule's Stokes shift is small, Rayleigh-Tyndall scatterwill limit the ultimate resolution.
A detector whose wavelength response extendsfluorescence detection to 850nm.
Detector used to monitor the output of the xenon lamp.
The ability to separate two closely spaced peaks.Resolution can be improved by decreasing the bandpassand the increment (step size).
Collection of fluorescence at 90 degrees to the incidentradiation. Right angle detection is typically selected fordilute and clear solutions.
B-5
FluoroMax-2 with DataMax Glossary
PDF compression, OCR, web optimization using a watermarked evaluation copy of CVISION PDFCompressor

Singlet state
Spectrometer
Stokes shift
Synchronous scan
Time-base scan
Time-ResolvedEmission Scan
The spin paired ground or excited state. The process ofabsorption generally produces the first excited singlet statevvhich gives time to fluorescence and can undergointersystem crossing to form a triplet state.
The component in a fluorometer system which is scannedto provide the excitation and emission spectra. Thespectrometer is selected for performance related to lowstray light, resolution and throughput.
Generally, it is quantified as the energy difference betweenthe absorption peak of lowest energy and the fluorescencepeak of maximum energy.
Scan type which characterizes the overlap between theexcitation and emission. The excitation and emissionspectrometers are scanned at the same time with a constantoffset specified in either nanometers (wavelength units) orin cm-1 (energy units).
Scan type in which the sample signal is monitored as afunction of time while both the excitation and the emissionspectrometers remain at fixed wavelengths. Time base datais selected to monitor enzyme kinetics, dual wavelengthmeasurements and determine reaction rate constant.
Scan type in which the emission spectra are acquired atvarious times after the excitation pulse. Provides insightinto excited state reactions, charge transfer-complexformations, solvent dipolar relaxation and otherexperiments.
Glossary FluoroMax-2 with DataMax
Scatter A combination of Raman, Rayleigh and Rayleigh-Tyndallscattering that can distort fluorescence spectra with respectto intensities and wavelengths.
Signal photomultiplier Detector used to measure excitation and fluorescence fromthe sample. This is operated in the photon-counting modeof detection to provide the highest sensitivity. Differentdetectors can be used to optimize different wavelengthregions.
PDF compression, OCR, web optimization using a watermarked evaluation copy of CVISION PDFCompressor

Triplet state (Ti)
Tyndall scattering
Xenon lamp
Xenon lamp scan
The spin paired ground or excited state that is formed fromthe excited singlet state when paired electrons becomeunpaired. The triplet state gives rise to phosphorescence.
Scatter which occurs from small particles in colloidalsuspensions.
Lamp which produces a continuum of light from theultraviolet to the near infrared for sample excitation.
A profile of the lamp output as a fiinction of wavelength.The lamp scan is acquired using the reference detectorwhile scanning the excitation spectrometer. The maximumxenon lamp peak at 467nm can be used to determine propercalibration of the excitation spectrometer.
FluoroMax-2 with DataMax Glossary
PDF compression, OCR, web optimization using a watermarked evaluation copy of CVISION PDFCompressor

APPENDIX C
Xenon LampTracking Form
PDF compression, OCR, web optimization using a watermarked evaluation copy of CVISION PDFCompressor

Xenon Lamp Tracking FormPage of
In ServiceDate Operator
CurrentDate
TimeOn
TimeOff
Total Time(Hours/IVIin.)
/ / // / // / // / // / // / // / /II // / // / //1 // / // / /
/ / /II // // / // / // /
/ // // / // // / // / // // / // / /II/ / /
- ---,,m- Total Hours /
PDF compression, OCR, web optimization using a watermarked evaluation copy of CVISION PDFCompressor

ACCESSORY
150W Xenon Lamp, 8-12Cell Holder, 8-9Coverslip (Monolayer) Holder, 8- 9Cut-on Filter, 8-7Cut-On Filter Holder, 8-8Cuvette, Capped, 8-5Cuvette, Stoppered, 8-6External Trigger Accessory, 8-4Fiber Optic Bundle, 1 Meter, 8-6Fiber Optic Bundle. 2 Meters, 8-6Fiber Optic Bundle. 5 Meters. 8-7Fiber Optic Platform, 8-7Filter Set Kit, 8-8Flow Cell. 8-5Four Position Thermostatted Cell Holder, 8-8Injection Port, 8-11Liquid Nitrogen Dewar Assembly, 8-6Micro Cell (v.ith Model 1923A Adapter). 8-4Micro Cell (with Model 1924A Adapter). 8-5Model 1923A Adapter. 8-4N1odel 1924A Adapter. 8-5Photomultiplier. 8-12Polarizer
Auto Polarizer Assembly, 8-13L-Format Polarizer, 8-13
Polarizers (General Information). 8-12Reduced Volume Sample Cell, 8-5Shutter, Computer Controlled Emission. 8-14Single -Position Thermostatted Cell Holder, 8-10Solid Sample Holder. 8-9
ACQUISITION
Data. 5-1
BANDPASS, 3-3. 6-3
INDEX
CALIBRATIONDefault Experiments, 4-2Emission Spectrometer, 5-4Excitation Spectrometer, 5-2FluoroMax-2, 4-2User-Specified Parameters, 4-7
CELLFlow, 8-5Micro, 8-4Reduced-Volume, 8-5
CELL HOLDER, 8-8, 8-9, 8-10CLEANING CUVETTES, 6-5COLLECTION METHOD
Front-Face. 6-5Right-Angle, 6-5
CORRECTION FACTORS, 7-1DM3000F Conversion. 7-2Emission, 7-4Excitation, 7-13User-Generated. 7-4
COVERSLIP (MONOLA1 ER) HOLDER, 8-9CUT-ON FILTER, 8-7Cur-ON FILTER HOLDER, 8-8CUVETTE
Capped. 8-5Cleaning. 6-5Stoppered, 8-6
DATA ACQUISITION, 5-1DEWAR, 8-6DISPERSION, 3-3, 6-3
FACTORS, CORRECTION, 7-1
FIBER OPTIC BUNDLE, 8-6FIBER OPTIC PLATFORM, 8-7
FILTER, SET KIT, 8-8FRONT-FACE COLLECTION, 6-5
PDF compression, OCR, web optimization using a watermarked evaluation copy of CVISION PDFCompressor

Index FluoroMax-2 with DM3000F
HAZARDS, 1-2
HIGH BACKGROUND, 10-5
IMPORTANT, 1-2
INJECTION PORT, 8-11INSTALLATION
Computer. 2-5FluoroMax-2, 2-3Software, 2-7
INTERFACE
System, 2-7
LAmP,8-12, 9-1Low INTENSITY, 10-6
MAINTENANCE , 9- 1
Lamp, 9-1Replacement. 9- 1
oOPTIMIZING
Data. 6-1OPTIMUM
Emission Wavelength, 5-7Excitation Wavelength, 5-8integration Time, 6-2Voltage: 6-6
LP JPHOTONILLTIPLIER, 8-12POLARIZER
Automated, 8-13Manual. 8-13
Pool& RESOLUTION, 10- 4
II
RATIO, SIGNAL-TO-NOISE, 6-1REQUIREMENTS
Electrical, 2-1Environment, 2-1
RIGHT-ANGLE COLLECTION METHOD, 6-5
1111111111111
SAMPLE
Holder, 8- 9Preparation, 6-4-6-5Running, an Unknown, 5-6
SCANNING, MULTIPLE TIMES, 6-3SHUTTER, EMISSION, 8-14
S1GNAL-TO-NOISE RATIO, 6-1
SMOOTHING, 6-3SOFTWARE
Overview, 3-4SPECTROMETER
Emission. Calibration, 5-4Excitation, Calibration, 5-2
SPECTRUM
Water Raman. 5-4Xenon Lamp, 5-1
SUPPORT
Technical, 1-4, 10-SYSTEM
Description, 3- 1Interface, 2-7Po w er-up, 4-1
TECHNICAL SPECIFICATIONSComputer, 11-5FluoroMax-2, 11-1
TECHNICAL SUPPORT , 1-4
TRIGGER, EXTERNAL, 8-4TROUBLESHOOTING, 10-1
High Back2round, 10-5Low Intensity. 10-6Poor Resolution. 10-4
VOLTAGE, OPTIMUM, 6- 6VOLTAGE, PLATEAU, 6-6
vj
M
JI
PDF compression, OCR, web optimization using a watermarked evaluation copy of CVISION PDFCompressor

Fluor°Max-2 with DM3000F Index
WARNINGS, 1-2WAVELENGTHS
Optimal, Determining, 5-6WEB SITE, 1-4, 10-1
XENON LAMPSpectrum, 5-1
PDF compression, OCR, web optimization using a watermarked evaluation copy of CVISION PDFCompressor

Index FluoroMax-2 with DM3000F
iv
PDF compression, OCR, web optimization using a watermarked evaluation copy of CVISION PDFCompressor